Article

Wool-Based Carbon Fiber/MoS2 Composite Prepared by Low-Temperature Catalytic Hydrothermal Method and Its Application in the Field of Gas Sensors

1
Xinjiang Key Laboratory of Solid State Physics and Devices, Xinjiang University, Urumqi 830046, China
2
School of Physics Science and Technology, Xinjiang University, Urumqi 830046, China
3
Key Laboratory of New Energy and Materials Research, Xinjiang Institute of Engineering, Urumqi 830023, China
*
Author to whom correspondence should be addressed.
Nanomaterials 2022, 12(7), 1105; https://doi.org/10.3390/nano12071105
Submission received: 7 February 2022 / Revised: 19 March 2022 / Accepted: 20 March 2022 / Published: 28 March 2022

Abstract

:
Under the background of the Paris Agreement on reducing greenhouse gases, waste wools were converted into wool carbon fiber (WCF) and WCF–MoS2 composites by low-temperature catalytic hydrothermal carbonization. Their structures and gas-sensing performances were studied for the first time. Due to the existence of heterojunctions, the responses of the WCF–MoS2 composite to the five analytes were 3–400 times those of MoS2 and 2–11 times those of WCF. Interestingly, because of the N, P, and S elements contained in wools, the WCF prepared by the hydrothermal method was realized the doping of N, P, and S, which caused the sensing curves of WCF to have different shapes for different analytes. This characteristic was also well demonstrated by the WCF–MoS2 composite, which inspired us to realize the discriminative detection only by a single WCF–MoS2 sensor and image recognition technology. What’s more, the WCF–MoS2 composite also showed a high sensitivity, a high selectivity, and a rapid response to NH3. The response time and the recovery time to 3 ppm NH3 were about 16 and 5 s, respectively. The detection of limit of WCF–MoS2 for NH3 was 19.1 ppb. This work provides a new idea for the development of sensors and the resource utilization of wool waste.

Graphical Abstract

1. Introduction

Since the Paris Agreement aims to limit the rise in global temperature to less than 2 °C, governments have set their own policies to reduce greenhouse gases [1,2]. However, many difficulties still need to be overcome to achieve the goals of the Paris Agreement. We need to consider not only the fossil fuels consumed by economic development, but also more than 100 billion tons of biological waste that we process every year [3,4,5]. The main component of biomass waste, such as plant straw and waste wool, is generally carbon. The general treatment methods for biomass waste, such as incineration and landfilling, produce carbon dioxide or methane gas, accelerating the rise in global temperature [6,7]. Even if biomass waste is processed into feeds and fertilizers, these feeds and fertilizers will eventually return to the atmosphere in the form of carbon dioxide after being consumed by animals and plants [2,8,9]. Therefore, there is an urgent need for new methods and technologies to deal with biomass waste and prevent or reduce the carbon in biomass from returning to the atmosphere in the form of carbon dioxide or methane.
Take wool as an example. There are more than four million tons of waste wool clothes, inferior wool, and wool byproducts from textile mills that are not available every year [10,11]. The main component of wool is keratin, which is mainly composed of C, H, O, N, S, and P elements, of which the content of C accounts for about 50% [12,13]. From the perspective of reducing greenhouse gas emissions, converting organic biomass carbon into inorganic biomass carbon materials (BCMs) through hydrothermal carbonization or direct carbonization is a feasible strategy [4,5,14]. On the one hand, as semiconductor materials, BCMs have attracted more and more attention because of their rich raw materials, diverse morphology, adjustable properties, good stability, and low price [6,14,15]. On the other hand, either direct carbonization or hydrothermal carbonization can convert biomass waste into solid inorganic BCMs that can be stored for a long time [4,5,16]. This transformation not only is convenient and economically feasible, but can also effectively prevent the carbon in biomass from returning to the atmospheric environment in the form of greenhouse gas [4,16,17]. Therefore, BCMs have developed rapidly in recent years and have been applied more and more to the fields of energy storage, electromagnetic shielding, carbon dioxide adsorption, oil–water separation, gas sensing, etc. [6,18,19,20]. Generally, the temperature of direct carbonization is 500–1000 °C, while the common temperature of hydrothermal carbonization is 180–250 °C [14,17]. Generally speaking, biomass wastes are rich in functional groups. However, due to the high temperature of direct carbonization, there are very few functional groups on the surface of BCMs prepared by direct carbonization [6]. In sharp contrast, due to the lower temperature of hydrothermal carbonization, BCMs prepared by hydrothermal carbonization have rich functional groups, which play an important role in the fields of energy storage, gas adsorption, and gas sensing [6,21]. In addition, in order to prevent the oxidation of biomass and improve the carbon yield, the preparation of BCMs by direct carbonization often needs to be carried out in a vacuum environment or under the protection of inert gas [6,22]. From here, we see that hydrothermal carbonization has the advantages of rich functional groups, low temperature, low power consumption, and simple equipment. Furthermore, hydrothermal carbonization is also convenient for adding a catalyst in an aqueous medium, which can not only promote the carbonization of biomass at a low temperature but achieve the doping of BCMs [14,23]. These characteristics of hydrothermal carbonization are very favorable for transforming biomass waste into solid inorganic BCMs with low power consumption and regulating properties.
Herein, in order to prevent the carbon in waste wool from returning to the atmospheric environment in the form of greenhouse gas as well as realizing its resourceful utilization, we creatively used waste wool as a carbon source and a MoS2 precursor as a catalyst to prepare wool-based carbon fiber (WCF)–MoS2 composites by low-temperature hydrothermal carbonization. Meanwhile, trace elements in wool, such as N, S, and P, were used to realize the atomic doping of WCF, so as to adjust its structure and properties. Then, a WCF–MoS2 composite with heterojunctions was prepared as a gas sensor for the first time, and its potential as a gas-sensing material was studied by comparing the gas-sensing properties of the WCF–MoS2 composite with those of MoS2 and WCF. In addition, we also analyzed the effect of catalytic hydrothermal carbonization on the microstructure of wool, in order to provide a useful reference for the hydrothermal carbonization of other wool analogues. This is the first comparative study on the gas-sensitive properties of MoS2, WCF, and WCF–MoS2 composites.

2. Materials and Methods

2.1. Materials

Ammonium molybdate ((NH4)6Mo7O24·4H2O) and thiourea (CH4N2S) were analytical reagents, purchased from Sinopharm Chemical Reagent Co., Ltd. The wool came from sheep in Bole City, Xinjiang Uygur Autonomous Region, China.

2.1.1. Preparation of MoS2

Typically, 1 mmol (NH4)6Mo7O24·4H2O and 30 mmol CH4N2S were dissolved in 35 mL of deionized water and stirred vigorously to form a homogeneous solution. This solution was put into a 50 mL Teflon-lined stainless steel autoclave and maintained at 120 °C for 10 h. After the reactor was cooled to room temperature, the product was dried and labeled as MoS2.

2.1.2. Preparation of WCF and WCF–MoS2 Composites

Of the wool collected, 0.50 g was repeatedly rinsed with deionized water and ethanol, and it was placed in a 50 mL Teflon-lined stainless steel autoclave with 35 mL of deionized water and maintained at 120 °C for 10 h. After the reactor was cooled to room temperature, the product was dried and labeled as WCF. Of the wool, 0.50 g was put together with 1.15 g of (NH4)6Mo7O24·4H2O, 1.52 g of CH4N2S and 35 mL of deionized water in a 50 mL stainless steel autoclave lined with PTFE, sealed and kept at 120 °C for 10 h. After the reactor was cooled to room temperature, the product was dried and labeled as WCF–MoS2.

2.2. Device Fabrication and Testing

A certain amount of sensing material was mixed with deionized water, then ground into a paste and coated onto an interdigital electrode. Then, the interdigital electrode was dried at 25 °C and aged for 24 h with a voltage of 4 V to obtain a sensing chip with good stability. The target vapor was produced by thermal evaporation, according to Equation (1):
Q = (V × C × MW)/(22.4 × d × ρ) × 10−9 × (273 + TR)/(273 + TC),
where Q and V are the volume of the liquid to be taken and the volume of the test container, respectively; MW is the molecular weight of the substance; d is the purity of the liquid; C is the concentration of the gas to be prepared; ρ is the density of the liquid; and TR and TC are the ambient temperature and the temperature in the test container, respectively [6]. An electrochemical workstation (CIMPS-2, ZAHER EMNIOM) was used to record sensing signals at room temperature. During the gas-sensing test, a voltage of 4 V was applied to both ends of the sensing chip. The response was defined as: Response = I G I R I R × 100 % , where IR and IG are the currents of the sensor in the reference gas and target gas, respectively [24]. The response time and recovery time are defined as the response values of 90% and 10% of the current of the sensor in contact with the target gas, respectively.

2.3. Materials Characterization

The composition, structure, and morphology of samples were studied by means of field-emission scanning electron microscopy (FE-SEM; S-4800; Hitachi, Japan), mapping (Mapping; S-4800, Hitachi, Japan), XRD (Bruker D8 Advance, with Cu-Kα radiation), Raman spectroscopy (SENTERRA Compact Raman Microscope, Instrument: LabRAM HR Evol, Acq; time: 180 s, laser: 785 nm_Edge, objective: ×10_VIS, range (cm−1): 100–3200), and XPS (USA Thermo Fisher-Thermo SCIENTIFIC ESCALAB 250Xi, MA, Massachusetts, USA). The band structure and surface functional groups of samples were measured by ultraviolet photoelectron spectroscopy (UPS; USA Thermo Fisher-Thermo Fisher Nexsa, MA, USA) and FT-IR (Bruker VERTEX70, Germany 4.0 cm−1 SCANS 200, KA, Karlsruhe, Germany).

3. Results and Discussion

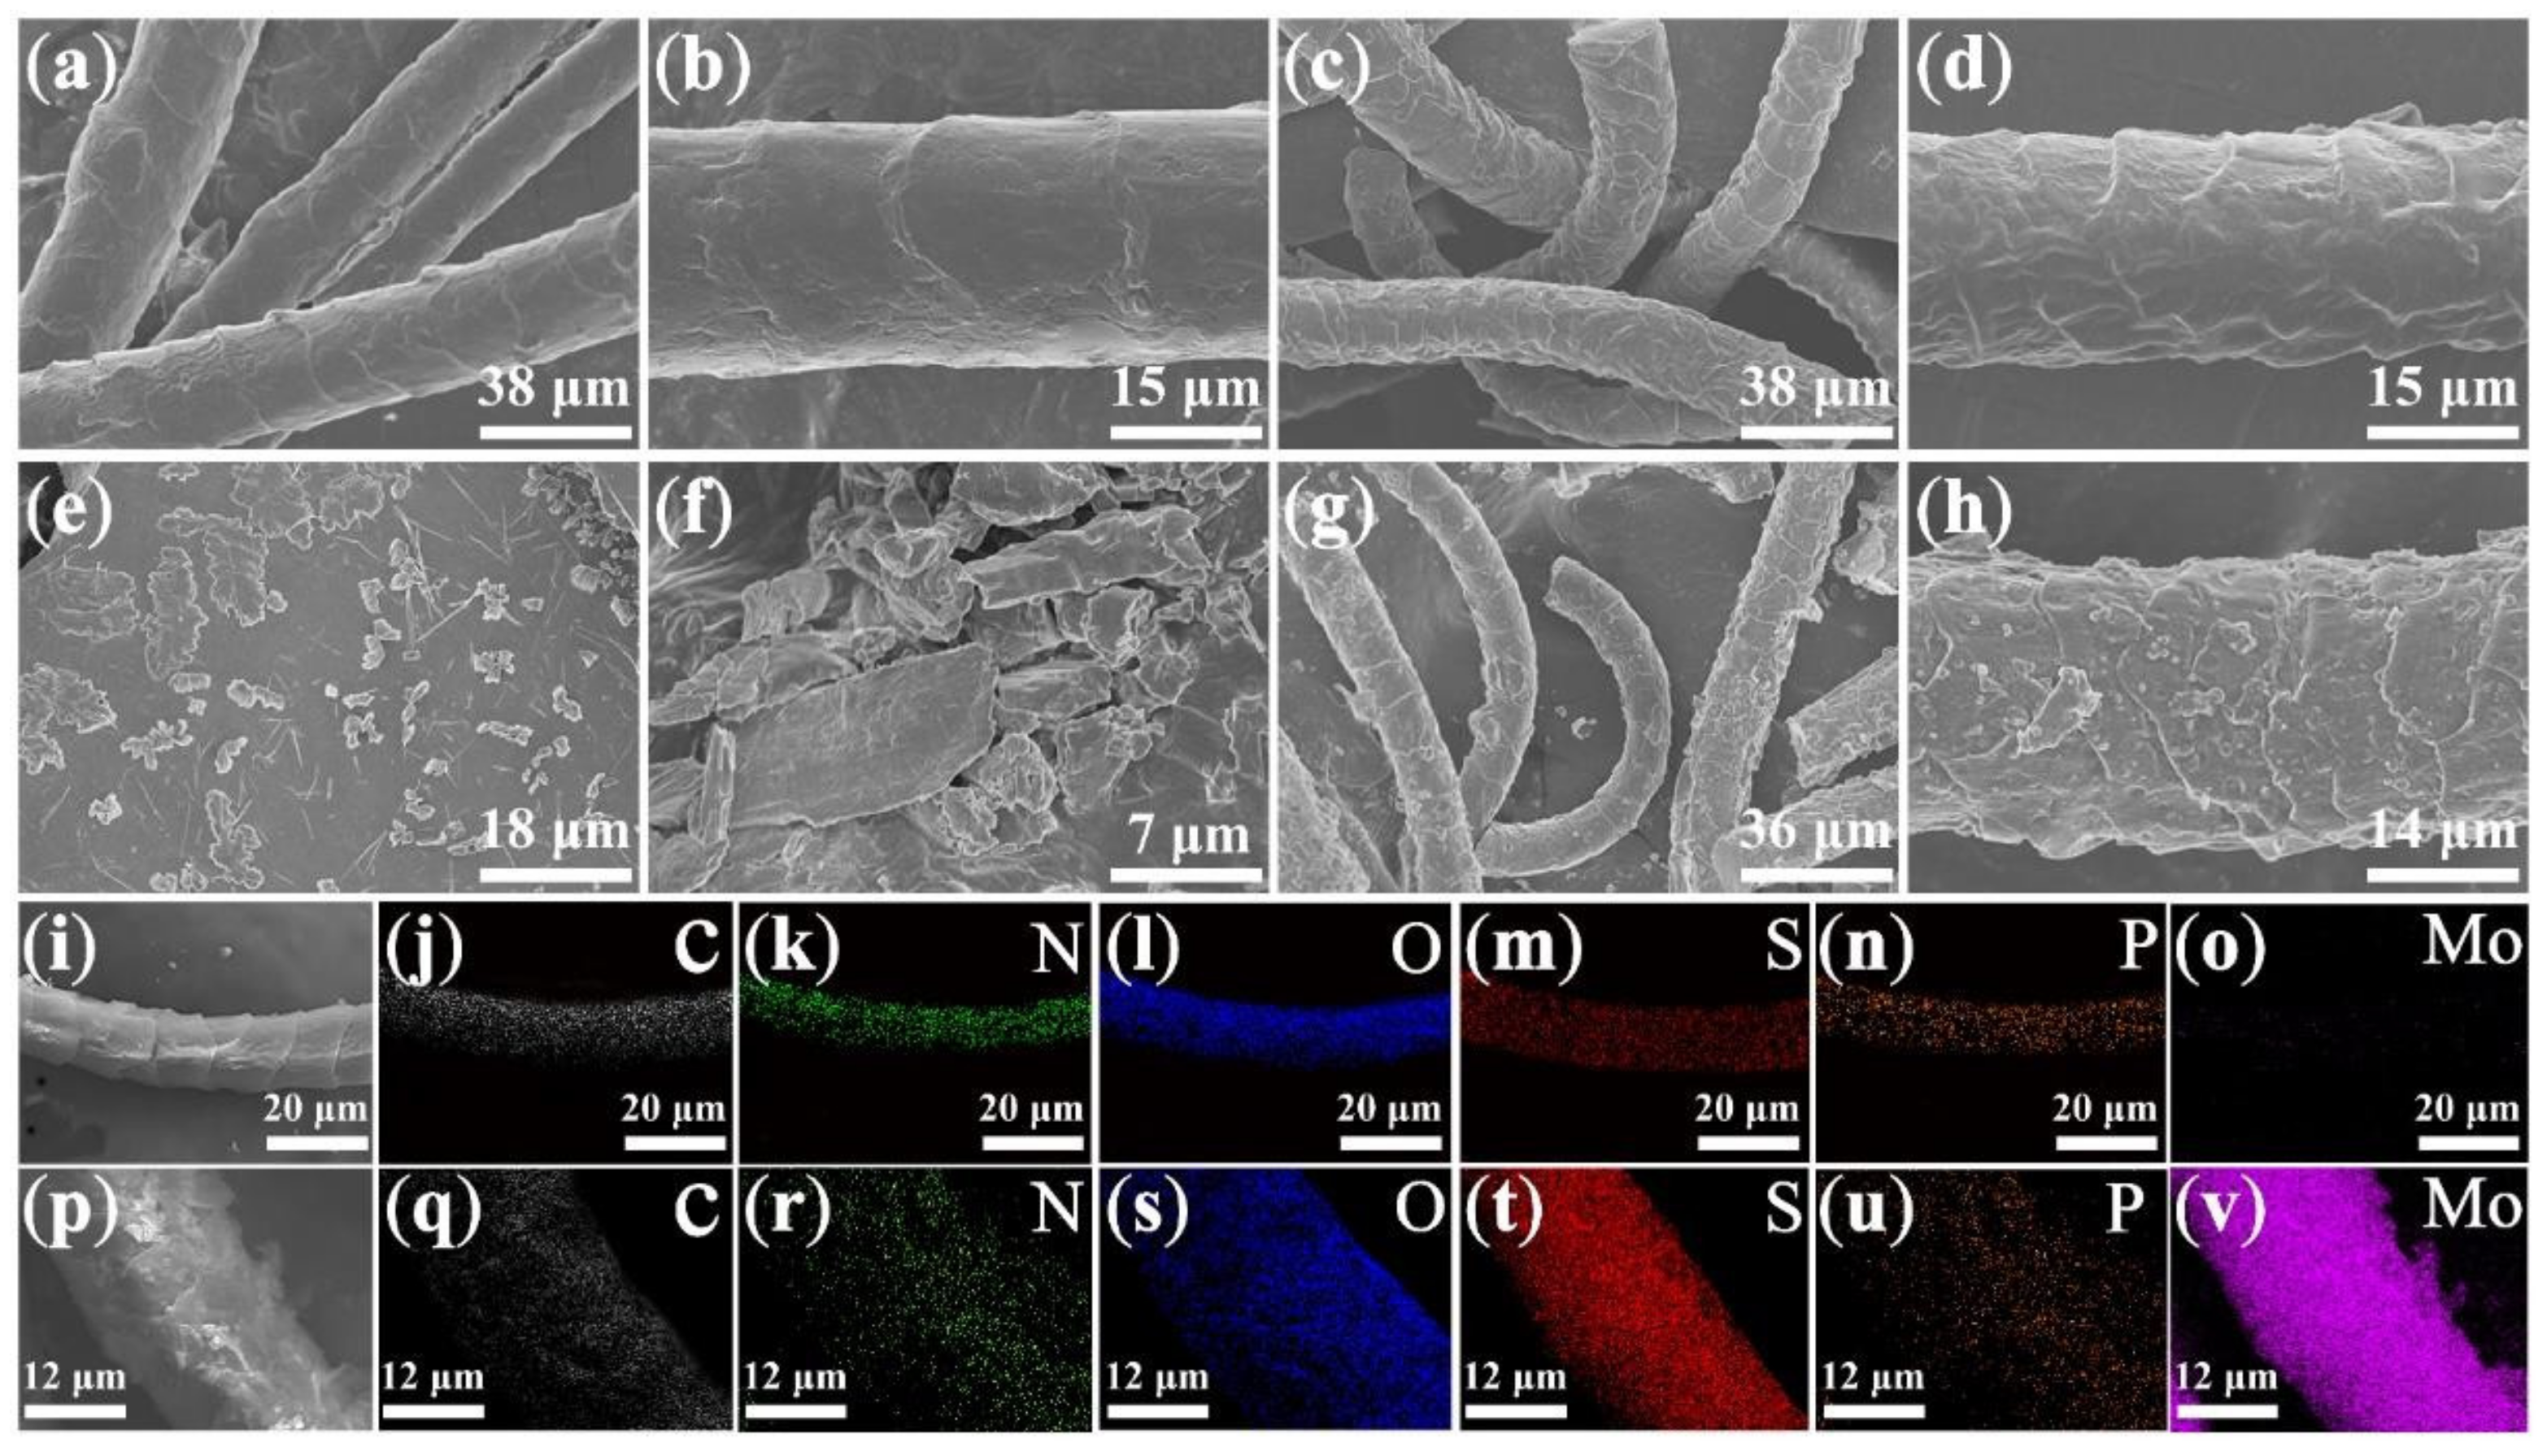
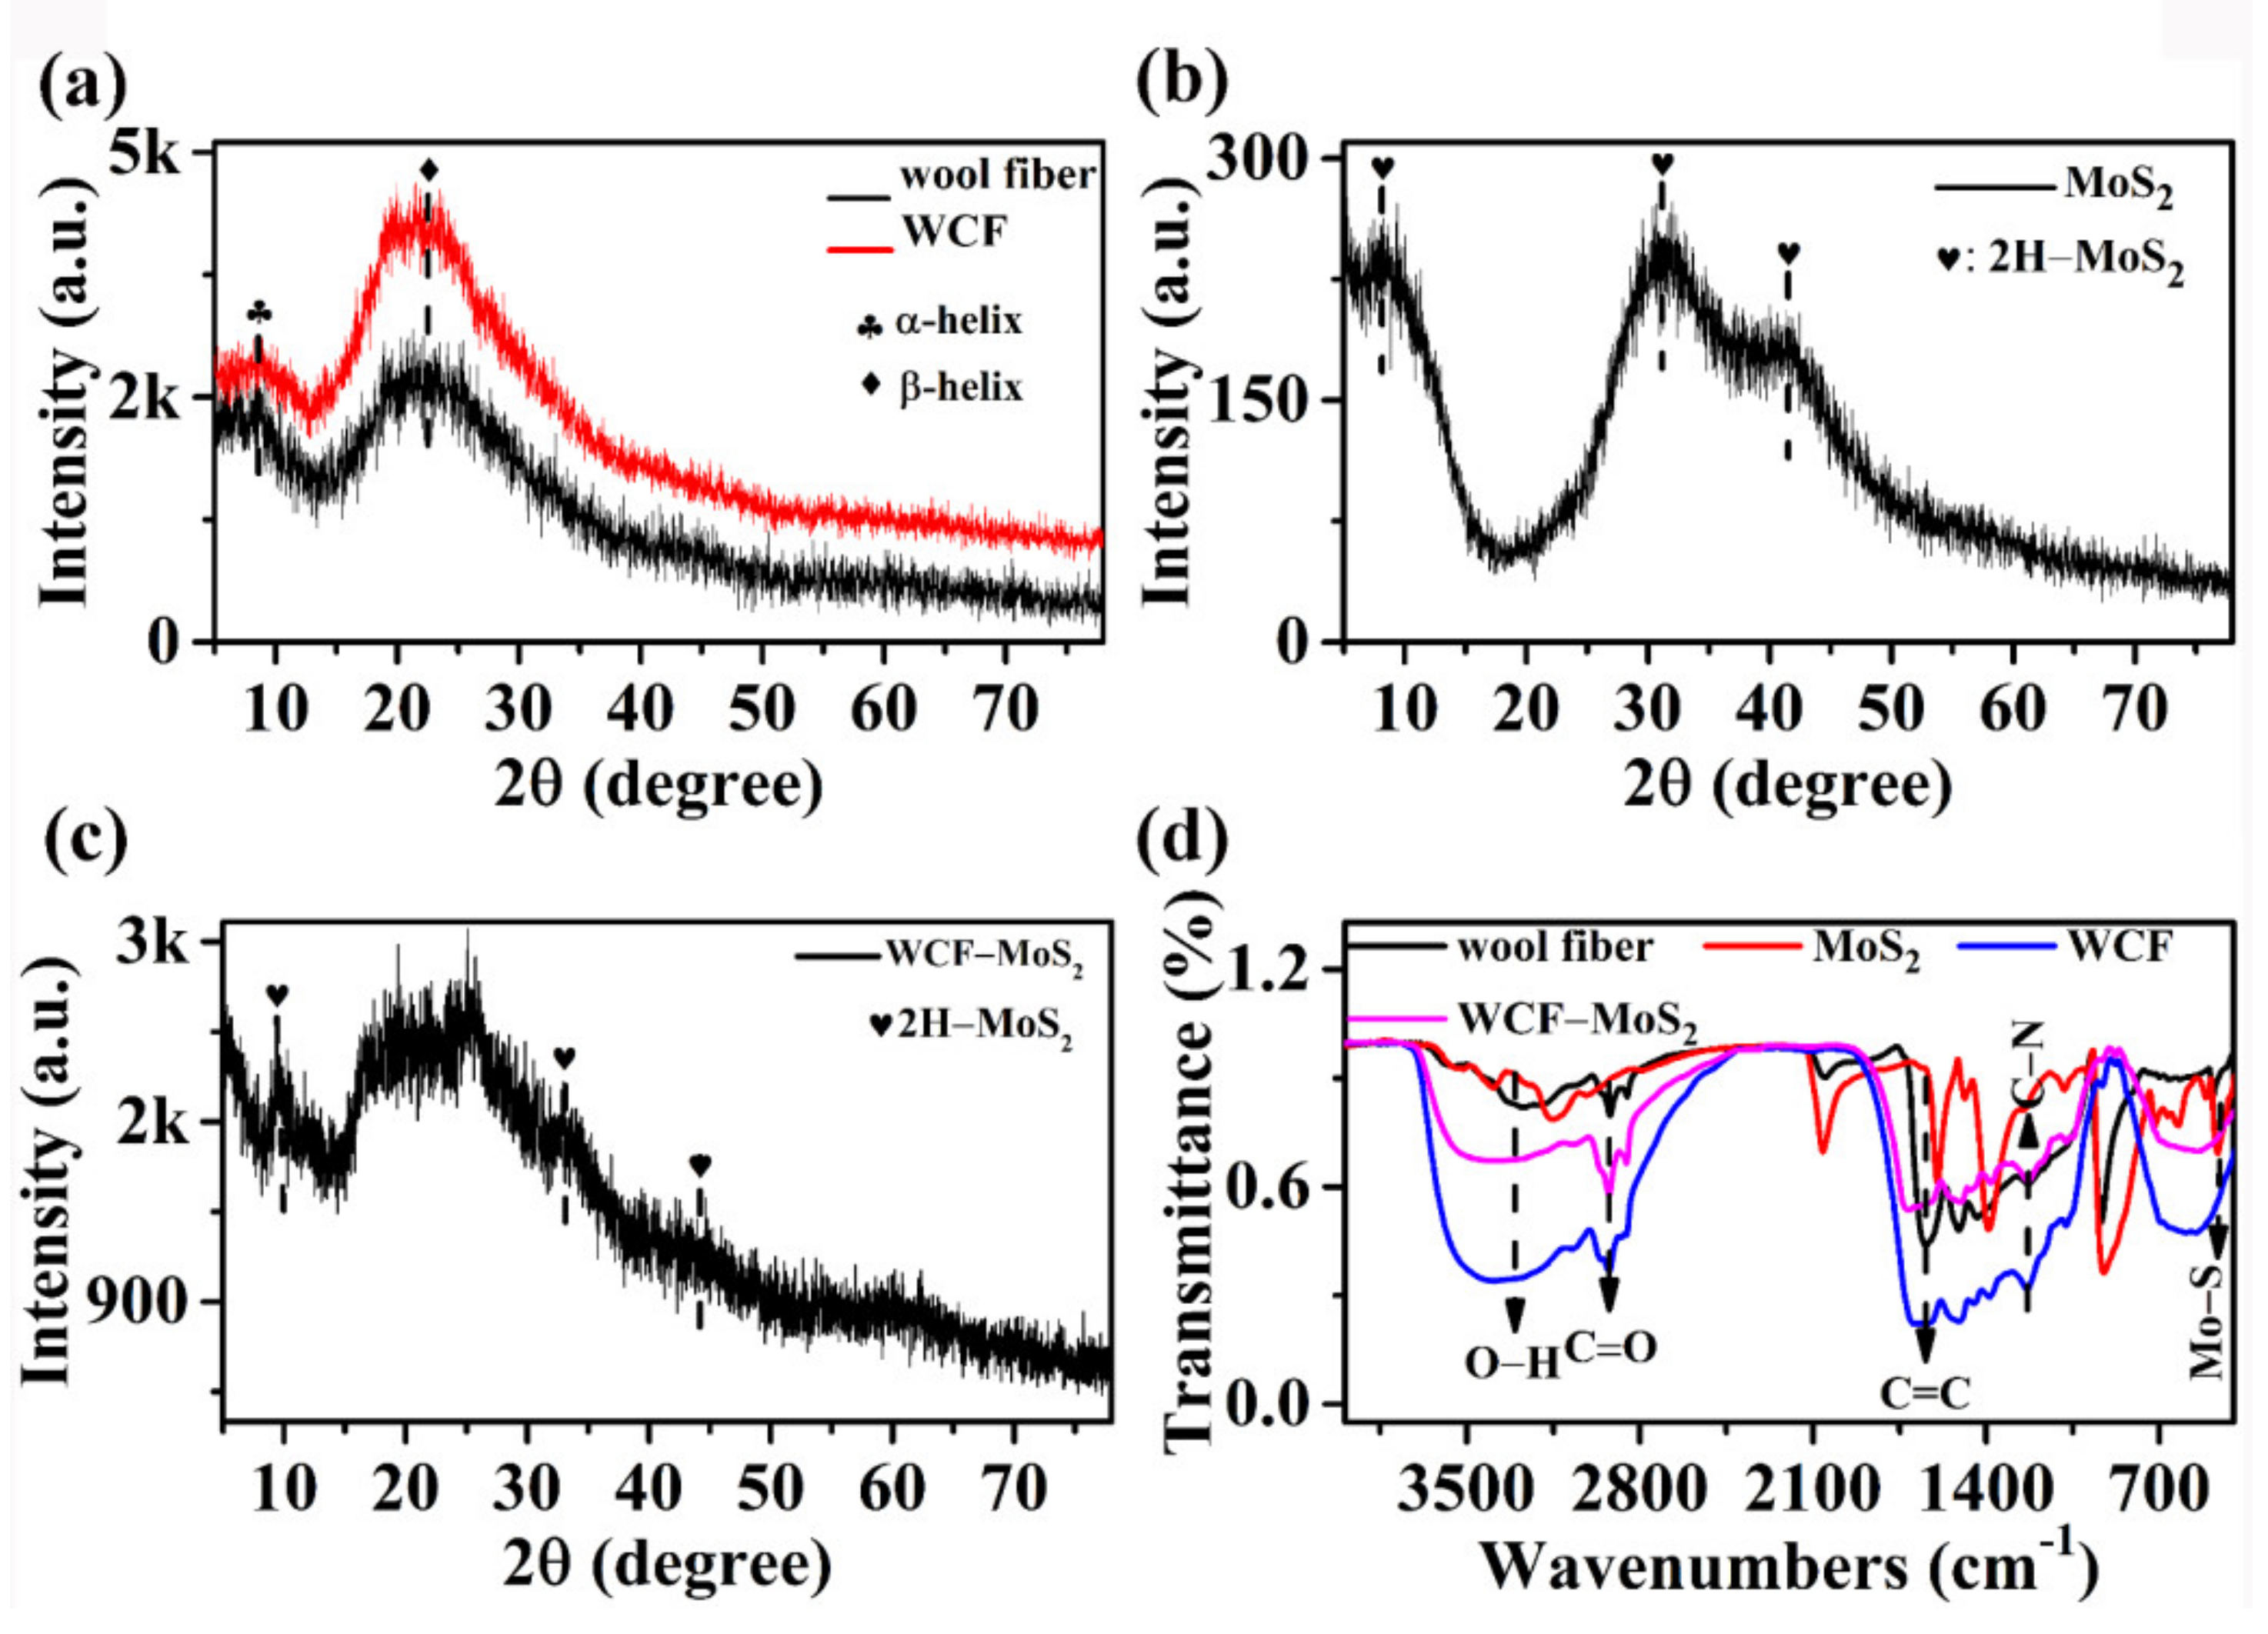
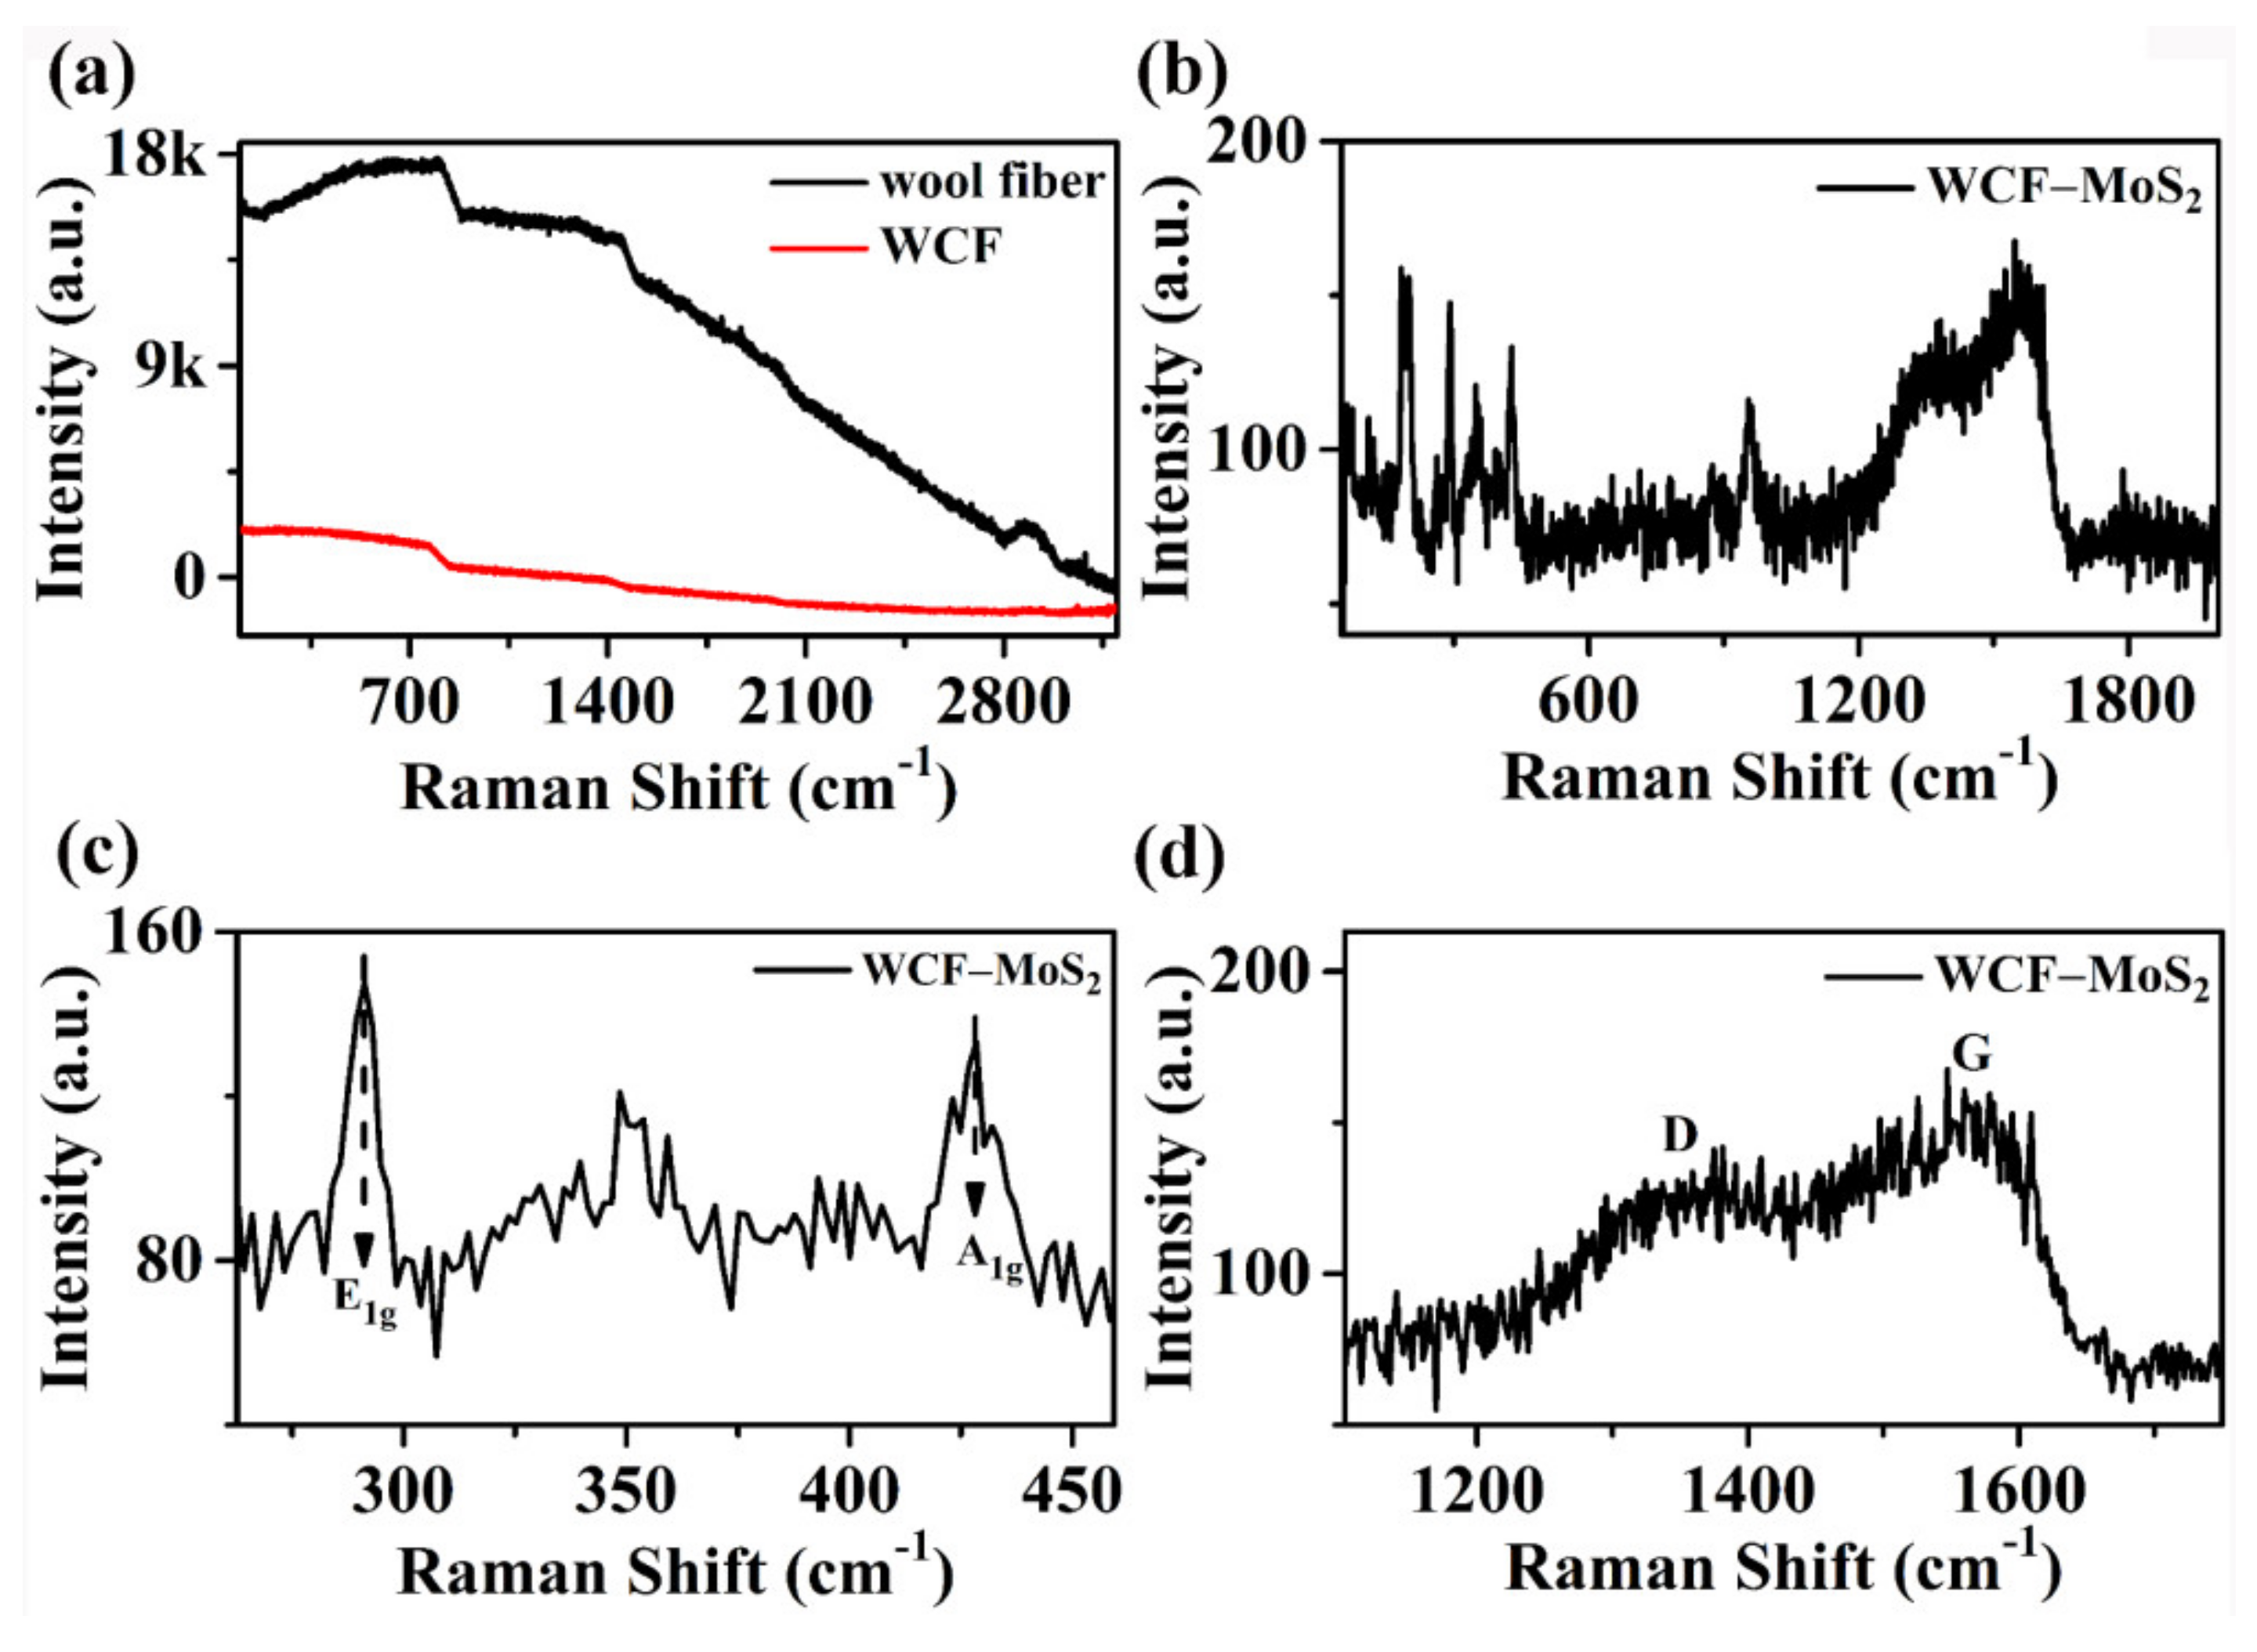
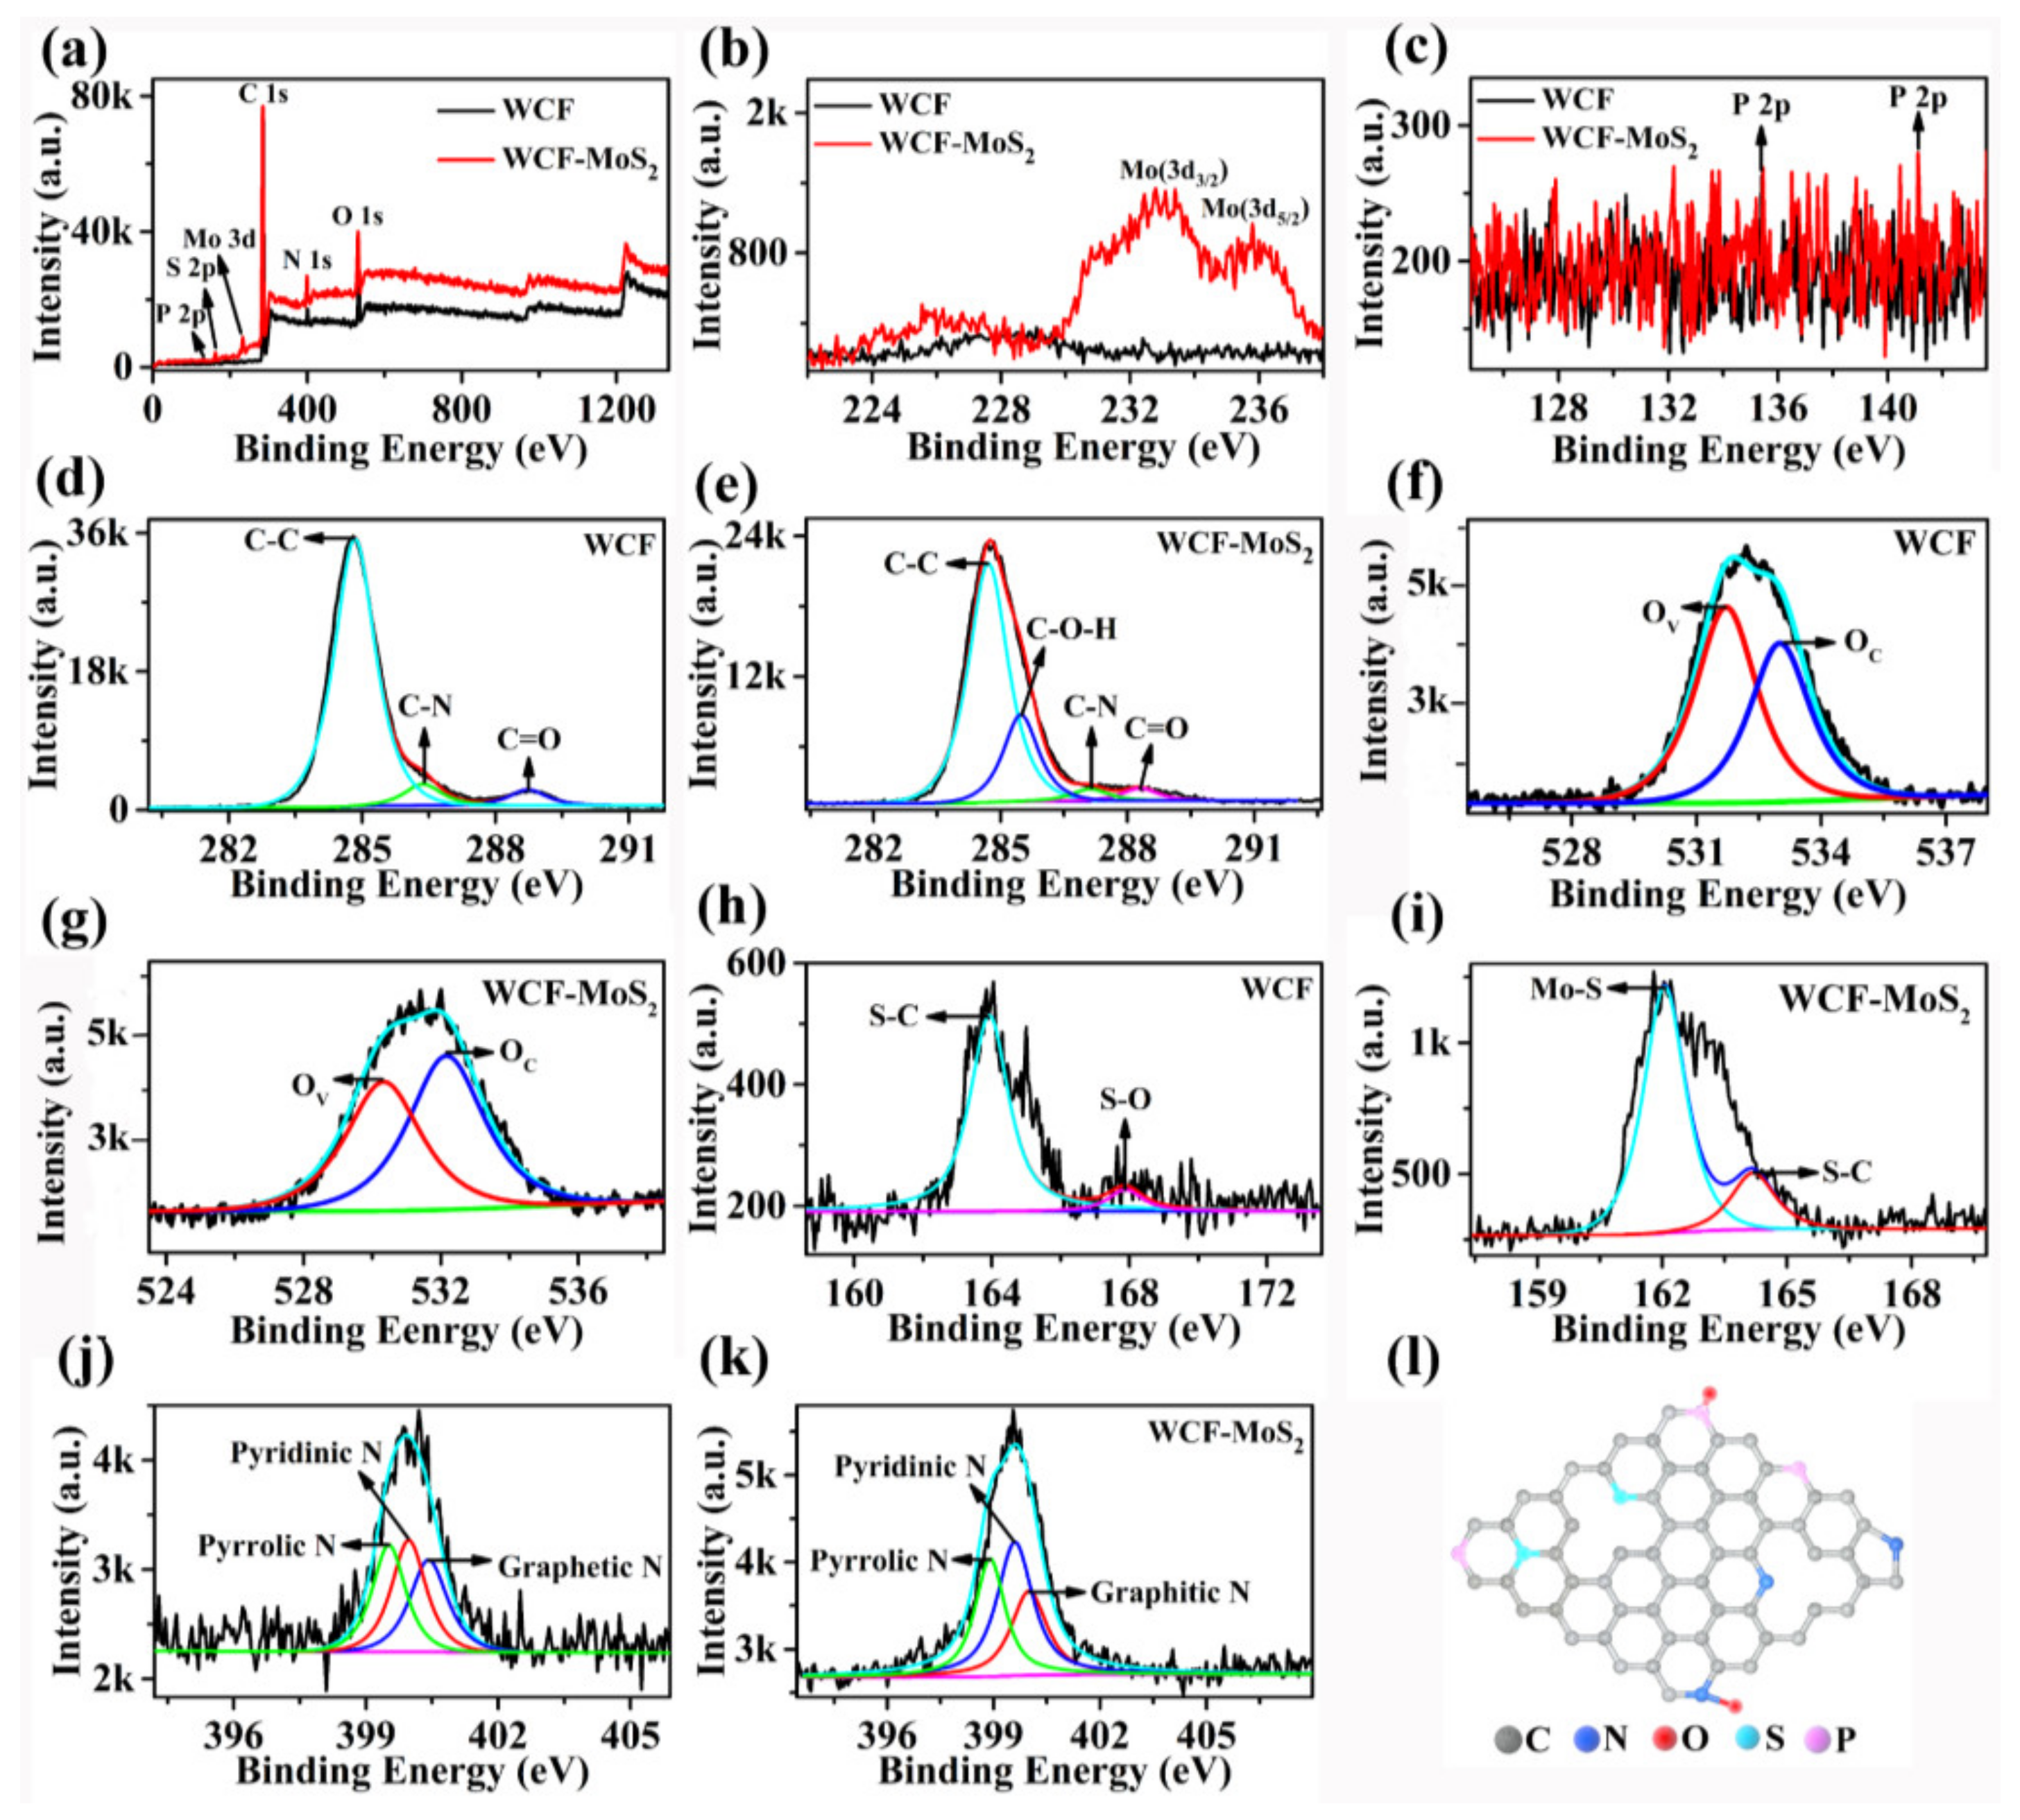
3.1. Structures and Morphologies of MoS2, WCF, and WCF–MoS2

Figure 1 shows the SEM images of the wool fiber, WCF, MoS2, and WCF–MoS2. As shown in Figure 1a–d, both the wool fiber and WCF were fibrous, with a diameter of about 15 μm. Meanwhile, wrinkles appeared on the surface of the wool fiber and the WCF, but the wrinkles on the WCF surface were denser, indicating that hydrothermal carbonization changed the microstructure of the wool fiber. Pure MoS2 was granular (Figure 1e,f), and the WCF–MoS2 composite was still fibrous, with a diameter of about 15 μm (Figure 1g,h). Moreover, there were still wrinkles on the surface of the WCF–MoS2 fiber, but the surface became coarser due to the nanoparticles loaded on the fiber [25]. This showed that WCF was coated by a thin layer of MoS2 to form the WCF–MoS2 composite, which was also proven by the element mapping. As shown in Figure 1i–o, WCF uniformly contained C, N, S, O, and a small amount of P elements. Compared with WCF, the WCF–MoS2 composite not only contained more S, but also contained Mo, which indicated that WCF was indeed coated with a layer of MoS2 to form a uniform WCF–MoS2 composite.
The structures of wool fiber, WCF, MoS2, and the WCF–MoS2 composite were studied using an XRD analysis. It can be clearly seen from Figure 2a that there were two peaks at 9.0° and 23.6° for wool fiber and WCF, which corresponded to the α-helix and β-sheet structures of the protein, respectively [26,27]. This is consistent with the fact that wool is composed of protein. Compared with that of the wool fiber, the structure of WCF did not change significantly after the hydrothermal treatment. In Figure 2b, we can see that 2H-MoS2 peaks (JCPDS Card No. 73-1508) appeared at 9.9°, 32.3°, and 43.2°, which are consistent with previous reports [24,28]. In Figure 2c, the characteristic peaks of 2H MoS2 and the wool fiber also appeared in the WCF–MoS2 composite. This indicates that the precursor of MoS2 may promote the carbonization and structural transformation of wool fiber during the hydrothermal process.
In order to evaluate the effect of the hydrothermal process on the samples, the functional groups of the samples were characterized by the FTIR spectra (Figure 2d). For wool fiber and WCF, there was a C=C extension absorption peak at 1641 cm−1 and an O–H stretching vibration at about 3300 cm−1 [29]. For MoS2, Mo–S bonds at 459 cm−1 showed that MoS2 was successfully prepared [30]. For WCF–MoS2, the peaks at 3297 and 2853 cm−1 corresponded to O–H and C=O groups, respectively [31]. The peak at 1640 cm−1 belonged to the C=C stretching vibration. At the same time, Mo–S groups appeared near 525 cm−1, indicating that MoS2 was loaded on the surface of WCF–MoS2 [32].
The carbon structure and graphitization degree were studied by Raman spectroscopy (Figure 3). As shown in Figure 3a, the Raman spectra of wool fiber and WCF did not change significantly, but neither of them showed obvious G and D bands characteristic of carbon materials [23]. This indicated that the simple low-temperature hydrothermal treatment may only carbonize the surface of the wool fiber, so it did not show obvious peaks characteristic of carbon [23]. For the WCF–MoS2 composite, the Raman spectra showed the bands characteristic of MoS2 and carbon materials (Figure 3b). Figure 3c is the Raman spectrum of WCF–MoS2 in the range of 270 to 455 cm−1. Figure 3c shows that the low-energy region consisted of various first-order modes, namely A1g (430 cm−1) and E1g (287 cm−1) of MoS2 [26]. Defective bands usually occur in the spectral range of 140–420 cm−1 in MoS2 [33]. Figure 3d is the Raman spectrum of the WCF–MoS2 composite in the range of 1100 to 1750 cm−1. It is worth noting that the D (1352 cm−1) and G (1579 cm−1) bands corresponding to carbon appeared for the WCF–MoS2 composite. This indicated that the precursor of MoS2 may play a catalytic role in the hydrothermal process and promote the carbonization of wool, forming a WCF–MoS2 composite [6].
XPS was also used to analyze the elements and structure of samples. As can be seen from Figure 4a, both WCF and the WCF–MoS2 composite contained C, N, O, S, N, and P elements. For the WCF, the proportions of C, N, O, P, S, and Mo in total elements were 85.11%, 3.30%, 10.33%, 0.31%, 0.83%, and 0.13%, respectively. For the WCF–MoS2 composite, the proportions of C, N, O, P, S, and Mo elements in the total elements were 78.4%, 8.36%, 9.03%, 0.55%, 2.63%, and 1.02%, respectively. Compared with those of the WCF, the S and Mo elements of WCF–MoS2 were significantly increased, which should be derived from the loaded MoS2. It can be clearly seen in Figure 4b that two peaks of Mo 3d3/2 and Mo 3d5/2 appeared at the positions of 232.4 and 235.5 eV, respectively [34,35,36]. However, the peaks corresponding to Mo were not obvious, which indicated that there was only a thin layer of MoS2 on the surface of the WCF. The contents of P element in the WCF and the WCF–MoS2 composite were only 0.31% and 0.55%, respectively, so their peaks were not very obvious (Figure 4c). Figure 4d shows the C 1s peak of the WCF, and the peaks at 285.1, 286.5, and 288.9 eV represented C–C, C–N, and C=O functional groups, respectively. Figure 4e shows the C 1s peak of WCF–MoS2, and the peaks at 285.1, 286.1, 287.2, and 288.9 eV represented C–C, C–O–H, C–N, and C=O functional groups, respectively. On the whole, among the peaks of all the elements, the peak of carbon was the strongest, which indicated that the main element of WCF and the WCF –MoS2 composite is carbon. Figure 4f,g show the peaks of O 1s in WCF and the WCF–MoS2 composite, respectively. OV and OC were oxygen vacancies and chemisorbed oxygen species, respectively [37]. The percentages of OC in the total oxygen element area in WCF and WCF–MoS2 were 45.6% and 55.7%, respectively. This indicated that the percentage of OC in WCF–MoS2 was much higher than that in WCF, which may be due to the adsorption of oxygen promoted by the heterojunction of WCF and MoS2. Figure 4h shows the S 2p peak of WCF, and the two peaks at 164.2 and 167.9 eV were S–C and S–O functional groups, respectively. For the S 2p peak of WCF–MoS2 in Figure 4i, the two peaks at 163.6 and 167.9 eV should be S in MoS2 [38], and the latter may be the S of amino acids. Figure 4j shows the N 1s peak of WCF, and there were three peaks at 398.9, 399.5, and 400.1 eV, corresponding to pyrrolic N, pyridinic N, and graphite N, respectively [39]. Similarly, there were three peaks at 399.1, 399.6, and 400.1 eV, corresponding to pyrrolic N, pyridinic N, and graphite N of WCF–MoS2, respectively (Figure 4k). Thus, according to the analysis of XPS and Raman spectroscopy, the basic surface structures of WCF and the WCF–MoS2 composite should be graphene with high defects (such as the doping of multiple atoms and vacancy), as shown in Figure 4l [40]. Compared with perfect graphene, this defective graphene provided more active sites for gas adsorption, thus achieving the purpose of improving gas sensitivity.

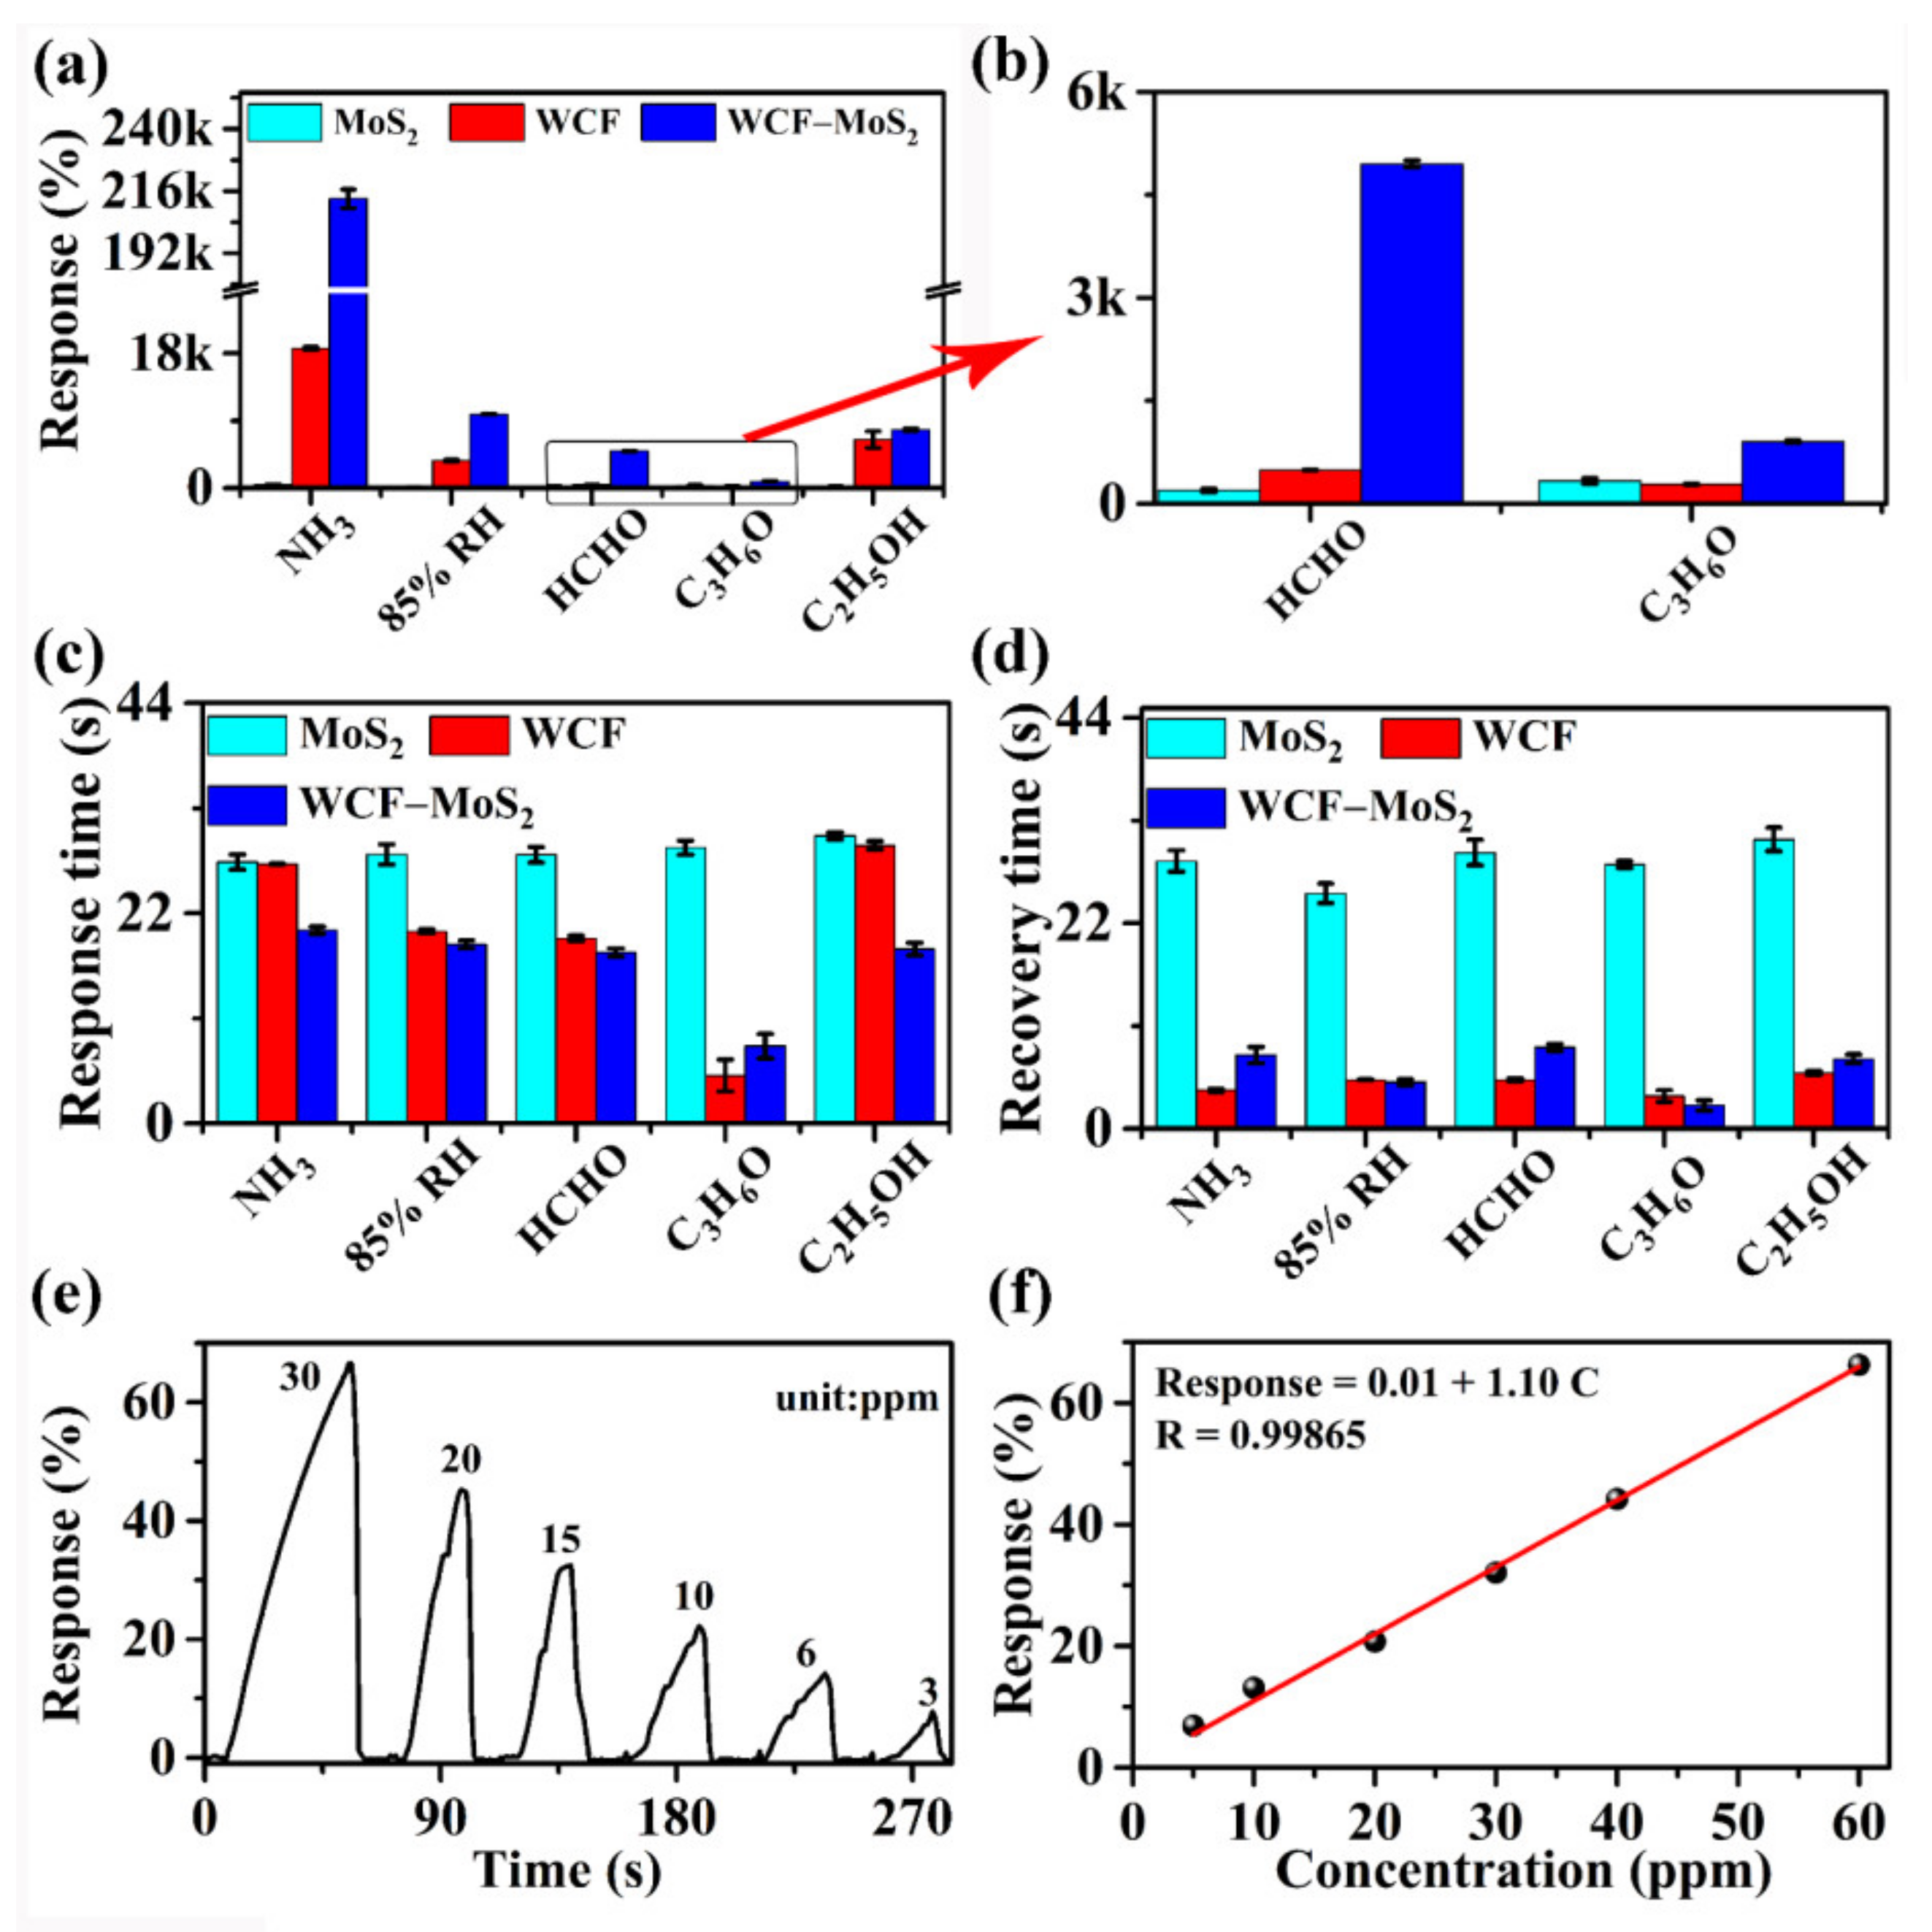
3.2. Sensing Performance of MoS2, WCF, and WCF–MoS2

The sensing curves of the sensors based on MoS2, WCF, and WCF–MoS2 for an 85% relative humidity (RH) and 1000 ppm of NH3, formaldehyde (HCHO), acetone (C3H6O) and ethanol (C2H5OH) are shown in Figure 5. On the whole, the sensing curves of MoS2, WCF, and WCF–MoS2 for five target analytes showed they had good recovery abilities and reproducibilities in three consecutive sensing cycles (Figure 5). It is worth noting that the shapes of the sensing curves of MoS2 for the five atmospheres are very similar, and the responses were small, which were no more than 459%. Compared with those of MoS2, the shapes of the sensing curves of WCF for the five analytes are obviously different, and the responses were greatly improved. Among them, WCF had the highest response to NH3, up to 18.67k%. For the five analytes, the different shapes of the sensing curves should be attributed to the fact that WCF had a variety of heteroatom doping (N, P, and S) and rich functional groups [41]. For the WCF–MoS2 composite, the sensing curves for five target atmospheres also have different shapes, and the shapes are similar to those of WCF. This showed that the WCF in the WCF–MoS2 composite played an important role in the gas-sensing process. For different target atmospheres, the sensing curves of different shapes may be used as fingerprints, which can be combined with databases and image recognition to achieve the effect of discriminative detection. Moreover, both the sensitivity and selectivity of WCF–MoS2 were further improved. Its response to NH3 reached 213.03k%; the improvement of selectivity and sensitivity should be attributed to the heterojunction structure of the WCF–MoS2 composite.
Figure 6 shows the average response, response time, and recovery time of MoS2, WCF, and WCF–MoS2 for the target analyte. As can be seen from Figure 6a,b, the sensitivities of WCF–MoS2 to the five analytes were significantly higher than those of MoS2 and WCF. For MoS2, its responses to NH3, the 85% RH, HCHO, C3H6O, and C2H5OH were only 459%, 137.3%, 1.432k%, 332%, and 216%, respectively. For WCF, its responses to NH3, the 85% RH, HCHO, C3H6O, and C2H5OH were up to 18.67k%, 3.673k%, 492.6%, 284%, and 6.482k%, respectively. For the WCF–MoS2 composite, its responses to NH3, the 85% RH, HCHO, C3H6O, and C2H5OH were up to 213.03k%, 9.854k%, 4.954k%, 904.5%, and 7.796k%, respectively. It is can be seen that the response to 1000 ppm of NH3 increased from 459% for MoS2 to 18.67k% for WCF and to 213.03k% for WCF–MoS2. Thus, compared with WCF and MoS2, the WCF–MoS2 composite showed higher sensitivity and selectivity, which is very important for anti-interference and the highly sensitive detection of NH3. As shown in Figure 6c, among the three sensing materials, the response time of the WCF –MoS2 composite was basically the shortest, and the response times to the five analytes did not exceed 20 s. The recovery time of the WCF–MoS2 composite did not exceed 9 s, which was much lower than that (~25 s) of MoS2 (Figure 6d). This means that the WCF–MoS2 composite can complete a response–recovery cycle in 30 s and realize the real-time monitoring of NH3. NH3 is a widely distributed and harmful gas emitted by most chemical industries as well as agricultural production. Prolonged exposure to high concentrations of NH3 can damage the eyes, skin, and respiratory organs [42]. The Occupational Safety and Health Administration (OSHA) reported that the human body’s exposure to NH3 should not exceed 25 ppm over 8 h. Therefore, the limit of detection (LoD) for NH3 based on the WCF –MoS2 composite was further evaluated. Figure 6e shows the sensing curves of the WCF–MoS2 composite to different concentrations of NH3. The WCF–MoS2 composite could actually detect 3 ppm of NH3, and its response time and recovery time were only 16 and 5 s, respectively. It can be seen from Figure 6f that there was a good linear relationship between the responses and concentrations of NH3. The estimated LoD (defined as LoD = 3 SD/m, where m is the slope of the linear part of the calibration curve and SD is the standard deviation of noise in the sensing curve) for WCF –MoS2 to NH3 was determined to be 19.1 ppb.
In order to comprehensively evaluate the gas-sensing performance of WCF-MoS2, the performances of recent NH3 sensors are compared in Table 1. As shown in Table 1, the response time and recovery time of WCF–MoS2 for NH3 were 16 and 5 s, respectively, which were close to the shortest response time (14 s) and recovery time (4 s) shown by ZnO/CMTs [37]. Moreover, the LoD (19.1 ppb) of WCF–MoS2 could not catch up with the LoD (9 ppb) of ZnO/CMTs. Nevertheless, compared with the preparation temperature (600 °C) of ZnO/CMTs, the preparation temperature of WCF–MoS2 was only 120 °C, and the preparation equipment was also simpler. Although the LoD of SnO2/Pd/RGO to NH3 is only 11 ppb, the response time and recovery time are up to 7 and 50 min, which are not suitable for the real-time monitoring of NH3 [43]. Therefore, the WCF–MoS2 sensor showed a good comprehensive sensing performance, which not only had a low preparation temperature, a low working temperature, a high sensitivity, and a high selectivity, but also has a fast response and recovery ability.
Furthermore, the discriminative detection of a target atmosphere is still a challenging problem. In order to realize the discriminative detection of a target atmosphere, two methods are generally used, that is, improving the selectivity of sensors and building sensor arrays [6,51]. This requires the screening and subsequent modification of sensing materials, which increases the cost and prolongs the preparation cycle. Because the WCF–MoS2 sensor produces sensing curves with different shapes for the five analytes, it inspires us to use image recognition technology to help improve the discriminative detection of a target atmosphere. When the WCF–MoS2 sensor is tested for five atmospheres, the shapes of response–recovery curves are saved to form a database. When the WCF–MoS2 sensor encounters a certain atmosphere again, new sensing curves will be generated. These new sensing curves will be compared with the database, and the discriminative results will be given. In this way, with the aid of image recognition technology, the discriminative detection of a variety of single atmospheres can be realized by only a single sensor. According to Figure S1, we have preliminarily realized the discriminative detection of five target analytes with the help of MATLAB software and image recognition technology. Due to the small sample capacity, the recognition accuracies of the five target analytes were as high as 100%, proving that our scheme is feasible. This may provide a new scheme and idea for the development of gas sensors.

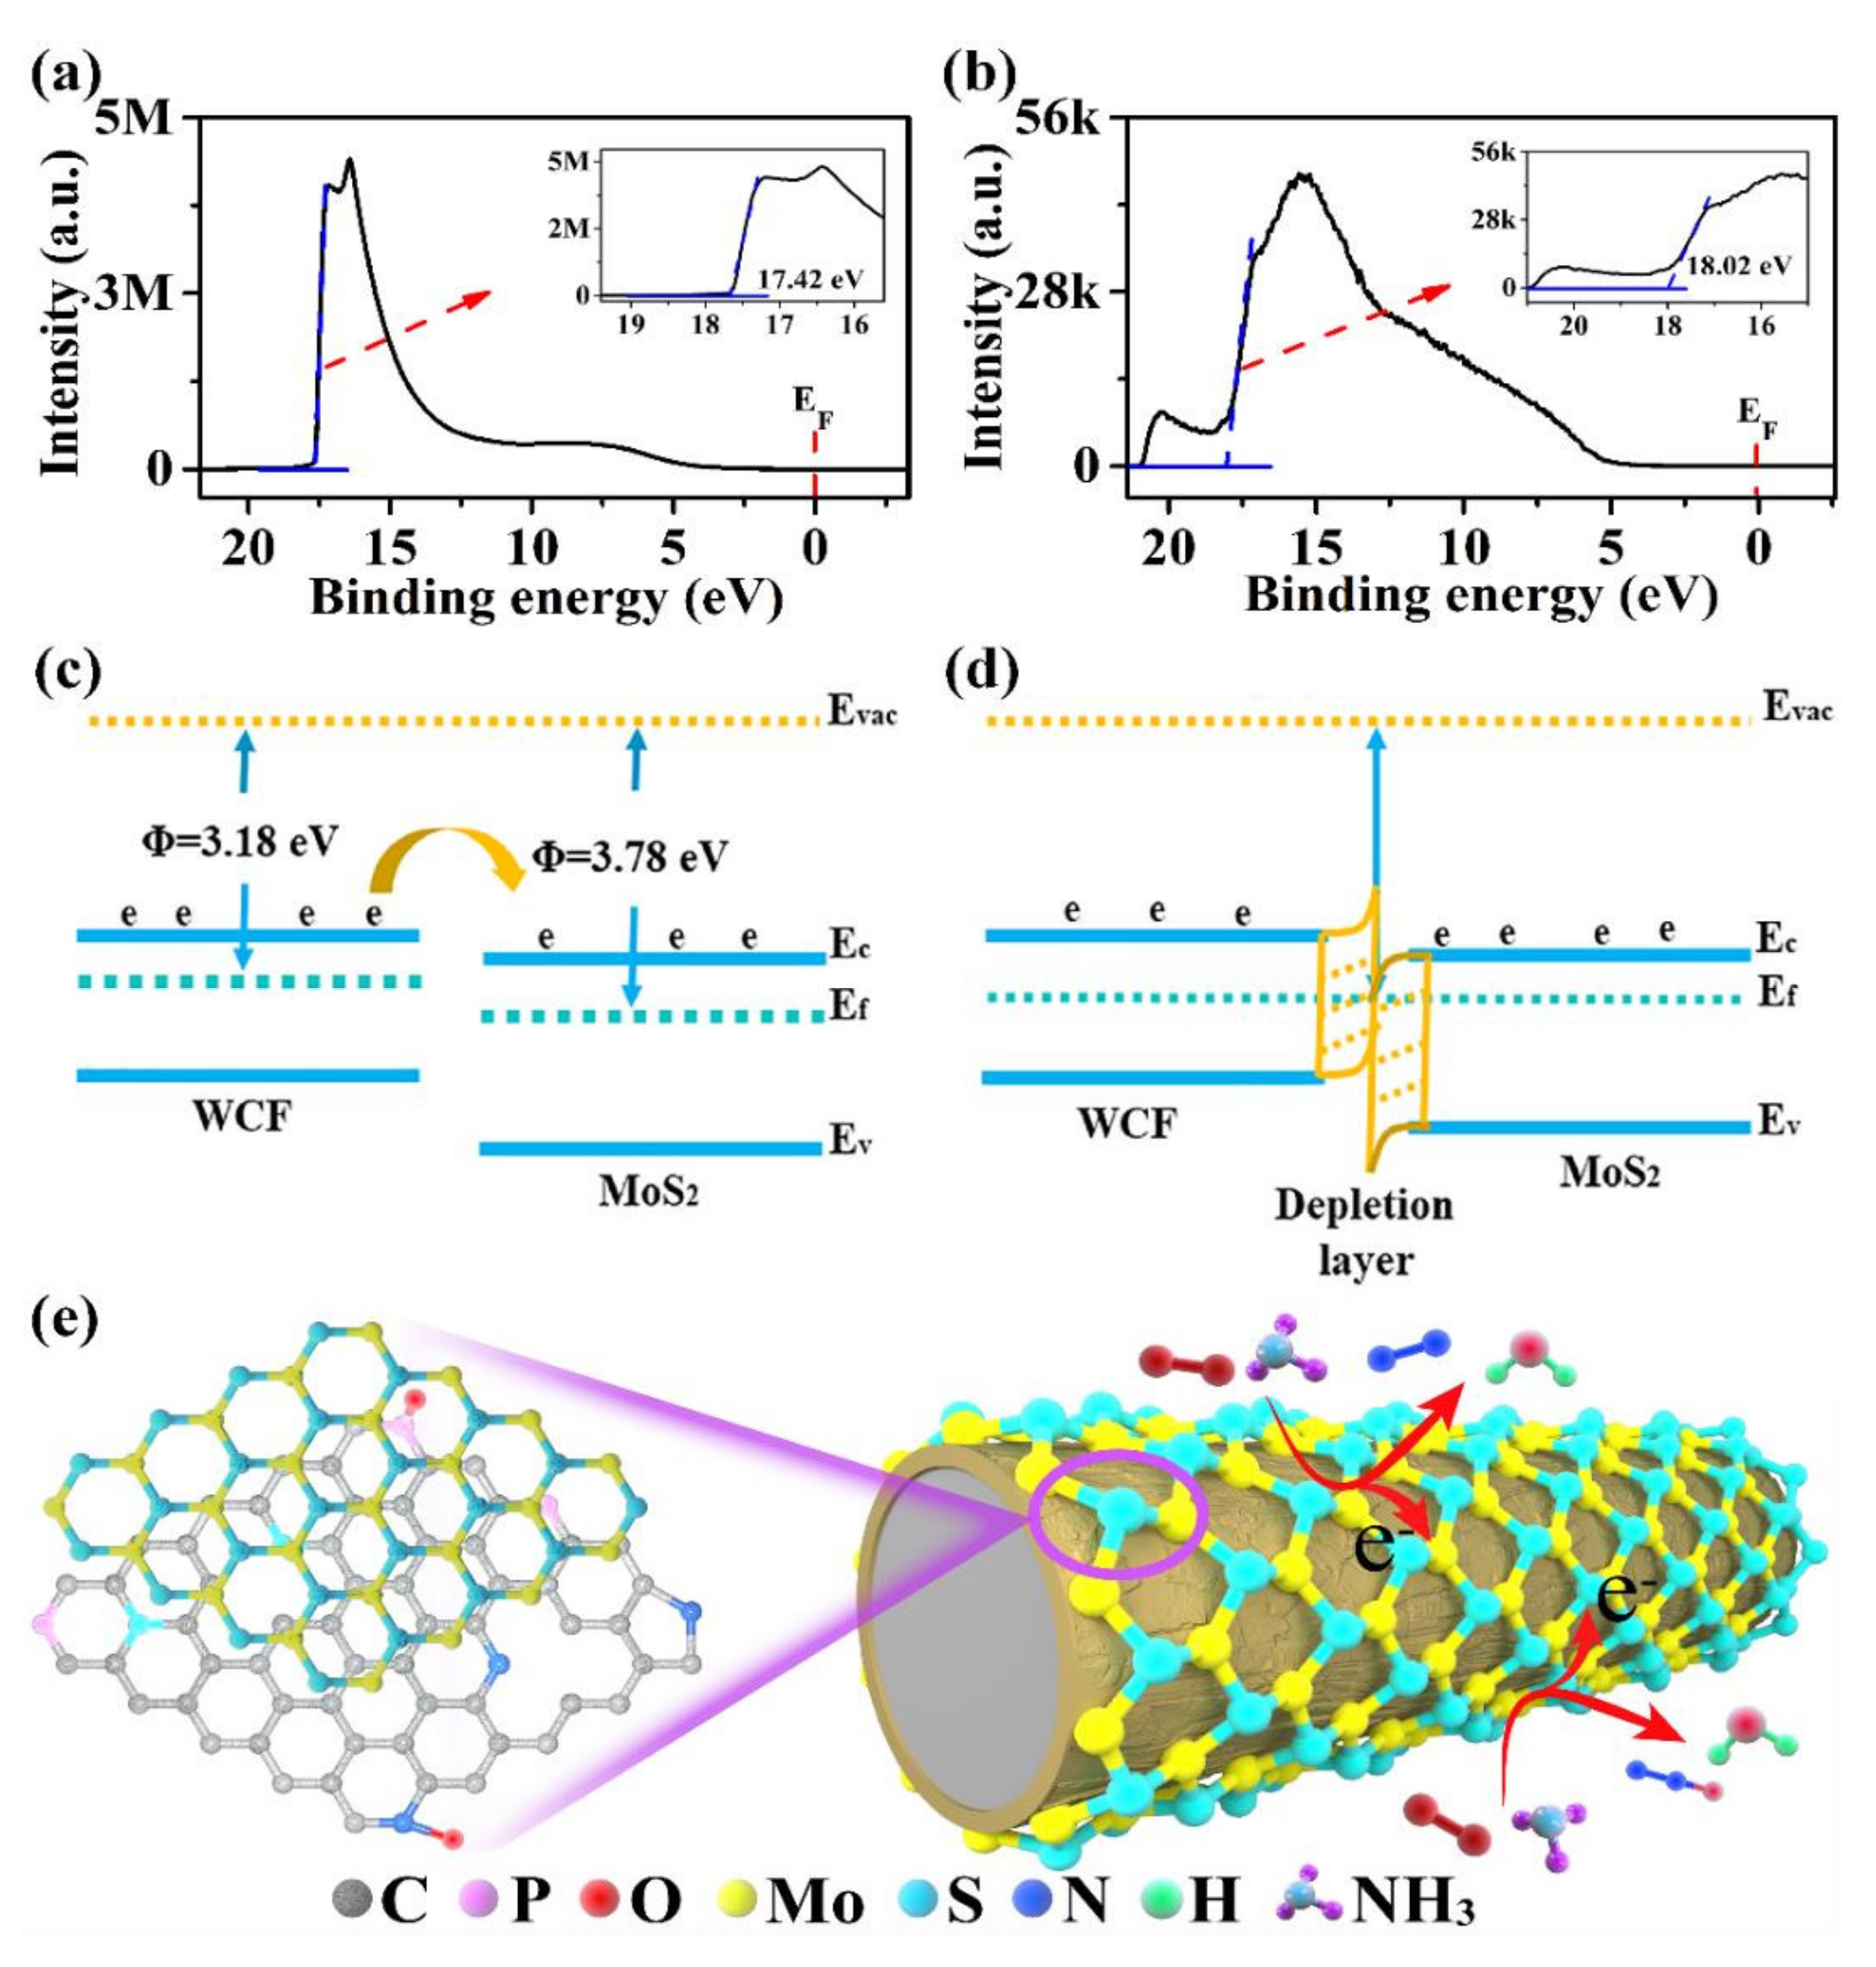
3.3. Possible Sensing Mechanisms of WCF–MoS2

In order to analyze the possible sensing mechanism, UPS was performed (Figure 7a,b). Figure 7a,b show the UPS spectra of WCF and MoS2, where Ef and Φ are the Fermi levels and the working function, respectively. The Φ values of WCF and MoS2 were calculated to be 3.18 and 3.78 eV, respectively. Due to the higher Ef of WCF than that of MoS2, when they come into contact, electrons can be quickly transferred from WCF to MoS2. Thus, the bands of WCF and MoS2 began to bend, until their Fermi levels reached a new equilibrium (Figure 7c,d), forming a built-in barrier (qV0). Therefore, a depletion layer was formed at the interface between WCF and MoS2 [52,53]. When the WCF–MoS2 composite was exposed to the air, the O2 molecules of the air were adsorbed on the surface of WCF–MoS2 and captured electrons from the WCF–MoS2 composite to form negative oxygen ions, as follows [37]:
O 2 ads + e O 2   ( < 100   ° C ) .
According to the XPS analysis, the O2 molecules adsorbed on the surface of WCF–MoS2 were 10% more than those absorbed on the surface of WCF. Thus, O2 molecules capture electrons in WCF–MoS2 to form a new barrier ( q V 1 ), which increased the total barrier ( q V 0 + V 1 ). Taking the gas sensing of the WCF–MoS2 composite to NH3 as an example. When the WCF–MoS2 composite was in NH3 gas, some NH3 molecules were absorbed on the surface and reacted with O 2   ads . The reaction of NH3 molecules with O 2   ads can be described as follows [37]:
2 NH 3 + 3 2 O 2   ads H 2 O + N 2 + 3 e ,
2 NH 3 + 2 O 2   ads H 2 O + N 2 O + 2 e .
The reaction between NH3 molecules and O2− ions (Figure 7e) released electrons into WCF–MoS2 and lowered the potential barrier ( q V 0 + V 1 V 2 ). The resistance of semiconductor materials is reported to be exponentially proportional to the height of the potential barrier [54]:
R = R 0 e qV KT ,
where qV is the effective potential barrier, R0 is a constant, K is Boltzmann’s constant, and T is the absolute temperature. It is observed that a slight change in the potential barrier will result in a significant change in the sensing resistance, producing an obvious sensing signal. It can be seen that the MoS2 precursor plays a catalytic role in the carbonization of wool fiber and forms a heterojunction structure, which promotes the gas-sensing performance of the WCF–MoS2 composite.

4. Conclusions

WCF and a WCF–MoS2 composite were successfully prepared by low-temperature (120 °C) hydrothermal carbonization. It was found that a MoS2 precursor played a catalytic role in the carbonization of wool fiber, forming heterojunctions between MoS2 and WCF in the WCF–MoS2 composite. Compared with MoS2 and WCF, the WCF–MoS2 composite showed a better gas-sensing performance to NH3 due to heterojunctions. Meanwhile, the WCF–MoS2 composite showed a good comprehensive sensing performance, which not only had a low preparation temperature, a low working temperature, a high sensitivity (19.1 ppb), and a high selectivity, but also had a fast response–recovery ability (< 30 s). Interestingly, the WCF–MoS2 composite also displayed different shapes of sensing curves for different atmospheres, providing a new possibility for the discriminative detection of the target analytes. In response to global warming, this work provides a new idea for the low-temperature preparation of carbon materials, the development of sensors, and the resource utilization of wool waste.

Supplementary Materials

The following supporting information can be downloaded at: https://www.mdpi.com/article/10.3390/nano12071105/s1, Figure S1: Identification of (a) NH3, (b) 85% RH, (c) HCHO, (d) C3H6O and (e) C2H5OH target analytes by MATLAB software, (f) Curve of training times and accuracy.

Author Contributions

All authors (Y.X., Z.W., Z.Q., F.C., C.L., M.Z., T.S. and H.D.) contributed to the study conception and design. Material preparation and data collection and analysis were performed by Y.X. The first draft of the manuscript was written by Y.X. and Z.W., and all authors commented on previous versions of the manuscript. All authors have read and agreed to the published version of the manuscript.

Funding

This research was funded by [Natural Science Foundation of Xinjiang Uygur Autonomous Region] grant number [2019D01C019], [Natural Science Foundation of Department of Education, Xinjiang Uygur Autonomous Region] grant number [XJEDU2020Y004], [National Natural Science Foundation of China] grant number [21964016, 11664038] and [Tianshan Innovation Team Program of Xinjiang Uygur Autonomous Region] grant number [2020D14038].

Institutional Review Board Statement

Not applicable.

Informed Consent Statement

Not applicable.

Data Availability Statement

The data presented in this study are available on request from the corresponding author.

Conflicts of Interest

The authors declare that they have no known competing financial interests or personal relationships that could have appeared to influence the work reported in this paper.

References

  1. Schleussner, C.-F.; Rogelj, J.; Schaeffer, M.; Lissner, T.; Licker, R.; Fischer, E.M.; Knutti, R.; Levermann, A.; Frieler, K.; Hare, W. Science and policy characteristics of the Paris Agreement temperature goal. Nat. Clim. Chang。 2016, 6, 827–835. [Google Scholar] [CrossRef] [Green Version]
  2. Holden, P.B.; Edwards, N.R.; Ridgwell, A.; Wilkinson, R.D.; Fraedrich, K.; Lunkeit, F.; Pollitt, H.E.; Mercure, J.-F.; Salas, P.; Lam, A.; et al. Climate–carbon cycle uncertainties and the Paris Agreement. Nat. Clim. Chang。 2018, 8, 609–613. [Google Scholar] [CrossRef]
  3. Cho, E.J.; Trinh, L.T.P.; Song, Y.; Lee, Y.G.; Bae, H.-J. Bioconversion of biomass waste into high value chemicals. Bioresour。 Technol. 2019, 298, 122386. [Google Scholar] [CrossRef] [PubMed]
  4. Cheng, F.; Porter, M.D.; Colosi, L.M. Is hydrothermal treatment coupled with carbon capture and storage an energy-producing negative emissions technology? Energy Convers. Manag. 2020, 203, 112252. [Google Scholar] [CrossRef]
  5. Titirici, M.-M.; Thomas, A.; Antonietti, M. Back in the black: Hydrothermal carbonization of plant material as an efficient chemical process to treat the CO2 problem? New J. Chem. 2007, 31, 787–789. [Google Scholar] [CrossRef]
  6. Cao, S.; Wu, Z.; Sun, Q.; Zhang, W.; Beysen, S.; Wang, S.; Shaymurat, T.; Zhang, M.; Duan, H. Gas sensing properties of cotton-based carbon fibers and ZnO/carbon fibers regulated by changing carbonization temperatures. Sens. Actuators B Chem. 2021, 337, 129818. [Google Scholar] [CrossRef]
  7. Alatzas, S.; Moustakas, K.; Malamis, D.; Vakalis, S. Biomass Potential from Agricultural Waste for Energetic Utilization in Greece. Energies 2019, 12, 1095. [Google Scholar] [CrossRef] [Green Version]
  8. Foong, S.Y.; Liew, R.K.; Yang, Y.; Cheng, Y.W.; Yek, P.N.Y.; Mahari, W.A.W.; Lee, X.Y.; Han, C.S.; Vo, D.-V.N.; Le, Q.V.; et al. Valorization of biomass waste to engineered activated biochar by microwave pyrolysis: Progress, challenges, and future directions. Chem. Eng. J. 2020, 389, 124401. [Google Scholar] [CrossRef]
  9. Yi, Q.; Li, W.; Feng, J.; Xie, K. Carbon cycle in advanced coal chemical engineering. Chem. Soc. Rev. 2015, 44, 5409–5445. [Google Scholar] [CrossRef]
  10. Song, B.; Zhang, M.; Teng, Y.; Zhang, X.; Deng, Z.; Huo, L.; Gao, S. Highly selective ppb-level H2S sensor for spendable detection of exhaled biomarker and pork freshness at low temperature: Mesoporous SnO2 hierarchical architectures derived from waste scallion root. Sens. Actuators B Chem. 2020, 307, 127662. [Google Scholar] [CrossRef]
  11. Liu, W.; Tian, K.; He, Y.; Jiang, H.; Yu, H. High-Yield Harvest of Nanofibers/Mesoporous Carbon Composite by Pyrolysis of Waste Biomass and Its Application for High Durability Electrochemical Energy Storage. Environ. Sci. Technol. 2014, 48, 13951–13959. [Google Scholar] [CrossRef] [PubMed]
  12. Zhang, L.; Hu, F.; Zhu, S.; Lin, Y.; Meng, Z.; Yu, R.; Liu, X. Meso-Reconstruction of Wool Keratin 3D “Molecular Springs” for Tunable Ultra-Sensitive and Highly Recovery Strain Sensors. Small 2020, 16, 2000128. [Google Scholar] [CrossRef] [PubMed]
  13. Zhang, P.; Zhang, N.; Wang, Q.; Wang, P.; Yuan, J.; Shen, J.; Fan, X. Disulfide bond reconstruction: A novel approach for grafting of thiolated chitosan onto wool. Carbohydr. Polym. 2019, 203, 369–377. [Google Scholar] [CrossRef]
  14. Macdermid-Watts, K.; Pradhan, R.; Dutta, A. Catalytic Hydrothermal Carbonization Treatment of Biomass for Enhanced Activated Carbon: A Review. Waste Biomass Valoriz. 2021, 12, 2171–2186. [Google Scholar] [CrossRef]
  15. Hu, X.; Nango, K.; Bao, L.; Li, T.; Hasan, M.D.M.; Li, C. High Yields of Solid Carbonaceous Materials from Biomass. Green Chem. 2019, 21, 1128–1140. [Google Scholar] [CrossRef]
  16. Snyder, B.F. Costs of biomass pyrolysis as a negative emission technology: A case study. Int. J. Energy Res. 2019, 43, 1232–1244. [Google Scholar] [CrossRef]
  17. Momodu, D.; Okafor, C.; Manyala, N.; Bello, A.; Zebazekana, M.G.; Ntsoenzok, E. Transformation of Plant Biomass Waste into Resourceful Activated Carbon Nanostructures for Mixed-Assembly Type Electrochemical Capacitors. Waste Biomass Valoriz. 2019, 10, 1741–1753. [Google Scholar] [CrossRef]
  18. Bi, H.; Yin, Z.; Cao, X.; Xie, X.; Tan, C.; Huang, X.; Chen, B.; Chen, F.; Yang, Q.; Bu, X.; et al. Carbon Fiber Aerogel Made from Raw Cotton: A Novel, Efficient and Recyclable Sorbent for Oils and Organic Solvents. Adv. Mater. 2013, 25, 5916–5921. [Google Scholar] [CrossRef]
  19. Zhao, H.; Cheng, Y.; Liu, W.; Yang, L.; Zhang, B.; Wang, L.; Ji, G.; Xu, Z. Biomass-Derived Porous Carbon-Based Nanostructures for Microwave Absorption. Nano-Micro Lett. 2019, 11, 77–93. [Google Scholar] [CrossRef] [Green Version]
  20. Bi, Z.; Kong, Q.; Cao, Y.; Sun, G.; Su, F.; Wei, X.; Li, X.; Ahmad, A.; Xie, L.; Chen, C. Biomass-derived porous carbon materials with different dimensions for supercapacitor electrodes: A review. J. Mater. Chem. A 2019, 7, 16028–16045. [Google Scholar] [CrossRef]
  21. Liu, H.; Wu, S.; Tian, N.; Yan, F.; You, C.; Yang, Y. Carbon foams: 3D porous carbon materials holding immense potential. J. Mater. Chem. A 2020, 8, 23699–23723. [Google Scholar] [CrossRef]
  22. Liu, W.; Jiang, H.; Yu, H. Thermochemical conversion of lignin to functional materials: A review and future directions. Green Chem. 2015, 17, 4888–4907. [Google Scholar] [CrossRef]
  23. Thompson, E.; Danks, A.E.; Bourgeois, L.; Schnepp, Z. Iron-catalyzed graphitization of biomass. Green Chem. 2015, 17, 551–556. [Google Scholar] [CrossRef]
  24. Shao, L.; Wu, Z.; Duan, H.; Talgar, S. Discriminative and rapid detection of ozone realized by sensor array of Zn2+ doping tailored MoS2 ultrathin nanosheets. Sens. Actuators B Chem. 2018, 258, 937–946. [Google Scholar] [CrossRef]
  25. He, M.; Lei, J.; Zhou, C.; Shi, H.; Sun, X.; Gao, B. Growth of vertical MoS2 nanosheets on carbon materials by chemical vapor deposition: Influence of substrates. Mater. Res. Express 2019, 6, 1150c1. [Google Scholar] [CrossRef]
  26. Livneh, T.; Sterer, E. Resonant Raman scattering at exciton states tuned by pressure and temperature in 2H-MoS2. Phys. Rev. B 2010, 81, 229–235. [Google Scholar] [CrossRef]
  27. Li, Y.; Liu, H.; Wang, X.; Zhang, X. Fabrication and performance of wool keratin/functionalized graphene oxide composite fibers. Mater. Today Sustain. 2019, 3–4, 100006. [Google Scholar] [CrossRef]
  28. Xie, J.; Zhang, J.; Li, S.; Grote, F.; Zhang, X.; Zhang, H.; Wang, R.; Lei, Y.; Pan, B.; Xie, Y. Controllable Disorder Engineering in Oxygen-Incorporated MoS2 Ultrathin Nanosheets for Efficient Hydrogen Evolution. J. Am. Chem. Soc. 2013, 135, 17881–17888. [Google Scholar] [CrossRef]
  29. Ahmad, F.; Mushtaq, B.; Butt, F.A.; Rasheed, A.; Ahmad, S. Preparation and characterization of wool fiber reinforced nonwoven alginate hydrogel for wound dressing. Cellulose 2021, 28, 7941–7951. [Google Scholar] [CrossRef]
  30. Pandey, S.; Fosso-Kankeu, E.; Spiro, M.J.; Waanders, F.; Kumar, N.; Ray, S.S.; Kim, J.; Kang, M. Equilibrium, kinetic, and thermodynamic studies of lead ion adsorption from mine wastewater onto MoS2-clinoptilolite composite. Mater. Today Chem. 2020, 18, 100376. [Google Scholar] [CrossRef]
  31. Alavijeh, M.S.; Maghsoudpour, A.; Khayat, M.; Rad, I.; Hatamie, S. Cobalt ferrite decoration of molybdenum disulfide nanosheets; development of a nanocomposite-mediated hyperthermia method. J. Mech. Sci. Technol. 2021, 35, 1319–1325. [Google Scholar] [CrossRef]
  32. Ferreira, E.H.; Moutinho, M.V.O.; Stavale, F.; Lucchese, M.M.; Capaz, R.B.; Achete, C.A.; Jorio, A. Evolution of the Raman spectra from single-, few-, and many-layer graphene with increasing disorder. Phys. Rev. 2010, 82, 125429. [Google Scholar] [CrossRef] [Green Version]
  33. Zhang, X.; Han, W.; Wu, J.; Milana, S.; Lu, Y.; Li, Q.; Ferrari, A.C.; Tan, P. Raman spectroscopy of shear and Layer Breathing Modes in Multilayer MoS2. Phys. Rev. B 2013, 87, 1504–1509. [Google Scholar] [CrossRef] [Green Version]
  34. Su, S.; Hsu, Y.-T.; Chang, Y.; Chiu, C.; Hsu, C.-L.; Hsu, W.-T.; Chang, W.; He, H.; Li, L. Band gap-tunable molybdenum sulfide selenide monolayer alloy. Small 2014, 10, 2589–2594. [Google Scholar] [CrossRef]
  35. Cao, P.; Peng, J.; Liu, S.; Cui, Y.; Hu, Y.; Chen, B.; Li, J.; Zhai, M. Tuning the Composition and Structure of Amorphous Molybdenum Sulfide/Carbon Black Nanocomposites by Radiation Technique for Highly Efficient Hydrogen Evolution. Sci. Rep. 2017, 7, 16048. [Google Scholar] [CrossRef] [PubMed] [Green Version]
  36. Sun, Q.; Wu, Z.; Duan, H.; Jia, D. Detection of Triacetone Triperoxide (TATP) Precursors with an Array of Sensors Based on MoS2/RGO Composites. Sensors 2019, 19, 1281. [Google Scholar] [CrossRef] [PubMed] [Green Version]
  37. Sun, Q.; Wu, Z.; Zhang, M.; Qin, Z.; Cao, S.; Zhong, F.; Li, S.; Duan, H.; Zhang, J. Improved Gas-Sensitive Properties by a Heterojunction of Hollow Porous Carbon Microtubes Derived from Sycamore Fibers. ACS Sustain. Chem. Eng. 2021, 9, 14345–14352. [Google Scholar] [CrossRef]
  38. Li, J.; Yang, M.; Cheng, X.; Zhang, X.; Guo, C.; Xu, Y.; Gao, S.; Major, Z.; Zhao, H.; Huo, L. Fast detection of NO2 by porous SnO2 nanotoast sensor at low temperature. J. Hazard. Mater. 2021, 419, 126414. [Google Scholar] [CrossRef]
  39. Wu, X.; Qian, C.; Wu, H.; Xu, L.; Bu, L.; Piao, Y.; Diao, G.; Chen, M. Gestated Uniform Yolk-Shell Sn@N-Doped Hollow Mesoporous Carbon Spheres with Buffer Space for Boosting Lithium Storage Performance. Chem. Commun. 2020, 56, 7629–7632. [Google Scholar] [CrossRef]
  40. Wu, H.; Xia, L.; Ren, J.; Zheng, Q.; Xu, C.; Lin, D. A high-efficiency N/P co-doped graphene/CNT@porous carbon hybrid matrix as cathode host for high performance lithium-sulfur batteries. J. Mater. Chem. A 2017, 5, 20458–20472. [Google Scholar] [CrossRef]
  41. Rao, C.N.R.; Gopalakrishnan, K.; Govindaraj, A. Synthesis, properties and applications of graphene doped with boron, nitrogen and other elements. Nanotoday 2014, 9, 324–343. [Google Scholar] [CrossRef]
  42. Haridas, V.; Sukhananazerin, A.; Sneha, J.M.; Pullithadathil, B.; Narayanan, B. α-Fe2O3 loaded less-defective graphene sheets as chemiresistive gas sensor for selective sensing of NH3. Appl. Surf. Sci. 2020, 517, 146158. [Google Scholar] [CrossRef]
  43. Su, P.-G.; Yang, L. NH3 gas sensor based on Pd/SnO2/RGO ternary composite operated at room-temperature. Sens. Actuators B Chem. 2016, 223, 202–208. [Google Scholar] [CrossRef]
  44. Wang, Y.; Zhang, L.; Hu, N.; Wang, Y.; Zhang, Y.; Zhou, Z. Ammonia gas sensors based on chemically reduced graphene oxide sheets self-assembled on Au electrodes. Nanoscale Res. Lett. 2014, 9, 251. [Google Scholar] [CrossRef] [PubMed] [Green Version]
  45. Klinbumrung, A.; Thongtem, T.; Phuruangrat, A.; Thongtem, S. Optical and ammonia-sensing properties of SnO2 nanoparticles synthesized using a 900 W microwave. Jpn. J. Appl. Phys. 2016, 55, 085001. [Google Scholar] [CrossRef]
  46. Wang, S.; Ma, J.; Li, Z.; Su, H.; Alkurd, N.R.; Zhou, W.; Wang, L.; Du, B.; Tang, Y.; Ao, D.; et al. Surface acoustic wave ammonia sensor based on ZnO/SiO2 composite film. J. Hazard. Mater. 2015, 285, 368–374. [Google Scholar] [CrossRef] [PubMed]
  47. Fu, T. CuS-doped CuO nanoparticles sensor for detection of H2S and NH3 at room temperature. Electrochim. Acta 2013, 112, 230–235. [Google Scholar] [CrossRef]
  48. Tohidi, S.; Parhizkar, M.; Bidadi, H.; Mohammad-Rezaei, R. High-performance chemiresistor-type NH3 gas sensor based on three-dimensional reduced graphene oxide/polyaniline hybrid. Nanotechnology 2020, 31, 415501. [Google Scholar] [CrossRef]
  49. Wang, X.; Gu, D.; Li, X.; Lin, S.; Zhao, S.; Rumyantseva, M.N.; Gaskov, A.M. Reduced graphene oxide hybridized with WS2 nanoflakes based heterojunctions for selective ammonia sensors at room temperature. Sens. Actuators B Chem. 2019, 282, 290–299. [Google Scholar] [CrossRef]
  50. Garg, N.; Kumar, M.; Kumari, N.; Deep, A.; Sharma, A. Chemoresistive Room-Temperature Sensing of Ammonia Using Zeolite Imidazole Framework and Reduced Graphene Oxide (ZIF-67/rGO) Composite. ACS Omega 2020, 5, 27492–27501. [Google Scholar] [CrossRef]
  51. Wu, Z.; Zhou, C.; Zu, B.; Li, Y.; Dou, X. Contactless and Rapid Discrimination of Improvised Explosives Realized by Mn2+ Doping Tailored ZnS Nanocrystals. Adv. Funct. Mater. 2016, 26, 4578–4586. [Google Scholar] [CrossRef]
  52. Liu, X.; He, J.; Tang, D.; Liu, Q.; Wen, J.; Yu, W.; Lu, Y.; Zhu, D.; Liu, W.; Cao, P.; et al. Band alignment of atomic layer deposited high-k Al2O3/multilayer MoS2 interface determined by X-ray photoelectron spectroscopy. J. Alloys Compd. 2015, 650, 502–507. [Google Scholar] [CrossRef]
  53. Tao, J.; Yu, X.; Liu, Q.; Liu, G.; Tang, H. Internal electric field induced S–scheme heterojunction MoS2/CoAl LDH for enhanced photocatalytic hydrogen evolution. J. Colloid Interface Sci. 2021, 585, 470–479. [Google Scholar] [CrossRef] [PubMed]
  54. Zhang, Z.; Xu, M.; Liu, L.; Ruan, X.; Yan, J.; Zhao, W.; Yun, J.; Wang, Y.; Qin, S.; Zhang, T. Novel SnO2@ZnO hierarchical nanostructures for highly sensitive and selective NO2 gas sensing. Sens. Actuators B Chem. 2018, 257, 714–727. [Google Scholar] [CrossRef]
Figure 1. SEM images at different magnifications of wool fiber (a,b), wool-based carbon fiber (WCF) (c,d), MoS2 (e,f), WCF–MoS2 (g,h); element mapping of WCF (io) and WCF–MoS2 composites (pv).
Nanomaterials 12 01105 g001
Figure 2. XRD patterns of wool fiber and WCF (a), MoS2 (b), and WCF–MoS2 (c); (d) FT–IR spectra of wool fiber, WCF, MoS2, and WCF–MoS2.
Nanomaterials 12 01105 g002
Figure 3. Raman spectra of wool fiber and WCF (a) and WCF–MoS2 (bd).
Nanomaterials 12 01105 g003
Figure 4. (a) XPS spectra of WCF and WCF–MoS2. High-resolution spectra of Mo 3d (b), P 2p (c), C 1s of WCF (d), C 1s of WCF–MoS2 (e), O 1s of WCF (f), O 1s of WCF–MoS2 (g), S 2p of WCF (h), S 2p of WCF–MoS2 (i), N 1s of WCF (j), N 1s of WCF–MoS2 (k). (l) Schematic diagram of highly defective graphene formed on the surface of WCF.
Nanomaterials 12 01105 g004
Figure 5. Sensing curves of MoS2, WCF, and WCF–MoS2 to 1000 ppm of NH3 (a), the 85% relative humidity (RH) (b), 1000 ppm of HCHO (c), 1000 ppm of C3H6O (d), and 1000 ppm of C2H5OH (e).
Nanomaterials 12 01105 g005
Figure 6. (a) Average responses; (b) enlarged part of (a); (c) response times; and (d) recovery times corresponding to the sensing curves for MoS2, WCF, and the WCF–MoS2 composite; (e) sensing curves of WCF–MoS2 to different concentrations of NH3; (f) fitting plots of the response vs. the concentration of NH3.
Nanomaterials 12 01105 g006
Figure 7. UPS spectra: (a) WCF; (b) MoS2. Energy band structures: (c) WCF and MoS2; (d) the WCF–MoS2 composite. (e) Sensing mechanism of the WCF–MoS2 composite to NH3.
Nanomaterials 12 01105 g007
Table 1. Sensing performances of the recently reported NH3 sensors.
MaterialsConcentration
(ppm)
Temperature (°C)Response (%)Response Time (s)Recovery Time (s)Limit
of Detection (LoD; ppb)
Reference
Py-rGO50200-134310-[44]
SnO21055350-937-[45]
SnO2/Pd/RGO5RT7.625,2003000-[43]
ZnO/SiO250RT----[46]
CuS---5543-[47]
3D RGO/PANI50RT11370675-[48]
α-Fe2O3/graphene1025013.5152648-[42]
rGO-WS21033.512160300-[49]
ZIF-67/rGO50RT47746.466.574[50]
CMTs50RT36216463[37]
ZnO/CMTs20911449
WCF-MoS23RT816519.1Present work
Publisher’s Note: MDPI stays neutral with regard to jurisdictional claims in published maps and institutional affiliations.

