Abstract
A new, stable and high-catalytic activity ferrocene-doped polystyrene nanosphere (PNFer) sol was prepared by the hydrogel procedure and characterized by electron microscopy and molecular spectroscopy. Results show that the nanosol exhibits excellent catalysis of the new indicator nanoreaction between AgNO3 and sodium formate to generate nanosilver with strong surface-enhanced Raman scattering (SERS), resonance Rayleigh scattering (RRS) and surface plasmon resonance absorption (Abs) trimode molecular spectral signals. This new nanocatalytic amplification trimode indicator reaction was coupled with the G-quadruplex DNAzyme catalytic amplification of Pb2+ aptamer to fabricate a new SERS quantitative/RRS/Abs assay platform for the determination of ultratrace amounts of Pb2+. The Pb2+ content in water samples was analyzed with satisfactory results.
1. Introduction
Lead (Pb) is a toxic heavy metal; it has caused great concern due to its damage to the kidneys and nervous system. The measurement of trace Pb2+ is becoming more and more common and urgent in the food safety, environmental, clinical and toxicology fields. At present, methods for the determination of Pb include dithizone colorimetry, flame atomic absorption spectrometry, graphite furnace atomic absorption spectrometry, hydride generation atomic fluorescence spectrometry, catalytic polarography and so on [1,2]. The atomic spectral methods use large-scale instruments with high costs. Classical dithizone colorimetry demonstrates low sensitivity and some toxic reagents are used, which poses a threat to the health of inspectors. Recently, some new methods for Pb have been attractive to analysts. One of the most important methods is the aptamer (Apt) assay, which is simple with good selectivity. Based on the interaction between single-stranded DNA (ssDNA) and nanogold (AuNPs), a turn-on plasmonic absorption assay for the detection of 8.0 nM Pb2+ was fabricated [3], and the sensitivity was not high. Acoupled DNAzyme-activated hybridization chain reaction with bio-barcodes and a surface-enhanced Raman scattering (SERS) were developed for assay of Pb2+ with a dynamic range of 1.0 × 10⁻¹³ M to 1.0 × 10⁻⁷ M [4]. However, the SERS signal was not linear to the concentration. In addition, the process was complicated. Thus, it is necessary to develop a simple and sensitive Apt method for Pb2+-based DNAzyme and nanozyme catalytic amplification. To our best knowledge, there are no reports about the preparation of a stable and high-catalytic activity ferrocene (Fer)-doped polystyrene nanosphere (PNFer) sol, the PNFer-AgNO3- sodium formate (SF) nanosilver indicator reaction, or the coupled DNAzyme catalytic reaction to co-amplify the SERS/resonance Rayleigh scattering (RRS)/absorption (Abs) trimode signals for determination of ultratrace Pb2+.
DNA enzymes (DNase) were synthesized simply by Apts, with the advantages of specificity, low costs and good stability. The method has been used in analytical chemistry, such as in metal ion and protein detection [5,6,7,8,9]. Zhang et al. [10] proposed a lead ion detection method without labeling reported molecules. Pb2+ induces chemically modified DNase to cleave unlabeled substrates to amplify the response signal, with a detection limit of 0.12 nM Pb2+ and linear range of 0.1–30 nM. SERS technology can provide a wealth of structural information, and its sensitivity can even reach the single-molecule level. It is a powerful tool for trace bioanalysis and material characterization [11,12,13]. Although some metal ions such as Pb(II) exhibit no SERS signal, clever strategies can be used to detect them, such as complexes and SERS probes [14,15,16]. Due to their simplicity, multiple options and sensitivity, bimodal molecular probes are more widely used than the single-mode sensor. They include two-mode analysis of fluorescence/colorimetry, fluorescence/light scattering, fluorescence/SERS etc. They can display multiple output signals to realize double detection of the analyte to be tested [17,18,19]. Recently, Li et al. [20] developed a SERS/RRS dual mode aptamer assay platform for quantification of trace pollutants such as urea, based on single-atom Fe-doped carbon dot nanocatalytic amplification.
Polystyrene is a stable and common organic polymer which has been used in the field of immunoassay as a microsphere carrier. Recently, there has been interest in utilizing a combination of polystyrene nanoparticles for spectral and electrical analysis, such as the detection of trace amounts of H2O2, dithiothreitol and Pb(II) [21,22,23]. Ferrocene (Fer) has a sandwich structure with d–π interactions between the Fe(II) center and the cyclopentadienyl moieties, which makes it unique in terms of its chemical properties such as being an electron-rich molecule, which is often used to promote electron transfer; this property allows it to be utilized in chemical sensors, including fluorescent and electrochemical sensors for the detection of Pb2+ [24,25,26]. Xu et al. prepared Fer–triazole derivatives for multisignaling detection of Cu2+ [27]. In this paper, a soap-free emulsion polymerization procedure was used to prepare ferrocene-doped polystyrene nanosphere (PNFer), and its nanocatalytic reaction was coupled with the DNAzyme catalytic reaction to construct a trimode method for ultratrace Pb2+.
2. Materials and Methods
2.1. Instruments and Reagents
Resonance Rayleigh scattering spectra were scanned by a Hitachi F-7000 FL spectrophotometer (Hitachi High-Tech Co., Ltd., Tokyo, Japan). The absorption spectrum was measured with a TU-1901 dual-beam ultraviolet-visible spectrophotometer (Beijing Puxi General Instrument Co., Ltd. Company, Beijing, China). A DXR smart Raman spectrometer (Thermo Company, Waltham, MA, USA) was used to obtain SERS spectra with a laser wavelength of 633 nm, a laser power of 3.0 mW, a slit of 25 µm, and an acquisition time of 5 s. A 16K desktop centrifuge (Zhuhai Dark Horse Medical Instrument Co., Ltd., Zhuhai, China); KQ3200DB CNC ultrasonic cleaner (Kunshan Ultrasonic Instrument Co., Ltd., Nanjing, China, ultrasonic electric power 150 w, working frequency 40 KHz); HH-2 electric heating constant-temperature water bath (Shanghai Weicheng Instrument Co., Ltd., Shanghai, China); SYZ-550-type quartz sub-boiling water distiller (Jiangsu Jingbo Instrument Factory, Nanjing, China); DHG-9023A electric heating constant-temperature blast drying oven (Shanghai Jinghong Experimental Equipment Co., Ltd., Shanghai, China); FB224 automatic internal school electronic analytical balance (Shanghai Sunny Hengping Scientific Instrument Co., Ltd., Shanghai, China); DF-101S type heat-collecting constant-temperature heating magnetic stirrer (Gongyi Yuhua Instrument Co., Ltd., Zhengzhou, China); GL-25MS type low-temperature high-speed centrifuge (Shanghai Luxiangyi Centrifuge Instrument Co., Ltd., Shanghai, China); Nanoparticle size and Zeta potential analyzer (Malvern Co., Malvern, UK); S-4800 field emission scanning electron microscope (Hitachi High-Tech, Tokyo, Japan) and Talos F200S transmission electron microscope (Thermo Fisher Scientific China Co., Ltd., Shanghai, China) were used.
A Pb2+ aptamer with sequence of 5’-3’ GGT TGG TGT GGT TGG (Sangong Bioengineering Co., Ltd., Shanghai, China); Styrene (CP, Guangxi Long Science Co., Ltd., Nanning, China); Chloroauric acid (AR, Shanghai Mike Lin Biochemical Co., Ltd., Shanghai, China); Potassium persulfate (GR, Tianjin Komiou Chemical Reagent Co., Ltd., Tianjin, China); Sodium lauryl sulfate (SDS, Guangzhou Medical Station Chemical Reagent Company, Guangzhou, China); Sodium bicarbonate (AR, Guangxi Donglong Chemical Co., Ltd., Nanning, China); pH 4.4 NaAc-HAc buffer solution mixed 3.7 mL 0.2 mol/L NaAc solution and 6.3 mL 0.2mol/L HAc solution to a 10 mL; 1.00 mM Pb2+ (PbNO3); 1 M AgNO3; 0.1 mM acetic acid; 0.1 M sodium acetate; 1 M sodium formate (SF); Ferrocene (Fer) (AR, Tianjin Zhiyuan Chemical Reagent Co., Ltd., Tianjin, China); 0.1 μM heme (HM) (Tianjin Zhiyuan Chemical Reagent Co., Ltd., Tianjin, China); 10−5 M Vitoria blue B (VBB); 10−5 M Victoria blue 4R (VB4R) (Tianjin Zhiyuan Chemical Reagent Co., Ltd., Tianjin, China); and 10−5 M rhodamine 6G (Rh6G) (Tianjin Zhiyuan Chemical Reagent Co., Ltd., Tianjin, China) were used. For the preparation of the CO-saturated solution, 20 mL of deionized water was added to a 30 mL gas collection bottle and placed into a 25 °C water bath. Under standard atmospheric pressure, CO gas was poured into it for 10 min to prepare 0.93 mM CO saturated solution. For preparation of the Tris-HCl buffer solution, 510 μL of 0.1 M HCl solution was added to 500 μL of 0.1 M Tris solution. For preparation of the Fer solution, 100 mg of Fer and 0.1 g of sodium lauryl sulfate (SDS) were added to a 200 mL three-necked flask, then 100 mL of water was added, the solution was stirred at constant temperature for 1 h, and the concentration according to the added Fer was calculated as 5.37 mM, diluted step-by-step. For the preparation of oxide of 3,3’,5,5’-tetramethylbenzidine (TMBox), 100 mg 3,3’,5,5’-tetramethylbenzidine (TMB) (AR, Tianjin Zhiyuan Chemical Reagent Co., Ltd., Tianjin, China) was weighed in a 250 mL Erlenmeyer flask under ultrasonic conditions, 35 mL absolute ethanol, 8.3 mL 0.01 M NaOH, 18.9 mL 1 M H2O2 and 18.2 mL 0.1 M Tris-HCl were added. After 45 min in a 45 °C water bath, the solution turned dark blue. Then, the solution was freeze-dried to obtain a TMBox solid. Next, 0.0031 g TMBox was dissolved in 5 mL secondary water to obtain 0.62 mg/mL TMBox. In the experiment, it was diluted and used step by step. The reagents used were analytically pure, and the experimental water was boiled twice before use.
Preparation of polystyrene nanospheres: Preparation of polystyrene nanospheres (PN) was as follows, 5, 10, 15, and 20 mL styrene, respectively, were added into a 500 mL three-necked flask containing 20 mL water, and passed through nitrogen to exclude air. Following this, 0.1 g SDS was added and heated at 70 °C for 1 h under stirring. Next, 0.1 g potassium persulfate and 0.1 g NaHCO3 were added, diluted to 100 mL with water, reacted for 10 h to complete the reaction, and let cool to room temperature. The obtained white emulsion was centrifuged at a low speed to remove the unreacted styrene on the upper layer, dialyzed with a 500 Da dialysis membrane for 12 h to remove inorganic salts, and finally the obtained polystyrene nanosphere (PN) solution was vacuum-dried to a constant weight. A white powdery PN was obtained, which was numbered PN1-4 according to the quality of the styrene. Finally, 0.10 g PN1-4 was dissolved in 100 mL water to prepare a 1 g/L solution, and diluted step by step during use.
Preparation of ferrocene-doped polystyrene nanozyme: For PNFer1-3 preparation, 20, 50, 100 mg Fer, 15 mL styrene, and 0.1 g SDS were added, respectively, into a 500 mL three-necked flask containing 20 mL deionized water, and passed through nitrogen to remove air. It was heated at 70 °C for 1 h under stirring. Next, 0.1 g potassium persulfate and 0.1 g NaHCO3 were added, diluted to 100 mL with water, reacted for 10 h to complete the reaction, and let cool to room temperature. The obtained white emulsion was centrifuged at a low speed to remove the unreacted styrene on the upper layer, dialyzed with a 500 Da dialysis membrane for 12 h to remove inorganic salts, and finally the obtained ferrocene-doped polystyrene nanosphere (PNFer) solution was dried under vacuum to constant weight. A light yellow powdered PN was obtained, which was numbered PNFer1, PNFer2, or PNFer3 according to the different mass ratio of ferrocene to styrene. Finally, 0.10 g PNFer was dissolved in 100 mL water to prepare a 1 g/L solution, and diluted step by step during use.
2.2. Procedure for RRS and SERS Detection of Pb2+
In a 5 mL graduated tube with stopper, 100 µL 100 mg/L polystyrene nanoparticle solution, 150 µL pH 4.4 NaAc-HAc buffer (88.8 mM in NaAc concentration), 120 µL 0.1 µM Apt, 90 µL 0.1 µM heme and a certain concentration of Pb2+ solution were added, then mixed well. After 15 min, 100 µL 0.01 M AgNO3 and 80 µL 1.0 M formate were added, diluted to 1.5 mL and shaken well, placed in a water bath at 85°C for 10 min, and cooled with ice water to terminate the reaction. The solution was placed in a quartz four-way cuvette, at 350 V, excited slit = emission slit = 5 nm, and a fluorescence spectrophotometer was used to record the RRS signal at 370 nm (I370nm). With no Pb2+ as a blank, the RRS peak at 370 nm (I370nm)0 was measured and ΔI = I370nm − (I370nm)0 was calculated. Then 50 μL of 10 μM VBB was added to the reaction solution, the Raman signal recorded at 1618 cm−1 under the power of 2.0 mW and a slit of 25.0 nm, and the value of ΔI1618 cm−1 = I1618 cm−1 − (I1618 cm−1)0 obtained.
3. Results and Discussion
3.1. Analysis Principle
At 70 °C, potassium persulfate was used as the initiator and sodium lauryl sulfate sodium as the surfactant to initiate the polymerization reaction of styrene to form polystyrene nanospheres (PN). When Fer was added, the PNFer was obtained (Figure 1). Under room temperature, AgNO3-SF is unreactive. When nanospheres were added as a catalyst, the reaction can be completed within a few minutes. When Apt was added, because Apt has a better affinity with the nanospheres, Apt will coat the surface of the nanospheres to reduce its catalytic activity, and will therefore produce low SERS/RRS/Abs signal. When Pb2+ was added, Apt will specifically bind to Pb2+, and at the same time, it will combine with the existing heme (HM) to form DNase. Both DNase and the released nanospheres have a catalytic effect on the AgNO3-SF indicator reaction to enhance the trimode signals of SERS/RRS/Abs. Thus, a highly sensitive, low-cost trimode assay platform was proposed for the detection of Pb2+.

Figure 1.
Preparation of ferrocene-doped polystyrene nanospheres and trimode detection of trace Pb2+ based on ferrocene-doped polystyrene and DNA enzyme cocatalysis of AgNO3-sodium formate nanosilver indicator reaction.
3.2. Characterization of PNFer and Nanocatalytic Analysis System
Figure 2a–d are electron microscope images of PN3, PNFer3, PNFer3-Apt-Pb2+-AgNO3-SF and PNFer3-Apt-AgNO3-SF systems. It can be seen that the PN3 average particle size was larger than that of PNFer3, indicating that after PN doping with the electron-rich molecule Fer, the particle size became small and the particle size distribution was uniform. This may be related to the increase in electron density and intermolecular forces. The energy spectrum (Figure 2b) shows that there are three peaks at 0.46, 6.4 and 7.1 keV, ascribed to the Fe element of Fer. There are less spherical AgNPs in the blank system due to the inhibition of Apt, and the average size is 42 nm (Figure 2c). Upon addition of Pb2+, the Apt reaction turned on the catalytic AgNP nanoreaction to form a large number of AgNPs with an average size of 25 nm (Figure 2d). Both energy spectra demonstrated that there was a peak at 3.0 keV ascribed to the Ag element (Figure 2c,d).
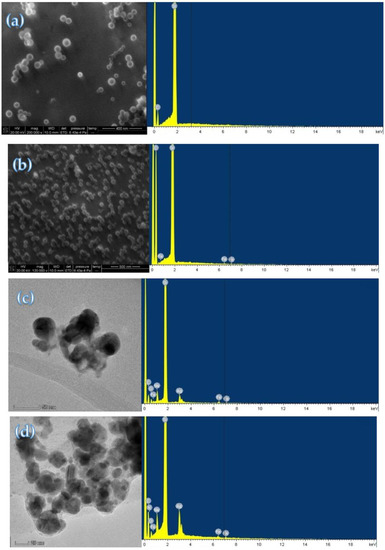
Figure 2.
Electron microscope images and energy spectra of PNFer and nanocatalytic analysis system. (a) 6.67 mg/L PN3; (b) 6.67 mg/L PNFer3; (c) 6 nM HM + 8 nM Apt + 6.67 mg/L PNFer3 + 0.67 mM AgNO3 + 53.2 mM SF; (d) 1.0 nM Pb2+ + 6 nM HM + 8 nM Apt + 6.67 mg/L PNFer3 + 0.67 mM AgNO3 + 53.2 mM SF.
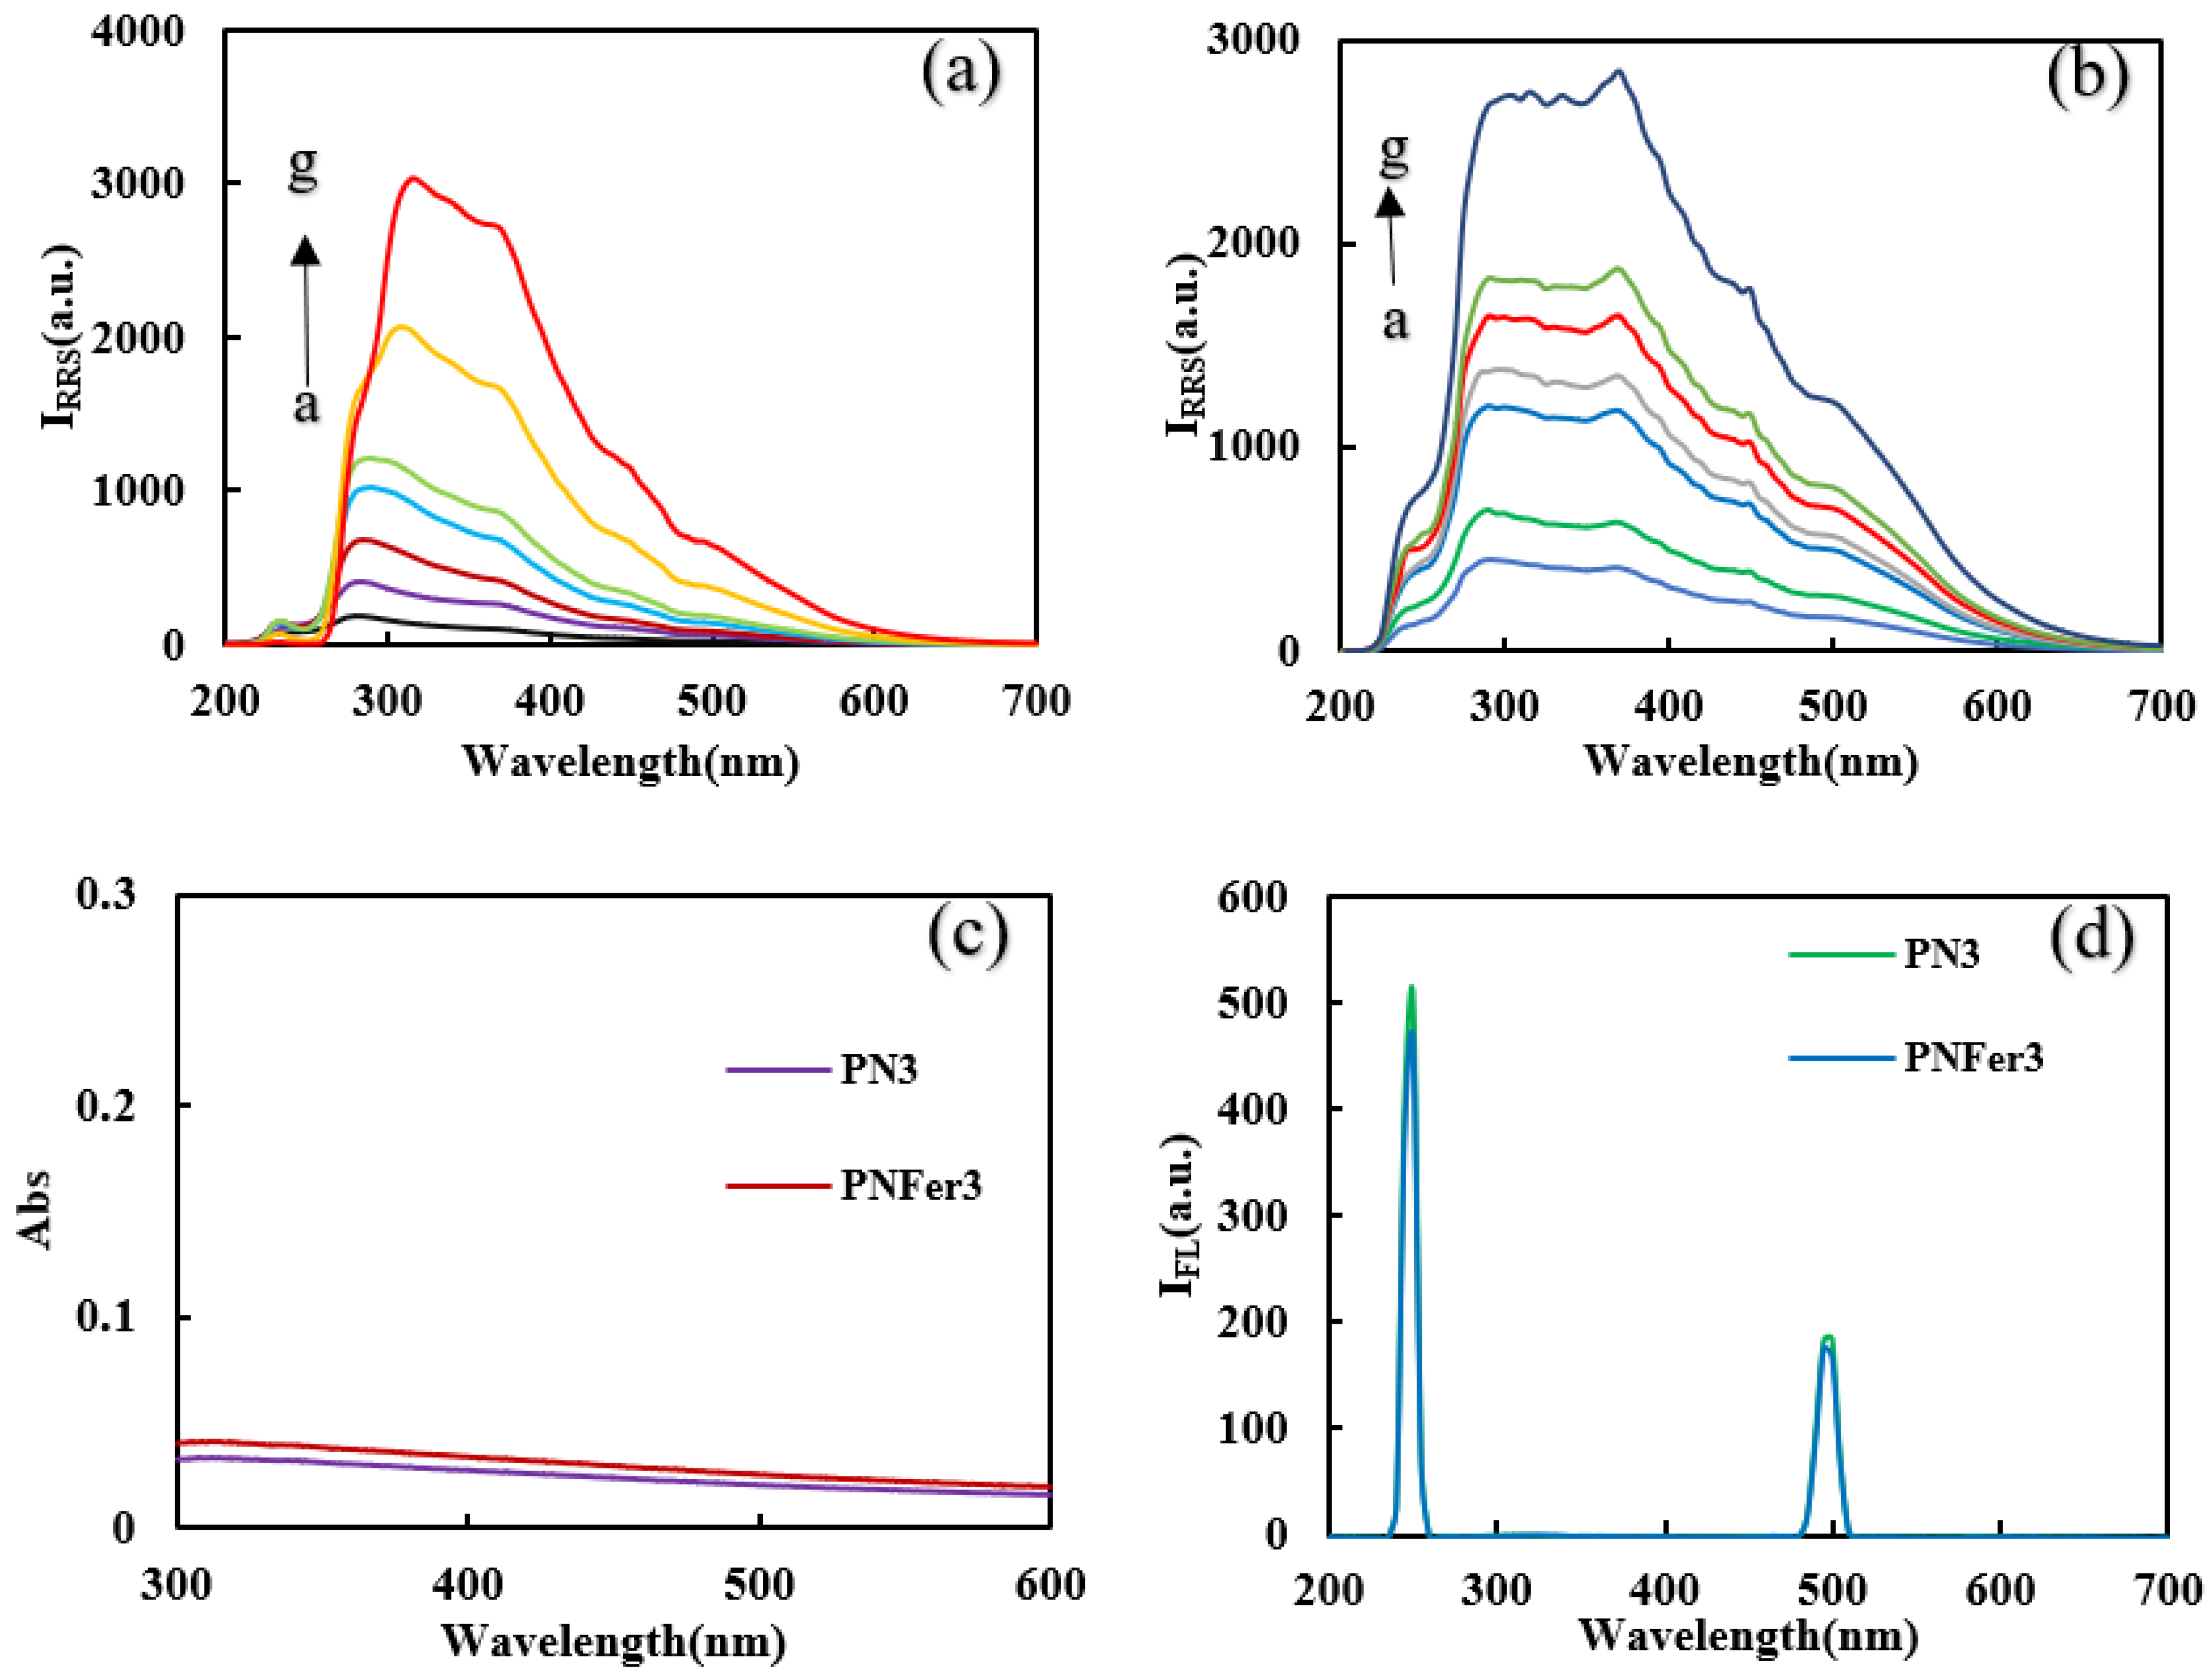
Molecular spectra and X-ray diffraction (XRD)characterization of PN3and PNFer3: RRS is a simple and sensitive technique for studying nanoparticles, and was chosen for use. Figure 3a,b show that the 20 mg/L PN3 and 20 mg/L PNFer3 exhibit the biggest RRS peak at 320 nm and 360 nm respectively. As the PN3 and PNFer3 concentration increases, the RRS signal increases linearly, due to the particle numbers increased. Figure 3c shows that there are no UV absorption peaks for both materials. Figure 3d shows the emission spectra of nanomaterials at an excited wavelength of 250 nm, none of the both shows any fluorescence peak, the two peaks are ascribed to Rayleigh scattering. The SERS spectra of PN3 and PNFer3 materials were studied, and no SERS signal appeared. The nanomaterial was prepared according to the experimental method, was vacuum-freeze-dried to obtain the solid samples, and was recorded with a Fourier transform infrared spectrometer. Figure 4a shows the infrared spectra of PN3 and PNFer3. Among them, 760 cm−1 is the vibration peak caused by CH that is not in the plane of styrene, and the stretching vibration peaks caused by CH at 2859 and 2926 cm−1 are 3023 cm−1. The nearby characteristic peaks were caused by the =CH stretching vibration. At the same time, the medium-strong peak at 1598 cm−1 indicates that =CH exists in aromatic substances. The two characteristic peaks at 1450 and 1495 cm−1 directly show that the material was synthesized from styrene, and the stretching vibration peak of C=C does not appear at 1640 cm−1, indicating that styrene has polymerized to form polystyrene. The characteristic peak at 3075 cm−1 was the stretching vibration peak caused by CH in Fer, and the characteristic peak at 1101 cm−1 was caused by the σ bond formed by the metal ion and the phenyl compound, indicating that the doped Fer has a certain effect. Figure 4b shows that in the range of 2θ = 15–25°, there are a wide range of structural belts composed of disordered carbon elements in the two materials. The FeC structure formed by Fer and polystyrene appeared in the range of 2θ = 31° and 44° in PNFer3, indicating that the doping of Fer was successful.
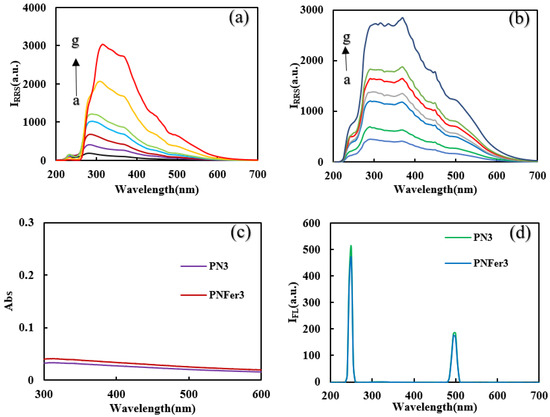
Figure 3.
RRS, Abs and fluorescence spectra of polystyrene nanospheres. (a) RRS spectra of the curves a to g: (0.5, 1, 2, 3, 5, 10, 20) mg/L PN3; (b) RRS spectra of the curves a to g: (0.5, 1, 2, 3, 5, 10, 20) mg/L PNFer3; (c) Abs spectra of 10 mg/L PN3 and PNFer3; (d) fluorescence spectra of 10 mg/L PN3 and PNFer3.
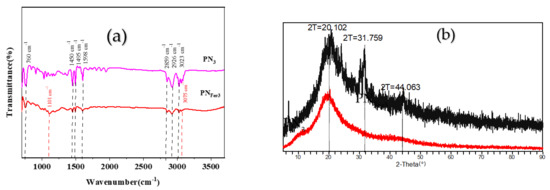
Figure 4.
Infrared spectra and XRD pattern of polystyrene nanospheres. (a) Infrared spectra of PN3 and PNFer3; (b) XRD of PN3 and PNFer3.
3.3. SERS, RRS and Abs Spectra of Nanocatalysis System
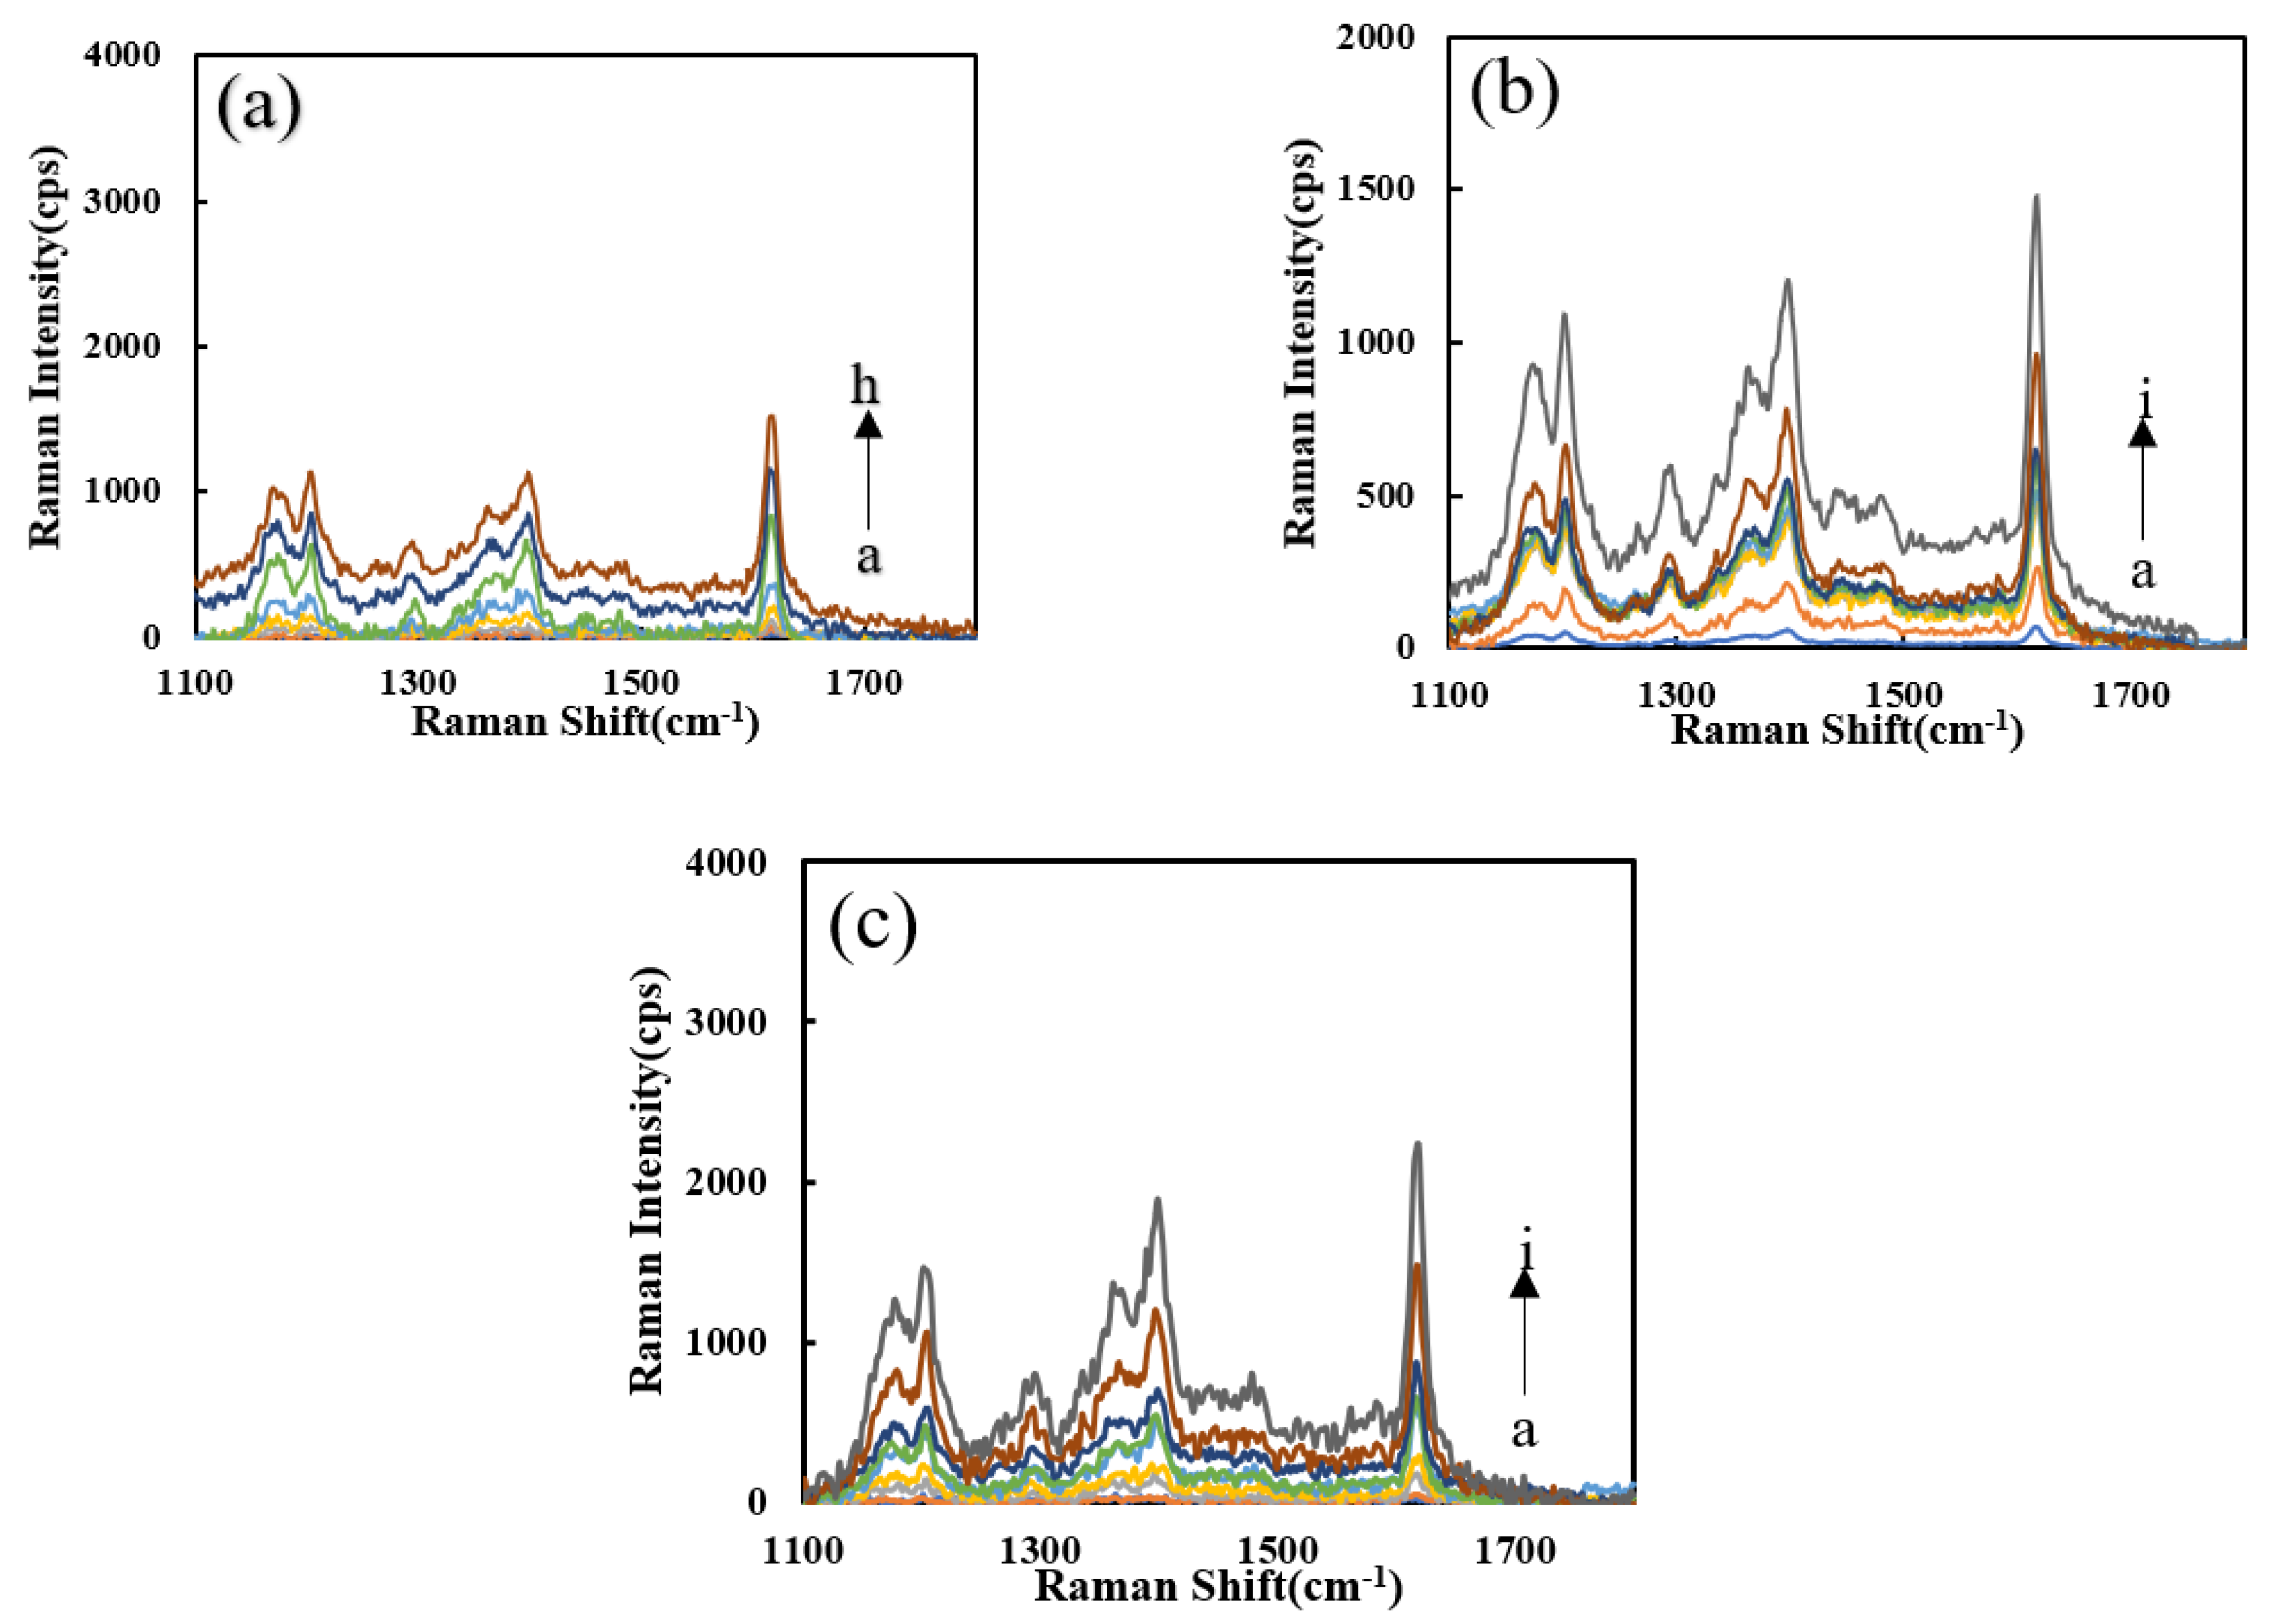
The effects of the four probes (VBB, VB4R, TMBOX, and Rh6G) on the system were studied (Figure S1a–d). With an increased Pb2+ concentration, the SERS peaks increased due to the formation of more SERS active AgNPs. It can be seen that the system has higher signal intensity, less interference of spurious peaks and better sensitivity upon addition of VBB, so the VBB molecular probe was selected for use. The Pb2+-Apt-heme-PN3-AgNO3-formate-VBB system shows strong peak changes at the Raman shifts of 1167, 1202, 1398, and 1614 cm−1. The SERS effect at 1617 cm−1 was ascribing to the vibration of C=C in the benzene ring frame. Figure S1e shows that PN3 has a good catalytic performance for the AgNO3-SF reaction, and the SERS signal was positively correlated with the PN3 concentration. Figure S1f shows that with the increase in Apt, its inhibitory effect in the Apt-PN3-AgNO3-formate system gradually decreases due to the formation of fewer AgNPs. Figure S1g shows that with the increase in heme content, the catalytic capacity of the DNase produced increases, but the catalytic performance was limited. Figure 5a shows that as regards the heme-Apt-Pb2+-PN3-AgNO3-formate system, under the action of two enzymes, the reaction system has a good detection ability for Pb2+. In the comparison of the catalytic performance of the heme-Apt-Pb2+-AgNO3-formate detection system (Figure 5b,c), the PNFer3 signal was the strongest and was chosen for the assay.
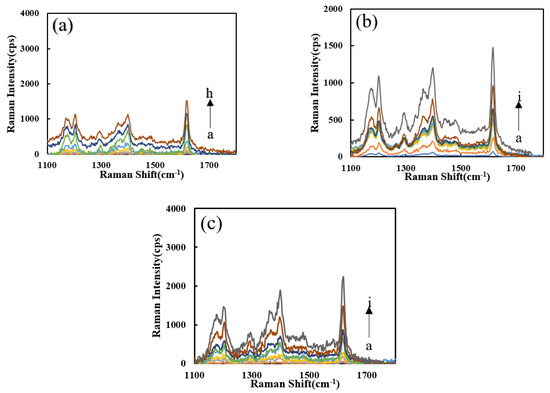
Figure 5.
SERS spectra of the analysis system. (a) a to h: (0, 0.067, 0.13, 0.2, 0.27, 0.33, 0.67, 1) nM Pb2+ + HM + Apt + PN3 + AgNO3 + SF + VBB; (b) a to i: (0, 0.05, 0.1, 0.2, 0.3, 0.4, 0.5, 1, 2) nM Pb2+ + PN3 + Apt + HM + AgNO3 + SF; (c) a to i: (0, 0.05, 0.1, 0.2, 0.3, 0.4, 0.5, 1, 2) nM Pb2+ + PNFer3 + Apt + HM + AgNO3 + SF.
Results (Figure S2a) show that after adding PN3, the RRS signal of the system was much higher than the blank without PN3, which proves that PN3 has a catalytic effect on the AgNO3-formate system. The RRS signal has a positive correlation with the PN3 concentration. After selecting the appropriate PN3 concentration and adding Apt (Figure S2b), because Apt coats on the surface of PN3, its catalytic performance was reduced. Therefore, as Apt increases, the lower the RRS signal produced due to the formation of fewer nanosilvers. When Pb2+ was added, the Pb2+-Apt complex detaches from the surface of PN3 and combines with heme to form a DNase. With the increase in heme, DNase increases, the catalytic ability becomes stronger, and the RRS signal increases linearly (Figure S2c). Figure 6a shows that when Pb2+ increases, the Pb2+-Apt complex detaches from the PN3 surface, releases more PN3, and the catalysis is enhanced. The more DNase formed, the stronger the catalytic effect on the system, and the RRS signal increases linearly with the concentration of Pb2+. Figure 6b,c are the RRS spectra of PN3/PNFer3 and DNase for the detection of Pb2+. In contrast, the PNFer3 was the most sensitive, and was chosen for use.
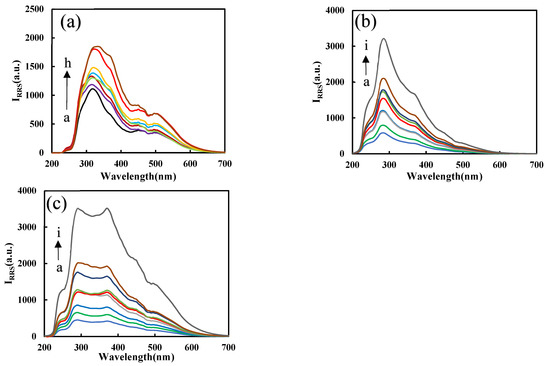
Figure 6.
RRS spectra of the analysis system. (a) a to h: (0, 0.067, 0.13, 0.2, 0.27, 0.33, 0.67, 1) nM Pb2+ + Apt + PN3 + AgNO3 + SF. (b) a to i: (0, 0.05, 0.1, 0.2, 0.3, 0.4, 0.5, 1, 2) nM Pb2+ + PN3 + Apt + HM + AgNO3 + SF; (c) a to i: (0, 0.05, 0.1, 0.2, 0.3, 0.4, 0.5, 1, 2) nM Pb2+ + PNFer3 + Apt + HM + AgNO3 + SF.
Figure S3a shows that the absorption peak at 430 nm increased with the PN3 catalyst concentration increasing, and the yellow gradually deepened. The corresponding UV absorption signal also increases linearly with the increase in PN3 concentration due to the formation of more nanosilvers, which also shows that PN3 material has excellent catalytic ability. The peak was ascribed to the surface plasmon resonance absorption peak of nanosilvers. Figure S3b shows that the acetic acid–sodium acetate buffer with ph = 4.4 is the best condition. Figure S3c shows that as the Apt increases, the more PN3 is coated by Apt and the stronger the inhibition ability for the AgNO3-formate reaction, and it shows that the UV absorption signal decreases linearly with the concentration of Apt. Figure S3d shows that as the concentration of HM increases, the DNase produced gradually increases and the catalytic ability increases. As the concentration of Pb2+ increases, the released PN3 increases, the DNase generated gradually increases, and the catalytic ability increases due to the formation of more nanosilvers (Figure 7a). Figure 7b,c show that PNFer3 has the strongest Abs signal in the determination of Pb2+ and has a higher correlation. Comparing the linear equations, it is found that the PNFer3 has the best catalytic performance, and the result is the same as the RRS result.
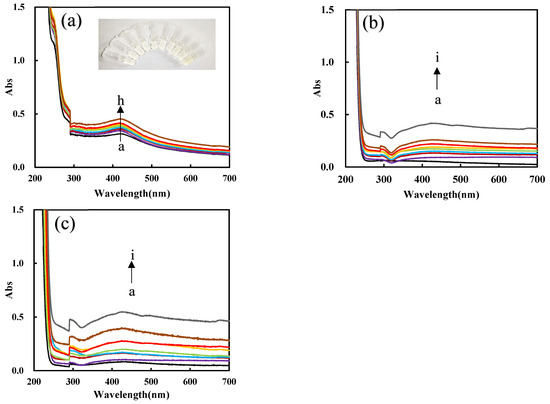
Figure 7.
UV absorption spectra of the analysis system. (a) a to h: (0, 0.067, 0.13, 0.2, 0.27, 0.33, 0.67, 1) nM Pb2+ + HM + Apt + PN3 + AgNO3 + SF; (b) a to i: (0, 0.05, 0.1, 0.2, 0.3, 0.4, 0.5, 1, 2) nM Pb2+ + PN3 + Apt + HM + AgNO3 + SF; (c) a to i: (0, 0.05, 0.1, 0.2, 0.3, 0.4, 0.5, 1, 2) nM Pb2+ + PNFer3 + Apt + HM + AgNO3 + SF.
3.4. Catalytic Reaction Mechanism of Nanoenzymes and DNase
Formate and silver nitrate can generate porous silver [28], but this reaction requires a microwave reaction vessel to keep pressure and temperature. Under the experimental conditions, it is difficult for the reaction between AgNO3 and SF to take place. After adding the catalyst, a fast reaction can be realized, AgNO3 is reduced to AgNPs, and SF is oxidized to CO2. Table S1 shows a comparison of the linear equations for catalysis of several nanomaterials. It can be seen that PNFer3 has the strongest catalytic performance, with the highest slope. The catalysis of PNFer3 with slope of 236.6 was larger than the sum (109.7 + 9.81 = 119.51) of PN3 (109.7) and Fer (9.81), in the SERS method. This was related to the coupling of PN3 and Fer electrons.
Figure 8 shows a schematic diagram of the catalytic mechanism of PNFer3 to enhance the signal. In the absence of nanocatalyst, the nanoreaction speed is slow, the product is small, and the RRS/SERS/Abs signal is low. PNs have a small particle size, large specific surface area, and can be stably and uniformly dispersed in aqueous solution. The surface of PNs provides reaction sites for the AgNO3 and SF reaction system. Fer is rich in electrons and has good thermal and chemical stability [29]. Due to poor water solubility, it is rarely used in aqueous solution. The use of polystyrene nanospheres doped with ferrocene can effectively solve this problem. The excellent electronic conductivity of ferrocene enhances the catalytic performance of PNs. After optimizing the proportion of doped-ferrocene, high-efficiency catalytic performance PNFer3 can be achieved. The main reason is that the nanosurface electrons and the electrons of Fer were coupled organically to enhance the electron density. Those electrons accelerate Ag+-formate redox electron transfer to enhance the nanoreaction.
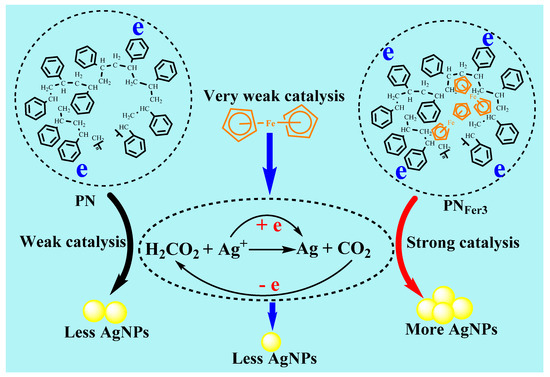
Figure 8.
Comparison of polystyrene nanosphere (PN), Fer and ferrocene-doped polystyrene nanosphere (PNFer3) nanocatalysis of AgNO3-SF reaction to form AgNPs.
3.5. Conditional Selection
As the concentration of PNFer3 increased, the RRS signal gradually increased due to the formation of more nanosilvers (Figure S4a). When the concentration of PNFer3 exceeded 6.67 mg/L, the RRS signal of the solution decreased sharply due to nanosilver aggregations. Therefore, the concentration of 6.67 mg/L PN3 in this experiment was chosen. When the NaAc-HAc buffer concentration calculated with NaAc is 8.88 mM (pH = 4.4), the RRS signal change value of the system is the largest, so the NaAc-HAc buffer condition was selected (Figure S4b,c). As the concentration of Apt increases, the system produced a stronger RRS signal (Figure S4d). However, when the Apt concentration was greater than 8 nM, too much Apt will encapsulate PNFer3, causing the amount of catalyst in the system to decrease, and the RRS signal will decrease. So, 8 nM Apt was selected in this experiment. For the same reason, when the concentration of HM is low, it has a positive effect on the system, and when its concentration is greater than 6 nM, it will affect the catalytic performance and cause the signal to decrease (Figure S4e). Therefore, the concentration of HM was selected as 6 nM. As shown in Figure S4f, the reaction temperature should be maintained above 75 °C. If the temperature is too low, the reaction cannot be started. If the temperature is too high, the enhanced blank that caused the analytical signal will decrease. At 85 °C, the analytical signal is the strongest. A reaction time of 15 min was optimal (Figure S4g). The above conditions were selected for use.
3.6. Work Curve
Under the chosen experimental conditions, the working curve was plotted with different concentrations of the analyte and the corresponding signal intensity changes. The analysis characteristics are shown in Table 1. Among the working curves for Pb2+ determination, the PNFer3 SERS analytical system was more sensitive than the RRS and Abs, with a detection limit (DL) of 0.03 nM. In addition, the linear range was widest. Compared with the RRS and Abs methods, the blank of the SERS system was very low due to the large AgNPs with low SERS activity. Thus, the PNFer3 catalytic SERS analysis system was used to measure Pb2+. Obviously, the two methods were simpler than the SERS, without molecular probes of VBB. Of course, the Abs method had the lowest cost. Compared with the reported methods (Table S2) [30,31,32,33,34,35,36,37,38], this method is one of the more sensitive methods.

Table 1.
Analytical characteristics of Pb2+ determination with different nanozymes.
3.7. Influence of Coexisting Substances
According to the experimental method, the relative error was within ±10%, and the influence of coexisting substances on the detection of 1 nM Pb2+ (Table S3) was investigated. The results show that some common ions have little effect on the determination of Pb2+, indicating that this method has better selectivity.
3.8. Sample Analysis
The samples, two of farmland water, two of lake water, and one of industrial wastewater, were taken with sampling bottles. Each 10 mL water sample was filtered with filter paper to remove suspended solids, then centrifuged at 12,000 rpm/g for 10 min, and finally filtered with a 0.45 μm microporous filter membrane. It was diluted to obtain the sample solution. The SERS method of the PNFer3-Pb2+-Apt-HM-AgNO3-SF system was used to determine Pb2+ content five times. Then, a certain amount of Pb2+ was added to the sample to obtain the recovery (Table 2). These results were agreement with that of atomic absorption spectrometry, the relative standard deviation (RSD) was between 3.7% and 7.8%, and the recovery rate was between 91.2% and 108.7%. Those indicate that the SERS assay was accurate and reliable.
Table 2.
Analytical results of Pb2+ in water samples.
4. Conclusions
A stable and high-catalytic activity ferrocene-doped polystyrene nanosphere sol catalyst was prepared. It was found that it can effectively catalyze the AgNO3-SF reaction to generate nanosilver with strong SERS/RRS/Abs trimode signals. The Apt of analyte lead ion was added to inhibit the catalytic ability. When the analyte lead ion exists, Apt combined with lead ions to generate G-quadruplex DNA enzyme in the presence of heme, and released ferrocene-doped polystyrene nanospheres. This DNA enzyme can also catalyze the AgNO3-SF reaction to generate nanosilver. Thus, a new di-enzyme trimode analysis method was established for detecting trace lead ions.
Supplementary Materials
The following supporting information can be downloaded at https://www.mdpi.com/article/10.3390/nano12081243/s1 Figure S1: SERS spectra of nanocatalytic analysis system with different molecular probes; Figure S2: RRS spectra of nanocatalysis and analysis system; Figure S3: UV absorption spectra of nanocatalytic and analysis system; Figure S4: Optimization of reaction conditions; Table S1: Comparison of the nanocatalysis of AgNO3-SF reaction by means of the slope; Table S2: Comparison of methods reported to detect Pb2+; Table S3: The influence of interfering substances on the determination of Pb2+.
Author Contributions
Conceptualization, Z.J.; methodology, Z.W.; validation, C.L., Z.J.; formal analysis, Z.W.; investigation, C.L.; data curation, writing—original draft preparation, C.L.; visualization, Z.W.; supervision, Z.J.; project administration, C.L.; funding acquisition, C.L. All authors have read and agreed to the published version of the manuscript.
Funding
This work was supported by the Natural Science Foundation of Guangxi (No.2021JJD120033).
Institutional Review Board Statement
Not applicable.
Informed Consent Statement
Not applicable.
Data Availability Statement
Not applicable.
Conflicts of Interest
The authors declare no conflict of interest.
References
- Wu, Y.; Shi, Y.; Deng, S.; Wu, C.; Deng, R.; He, G.; Zhou, M.; Zhong, K.; Gao, H. Metal-induced G-quadruplex polymorphism for ratiometric and label-free detection of lead pollution in tea. Food Chem. 2020, 343–349, 128425–128431. [Google Scholar] [CrossRef]
- Wang, G.; Chu, L.T.; Hartanto, H.; Utomo, W.B.; Pravasta, R.A.; Chen, T.H. Microfluidic particle dam for visual and quantitative detection of lead ions. ACS Sens. 2020, 5, 19–23. [Google Scholar] [CrossRef] [PubMed]
- Diao, W.; Wang, G.; Wang, L.; Zhang, L.; Ding, S.; Takarada, T.; Maeda, M.; Liang, X. Opposite effects of flexible single-stranded DNA regions and rigid loops in DNAzyme on colloidal nanoparticle stability for “turn-on” plasmonic detection of lead ions. ACS Appl. Bio Mater. 2020, 3, 7003–7010. [Google Scholar] [CrossRef] [PubMed]
- Tian, A.; Liu, Y.; Gao, J. Sensitive SERS detection of lead ions via DNAzyme based quadratic signal amplification. Talanta 2017, 171, 185–189. [Google Scholar] [CrossRef] [PubMed]
- Doanh, T.T.; Van Hieu, N.; Quynh Trang, T.N.; Hanh Thu, V.T. In situ synthesis of hybrid zinc oxide-silver nanoparticle arrays as a powerful active platform for surface-enhanced Raman scattering detection. J. Sci. Adv. Mater. Devices. 2021, 6, 1–32. [Google Scholar] [CrossRef]
- Li, L.; Chin, W. Rapid and sensitive SERS detection of melamine in milk using Ag nanocube array substrate coupled with multivariate analysis. Food Chem. 2021, 357, 129717–129744. [Google Scholar] [CrossRef]
- Vania, T.; Cristiana, L.; Maria, R.M.; Giacomo, L.; Gabriella, C. Graphene Oxide/Silver Nanoparticles Platforms for the Detection and Discrimination of Native and Fibrillar Lysozyme: A Combined QCM and SERS Approach. Nanomaterials 2022, 12, 600. [Google Scholar]
- Annavaram, V.; Kutsanedzie, F.; Agyekum, A.; Shah, S.A.; Zareef, M.; Hassan, M.M.; Waqas, A.; Ouyang, Q.; Chen, Q. NaYF4@Yb, Ho, Au/GO-nanohybrid materials for SERS applications—Pb (II) detection and prediction. Colloids Surf. B 2019, 174, 598–606. [Google Scholar] [CrossRef]
- Sarfo, D.K.; Izake, E.L.; O’Mullane, A.P.; Ayoko, G.A. Molecular recognition and detection of Pb (II) ions in water by aminobenzo-18-crown-6 immobilised onto a nanostructured SERS substrate. Sens. Actuators B 2018, 255, 1945–1952. [Google Scholar] [CrossRef]
- Xu, Z.; Zhang, L.; Mei, B.; Tu, J.; Wang, R.; Chen, M.; Cheng, Y. A rapid surface-enhanced Raman scattering (SERS) method for Pb2+ detection using L-cysteine-modified Ag-coated Au nanoparticles with core–shell nanostructure. Coatings 2018, 8, 394. [Google Scholar] [CrossRef] [Green Version]
- Liu, W.; Li, C.; Zhang, P.; Tang, L.; Gu, Y.; Zhang, Y.; Zhang, J.; Liu, Z.; Sun, G.; Zhang, Z. Hierarchical polystyrene@reduced graphene oxide–Pt core–shell microspheres for non-enzymatic detection of hydrogen peroxide. RSC Adv. 2015, 5, 73993–74002. [Google Scholar] [CrossRef]
- Quach, A.D.; Crivat, G.; Tarr, M.A.; Rosenzweig, Z. Gold nanoparticle−quantum dot−polystyrene microspheres as fluorescence resonance energy transfer probes for bioassays. J. Am. Chem. Soc. 2011, 133, 2028–2030. [Google Scholar] [CrossRef]
- Chen, G.; Chang, C.; Lu, C.; Chen, J. Electrorheological display loading medium of core/shell polystyrene/polyvinyltetrazole microspheres for on-site visualization of lead(II). Polymer 2020, 203, 122805. [Google Scholar] [CrossRef]
- Pal, A.; Bhatta, S.R.; Thakur, A. Recent advances in the development of ferrocene based electroactive small molecules for cation recognition: A comprehensive review of the years 2010–2020. Coord. Chem. Rev. 2021, 431, 213685. [Google Scholar] [CrossRef]
- Thakur, A.; Mandal, D.; Ghosh, S. Sensitive and selective redox, chromogenic, and ‘‘turn-on” fluorescent probe for Pb(II) in aqueous environment. Anal. Chem. 2013, 85, 1665–1674. [Google Scholar] [CrossRef]
- Lvova, L.; Galloni, P.; Floris, B.; Lundström, I.; Paolesse, R.; Natale, C.D. A ferrocene-porphyrin ligand for multi-transduction chemical sensor development. Sensors 2013, 13, 5841–5856. [Google Scholar] [CrossRef] [Green Version]
- Xu, J.; Yang, Y.; Baigude, H.; Zhao, H. New ferrocene–triazole derivatives for multisignaling detection of Cu2+ in aqueous medium and their antibacterial activity. Spectrochim. Acta A 2020, 229, 117880–117895. [Google Scholar] [CrossRef]
- Liu, S.; Cheng, C.; Gong, H.; Wang, L. Programmable Mg2+-dependent DNAzyme switch by the catalytic hairpin DNA assembly for dualsignal amplification toward homogeneous analysis of protein and DNA. Chem. Commun. 2015, 51, 7364–7367. [Google Scholar] [CrossRef]
- Li, L.; Feng, J.; Fan, Y.; Tang, B. Simultaneous imaging of Zn2+ and Cu2+ in living cells based on DNAzyme modified gold nanoparticle. Anal. Chem. 2015, 87, 4829–4835. [Google Scholar] [CrossRef]
- Yang, D.; Cheng, W.; Chen, X.; Tang, Y.; Miao, P. Ultrasensitive electrochemical detection of miRNA based on DNA strand displacement polymerization and Ca2+-dependent DNAzyme cleavage. Analyst 2018, 143, 5352–5357. [Google Scholar] [CrossRef]
- Wang, H.; Liu, Y.; Liu, G. Label-free biosensor using a silver specific RNA-cleaving DNAzyme functionalized single-walled carbon nanotube for silver ion determination. Nanomaterials 2018, 8, 258. [Google Scholar] [CrossRef] [PubMed] [Green Version]
- Zhang, Y.; Wu, C.; Liu, H.; Khan, M.R.; Zhao, Z.; He, G.; Luo, A.; Zhang, J.; Deng, R.; He, Q. Label-free DNAzyme assays for dually amplified and one-pot detection of lead pollution. J. Hazard. Mater. 2021, 406, 124790–124796. [Google Scholar] [CrossRef] [PubMed]
- Sun, Y.; Duan, N.; Ma, P.; Liang, Y.; Zhu, X.; Wang, Z. Colorimetric aptasensor based on truncated aptamer and trivalent DNAzyme for vibrio parahemolyticus determination. J. Agric. Food Chem. 2019, 67, 2313–2320. [Google Scholar] [CrossRef] [PubMed]
- Liu, M.; Wang, Z.; Pan, L.; Cui, Y.; Liu, Y. A SERS/fluorescence dual-mode nanosensor based on the human telomeric G-quadruplex DNA: Application to mercury (II) detection. Biosen. Bioelectron. 2015, 69, 142–147. [Google Scholar] [CrossRef] [PubMed]
- Zou, F.; Zhou, H.; Tan, T.V.; Kim, J.; Koh, K.; Lee, J. Dual-mode SERS-fluorescence immunoassay using graphene quantum dot labeling on one-dimensional aligned magnetoplasmonic nanoparticles. ACS Appl. Mater. Interfaces 2015, 7, 12168–12175. [Google Scholar] [CrossRef]
- Zong, S.; Wang, Z.; Zhang, R.; Wang, C.; Xu, S.; Cui, Y. A multiplex and straightforward aqueous phase immunoassay protocol through the combination of SERS-fluorescence dual mode nanoprobes and magnetic nanobeads. Biosen. Bioelectron. 2013, 41, 745–751. [Google Scholar] [CrossRef]
- Li, D.; Li, C.; Wang, H.; Li, J.; Zhao, Y.; Jiang, X.; Wen, G.; Liang, A.; Jiang, Z. Single-atom Fe catalytic amplification-gold nanosol SERS/RRS aptamer as platform for the quantification of trace pollutants. Microchim. Acta 2021, 188, 175. [Google Scholar] [CrossRef]
- Fu, A.; Shi, J.; Wu, S. On the silver mirror reaction of formic acid and other substances. J. Heze Teach. Coll. 1999, 19, 78–93. [Google Scholar]
- Song, Q.; Chen, G.; Zhao, M.; Li, T. Synthesis and optical properties of novel ferrocene derivatives. Prog. Laser Optoelectron. 2015, 52, 236–242. [Google Scholar]
- Zang, Y.; Lei, J.; Hao, Q.; Ju, H. “Signal-on” photoelectrochemical sensing strategy based on target-dependent aptamer conformational conversion for selective detection of lead (II) ion. ACS Appl. Mater. Interfaces 2014, 6, 15991–15997. [Google Scholar] [CrossRef]
- Fu, X.; Lou, T.; Chen, Z.; Lin, M.; Feng, W.; Chen, L. “Turn-on” fluorescence detection of lead ions based on accelerated leaching of gold nanoparticles on the surface of graphene. ACS Appl. Mater. Interfaces 2012, 4, 1080–1086. [Google Scholar] [CrossRef]
- Lu, H.; Yu, C.; Xu, S. A dual reference ion-imprinted ratiometric fluorescence probe for simultaneous detection of silver (I) and lead (II). Sens. Actuators B 2019, 288, 691–698. [Google Scholar] [CrossRef]
- Ran, G.; Wu, F.; Ni, X.; Li, X.; Li, X.; Liu, D.; Sun, J.; Xie, C.; Yao, D.; Bai, W. A novel label-free electrochemical aptasensor with one-step assembly process for rapid detection of lead (II) ions. Sens. Actuators B 2020, 320, 128326–128334. [Google Scholar] [CrossRef]
- Jiang, C.; Li, Y.; Wang, H.; Chen, D.; Wen, Y. A portable visual capillary sensor based on functional DNA crosslinked hydrogel for point-of-care detection of lead ion. Sens. Actuators B 2020, 307, 127625–127631. [Google Scholar] [CrossRef]
- Deshpande, S.S.; Jachak, M.A.; Khopkar, S.S.; Shankarling, G.S. A simple substituted spiropyran acting as a photo reversible switch for the detection of lead (Pb2+) ions. Sens. Actuators 2018, 258, 648–656. [Google Scholar] [CrossRef]
- Hosseinzadegan, S.; Nischkauer, W.; Bica, K.; Limbeck, A. FI-ICP-OES determination of Pb in drinking water after pre-concentration using magnetic nanoparticles coated with ionic liquid. Microchem. J. 2019, 146, 339–344. [Google Scholar] [CrossRef]
- Beqa, L.; Singh, A.K.; Khan, S.A.; Senapati, D.; Arumugam, S.R.; Ray, P.C. Gold nanoparticle-based simple colorimetric and ultrasensitive dynamic light scattering assay for the selective detection of Pb (II) from paints, plastics, and water samples. ACS Appl. Mater. Interfaces 2011, 3, 668–673. [Google Scholar] [CrossRef]
- Wang, Y.; Irudayaraj, J. A SERS DNAzyme biosensor for lead ion detection. Chem. Commun. 2011, 47, 4394–4397. [Google Scholar] [CrossRef]


Publisher’s Note: MDPI stays neutral with regard to jurisdictional claims in published maps and institutional affiliations. |
© 2022 by the authors. Licensee MDPI, Basel, Switzerland. This article is an open access article distributed under the terms and conditions of the Creative Commons Attribution (CC BY) license (https://creativecommons.org/licenses/by/4.0/).