Article

Aptamer-Adjusted Carbon Dot Catalysis-Silver Nanosol SERS Spectrometry for Bisphenol A Detection

1
Key Laboratory of Regional Ecological Environment Analysis and Pollution Control in Western Guangxi (Baise University), Education Department of Guangxi Zhuang Autonomous Region, College of Chemistry and Environment Engineering, Baise University, Baise 533000, China
2
Guangxi Key Laboratory of Environmental Pollution Control Theory and Technology, Guangxi Normal University, Guilin 541004, China
*
Authors to whom correspondence should be addressed.
Nanomaterials 2022, 12(8), 1374; https://doi.org/10.3390/nano12081374
Submission received: 14 March 2022 / Revised: 5 April 2022 / Accepted: 15 April 2022 / Published: 17 April 2022
(This article belongs to the Topic Advanced Nanomaterials for Sensing Applications)

Abstract

:
Carbon dots (CDs) can be prepared from various organic (abundant) compounds that are rich in surfaces with –OH, –COOH, and –NH2 groups. Therefore, CDs exhibit good biocompatibility and electron transfer ability, allowing flexible surface modification and accelerated electron transfer during catalysis. Herein, CDs were prepared using a hydrothermal method with fructose, saccharose, and citric acid as C sources and urea as an N dopant. The as-prepared CDs were used to catalyze AgNO3–trisodium citrate (TSC) to produce Ag nanoparticles (AgNPs). The surface-enhanced Raman scattering (SERS) intensity increased with the increasing CDs concentration with Victoria blue B (VBB) as a signal molecule. The CDs exhibited a strong catalytic activity, with the highest activity shown by fructose-based CDs. After N doping, catalytic performance improved; with the passivation of a wrapped aptamer, the electron transfer was effectively disrupted (retarded). This resulted in the inhibition of the reaction and a decrease in the SERS intensity. When bisphenol A (BPA) was added, it specifically bound to the aptamer and CDs were released, recovering catalytical activity. The SERS intensity increased with BPA over the concentration range of 0.33–66.67 nmol/L. Thus, the aptamer-adjusted nanocatalytic SERS method can be applied for BPA detection.

1. Introduction

Because of their high selectivity, high affinity, and low concentration dissociation, aptamer (Apt) reactions have been widely used in biomedicine, analytical chemistry, and clinical examination [1,2,3,4,5,6,7,8]. Through surface-enhanced Raman scattering (SERS), an enhanced Raman signal is obtained for the molecules adsorbed on or close to the metal surface and activated by its local surface plasma resonance (LSPR) [9,10,11,12,13]. With the development of nanoparticle preparation technology, SERS substrates have become more flexible and inexpensive, allowing them to be modified and fixed on slides or optical fibers [14,15] or used directly in colloids [16]. These advantages have resulted in the widespread use of SERS nanosubstrates with local surface plasmon effects [17,18,19,20]. In addition, nanocatalysis has been conducted to generate noble metal nanoparticles. The generated nanoparticles have been subsequently used as a direct SERS substrate based on the LSPR effect and subjected to the Apt reaction to establish an analysis platform [21,22,23].
Carbon dots (CDs) typically exhibit good biocompatibility and have been widely used as bioimaging probes and biosensors [24,25]. CDs have different preparation methods and numerous sources (including carbohydrates, amino acids, and organic acids) that promote flexible structure modification [26,27,28,29]. In addition, CDs exhibit good electronic transfer ability and can be used to catalyze redox reactions [30,31,32,33] and to establish analysis methods. Long groups [31] prepared CDs with lampblack followed by reduction with NaBH4 to form r-CDs, which was then used to catalyze the reaction of hydrogen peroxide with 3,3′,5,5′-tetramethylbenzidine for hydrogen peroxide detection (detection range: 0.01–0.1 mM). Wang and coworkers [32] synthesized CDs containing O, N, Fe, S, and C by the hydrothermal treatment of animal blood. The as-prepared CDs exhibited excellent peroxidase-like catalytic activity and could be mixed with glucolase to determine glucose by colorimetry with a detection range of 0.2–2.5 mM. However, the combination of Apt-adjusted CD catalysis and Ag nanosol SERS for the detection of bisphenol A (BPA), which is an endocrine disruptor, has not been extensively investigated.
Endocrine-disrupting chemicals (EDCs) can damage human and ecosystem health by inhibiting reproduction as well as causing birth defects, dysplasia, and metabolic disorders. Prolonged exposure to EDCs may cause obesity, diabetes, cardiovascular disease, carcinogenesis, and neurotoxicity [34]. BPA is a common industrial material that has been detected as a potential risk for human diseases, as evaluated by supervision organizations and health agencies [35,36,37]. BPA threatens health through food, when it is present in a container during food heating [38]. The main methods of detecting BPA include chromatography [39,40], absorption spectroscopy [41,42], fluorimetry [43,44], electrochemistry methods [45], resonance Rayleigh scattering (RRS) [46,47], and surface-enhance Raman spectroscopy [48,49]. However, these methods exhibit low selectivity and low sensitivity or require precious and expensive instrumentation. Thus, real-time detection of BPA is difficult. Herein, an SERS method for BPA detection was developed using as-prepared Ag nanoparticles (AgNPs) with a strong surface plasmon resonance effect as an SERS substrate.

2. Results and Discussion

2.1. Principle

The carbon dots (CDs) surface contains abundant electrons, which can accelerate the electron transfer between the oxidant and the reductant, allowing the redox reaction to proceed more easily. At a certain concentration of silver nitrate (AgNO3)–trisodium citrate (TSC), effective collisions occur infrequently between citrate and silver ions. When CDs are added, they adsorb silver ions and citrate molecules on the surface and rapidly transfer electrons from citrate to silver ions, resulting in the generation of elemental silver, 1,3-acetonedicarboxylic acid, and CO2. The as-prepared Ag nanoparticles (AgNPs) increased with increasing CDs loading (Figure 1). The SERS signal of the system was strong with AgNPs as the SERS substrate and Victoria blue B (VBB) as the molecular probe. When an aptamer (Apt) enwrapped the surface of the CDs, the absorption of citrate and silver ions on the CDs was blocked, inhibiting the catalytic activity. This resulted in a decrease in the SERS intensity. In the presence of BPA, a specific bonding with the Apt was achieved, resulting in CDs exposed to the reaction system and recovering the catalytic activity. The generated AgNPs increased with BPA loading, and the SERS signals were linearly increased, allowing for the development of an SERS method for BPA detection.

2.2. SERS Spectra

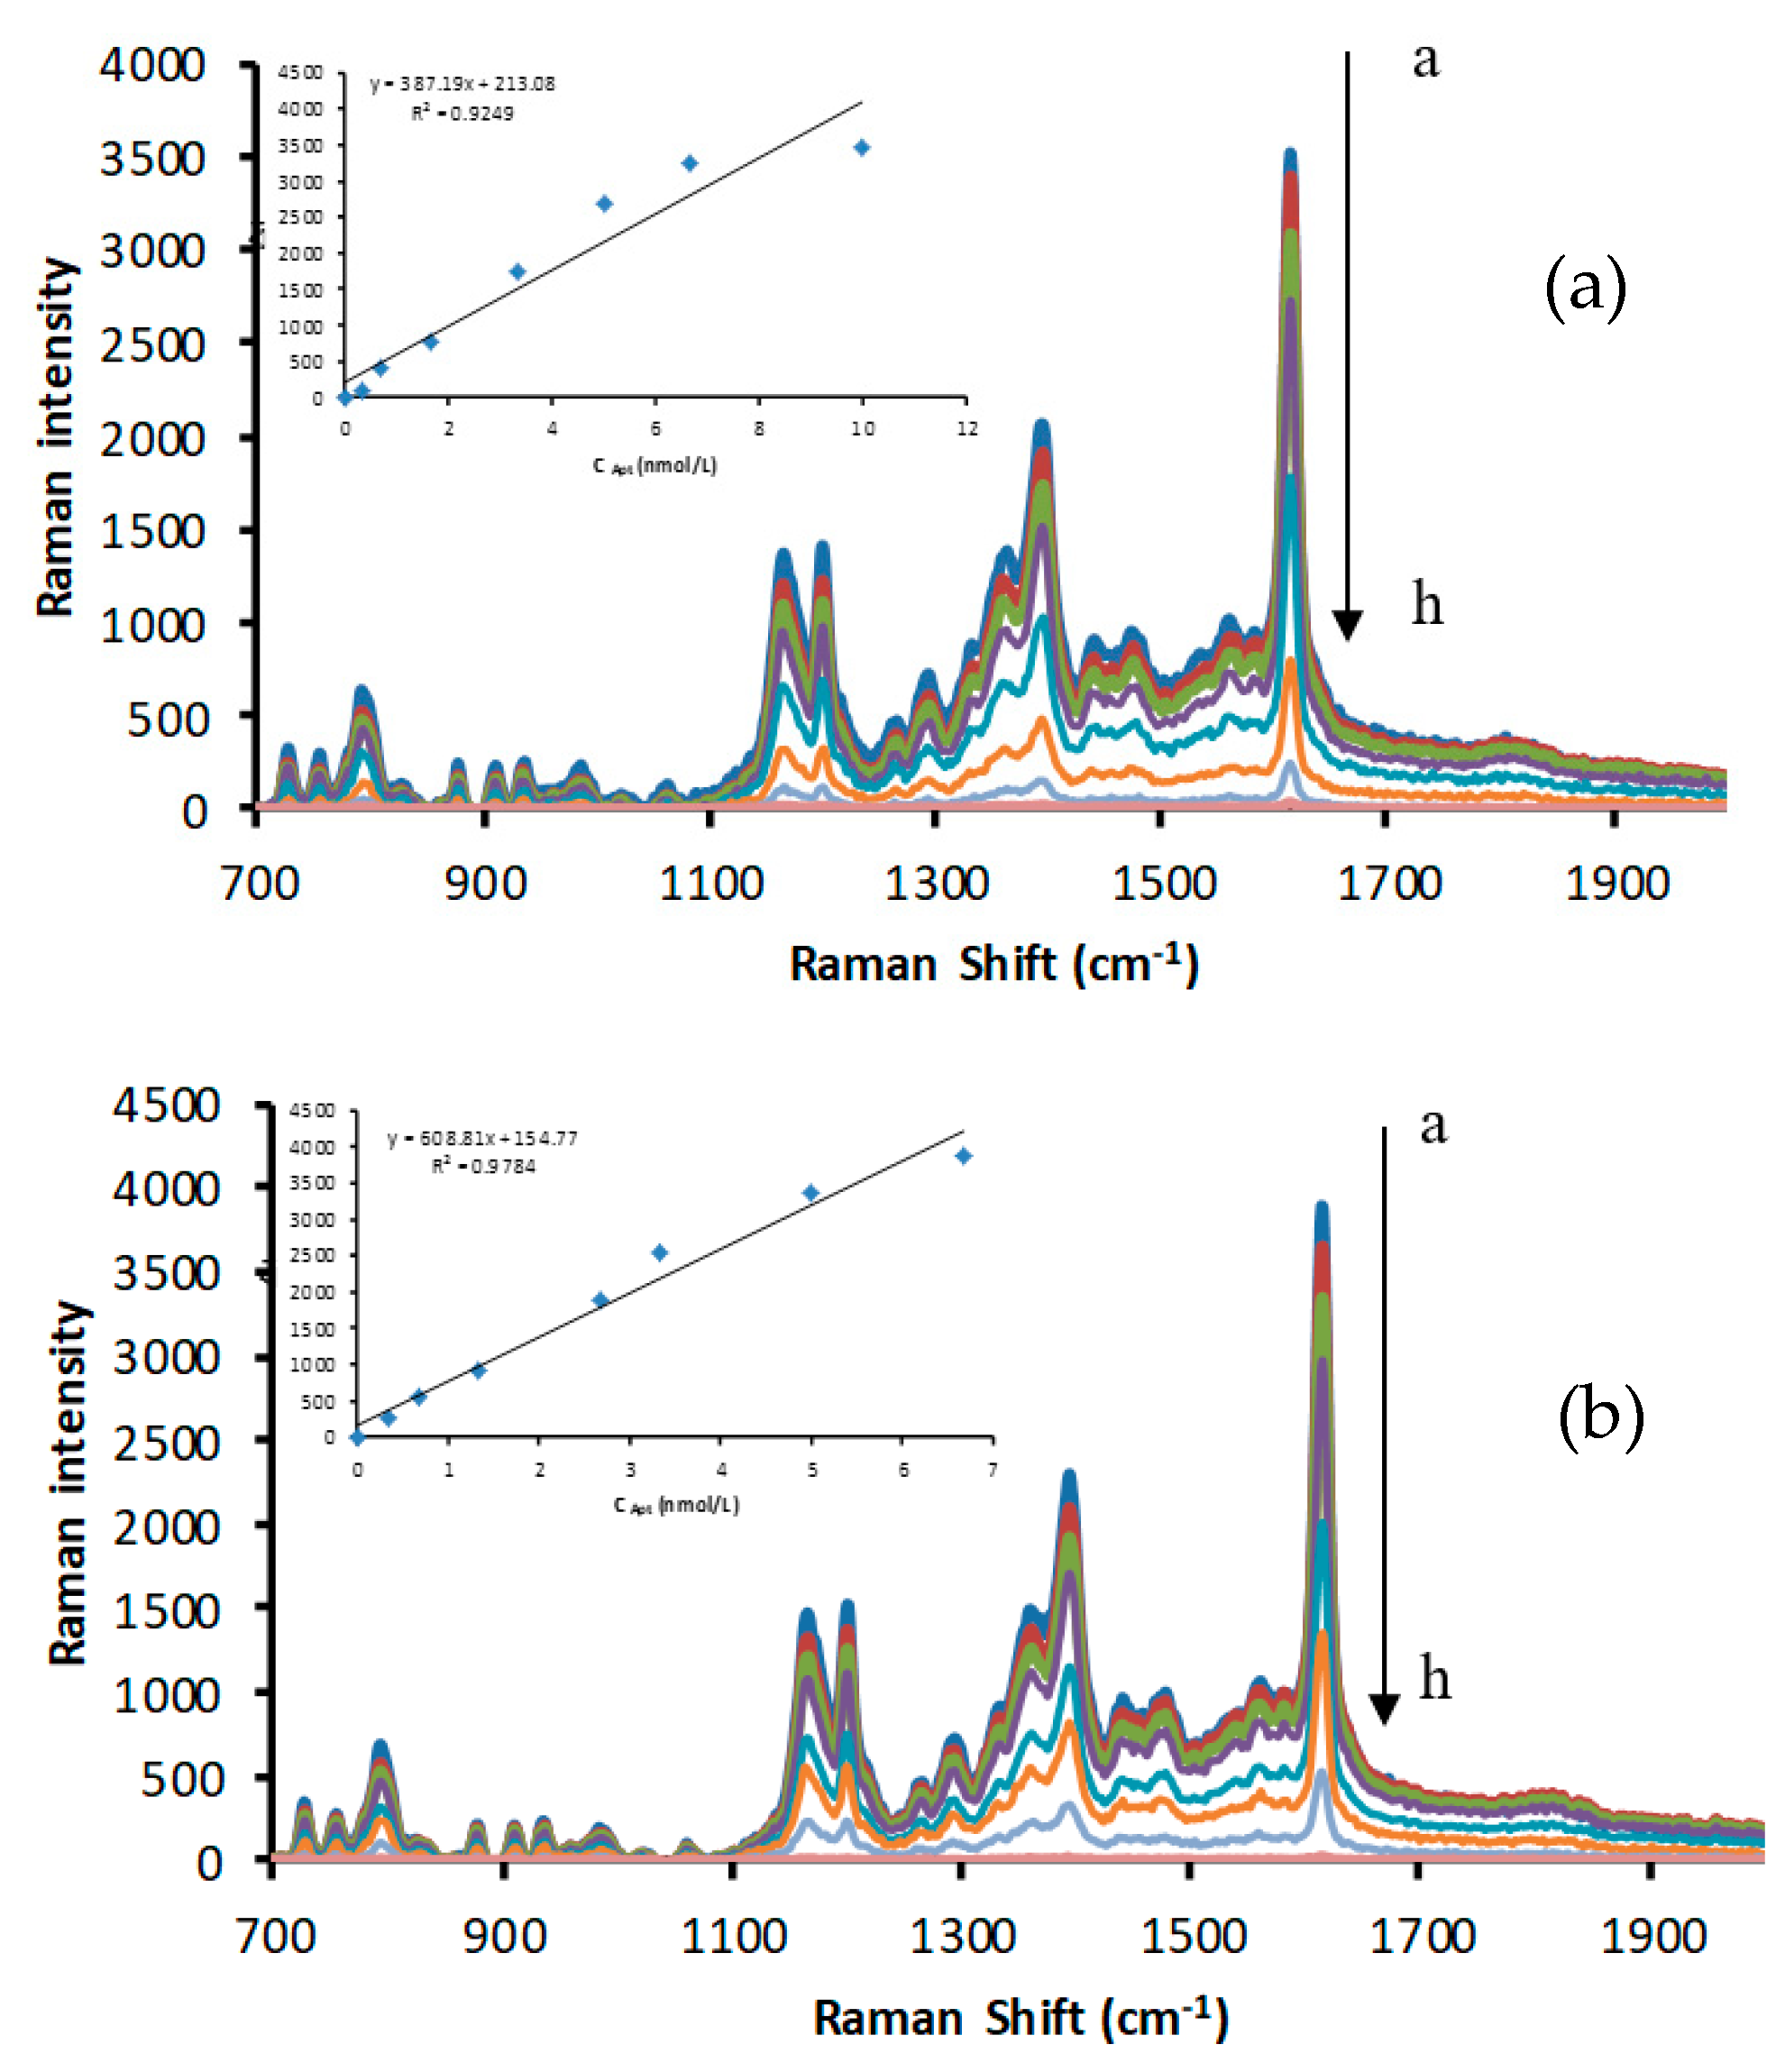
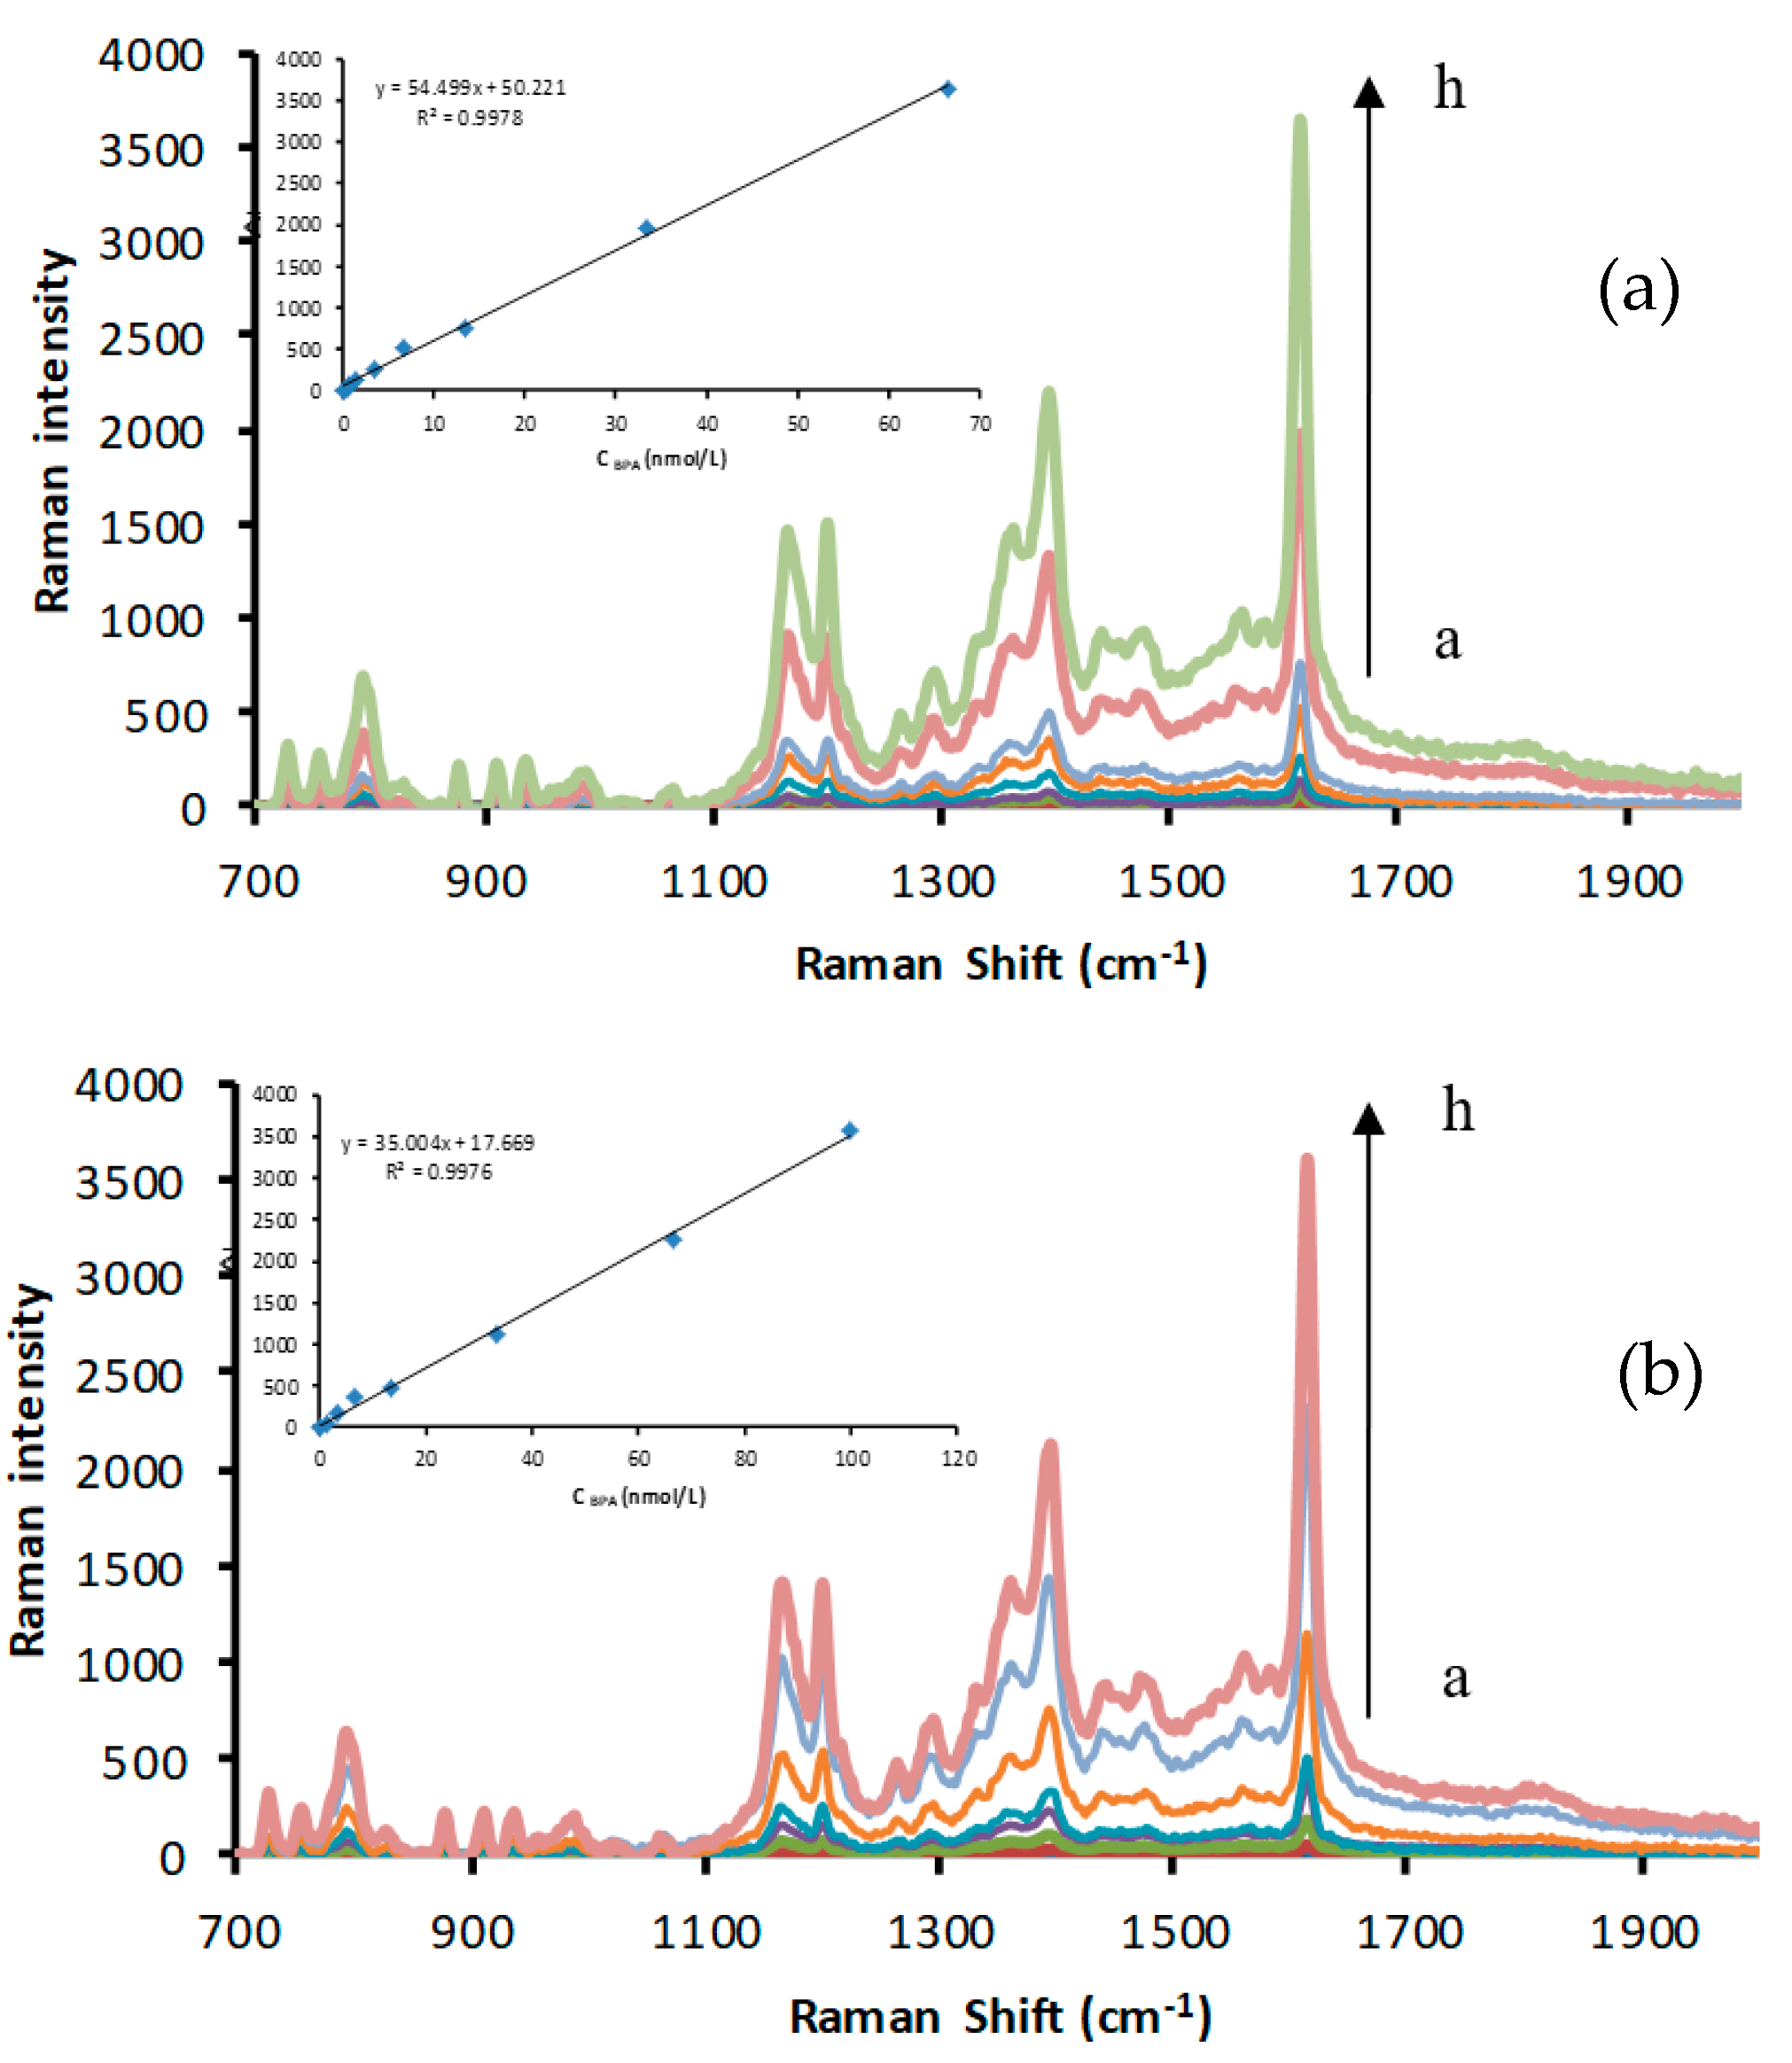
At 85 °C, the reaction of silver nitrate–TSC was blocked, but in the presence of CDs, the redox reaction proceeded to produce yellow AgNPs. When VBB was used as a signal molecule, four enhanced SERS peaks were observed at 1614, 1394, 1200, and 795 cm−1. The 795 cm−1 peak can be attributed to the inner surface deformation of the ring. The 1200 cm−1 peak was attributed to the outside surface deformation of NH2, while the 1394 cm−1 peak was assigned to C–H of C=C and C–H bending vibration. The 1614 cm−1 peak was assigned to the C=C and C=N stretching vibration of the benzene ring [50]. In addition, the 1614 cm−1 peak was the most intense and linearly increased with the increasing CD concentration. Various C sources were selected to prepare CDs (glucose, fructose, sucrose, and citric acid), and urea was used as an N source to prepare N-CDs for catalysis investigation (Figure 2 and Figures S1–S3). In the presence of the Apt, the CD surfaces were enwrapped and isolated from the catalytic system, suppressing the CD catalytic activity and the SERS intensity (Figure 3 and Figure S4). When BPA was added, it specifically conjugated with the Apt, releasing CDs and recovering catalytic activity. With the increasing BPA loading, the amount of released CDs increased, and the generated AgNPs increased with the SERS intensity as a function of BPA content (Figure 4 and Figures S5–S7).

2.3. The Catalytic Effect of CDs and the Inhibition of the Apt

Under the optimal conditions, AgNO3 slowly reacted with TSC. When the nanocatalyst was added, the small particle size, high surface energy, and high surface electron density allowed silver ions and citrate to absorb on its surface, facilitating electron transfer. The reaction generated yellow AgNPs, and the system SERS intensity increased rapidly due to the accelerated electron transfer. The catalytic activities of various catalysts, i.e., the as-prepared CDs using glucose, fructose, sucrose, citric acid, and the corresponding N dopants, as well as AgNPs, were investigated. The CDs produced with pure citric acid as a C source showed no catalysis, while the others had strong catalysis with N doping further increasing the catalytic activity (Table 1). This indicated that N atoms in the CD crystal lattice facilitated the incorporation between CDs and –COOH or –NH2 by non-covalent hydrogen bonds and Van der Waals forces. The as-prepared AgNPs caused the SERS value to increased (Table S1). In addition, AgNPs could catalyze this reaction even at the concentration of 13.33 nmol/L, indicating that the as-prepared AgNPs were autocatalytic (Figure S8).

2.4. Scanning Electron Microscopy (SEM)

The reaction solution was diluted up to 10 times for final BPA concentrations of 0, 3.33, and 13.33 nmol/L. Subsequently, a 10 μL sample solution was dropped onto a silicon wafer and dried naturally before conducting SEM. As can be seen in Figure 5a, in the absence of BPA, few AgNPs with a mean grain size of 100 nm were present in the reaction solution. Upon BPA addition, the catalytic activity was recovered, and AgNPs were formed by aggregation, with a mean grain size of 70 nm (Figure 5b,c), as corroborated by the laser scattering image (Figure S9).

2.5. Optimization of Catalysis Conditions

The effect of the reagent concentration on the determination was studied. With the increasing AgNO3 concentration, the amount of generated AgNPs increased with the SERS value, while the △I value was largest at the AgNO3 concentration of 1.33 mmol/L (Figure S10). When the AgNO3 concentration increased continuously, the SERS value decreased conversely, because the AgNPs aggregated excessively and the control test also reacted. Therefore, 1.33 mmol/L AgNO3 was chosen for subsequent use. With the increasing TSC concentration, the amount of generated AgNPs increased, the SERS value increased, and the △I value was maximized at the TSC concentration of 4.67 mmol/L (Figure S11). Thus, 4.67 mmol/L TSC was selected as optimal. The reaction temperature significantly influenced the generated AgNPs, and at 85 °C for 21 min, the △I value was maximized. Thus, 85 °C and 21 min were chosen as the optimal conditions for the reaction (Figures S12 and S13). The effect of Apts was also studied, and the △I value reached the maximum at the Apt concentration of 13.33 nmol/L (Figure S14). In this examination, some time was required for the combination of the Apt with fullerol. With the increasing of the binding time, the combination strengthened within 8 min (Figure S15). With the increasing time, the △I value was maintained; thus, to ensure sufficient stability, a binding time of 10 min was selected as optimal.

2.6. Working Curve

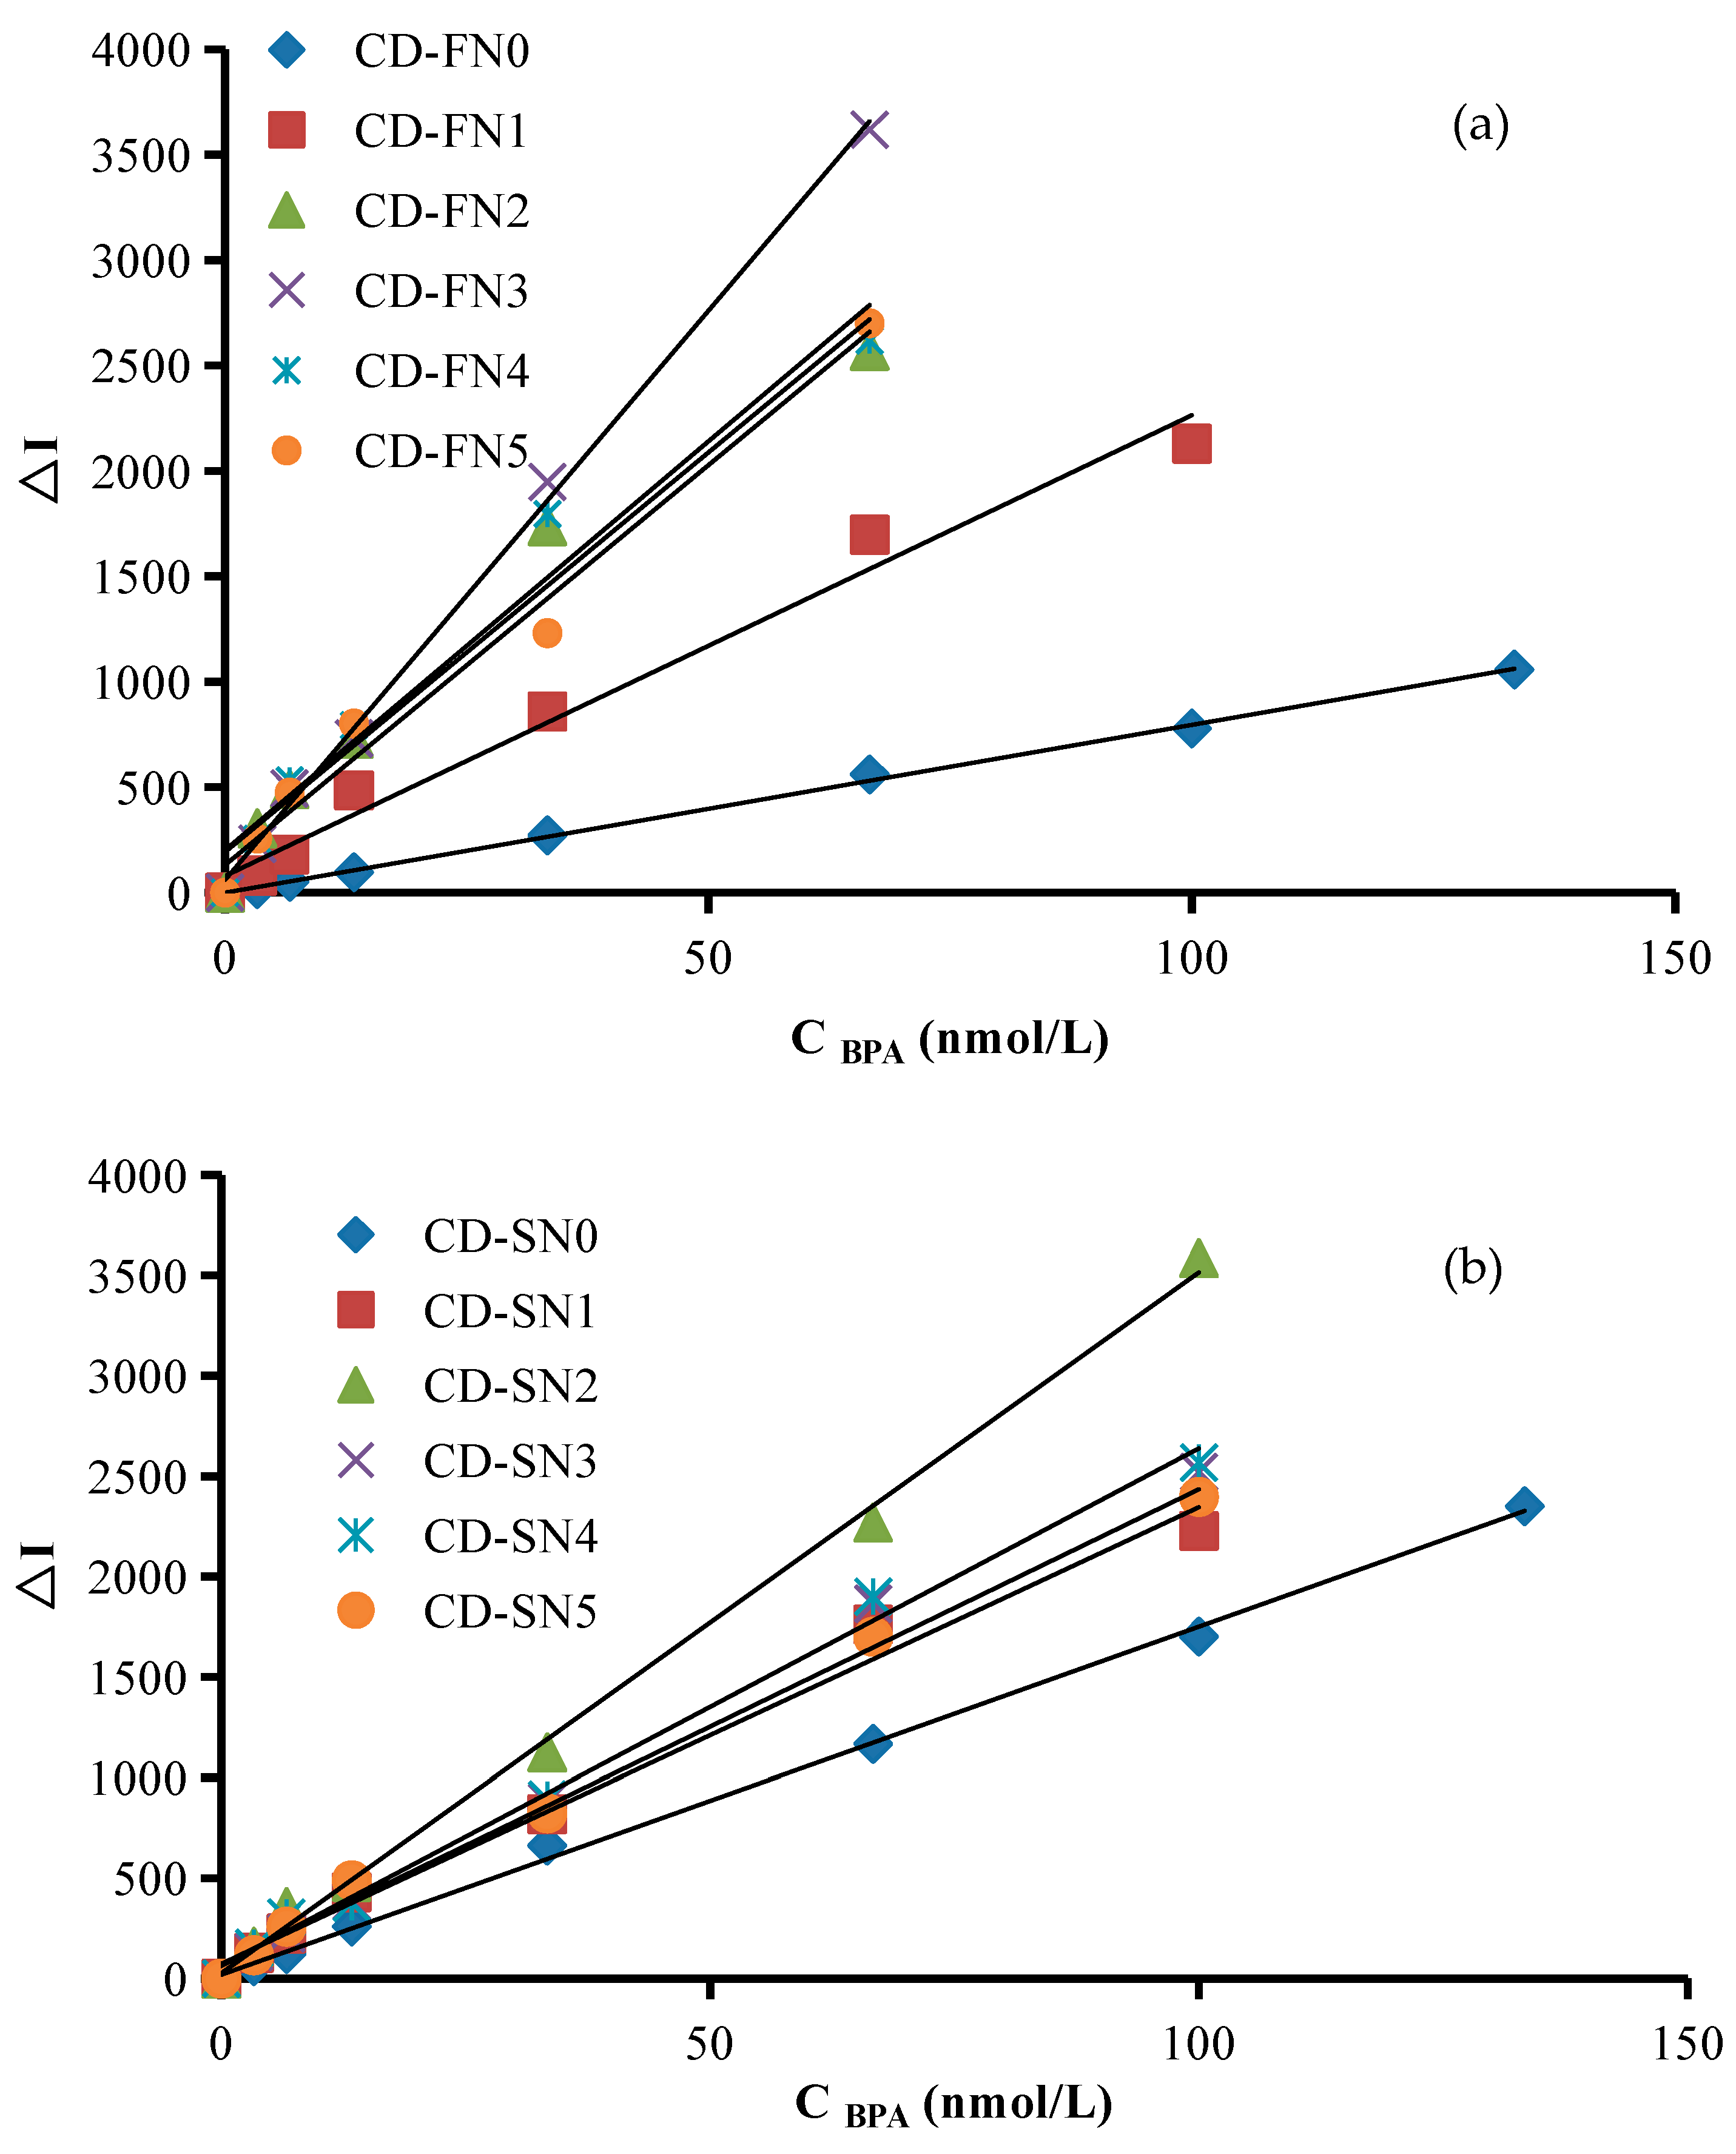
Under the optimal conditions, the working curves were prepared according to the relationship between C(BPA) and the corresponding ΔI1614 cm−1 values (Figure 6 and Figures S16–S19), and the analytical characteristics are listed in Table 1. The SERS method showed the maximum slope of 54.50 with a limit of detection of 0.1 nmol/L. These methods were compared with previously reported methods for BPA determination. The newly developed method was simple and showed high sensitivity and good selectivity. Therefore, it can be used to detect residues BPA in plastic products.

2.7. Influence of Substances

According to the procedure, CD-FN was used as a catalyst, and the influence of the coexisting interfering substances on the determination of 3.33 nmol/L BPA was tested. The common substances tested did not interfere with the determination with a relative error of ±10% (Table S2).

2.8. Sample Analysis

Different brands of plastic films and polythene bags, unbranded grocery bag, and 2 disposable plastic drinking cup brands were purchased from the market and snipped. Then, 0.4 g of the samples was soaked for 48 h in ethyl alcohol. The extracts were then air-dried in a well-ventilated area, subsequently dissolved in 100 mL of double-distilled water and stored at 4 °C. According to the procedure, 50 μL of the samples were used to detect BPA. A known amount of BPA was added to the sample, and recoveries of 98.5–105.4% were obtained (Table S3).

3. Materials and Methods

3.1. Apparatus

A model DXR smart Raman spectrometer (Thermo Company, Waltham, MA, USA) with a laser wavelength of 633 nm and a laser power of 3 mW, a Cary Eclipse fluorescence spectrophotometer (Varian Company, Palo Alto, CA, USA), a TU-1901 double-beam UV-visible spectrophotometer (Beijing General Instrument Co., LTD, Beijing, China), and an FEI Quanta 200 FEG field-emission scanning electron microscope (FEI Company, Hillsboro, OR, USA) were used.

3.2. Reagents

Apt with a sequence of 5′-3′ GGG CCG TTC GAA CAC GAG CAT G N60 GG ACA GTA CTC AGG TCA TCC TAG G (Sangon Biotech (Shanghai) Co., Ltd., China). 1.0 × 10⁻³ mol/L BPA: 22.8 mg BPA were dissolved with 2.0 mL ethanol and then diluted to 100 mL with water (0.1 mol/L, measured by the HPLC method [51]). The solution was diluted and used step by step. 0.01 mol/L silver nitrate (Sinopharm chemical reagent Co. Ltd., China); 0.1 mol/L TSC (Xilong Scientific Co., Ltd., Shantou, China); 10−3 mol/L VBB solution: 25 mg VBB were dissolved with 5.0 mL ethanol and then diluted to 50 mL with water. The solution was diluted and used step by step. glucose; fructose; sucrose; citric acid; urea; and Ca(OH)2 (Sinopharm chemical reagent Co. Ltd., Shanghai, China). All reagents were analytically pure, and water was double-distilled.
Preparation of N-CDs (CD-GN): 1 g glucose and 1 g urea ultrasonic dissolved in 30 mL water (N: 11.6%) to form a yellow solution. The mixture was transferred into a high-pressure reaction kettle heated with polytetrafluoroethylene lining for 180 °C for 5 h and then air-cooled to room temperature. The reaction mixture was a brown yellow solution. Then, it was dialyzed for 12 h with an MWCO 3500Da dialysis bag, and the water was changed at every 2 h until the dialysate was colorless. The CDs were adjusted to neutral with 50 mmol/L NaOH and then diluted to 30 mL with water. The CDGN concentration was 0.025 g/mL.
Preparation of N-CDs (CD-FN): 1 g fructose and urea (0, 0.2, 0.5, 1.0, 1.5, and 2.0 g) ultrasonically dissolved in 30 mL water to form a yellow solution, marked as CD-FN0, CD-FN1, CD-FN2, CD-FN3, CD-FN4, and CD-FN5, respectively. The mixture was transferred into a high-pressure reaction kettle heated with polytetrafluoroethylene lining at 180 °C for 5 h and then air-cooled to room temperature. The reaction mixture was a brown yellow solution. Then, it was dialyzed for 12 h with an MWCO 3500Da dialysis bag, and the water was changed at every 2 h until the dialysate was colorless. The CDs were adjusted to neutral with 50 mmol/L NaOH and then diluted to 30 mL with water. The CD-FN concentration was 0.025 g/mL.
Preparation of N-CDs (CD-SN): 1 g sucrose and urea (0, 0.2, 0.5, 1.0, 1.5, 2.0 g) ultrasonically dissolved in 30 mL water to form a yellow solution, marked as CD-SN0, CD-SN1, CD-SN2, CD-SN3, CD-SN4, and CD-SN5, respectively. The mixture was transferred into a high-pressure reaction kettle heated with polytetrafluoroethylene lining at 180 °C for 5 h and then air-cooled to room temperature. The reaction mixture was a brown yellow solution. Then, it was dialyzed for 12 h with an MWCO 3500Da dialysis bag, and the water was changed at every 2 h until the dialysate was colorless. The CDs were adjusted to neutral with 50 mmol/L NaOH and then diluted to 30 mL with water. The CD-SN concentration was 0.025 g/mL.
Preparation of Ca-CDs (CDCa): 1 g citric acid and 0.4 g Ca(OH)2 were dissolved in a reaction kettle with 10 mL water, and then, 500 μL ethidene diamine were added slowly and mixed well. The mixture was heated at 200 °C for 4 h in a muffle furnace. Then, the reaction mixture was centrifuged at 10,000 rad/s for 10 min. The precipitate dissolved in water and adjusted to pH 7.5 with 50 mmol/L NaOH and then diluted to 10 mL with water. The CDCa concentration was 0.1 g/mL.
Preparation of N-CDs (CD-CN): 1 g citric acid and urea (0, 0.2, 0.5, 1.0, 1.5, 2.0 g) ultrasonically dissolved in 30 mL water to form a yellow solution, marked as CD-CN0, CD-CN1, CD-CN2, CD-CN3, CD-CN4, and CD-CN5, respectively. The mixture was transferred into a high-pressure reaction kettle heated with polytetrafluoroethylene lining at 180 °C for 5 h and then air-cooled to room temperature. The reaction mixture was a brown yellow solution. Then, it was dialyzed for 12 h with an MWCO 3500Da dialysis bag, and the water was changed at every 2 h until the dialysate was colorless. The CDs solution was adjusted to neutral with 50 mmol/L NaOH and then diluted to 30 mL with water. The CD-CN was 0.025 g/mL.

3.3. Procedure

First, 20 µL of 1.5 µmol/L Apt, a certain amount of BPA, and 15 µL of a 0.02 g/L CD solution were added to a 5 mL graduated tube, mixed well and reacted for 20 min. Then, 200 µL of 0.01 mol/L AgNO3 and 70 µL of 0.1 mol/L TSC were added, and the mixture was diluted to 1.5 mL with water. The mixture was subsequently heated for 21 min in an 85 °C water bath and cooled with ice water. Next, 50 μL of 1.0 × 10⁻⁵ mol/L VBB and 40 μL of 1 mol/L NaCl were added and mixed well. The SERS spectra were recorded using a Raman spectrometer. The reaction solution SERS intensity at 1614 cm−1 (I1614 cm−1) and that of a blank solution without BPA (I0) were recorded, allowing the value of △I = I 1614   cm 1 −I0 to be calculated.

4. Conclusions

The prepared CDs had a high surface effect and effectively catalyzed the reaction of TSC and silver nitrate to produce yellow AgNPs. The generated AgNPs showed strong SERS effects, with the SERS intensity linearly increased with the CD loading. When CDs were enwrapped using an Apt, the CD–silver ion binding was blocked, suppressing the catalytic activity. BPA specifically conjugated with the Apt, releasing the CDs and recovering the catalytic activity. The system SERS intensity linearly increased with the increasing BPA content. Therefore, an Apt-adjusted nanocatalysis and an SPR effect spectral analysis for BPA detection were established with excellent sensitivity, selectivity, simplicity, and rapidness.

Supplementary Materials

The following are available online at https://www.mdpi.com/article/10.3390/nano12081374/s1, Figure S1: SERS spectra of CDGN–AgNO3–TSC, Figure S2: SERS spectra of CDCa–AgNO3-TSC, Figure S3: SERS spectra of CD-CN–AgNO3–TSC, Figure S4 SERS spectra of Apt–CD-CN–AgNO3–TSC, Figure S5: SERS spectra of BPA–Apt–CD-GN–AgNO3–TSC, Figure S6: SERS spectra of BPA–Apt–CDCa–AgNO3–TSC, Figure S7: SERS spectra of BPA–Apt–CD-CN–AgNO3–TSC, Figure S8: The effect of AgNPs on the SERS intensity, Figure S9: Laser scattering image of Apt–CD-FN–AgNO3–TSC–BPA system, Figure S10: Effect of AgNO3 concentration on the △I value, Figure S11: Effect of TSC concentration on the △I value, Figure S12: Effect of temperature on the △I value, Figure S13: Effect of time on the △I value, Figure S14: Effect of Apt on the △I value, Figure S15: Effect of binding time on the △I value, Figure S16: Working curve for the SERS determination of Apt–CD-GN–AgNO3–TSC–BPA, Figure S17: Working curve for the SERS determination of Apt–CDCa–AgNO3–TSC–BPA, Figure S18: Working curve for the SERS determination of Apt–CDCN–AgNO3–TSC–BPA, Figure S19: Working curve for the SERS determination of Apt–AgNP –AgNO3–TSC–BPA, Table S1: The catalytic effects of various catalyst and the inhibiting effect of Apt, Table S2: Selectivity of the analysis of BPA by the SERS method, Table S3: Sample analysis results (n = 5).

Author Contributions

A.L. and Z.J. conceived and designed the experiments; H.O. performed the experiments, analyzed the data and wrote the paper; Y.X., L.M. and S.L. collected data and revised the paper. All authors have read and agreed to the published version of the manuscript.

Funding

This work supported by the National Natural Science Foundation of China (numbers: 21567001, 21767004, and 21667006).

Institutional Review Board Statement

Not applicable for studies not involving humans or animals.

Informed Consent Statement

Not applicable.

Data Availability Statement

Not applicable.

Acknowledgments

This work supported by Guangxi First-class Disciplines (Agricultural Resources and Environment), and Guangxi Key Laboratory of Biology for Mango.

Conflicts of Interest

The authors declare no conflict of interest.

References

  1. Lao, Y.H.; Phua, K.K.; Leong, K.W. Aptamer nanomedicine for cancer therapeutics: Barriers and potential for translation. ACS Nano 2015, 9, 2235–2254. [Google Scholar] [CrossRef] [PubMed]
  2. Sun, H.; Zu, Y. A highlight of recent advances in aptamer technology and its application. Molecules 2015, 20, 11959–11980. [Google Scholar] [CrossRef] [PubMed] [Green Version]
  3. Zhou, J.; Le, V.; Kalia, D.; Nakayama, S.; Mikek, C.; Lewis, E.A.; Sintim, H.O. Diminazene or berenil, a classic duplexminor groove binder, binds to G-quadruplexes with low nanomolar dissociation constants and the amidine groups are also critical for G-quadruplex binding. Mol. Biosyst. 2014, 10, 2724–2734. [Google Scholar] [CrossRef] [Green Version]
  4. Cho, Y.S.; Lee, E.J.; Lee, G.H.; Hah, S.S. Aptamer selection for fishing of palladium ion using graphene oxide-adsorbed nanoparticles. Bioorg. Med. Chem. Lett. 2015, 25, 5536–5539. [Google Scholar] [CrossRef] [PubMed]
  5. Nameghi, M.A.; Danesh, N.M.; Ramezani, M.; Hassani, F.V.; Abnous, K.; Taghdisi, S.M. A fluorescent aptasensor based on a DNA pyramid nanostructure for ultrasensitive detection of ochratoxin A. Anal. Bioanal. Chem. 2016, 408, 5811–5818. [Google Scholar] [CrossRef] [PubMed]
  6. Abnous, K.; Danesh, N.M.; Ramezani, M.; Emrani, A.S.; Taghdisi, S.M. A novel colorimetric sandwich aptasensor based on an indirect competitive enzyme-free method for ultrasensitive detection of chloramphenicol. Biosens. Bioelectron. 2016, 78, 80–86. [Google Scholar] [CrossRef] [PubMed]
  7. Tang, M.L.; Wen, G.Q.; Luo, Y.H.; Kang, C.Y.; Liang, A.H.; Jiang, Z.L. A label-free DNAzyme-cleaving fluorescencemethod for the determination of trace Pb2+ based on catalysis of AuPd nanoalloy on thereduction of rhodamine 6G. Luminescence 2015, 30, 296–302. [Google Scholar] [CrossRef]
  8. Yuan, B.Y.; Zhou, Y.; Guo, Q.P.; Wang, K.M.; Yang, X.H.; Meng, X.X.; Wan, J.; Tan, Y.Y.; Huang, Z.X.; Xie, Q.; et al. A signal-on split aptasensor for highly sensitive and specific detection of tumor cells based on FRET. Chem. Commun. 2016, 52, 1590–1593. [Google Scholar] [CrossRef]
  9. Le Ru, E.; Etchegoin, P.G. Principles of Surface-Enhanced Raman Spectroscopy and Related Plasmonic Effects, 1st ed.; Elsevier: Amsterdam, The Netherlands, 2009. [Google Scholar]
  10. Camden, J.P.; Dieringer, J.A.; Wang, Y.; Masiello, D.J.; Marks, L.D.; Schatz, G.C.; Van Duyne, R.P. Probing the structure of single-molecule surface-enhanced Raman scattering hot spots. J. Am. Chem. Soc. 2008, 130, 12616–12617. [Google Scholar] [CrossRef]
  11. Anker, J.N.; Hall, W.P.; Lyandres, O.; Shah, N.C.; Zhao, J.; Van Duyne, R.P. Biosensing with plasmonic nanosensors. Nat. Mater. 2008, 7, 442–453. [Google Scholar] [CrossRef]
  12. Kabashin, A.V.; Evans, P.; Pastkovsky, S.; Hendren, W.; Wurtz, G.A.; Atkinson, R.; Pollard, R.; Podolskiy, V.A.; Zayats, A.V. Plasmonic nanorod metamaterials for biosensing. Nat. Mater. 2009, 8, 867–871. [Google Scholar] [CrossRef] [PubMed]
  13. McFarland, A.D.; Van Duyne, R.P. Single silver nanoparticles as real-time opti-cal sensors with zeptomole sensitivity. Nano Lett. 2003, 3, 1057–1062. [Google Scholar] [CrossRef] [Green Version]
  14. Marinakos, S.M.; Chen, S.; Chilkoti, A. Plasmonic detection of a model analyte inserum by a gold nanorod sensor. Anal. Chem. 2007, 79, 5278–5283. [Google Scholar] [CrossRef] [PubMed]
  15. Kajikawa, K.; Mitsui, K. Optical fiber biosensor based on localized surface plasmon resonance in gold nanoparticles. Optics East 2004, 5593, 494–501. [Google Scholar]
  16. Potara, M.; Gabudean, A.M.; Astilean, S. Solution-phase, dual LSPR-SERS plas-monic sensors of high sensitivity and stability based on chitosan-coatedanisotropic silver nanoparticles. J. Mater. Chem. 2011, 21, 3625–3633. [Google Scholar] [CrossRef]
  17. Chen, J.W.; Jiang, J.H.; Gao, X.; Liu, G.K.; Shen, G.L.; Yu, R.Q. A new aptameric biosensor for cocaine Based on surface-enhanced Raman scattering spectroscopy. Chem.-A Eur. J. 2008, 14, 8374–8382. [Google Scholar] [CrossRef]
  18. Duan, N.; Shen, M.F.; Wu, S.J.; Zhao, C.X.; Ma, X.Y.; Wang, Z.P. Graphene oxide wrapped Fe3O4@Au nanostructures as substrates for aptamer-based detection of vibrio parahaemolyticus by surface-enhanced Raman spectroscopy. Microchim. Acta 2017, 184, 2653–2660. [Google Scholar] [CrossRef]
  19. Chung, E.; Jeon, J.; Yu, J.M.; Lee, C.; Choo, J. Surface-enhanced Raman scattering aptasensor for ultrasensitive trace analysis of bisphenol A. Biosens. Bioelectron. 2015, 64, 560–565. [Google Scholar] [CrossRef]
  20. Luo, Y.; Jing, Q.; Li, C.; Liang, A.; Wen, G.; He, X.; Jiang, Z. Simple and sensitive SERS quantitative analysis of sorbic acid in highly active gold nanosol substrate. Sens. Actuators B Chem. 2018, 255, 3187–3193. [Google Scholar] [CrossRef]
  21. Li, C.N.; Liu, Y.Y.; Liang, A.H.; Jiang, Z.L. SERS quantitative analysis of trace ferritin based on immunoreactionregulation of graphene oxide catalytic nanogold reaction. Sens. Actuators B 2018, 263, 183–189. [Google Scholar] [CrossRef]
  22. Ouyang, H.; Ling, S.; Liang, A.; Jiang, Z. A facile aptamer-regulating gold nanoplasmonic SERS detection strategy for trace lead ions. Sens. Actuators B 2018, 258, 739–744. [Google Scholar] [CrossRef]
  23. Liang, A.H.; Li, C.N.; Li, D.; Luo, Y.H.; Wen, G.Q.; Jiang, Z.L. A facile and sensitive peptide-modulating graphene oxide nanoribbon catalytic nanoplasmon analytical platform for human chorionic gonadotropin. Int. J. Nanomed. 2017, 12, 8725–8734. [Google Scholar] [CrossRef] [PubMed] [Green Version]
  24. Lin, L.P.; Rong, M.C.; Luo, F.; Chen, D.M.; Wang, Y.R.; Chen, X. Luminescent graphene quantum dots as new fluorescent materials for environmental and biological applications. TrAC Trends Anal. Chem. 2014, 54, 83–102. [Google Scholar] [CrossRef]
  25. Du, Y.; Guo, S.J. Chemically doped fluorescent carbon and graphene quantum dots for bioimaging, sensor, catalytic and photoelectronic applications. Nanoscale 2016, 8, 2532–2543. [Google Scholar] [CrossRef]
  26. Zheng, X.T.; Ananthanarayanan, A.; Luo, K.Q.; Chen, P. Glowing graphene quantum dots and carbon dots: Properties, syntheses, and biological applications. Small 2015, 11, 1620–1636. [Google Scholar] [CrossRef]
  27. Guo, Y.L.; Liu, X.Y.; Yang, C.D.; Wang, X.D.; Wang, D.; Iqbal, A.; Liu, W.S.; Qin, W.W. Synthesis and peroxidase-like activity of cobalt@carbon-dots hybrid material. ChemCatChem 2015, 7, 2467–2474. [Google Scholar] [CrossRef]
  28. Sooksin, S.; Promarak, V.; Ittisanronnachai, S.; Ngeontae, W. A highly selective fluorescent enhancement sensor for Al3+ based nitrogen-doped carbon dots catalyzed by Fe3+. Sens. Actuators B Chem. 2018, 262, 720–732. [Google Scholar] [CrossRef]
  29. Li, N.; Liu, S.G.; Dong, J.X.; Fan, Y.Z.; Ju, Y.J.; Luo, H.Q.; Li, N.B. Using high-energy phosphate as energy-donor and nucleus growth-inhibitor to prepare carbon dots for hydrogen peroxide related biosensing. Sens. Actuators B Chem. 2018, 262, 780–788. [Google Scholar] [CrossRef]
  30. Wang, J.B.; Han, S.Q.; Fan, Z.Y.; Chen, Y.Y.; Zhang, L.F.; Jiang, F.Y. Carbon dots-catalyzed chemiluminescence for the determination of trace isonaphthol. J. Chin. Chem. Soc. 2017, 64, 486–492. [Google Scholar] [CrossRef]
  31. Long, Y.J.; Wang, X.L.; Shen, D.J.; Zheng, H.Z. Detection of glucose based on the peroxidase-like activity of reduced state carbon dots. Talanta 2016, 159, 122–126. [Google Scholar] [CrossRef]
  32. Wang, B.; Liu, F.; Wu, Y.Y.; Chen, Y.F.; Weng, B.; Li, C.M. Synthesis of catalytically active multielement-doped carbon dots and application for colorimetric detection of glucose. Sens. Actuators B Chem. 2018, 255, 2601–2607. [Google Scholar] [CrossRef]
  33. Yang, W.Q.; Huang, T.T.; Zhao, M.M.; Luo, F.; Weng, W.; Wei, Q.H.; Lin, Z.Y.; Chen, G.N. High peroxidase-like activity of iron and nitrogen co-doped carbon dots and its application in immunosorbent assay. Talanta 2017, 164, 1–6. [Google Scholar] [CrossRef] [PubMed] [Green Version]
  34. Kang, J.H.; Kundo, F.; Katayama, Y. Review: Human exposure to bisphenol A. Toxicology 2006, 226, 79–89. [Google Scholar] [CrossRef] [PubMed]
  35. Erler, C.; Novak, J. Bisphenol A exposure: Human risk and health policy. J. Pediatr. Nurs.-Nurs. Care Child. Fam. 2010, 25, 400–407. [Google Scholar] [CrossRef] [PubMed]
  36. WHO. Joint FAO/WHO Expert Meeting to Review Toxicological and Health Aspects of Bisphenol a: Summary Report Including Report of Stakeholders Meeting on Bisphenol A; Food and Agriculture Organization of the United Nations: Rome, Italy; World Health Organization: Geneva, Switzerland, 2010. [Google Scholar]
  37. Rochester, J.R. Bisphenol A and human health: A review of the literature, Reprod. Reprod. Toxicol. 2013, 42, 132–155. [Google Scholar] [CrossRef] [PubMed]
  38. Michałowicz, J. Bisphenol A sources, toxicity and biotransformation. Environ. Toxicol. Pharmacol. 2014, 37, 738–758. [Google Scholar] [CrossRef] [PubMed]
  39. Takino, A.; Tsuda, T.; Kojima, M.; Harada, H.; Muraki, K.; Wada, M. Development of Analytical Method for Bisphenol A in Canned Fish and Meat by HPLC. J. Food Hyg. Soc. Jpn. 2009, 40, 325–333. [Google Scholar] [CrossRef]
  40. Zhou, Q.H.; Jin, Z.H.; Li, J.; Wang, B.; Wei, X.Z.; Chen, J.Y. A novel air-assisted liquid-liquid microextraction based on in-situ phase separation for the HPLC determination of bisphenols migration from disposable lunch boxes to contacting water. Talanta 2018, 189, 116–121. [Google Scholar] [CrossRef]
  41. Zhang, D.W.; Yang, J.Y.; Ye, J.; Xu, L.R.; Xu, H.C.; Zhan, S.S.; Xia, B.; Wang, L.M. Colorimetric detection of bisphenol A based on unmodified aptamer and cationic polymer aggregated gold nanoparticles. Anal. Biochem. 2016, 499, 51–56. [Google Scholar] [CrossRef]
  42. Xu, J.Y.; Li, Y.; Bie, J.X.; Jiang, W.; Guo, J.J.; Luo, Y.L.; Shen, F.; Sun, C.Y. Colorimetric method for determination of bisphenol A based on aptamer-mediated aggregation of positively charged gold nanoparticles. Microchim Acta 2015, 182, 2131–2138. [Google Scholar] [CrossRef]
  43. Maroto, A.; Kissingou, P.; Diascorn, A.; Benmansour, B.; Deschamps, L.; Stephan, L.; Cabon, J.Y.; Giamarchi, P. Direct laser photo-induced fluorescence determination of bisphenol A. Anal. Bioanal. Chem. 2011, 401, 3011–3017. [Google Scholar] [CrossRef] [PubMed]
  44. Li, Y.; Xu, J.Y.; Wang, L.K.; Huang, Y.J.; Guo, J.J.; Cao, X.Y.; Shen, F.; Luo, Y.L.; Sun, C.Y. Aptamer-based fluorescent detection of bisphenol A usingnonconjugated gold nanoparticles and CdTe quantum dots. Sens. Actuators B 2016, 222, 815–822. [Google Scholar] [CrossRef]
  45. Zhan, T.R.; Song, Y.; Li, X.J.; Hou, W.G. Electrochemical sensor for bisphenol A based on ionic liquid functionalized Zn-Al layered double hydroxide modified electrode. Mater. Sci. Eng. C 2016, 64, 354–361. [Google Scholar] [CrossRef] [PubMed]
  46. Yao, D.M.; Liang, A.H.; Yin, W.Q.; Jiang, Z.L. Resonance light scattering determination of trace bisphenol A with signal amplification by aptamer-nanogold catalysis. Luminescence 2014, 29, 516–521. [Google Scholar] [CrossRef] [PubMed]
  47. Yao, D.M.; Wen, G.Q.; Jiang, Z.L. A highly sensitive and selective resonance Rayleigh scattering method for bisphenol A detection based on the aptamer-nanogold catalysis of the HAuCl4-vitamin C particle reaction. RSC Adv. 2016, 3, 13353–13356. [Google Scholar] [CrossRef]
  48. Lei, H.Y.; Hu, Y.L.; Li, G.K. A dual-functional membrane for bisphenol A enrichment and resonance amplification by surface-enhanced Raman scattering. Chin. Chem. Lett. 2018, 29, 509–512. [Google Scholar] [CrossRef]
  49. De, B.C.; Dumont, E.; Hubert, C.; Sacré, P.Y.; Netchacovitch, L.; Chavez, P.F.; Hubert, P.; Ziemons, E. A simple approach for ultrasensitive detection of bisphenols by multiplexed surface-enhanced Raman scattering. Anal. Chim. Acta 2015, 888, 118–125. [Google Scholar]
  50. Jabeen, S.; Dines, T.J.; Withnall, R.; Leharne, S.A.; Chowdhry, B.Z. Surface-enhanced Raman scattering studies of rhodanines: Evidence for substrate surface-induced dimerization. Phys. Chem. Chem. Phys. 2009, 11, 7476–7483. [Google Scholar] [CrossRef]
  51. Zhou, F.Q.; Zhang, L.; Liu, A.; Shen, Y.; Yuan, J.P.; Yu, X.J.; Feng, X.; Xu, Q.; Cheng, C.G. Measurement of phenolic environmental estrogens in human urine samples by HPLC–MS/MS and primary discussion the possible linkage with uterine leiomyoma. J. Chromatogr. B 2013, 938, 80–85. [Google Scholar] [CrossRef]
Figure 1. Mechanism of the carbon dots (CDs) catalytic reaction and the analysis principle.
Nanomaterials 12 01374 g001
Figure 2. Surface−enhanced Raman scattering (SERS) spectra. (a) a to h: solutions of CD−FN3 (0, 1.67, 3.33, 8.33, 33.33, 83.33, 166.67, and 333.33 μg/L) + 1.33 mmol/L AgNO3 + 4.67 mmol/L TSC + 3.33 × 10⁻⁷ mol/L Victoria blue B (VBB) + 0.02 mol/L NaCl; (b) a to h: solutions of CD−SN2 (0, 3.33, 8.33, 16.67, 33.33, 83.33, 333.33, and 833.33 μg/L) + 1.33 mmol/L AgNO3 + 4.67 mmol/L TSC +3.33 × 10⁻⁷ mol/L VBB + 0.02 mol/L NaCl.
Nanomaterials 12 01374 g002
Figure 3. SERS spectra of aptamer (Apt)−CD−AgNO3−TSC: (a) a to h: solutions of Apt (0, 0.33, 0.67, 1.67, 3.33, 5, 6.67, and 10 nmol/L) + 166.67 μg/L CD−FN3 + 1.33 mmol/L AgNO3 + 4.67 mmol/L TSC +3.33 × 10⁻⁷ mol/L VBB + 0.02 mol/L NaCl; (b) a to h: solutions of Apt (0, 0.33, 0.67, 1.33, 2.67, 3.33, 5, and 6.67 nmol/L) + 333.33 μg/L CD−SN2 + 1.33 mmol/L AgNO3 + 4.67 mmol/L TSC+3.33 × 10⁻⁷ mol/L VBB + 0.02 mol/L NaCl.
Nanomaterials 12 01374 g003
Figure 4. SERS spectra of bisphenol A (BPA)−Apt−CD−AgNO3−TSC: (a) a to h: solutions of 3.33 nmol/L Apt + 166.67 μg/L CD−FN3 + BPA (0, 0.33, 0.67, 1.33, 3.33, 6.67, 13.33, 33.33, and 66.67 nmol/L) + 1.33 mmol/L AgNO3 + 4.67 mmol/L TSC+3.33 × 10⁻⁷ mol/L VBB + 0.02 mol/L NaCl; (b) a to h: solutions of6.67 nmol/L Apt + 333.33 μg/L CD−SN2 + BPA (0, 1.33, 3.33, 6.67, 13.33, 33.33, 66.67, and 100 nmol/L) + 1.33 mmol/L AgNO3 + 4.67 mmol/L TSC + 3.33 × 10⁻⁷ mol/L VBB + 0.02 mol/L NaCl.
Nanomaterials 12 01374 g004
Figure 5. SEM images of Apt–CD-FN3–AgNO3–TSC–BPA system (20.67 nmol/L Apt + 333.33 μg/L CD-FN3 + 1.33 mmol/L AgNO3 + 4.67 mmol/L TSC) at the temperature of 85 °C for 21 min with different BPA concentrations: (a) 0 nmol/L; (b) 3.33 nmol/L; (c) 13.33 nmol/L.
Nanomaterials 12 01374 g005
Figure 6. Working curves for the SERS determination of Apt–CD–AgNO3–TSC–BPA: (a) the solution of 6.67 nmol/L Apt + 3.33–133.33 nmol/L BPA + CD-FN + 1.33 mmol/L AgNO3 + 4.67 mmol/L TSC + 3.33 × 10⁻⁷ mol/L VBB + 0.02 mol/L NaCl; (b) the solution of 10.00 nmol/L Apt + 3.33–133.33 nmol/L BPA + CD-SN + 1.33 mmol/L AgNO3 + 4.67 mmol/L TSC + 3.33 × 10⁻⁷ mol/L VBB + 0.02 mol/L NaCl.
Nanomaterials 12 01374 g006
Table 1. Analytical characteristics of the Apt-adjusted catalysis and Ag nanoplasma SERS for the determination of BPA.
Test MethodNanocatalystWorking CurveLinearly RangeCoefficient (R2)Limit of Detection
SERSCD-FN0 Δ I 1614   cm 1 = 7.96 C − 0.813.33–133.33 nmol/L0.99881.2 nmol/L
CD-FN1 Δ I 1614   cm 1 = 22.12 C + 59.701.33–100 nmol/L0.9830.8 nmol/L
CD-FN2 Δ I 1614   cm 1 = 39.16 C + 132.510.67–66.67 nmol/L0.97090.2 nmol/L
CD-FN3 Δ I 1614   cm 1 = 54.50 C + 50.220.33–66.67 nmol/L0.99780.1 nmol/L
CD-FN4 Δ I 1614   cm 1 = 40.13 C + 136.50.67–66.67 nmol/L0.9660.3 nmol/L
CD-FN5 Δ I 1614   cm 1 = 38.49 C + 104.610.67–66.67 nmol/L0.9840.3 nmol/L
CD-SN0 Δ I 1614   cm 1 = 17.31 C + 18.753.33–133.33 nmol/L0.99842.0 nmol/L
CD-SN1 Δ I 1614   cm 1 =22.93 C + 58.281.33–100 nmol/L0.98860.8 nmol/L
CD-SN2 Δ I 1614   cm 1 = 35.00 C + 17.671.33–100 nmol/L0.99760.5 nmol/L
CD-SN3 Δ I 1614   cm 1 = 25.67 C + 32.601.33–100 nmol/L0.9960.6 nmol/L
CD-SN4 Δ I 1614   cm 1 = 25.98 C + 46.791.33–100 nmol/L0.99460.7 nmol/L
CD-SN5 Δ I 1614   cm 1 = 23.81 C + 57.911.33–100 nmol/L0.99490.7 nmol/L
CD Δ I 1614   cm 1 = 34.12 C + 46.860.67–66.67 nmol/L0.98960.3 nmol/L
CDGN Δ I 1614   cm 1 = 15.07 C + 45.550.67–66.67 nmol/L0.97590.5 nmol/L
CDCa Δ I 1614   cm 1 = 19.09 C + 47.840.67–66.67 nmol/L0.98510.45 nmol/L
CD-CN1 Δ I 1614   cm 1 = 8.66 C − 0.481.33–100 nmol/L0.9970.7 nmol/L
CD-CN2 Δ I 1614   cm 1 = 31.47 C + 56.140.67–66.67 nmol/L0.99380.3 nmol/L
CD-CN3 Δ I 1614   cm 1 = 25.21 C + 45.160.67–66.67 nmol/L0.98890.4 nmol/L
CD-CN4 Δ I 1614   cm 1 = 21.85 C + 41.740.67–66.67 nmol/L0.99280.4 nmol/L
CD-CN5 Δ I 1614   cm 1 = 18.39 C + 44.540.67–66.67 nmol/L0.98120.5 nmol/L
Ag nanoparticle (AgNP) Δ I 1614   cm 1 = 27.24 C + 38.920.67–66.67 nmol/L0.99380.3 nmol/L
Publisher’s Note: MDPI stays neutral with regard to jurisdictional claims in published maps and institutional affiliations.