Article

Surface Adsorption Mechanism between Lead(II,IV) and Nanomaghemite Studied on Polluted Water Samples Collected from the Peruvian Rivers Mantaro and Cumbaza

by
Juan A. Ramos-Guivar
1,*,
Noemi-Raquel Checca-Huaman
2,
F. Jochen Litterst
3 and
Edson C. Passamani
4
1
Grupo de Investigación de Nanotecnología Aplicada Para la Biorremediación Ambiental, Energía, Biomedicina y Agricultura (NANOTECH), Facultad de Ciencias Físicas, Universidad Nacional Mayor de San Marcos, Av. Venezuela Cdra 34 S/N, Ciudad Universitaria, Lima 01, Peru
2
Centro Brasileiro de Pesquisas Físicas, Rio de Janeiro 22290-180, RJ, Brazil
3
Institut fur Physik der Kondensierten Materie, Technische Universität Braunschweig, 38106 Braunschweig, Germany
4
Departamento de Física, Universidade Federal do Espírito Santo -UFES, Vitória 29075-910, ES, Brazil
*
Author to whom correspondence should be addressed.
Nanomaterials 2023, 13(10), 1684; https://doi.org/10.3390/nano13101684
Submission received: 28 March 2023 / Revised: 21 April 2023 / Accepted: 24 April 2023 / Published: 20 May 2023

Abstract

:
Real water remediation is an important issue that requires the development of novel adsorbents with remarkable adsorption properties, permitting reusability. In this work, the surface and adsorption properties of bare magnetic iron oxide nanoparticles were systematically studied, before and after the application of a maghemite nanoadsorbent in two real Peruvian effluents severely contaminated with Pb(II), Pb(IV), Fe(III), and others. We were able to describe the Fe and Pb adsorption mechanisms that occurred at the particle surface. 57Fe Mössbauer and X-ray photoelectron spectroscopy results together with kinetic adsorption analyses gave evidence for two involved surface mechanisms: (i) surface deprotonation of maghemite nanoparticles (isoelectric point of pH = 2.3), forming Lewis sites bonding Pb complexes; and (ii) the formation of a thin inhomogeneous secondary layer of iron oxyhydroxide and adsorbed Pb compounds, as favored by surface physicochemical conditions. The magnetic nanoadsorbent enhanced the removal efficiency to values of ca. 96% and provided adsorptive properties with reusability due to the conserved morphological, structural, and magnetic properties. This makes it favorable for large-scale industrial applications.

1. Introduction

The surface and adsorption properties of magnetic nanoparticles (NPs) deserve scientific investigations concerning the treatment of real effluents (rivers). Particularly, water bodies become continually strained by toxic metals, such as lead (Pb), cadmium (Cd), and chromium (Cr), a pollution problem that may have natural and/or anthropogenic origins, the latter mainly due to agriculture and mining activities [1].
In South America [2], legal and illegal mining activities produce a gradual and continuous reduction in biodiversity and also accumulate tailings. Usually, the contaminations are obtained through mineral flotation processes, in which the valuable mineral is severely extracted from the rest, causing, therefore, an increase in the degree of contamination in the water receptors that are often lakes, lagoons, rivers, and the sea. Therefore, the diffusion of toxic metals into water bodies provokes a progressive and constant accumulation, affecting both living organisms and the environment.
It is unnecessary to emphasize that water is essential for all living beings, but the available fresh drinking water is only 2.5% of the global fraction when one compares it with the sea and ocean waters that have an amount ca. 97%. Therefore, regarding water contamination, illegal mining in several developing countries (e.g., Peru, in particular) is partly responsible for the short- and long-term exposure and damage to the water bodies with a high degree of toxic metals that certainly alters their ecosystems [3]. One of the most common contaminants from Peruvian mines is Pb (mainly in the form of ions and compounds), a toxic metal that has the greatest human health risk when its ingestion and exposure occurs above its WHO permissible level of 10 µg L−1 [4]. It may cause learning difficulties in children, consequently affecting their intellectual development [5]. In adults, cardiovascular diseases [6] and genotoxic effects in several human organs [7] have been reported. Thus, considering (i) the unfortunate situation of several towns in developing countries close to mining activities and (ii) that the people living nearby are practically forced to ingest these polluted waters, it is urgently necessary to develop processes to remove and/or reduce Pb(II) contaminants quickly and effectively to make the waters of the ecosystems suitable for human consumption, animal nutrition, and also irrigation.
In response to this issue, various ordinary methods have been applied for purifying Pb-contaminated water [8,9,10]. The adsorption processes represent one of the latest trends in water purification, without adverse effects on health, being highly effective for decontamination [11,12]. We highlight banana peel, a natural system that has been applied for removing Pb from a synthetic effluent [13]. Another natural adsorbent that has been tested is based on the exoskeletons of shrimps [14]. Synthetic adsorbents, e.g., inorganic magnetic iron oxide nanoadsorbents, have also been applied, with a Pb removal efficiency of 99.9%, short equilibrium time of only 5 min, and fast magnetic separation response [15].
Here, it should be mentioned that an improvement in the adsorbent properties has been observed using a nanohybrid composed of magnetic nanoparticles (NPs) and zeolites 5A, an effect that was explained considering an increase in the specific surface area, active sites, and magnetic response of the resultant nanohybrid’s mesoporous material. These properties open perspectives towards 100% Pb(II) removal via an adsorption process dominated by cation exchange among calcium ions, the protonated maghemite (γ-Fe2O3) surface, and Pb cations. Therefore, new nanohybrids using other functional groups (organic and inorganic) have also been developed and tested [12,15,16]. Hence, depending on the adsorbent nature, many synergetic adsorption mechanisms can occur, including electrostatic attraction, chelating, cation exchange, host–guest interaction, and others [17].
Regarding the excellent results of Pb removal reported in the literature [8,9,10,11,12,13,14,15,16], most of the reported works tested synthetic effluents, where the ambient of the effluent was well controlled and the effects of other contaminants were mostly discarded. The adsorption experiments are often performed only for Pb(II) species. However, in real waters, other Pb species and other constituents are found, which may affect the Pb(II) adsorption [14,15,16,17]. Hence, the adsorbents must be re-evaluated under this condition, assuming their applications for the magnetic remediation process. For instance, for pure magnetic NPs, the complexation between iron oxide NPs and Pb chemical groups is still less studied for understanding the complete surface adsorption mechanism.
The above-mentioned aspects were issues in the present work. In particular, we synthesized γ-Fe2O3 NPs using the conventional co-precipitation method, and systematic structural and adsorption characterizations were performed using several analytical techniques, including X-ray diffraction, N2 physisorption, infrared and Raman spectroscopy, and transmission electron microscopy. The Pb removal properties were evaluated for water samples collected from two Peruvian rivers, and their kinetic adsorption mechanisms were investigated. To understand the surface adsorption mechanism, transmission electron microscopy (TEM), energy-dispersive spectroscopy (EDS), X-ray photoelectron spectroscopy (XPS), 57Fe Mössbauer spectrometry, and vibrating sample magnetometry (VSM) were systematically performed on the samples after Pb removal. Thus, this study brings information about the surface properties of pure γ-Fe2O3 NPs and their interactions with Pb ions in contaminated effluents obtained from real rivers, an issue that has been rarely discussed in the literature.

2. Materials and Methods

2.1. Adsorbent Synthesis

For the adsorbent synthesis, the chemical co-precipitation method was used. For this, 250 mL of distilled water was added to a flat-bottomed flask. Then, it was placed on a magnetic stirrer, with a stirring speed of 550 rpm, until it reached a stable temperature of 80 °C. After that, 12.0 g of FeCl3 and 10.4 g of FeSO4•7H2O were added to the heated water, upon which a reddish dispersion was obtained and kept at 80 °C. Immediately after, 50 mL of NH4OH was added to the solution under vigorous stirring for 30 min. Then, the reaction product was left to cool down to room temperature (RT), and a neodymium-based magnet was used to assist the washing procedure until a solution with pH = 7 was obtained. Subsequently, the sample was dried in an oven at 80 °C for 6 h and the final powder was labeled as RG1.

2.2. Characterization

Cu-Kα X-ray diffractogram was recorded for the RG1 sample with Empyrean equipment (Malvern Panalytical, Malvern, UK) under the same conditions reported in the literature [15,16]. The X-ray diffractogram (XRD) was refined using the Rietveld method, using the FullProf Suite program, in which the Al2O3 phase was considered as standard. The structural identification was carried out using the CIF # 9005814 given by the Match! Program v3 [13]. The Thompson–Cox–Hastings (TCH) function was used to perform diffraction profile modeling. N2 adsorption/desorption isotherms recorded at 77 K were measured using a Micrometrics Tristar 3000 Sorptometer. Before measurements, a degasification step was performed at 300 °C for five hours. Textural parameters, including specific surface area and pore size distribution, were, respectively, estimated using the BET and BJH models, where the pore volume was considered at P/P0 = 0.98. The RT infrared (IR) spectrum data were collected by using an IRPrestige-21 Shimadzu spectrophotometer. For this analysis, the IR frequency range varied between 400 and 4000 cm−1, considering an optical resolution of 2 cm−1. The Raman characterization was carried out using a Renishaw inVia Raman microscope. A Helium–Neon laser with wavelength of 633 nm and initial laser power of 7.17 mW was employed as excitation source. The total exposure time of the samples was two accumulations of 10 s each, with an objective of 50× magnification for measurements. Several fractions (%) of the initial laser power were used to systematically analyze the Raman spectra using 0.05%, 0.1%, 0.5%, 1%, 5%, 10%, and 50%, respectively. This process was labeled as “before burning protocol”. The “after burning protocol” was performed by first exposing the sample to 7.17 mW and repeating the steps for “before burning experiments”. The titration curve of the dispersed sample was determined using a Brookhaven Nanobrook 90 Plus PALS. The initial suspension pH value was 7. For determination of average particle size, histogram distributions, and NP morphologies, the electron imaging (EM) microscopy technique was applied under three operative modes, i.e., in transmission (TEM), in scanning (STEM), and in transmission at high-resolution (HRTEM), which are available in the JEOL 2100F (Tokyo, Japan) instrument working at an accelerating voltage of 200 kV and using a CMOS camera for acquisition of TEM and HRTEM images. STEM images were acquired using a high-angular annular dark-field (HAADF) field detector. The microscope was also equipped with accessories for energy-dispersive X-ray spectroscopy (EDS). The elemental compositions of the samples were investigated via EDS to evaluate the atomic composition in STEM mode. The 57Fe Mössbauer spectra recorded at 15 K, 17 K, and RT (300 K) were collected in transmission mode using a conventional spectrometer operating with sinusoidal velocity sweep and using a 40 mCi source of 57Co in Rh matrix. For the low-temperature measurements, the source was kept at RT, and the absorber temperature was decreased to 15 K, employing a Janis closed-cycle setup. The powder absorber was put into nylon sample holders, and its effective thickness was chosen to be equivalent to ca. 0.1 mg 57Fe per cm2. Finally, magnetic properties were studied using zero-field-cooling (ZFC) and field-cooling (FC) protocols. Thus, M(H) loops were collected at RT and 5 K using a vibrating sample magnetometer (VSM) working in a dynacool setup with a maximum field ( B = μ o H ) of 7 T. The FC experiment was conducted with a cooling field of 1 T and a sweep field of ±7 T (the FC experiments were carried out to check for possible exchange bias effect).

2.3. X-ray Photoelectron Spectroscopy before and after Heavy Metal Adsorption Experiments in Real Waters

Chemical surface analyses on the studied samples were performed via X-ray photoelectron spectroscopy (XPS) using the SPECS PHOIBOS 100/150 equipment with a hemispheric analyzer spectrometer, operating at 1486.6 eV of Al Kα. The XPS spectra were collected with a high-resolution polychromatic X-ray source within an energy step of 0.02 eV. Casa-XPS software (SPECS company) was used to fit the peak positions of the Fe 2p, Pb 4f, Si 2p, O 1s, and C 1s levels to determine the chemical binding energies (BEs) of formed species and to calculate the relative atomic quantities on the sample surfaces. The spectra were calibrated using adventitious carbon (B.E. reference) at C 1s = 284.6 eV, previously using an electron flood gun at 12 µA and 1 eV.

2.4. Adsorption Kinetic Protocol in Real Waters

The collection of real waters from the Mantaro River (Junin department, coordinates 12°16′0″ S 73°57′0″ W, 12:20 p.m. 1 August 2021) and the Cumbaza River (San Martin department, coordinates 6°36′5″ S 76°19′46″ W, 10:49 a.m. 5 October 2021) was carried out following a standard sampling procedure: (i) water was stored in a 20 L container that was previously rinsed three times with ultrapure water; (ii) it was collected from the surface of rivers to avoid the presence of sediments, and (iii), subsequently, the aliquots were stored using nitric acid (HNO3). The Pb concentrations detected by inductively coupled plasma optical emission spectroscopy (ICP) were 0.19 and 0. 28 mg L−1, respectively, for Mantaro and Cumbaza rivers, values that are 19- and 28-times higher than the permissible level reported by the WHO (10 µg L−1) [4]. The initial pH value in both rivers varied from 6.5 to 7 on the days that the samples were collected. Different Pb species will coexist in a real water environment. Hence, to ensure the presence of Pb(II) species, it was necessary to modify the concentration using lead nitrate (Pb(NO3)2). The modified concentrations were 1.7 mg L−1 (Mantaro, modified pH equal to 7.8) and 18 mg L−1 (Cumbaza, pH equal to 6.8). Additionally, other toxic metals, such as Mn, Fe, and Cd, were quantified since they are known to interfere with Pb(II) adsorption [12]. For the Mantaro river, the concentrations of Mn, Fe, and Cd were, respectively, equal to 0.01 mg L−1, 0.9 mg L−1, and Cd 0.009 mg L−1. For the Cumbaza river, the concentrations were found to be 0.01 mg L−1 Mn, 0.21 mg L−1 Fe, and 0.009 mg L−1 Cd. Mn concentration in both rivers was below the value reported by the WHO as a permissible level [18], while the Fe concentration exceeded the permissible level in the Mantaro river [18]. In addition, the Cd concentration was three-times higher than the value of the permissible level for drinking water (3 µg L−1) in both rivers [18].
For batch kinetic experiments, 25 mg of adsorbent was added to 50 mL of initial Pb solution at 25 °C for intervals of 5 min to 24 h. Once the equilibrium time was determined, the adsorbent dose at RT was investigated by changing the adsorbent amount (5, 10, 15, 25, 30, and 50 mg) in contact with Pb initial solution from the Cumbaza river only. The initial and equilibrium pH values were monitored in all kinetic experiments. The quantification of Pb concentrations was performed using atomic absorption spectroscopy. A Varian atomic absorption spectrometer was used for measurements after calibration with stock solutions. To estimate the total lead amount, we employed the difference between the initial (C0) and final (Ct) concentrations (mg L−1) in the solutions, which is mathematically expressed as [15]:
q t = C 0 C t V m ( mg   g 1 )
where q t is the adsorbed amount per gram at certain time t; m is the adsorbent mass (g); and V (L) is the batch volume. The homogenization time between the magnetic adsorbent RG1 and the Pb(II) solution occurred after 15 min of prior stirring. After that, the kinetic adsorption time was measured at different times. After each adsorption kinetic experiment, the solid part of the solution was separated. For this purpose, a cylindrical neodymium-based magnet was employed and placed near the solution for 15 min to magnetically separate the solid part from the resulting solution. The recovered mass used further for adsorption experiments (Cumbaza river only) was labeled as RG2. The samples recovered after the adsorption kinetic experiments were labeled as RG3 (Cumbaza river) and RG4 (Mantaro river), respectively. In this manuscript, this series of samples will hereafter be named as RGx (x = 1–4).

3. Results and Discussion

3.1. X-ray and Rietveld Analysis

The Rietveld refinement of the X-ray diffractogram of the RG1 sample is shown in Figure 1a. Table 1 summarizes the refined parameters. Structurally speaking, the theoretical model agrees with the cubic inverse spinel structure, space group Fd 3 ¯ m. However, it should be mentioned that it is extremely hard to differentiate between Fe3O4 and γ-Fe2O3 structures from X-ray experiments because both crystal phases are quite similar on the nanoscale [12]. On the other hand, regarding the mean crystallite size, the RG1 nanoadsorbent had a value of 15.2(3) nm, a size that corroborated with the nanoscale character of the RG1 sample (more information about particle size will be given with TEM data below).

3.2. Textural Properties

Figure 1b shows the hysteresis adsorption isotherm recorded at 77 K for the RG1 sample. The estimated textural properties were BET area of 75.9 m2/g, pore volume of 0.298 cm3/g, and pore diameter equal to 15 nm. As observed from Figure 1c, the pore distribution (estimated from BJH method) revealed a broad pore distribution. The shape of the isotherm curve was characteristic of an IV-type isotherm related to mesoporous materials [19].

3.3. IR and µ-Raman Analysis

In the low-IR region, three characteristic peaks were found, located at 543, 628, and 691 cm−1 (see Figure 1d). According to Vidal-Vidal et al. [20], the optical IR absorption bands related to Fe3+–oxygen stretching vibration are positioned at 750 to 550 cm−1 for tetrahedral Fe sites and from 550 to 300 cm−1 for octahedral Fe sites. They are assigned to the cubic spinel structure of the γ-Fe2O3 phase [20]. No Fe2+–oxygen stretching vibrations were observed. Between 1625 cm−1 and 3340 cm−1, a broad IR band was seen that may be related to the bending vibration of water molecules δ (OH) and stretching vibration of OH groups [21]. However, the differentiation about Fe2+ and Fe3+-oxygen coordination could not be taken as conclusive since IR experiments are sensitive to Fe site deficiency and transitional symmetry lost in the γ-Fe2O3 NPs. It means that IR modes of the γ-Fe2O3 phase can overlap to activated IR modes of the Fe3O4 [22] and they can be masked in the case of core–shell Fe3O4@γ-Fe2O3 (it is difficult to differentiate both inverse spinel lattices).
On the other hand, in a typical Raman measurement, careful analysis must be conducted when analyzing iron oxide NP samples. An increase above the threshold laser power [23] might lead to a misunderstanding of an analyzed iron oxide phase due to structural alterations that may be enhanced in NP, i.e., a structural phase transformation: γ-Fe2O3 α-Fe2O3 (or simply γ α). Previous studies have shown that the threshold value depends strongly on the size of the NPs and also the functionalized agent. The latter may give thermal stability to the iron oxide NP sample, i.e., the γ α transition will occur at higher temperatures [23,24,25,26]. Hence, two protocols given in the experimental sections were performed to correctly analyze the RG1 sample.

3.3.1. Characterization of Sample RG1 (“before Burning Protocol”)

As previously mentioned, the γ-Fe2O3 and Fe3O4 phases were hardly differentiated by several experimental methods when these materials were in the nanoscale regime. Regarding IR spectroscopy, Fe3O4 had three well-defined Raman bands, with a characteristic intense optical mode located at 670–680 cm−1 (A1g) [22,23], i.e., this mode is more intense (than the other two active optical modes) and can be used to identify the Fe3O4 phase, as will be discussed below.
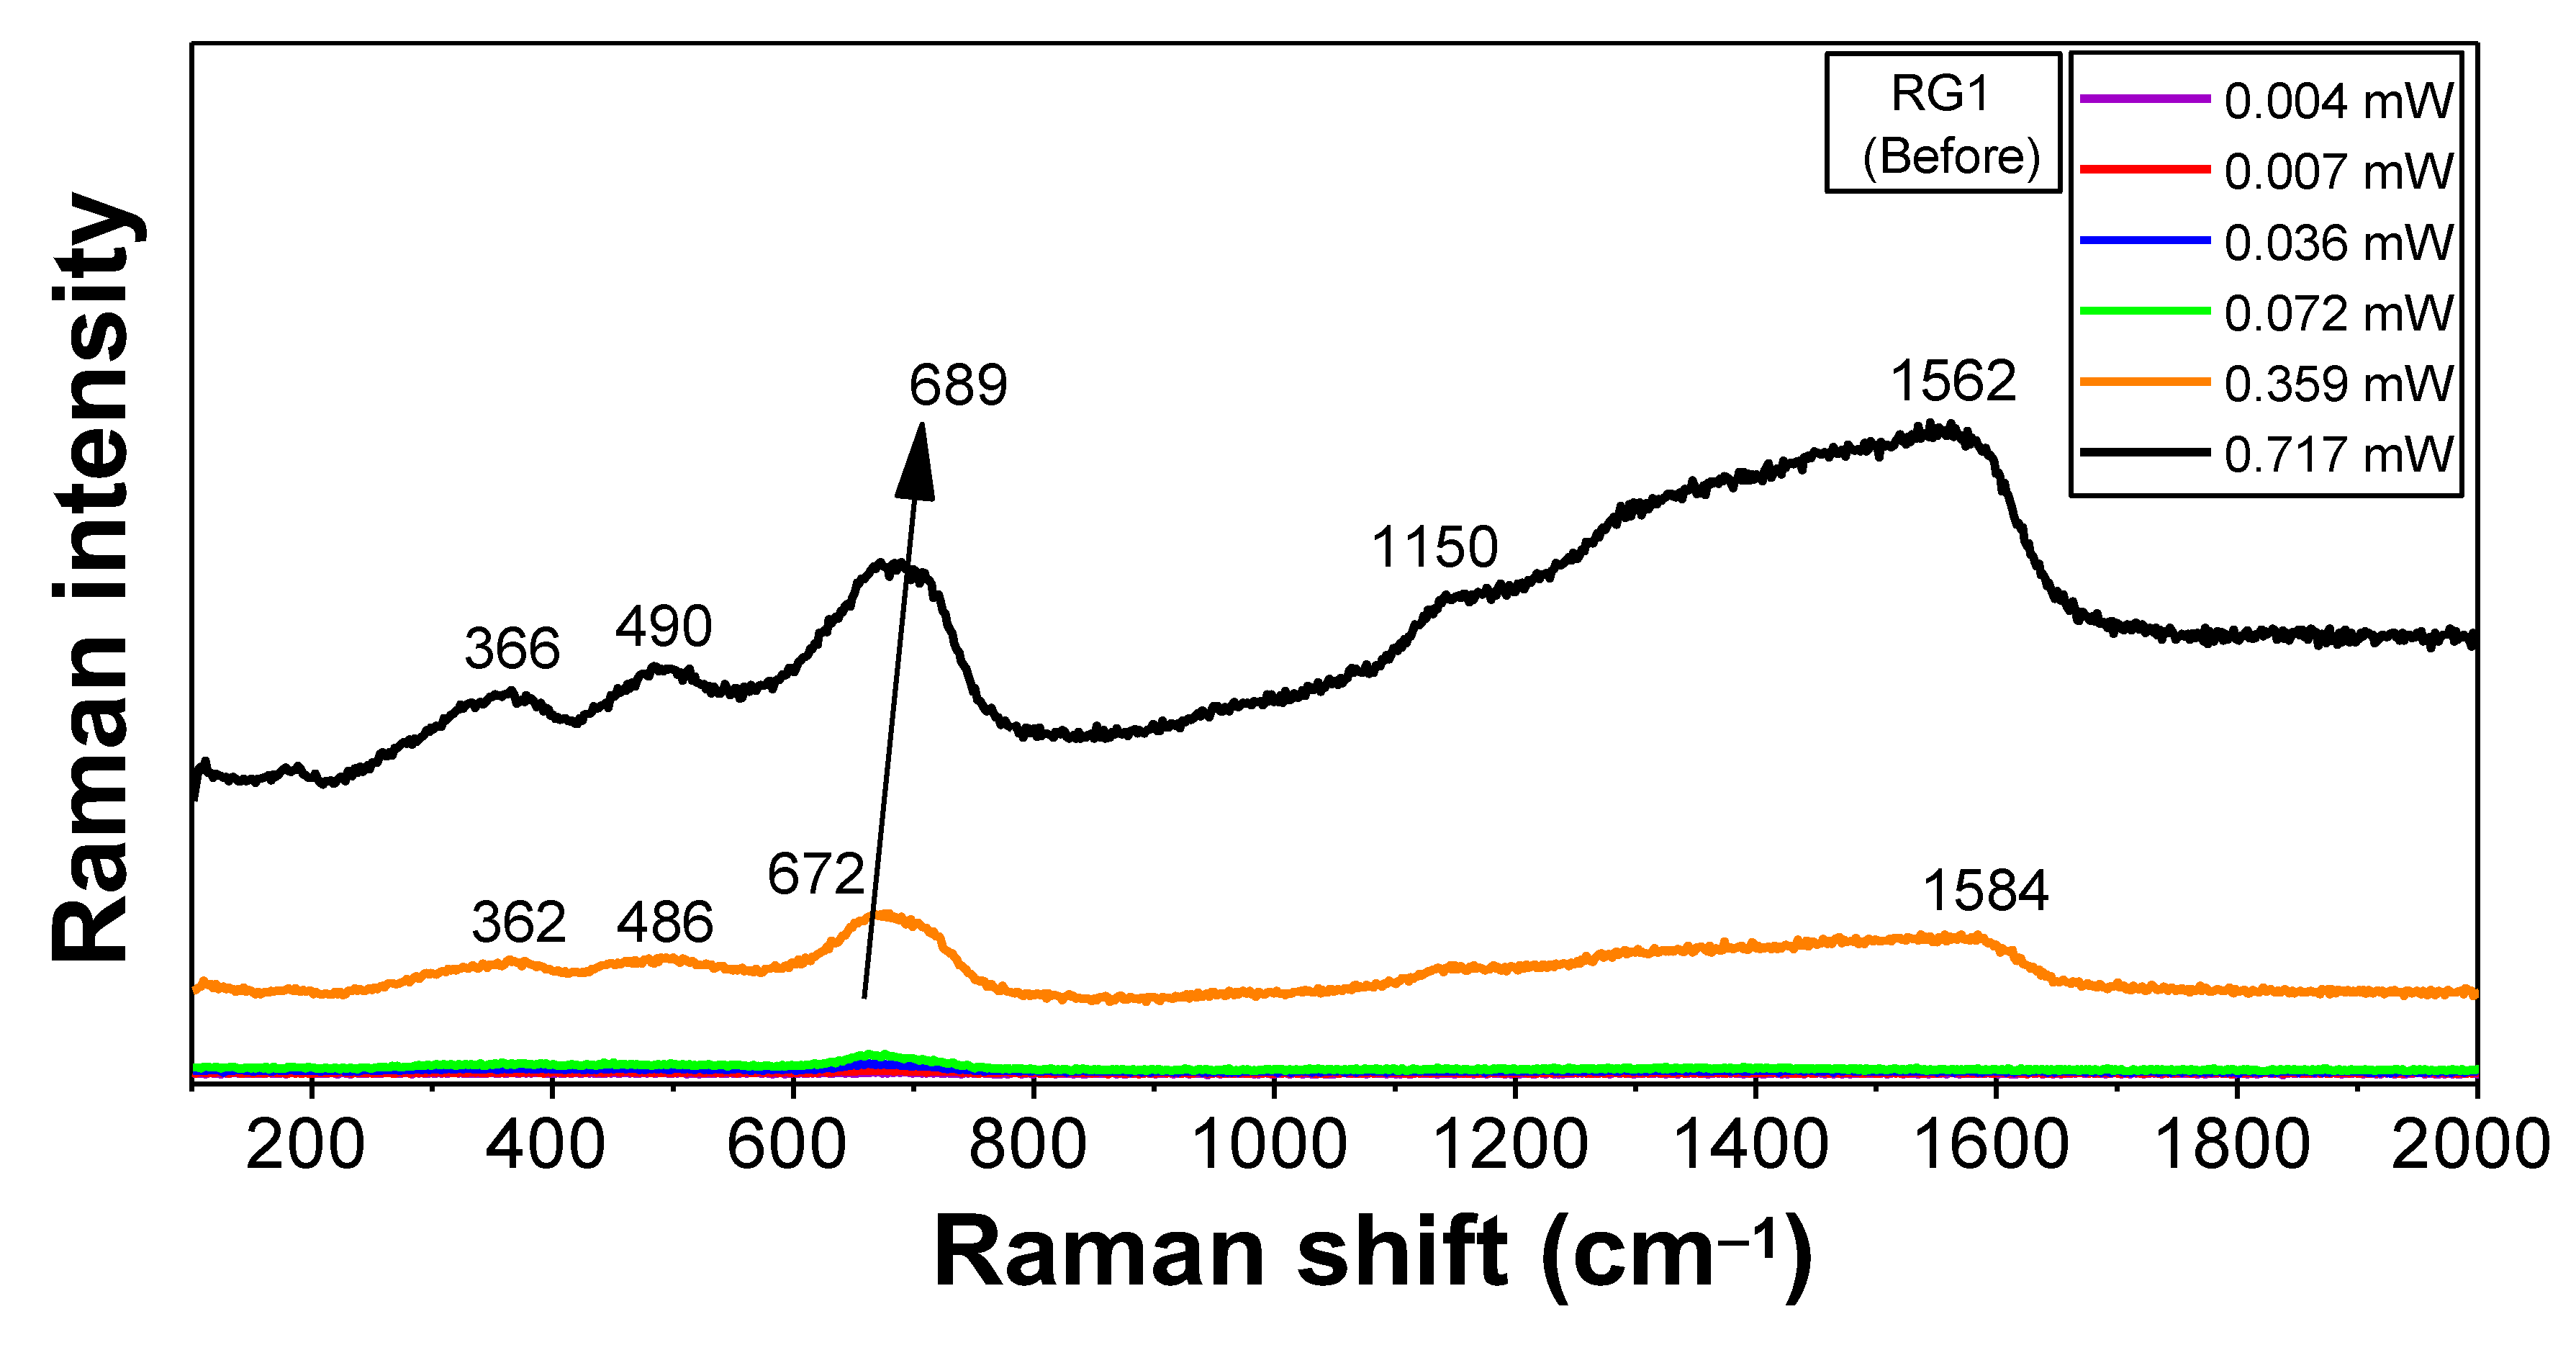
On the other hand, the γ-Fe2O3 phase also exhibited three featured Raman modes, but differing from those of the Fe3O4 phase, because the main optical mode had a broadened signal slightly shifted to 720 cm−1 [23]. Specifically, uncoated γ-Fe2O3 NPs had more Raman optical modes, and, in particular, the third peak can be deconvoluted into 678 cm−1 (Eg) and 723 cm−1 (A1g) [27]. However, for pure Fe3O4 NPs, the additional Raman mode at ~720 cm−1 is absent. Hence, the apparent absence of this optical active mode may help us to differentiate samples containing the pure γ-Fe2O3 or Fe3O4 phase. It is also important to highlight that on the nanoscopic scale, Raman spectra depend on the particle size and thermal, chemical, and aging effects, sometimes leading to a broadening effect of Raman bands. In particular, the Fe3O4 NPs, exposed to normal air conditions, tended to oxidize superficially, consequently forming a core–shell arrangement, where the shell was mainly composed of the γ-Fe2O3 phase. This process makes it tough to identify the Raman bands of Fe3O4 NPs. One way to solve the presence of the γ-Fe2O3 shell is exposing the sample to different laser powers, because the γ-Fe2O3 phase must exhibit extra Raman modes when the structural phase transformation to α-Fe2O3 occurs. This phenomenon may be related to the local temperature change produced by the laser power that may reach values above the Curie temperature (580 °C) of the γ-Fe2O3 phase [23,24,25]. Thus, the Raman spectra (0.004 mW to 0.717 mW) for the RG1 sample are recorded and plotted in Figure 2.
The Raman spectrum of the RG1 sample has a fingerprint associated with the Fe3O4 signal at 672 cm−1 up to a laser irradiation power of 0.359 mW, whilst the fingerprint signal for the γ-Fe2O3 phase should occur at 720 cm−1 [23,27]. Upon an increase in laser power, we found a slight shift in the Raman peak from 672 cm−1 to 689 cm−1, indicating the formation of the γ-Fe2O3 phase at the Fe3O4 NPs surfaces. These results support an Fe3O4-γ-Fe2O3 core–shell-type scenario, a supposition that is supported by the “after burning protocol”, as will be shown below. A γ α Fe2O3 phase transformation was not observed in the sample under the tested laser powers; therefore, the γ-Fe2O3 shell thickness of the sample is much smaller than the fraction of the Fe3O4. However, this state may gradually change over time due to exposure to normal atmospheric conditions or under even higher laser power values.

3.3.2. Characterization of Sample RG1 (“after Burning Protocol”)

The RG1 sample was intentionally burned at 100% at a power of 7.17 mW for 20 s and the hematite phase (α-Fe2O3) was easily observed, as displayed in Figure S1. Therefore, the γ-Fe2O3 fraction initially presented at the surface of the Fe3O4 NPs gradually increases in amount with time and laser exposition. As a consequence, the α-Fe2O3 phase is noticeably present after annealing the RG1 sample, starting at a power of 0.359 mW and better identified by gradually increasing the laser power during the IR experiments. Three mechanisms are proposed to describe the gradual transformations mentioned above: (i) the part of the shell surface composed of γ-Fe2O3 first transforms to α-Fe2O3 during laser exposure, releasing heat and oxygen, (ii) the released oxygen leads to the oxidation of nanomagnetite (Fe3O4+O2 → γ-Fe2O3), and (iii) this nano γ-Fe2O3 follows the process of structural phase transformation to α-Fe2O3 according to (i).
Considering that the NPs synthetized through co-precipitation were all acceptable, the Pb removal experiments can now be discussed assuming that the main constituent of the core of the NPs is basically formed by γ-Fe2O3 (the as-prepared NPs were applied months later and the Fe3O4 → γ-Fe2O3 transformation naturally occurred, as will be shown by other results).

3.4. Pb Removal Efficiency in Real Waters

The dependence of the toxic Pb metal uptake efficiency versus time is shown in Figure 3a. Both experiments performed with effluents from the Mantaro and Cumbaza rivers indicated a Pb removal better than 90%. In particular, for the Mantaro River, a removal percentage of 90% was obtained in an equilibrium time of 10 min, whereas the equilibrium time occurred for 60 min with a maximum removal percentage of 96% for the Cumbaza river. When comparing to other adsorbent materials based on nanoscopic Fe-oxides [12], the RG1 sample is significantly competitive. The proposed adsorbent system also presents results in two real water bodies compared to the systems reported in the literature, which are usually carried out in synthetic waters (i.e., simulated waters containing no interferents) [12,13]. The Fe concentration after adsorption studies (using the RG1 sample, in both rivers) is below the limit of detection of the equipment (<10 µg L−1). In the case of Mantaro river, the equilibrium time was 5 min for Fe, whilst for the Cumbaza river, a value of 8 h was reached. This means that Fe ions can also be removed using the RG1 adsorbent. More importantly, Fe ions are not leached during the adsorption process. In the case of Cd concentrations, the values remained in the same range after the Pb removal, which indicated that the RG1 sample was not chemically interacting with this divalent toxic metal, as will also be shown by the XPS results.

3.5. Kinetic Adsorption Models

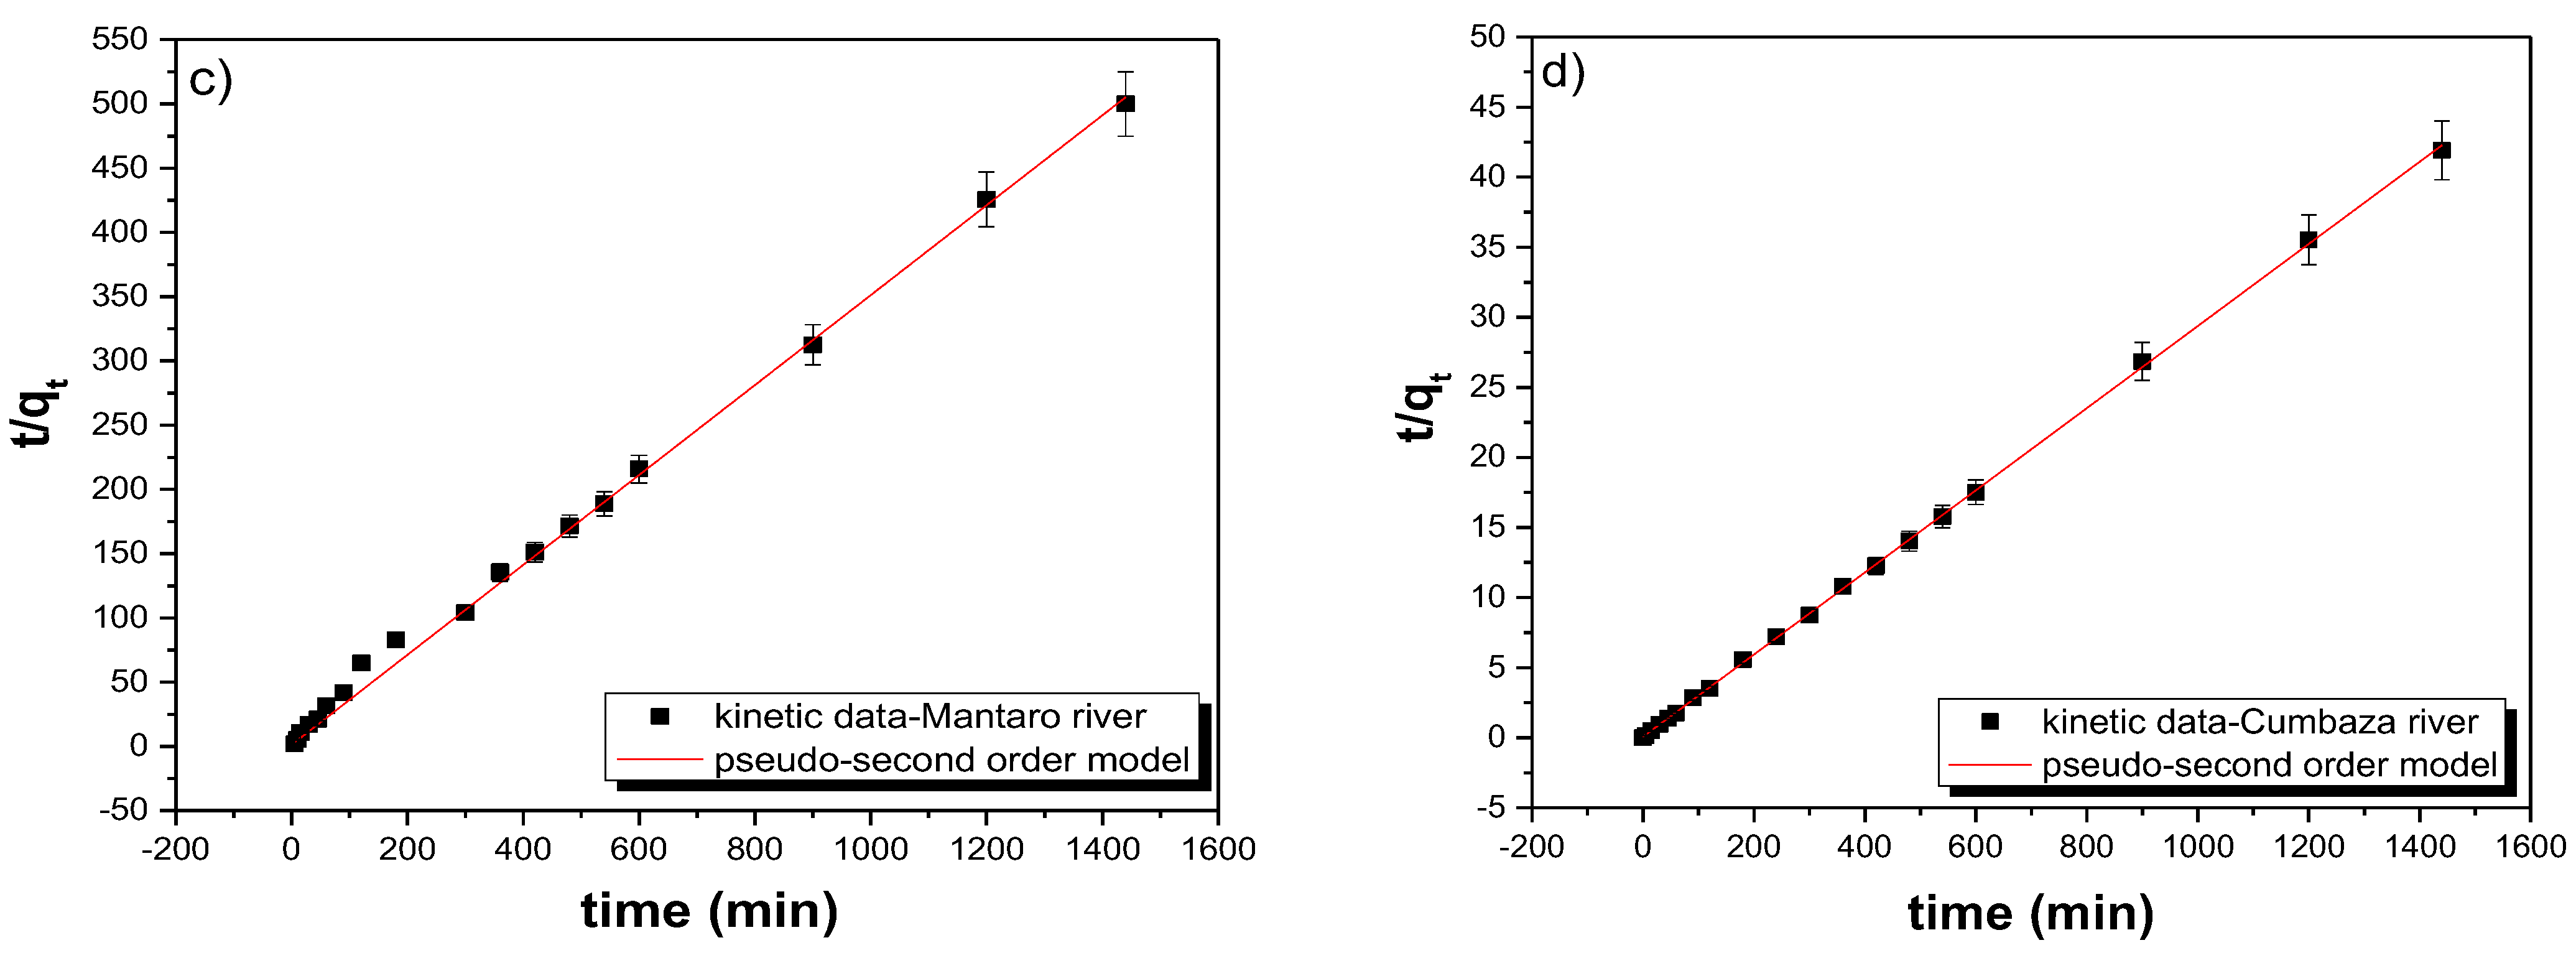
A detailed analysis of adsorption kinetics was performed using four kinetic adsorption models [15]: (i) pseudo-first-order (PFO) kinetic model, (ii) pseudo-second-order (PSO) kinetic model, (iii) intraparticle diffusion kinetic model, and (iv) the Elovich kinetic model. The best fits of experimental data were achieved for the PSO kinetic model, as shown in Figure 3b,c, for both rivers. The corresponding fit parameters are summarized in Table 2.
The fit parameters in the PSO model are related to the chemisorption process, i.e., the process is dominated by chemical binding. It is worth mentioning that the other kinetic models (data not shown) tested in our experimental data suggest that they seem to not work in real water bodies, as indicated by unreasonable R2 values, usually below 0.5.

3.6. Effect of Adsorbent Dose on Pb Removal

From the adsorption kinetics process in the Cumbaza River, it was found that the equilibrium time for the RG1 nanoadsorbent was 60 min. Figure 3d shows how Pb(II) removal varied at selected doses. As a result, the RG1 nanoadsorbent reached a maximum value of 93% for 1 g L−1. After that point, the curve reached a plateau that marked the maximum adsorbent mass significant for Pb removal.

3.7. pH Monitoring during the Adsorption Kinetic and Adsorbent Dose Processes

The pH value in a Pb solution prepared in distilled water has a value of 5.5 [15]. However, as shown in Figure S2, it was observed that when varying the concentration of Pb in the real waters, the initial pH was 7. However, after each time exposure to the RG1 sample for the kinetic experiments in both rivers, the pH values (obtained with a pH meter) fluctuated between 6.5 and 7.5. The same results were obtained when changing the adsorbent dose in the case of the Cumbaza river. These results suggest that it is not necessary to significantly vary the pH of real effluents to achieve the Pb adsorption process using the RG1 sample. Thus, this result is a gain against the usually used Pb removal process with commercial acids in order to clean up 100% of Pb(II) at pH = 5.5 [12]. Thus, the results presented up to this section indicate that our nanoadsorbent is highly efficient in removing total Pb in real water, even if one considers it at scalable industrial levels.
To better understand the chemical adsorption of Pb on the NP surfaces, it should be mentioned that the surface chemical configuration available in γ-Fe2O3 will depend on the point of zero charge (p.z.c.) that is located at pH = 2.3 for the RG1 sample, as shown in Figure S3. Above this value, the outer sphere complex between Pb(II) and surface chemical groups of γ-Fe2O3 can be favored. Therefore, it is assumed that the following deprotonation reaction will occur [28]:
Fe OH Fe O + H + ( >   p H p . z . c . )
The last Fe O group coordinates with Pb(II) forming Fe O Pb + + H + complexes. This can explain the remarkable adsorption for Pb(II) at a pH ranging from 6.5 to 7.5 (negative zeta potential of ~−17 mV).
In brief, all the above surface sorption mechanisms can be fully explained by the interaction between the RG1 sample and Pb(II) cations. However, it should be kept in mind that the total removal also implies the presence of other Pb cation species commonly found in real waters.

3.8. Main Experimental Results Obtained after Adsorption Analysis

3.8.1. TEM and EDS Analysis

The morphological properties for the RGx series were carefully evaluated, and they are summarized in Table 3. It can be seen from Figure 4a–w that after Pb(II) removal, the γ-Fe2O3 NPs conserved their morphologies, and the mean particle sizes were similar to those expected by using a co-precipitation route, as seen by the particle size distribution shown in Figure S4. Additionally, the polydispersity values ranging from 0.3 to 0.4 for the four samples were in agreement with other samples synthesized via co-precipitation [29], indicating that the Pb adsorption naturally occurred.
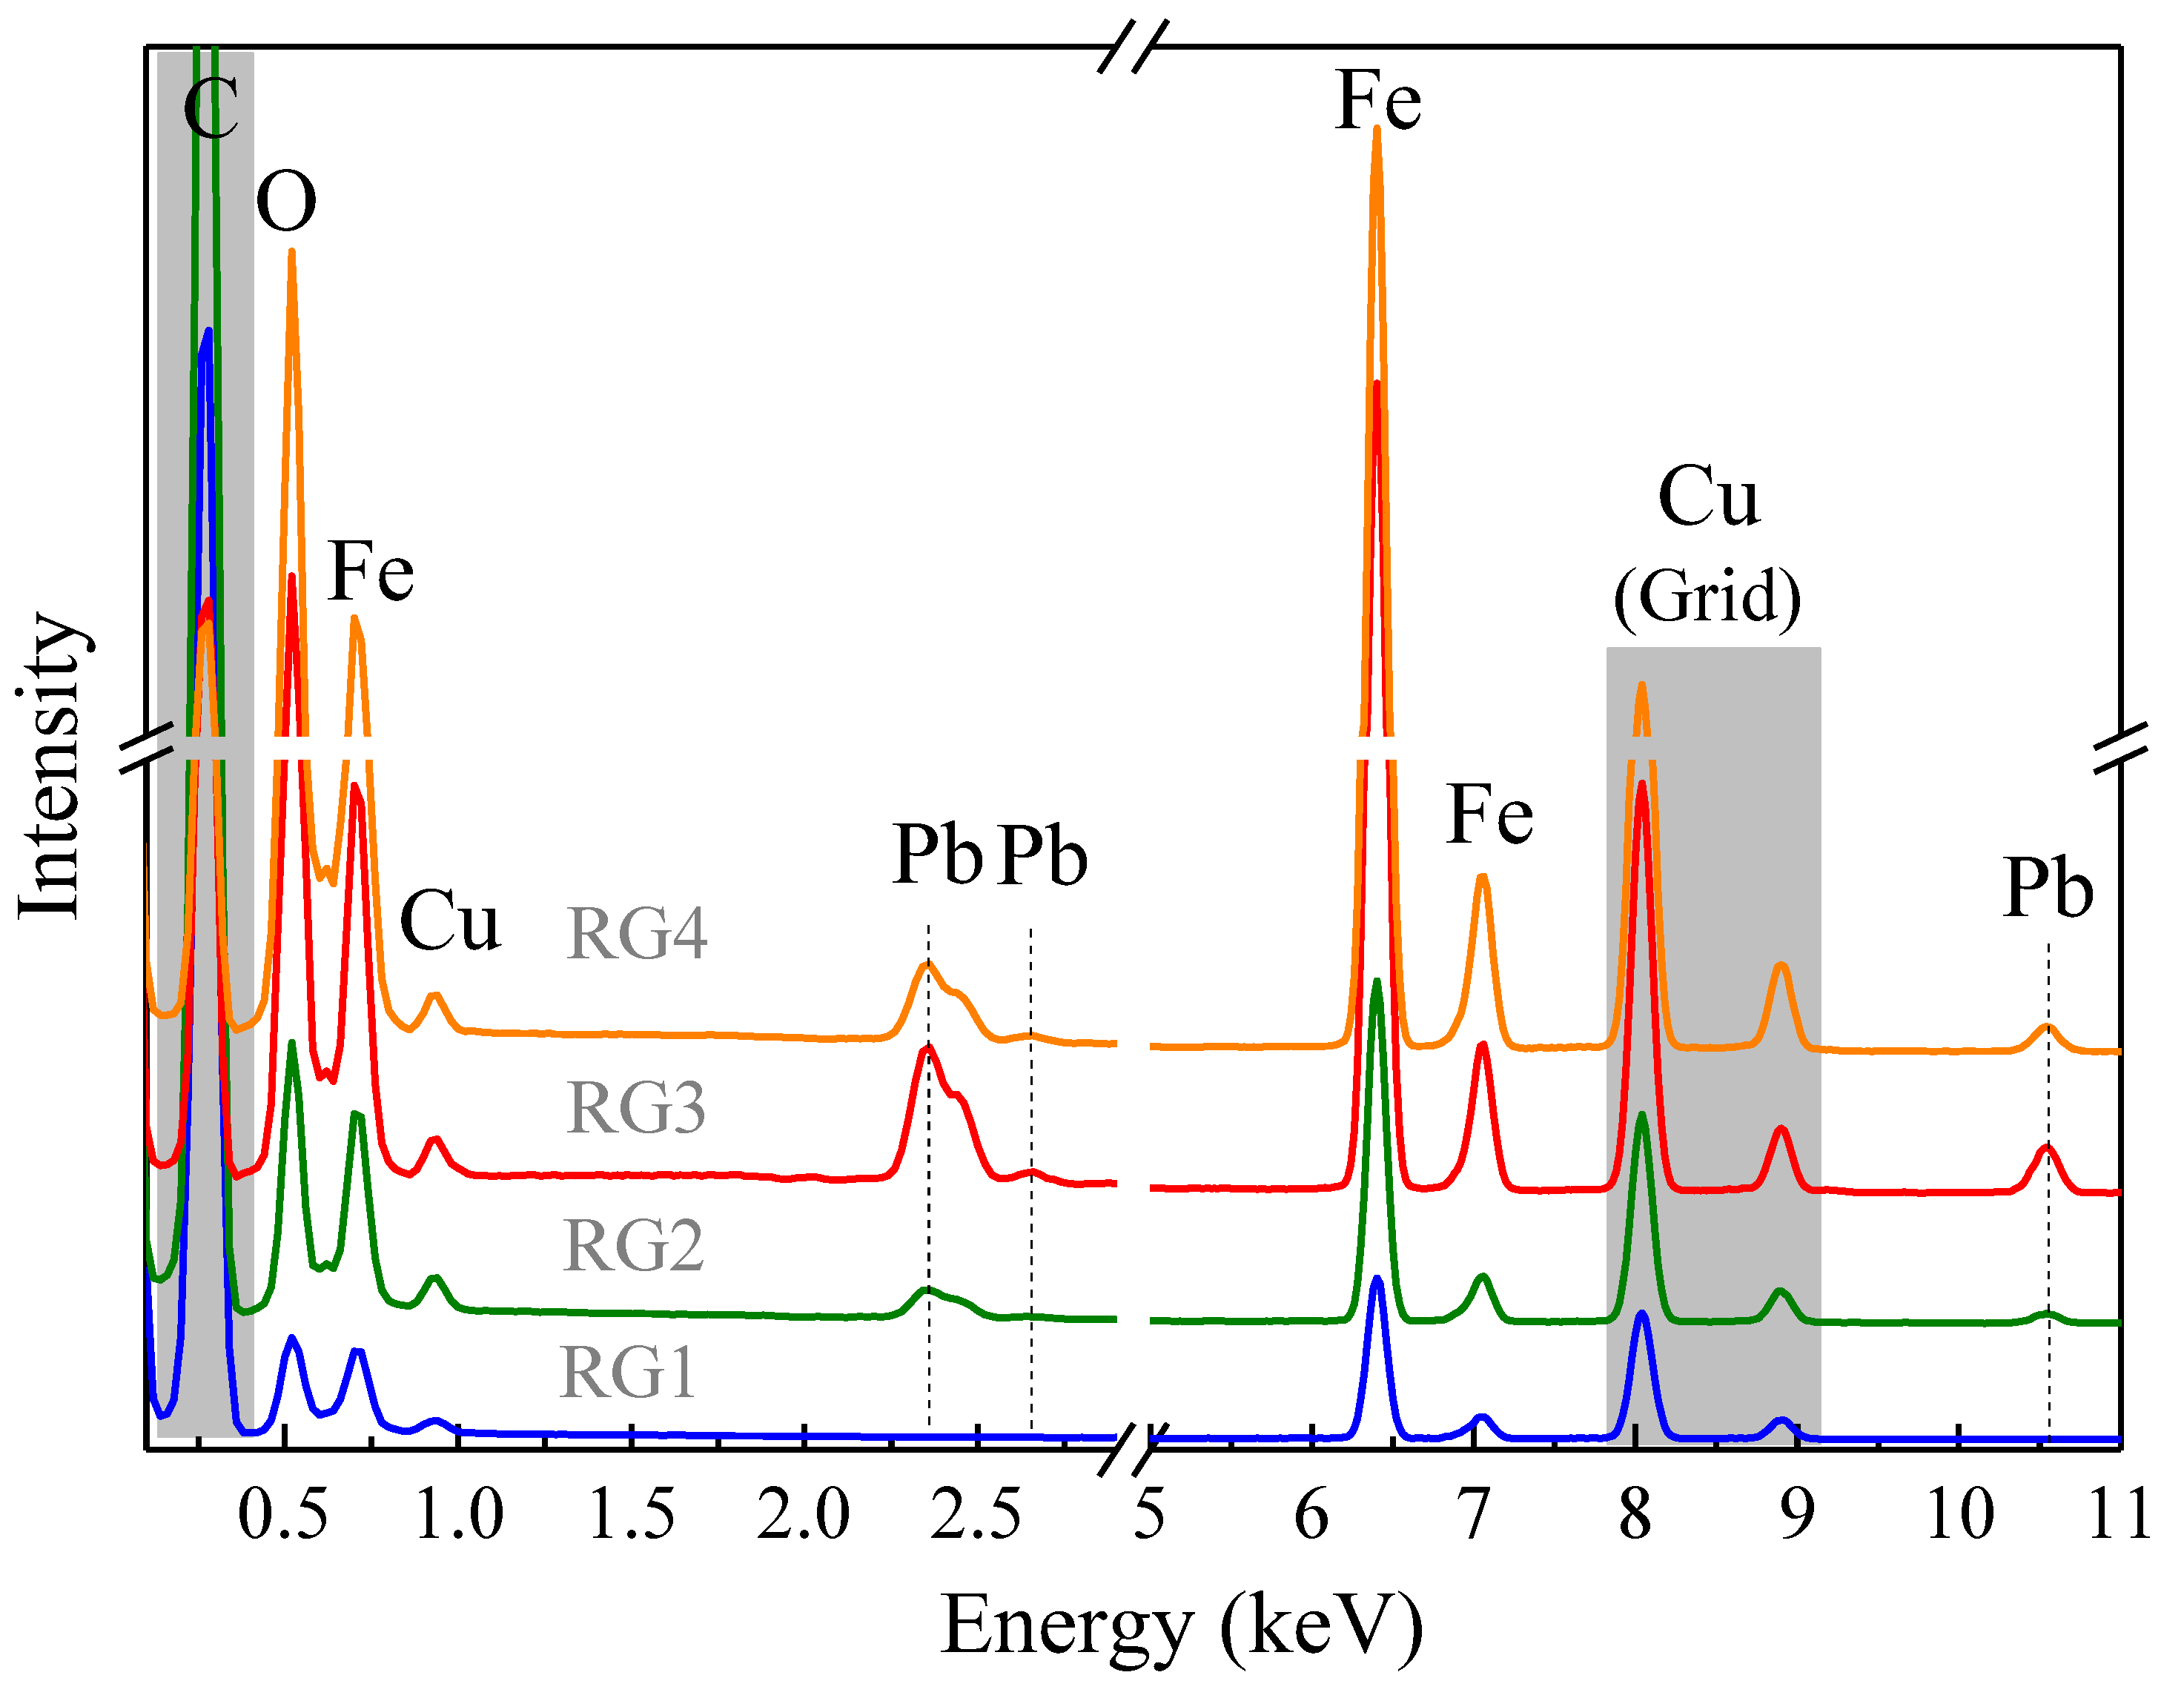
From Figure 5, the atomic percentage composition was estimated for the RGx series (x = 1–4) to lie between 0.6 and 1.5 at. %, indicating that the original RG1 sample adsorbed the Pb. As can be seen from the results in Table 4, no elements other than Fe and O were found by the EDS mapping analysis, except Pb in samples obtained after interactions of the RG1 sample with contaminated effluents.

3.8.2. Magnetic Measurements

VSM Analysis

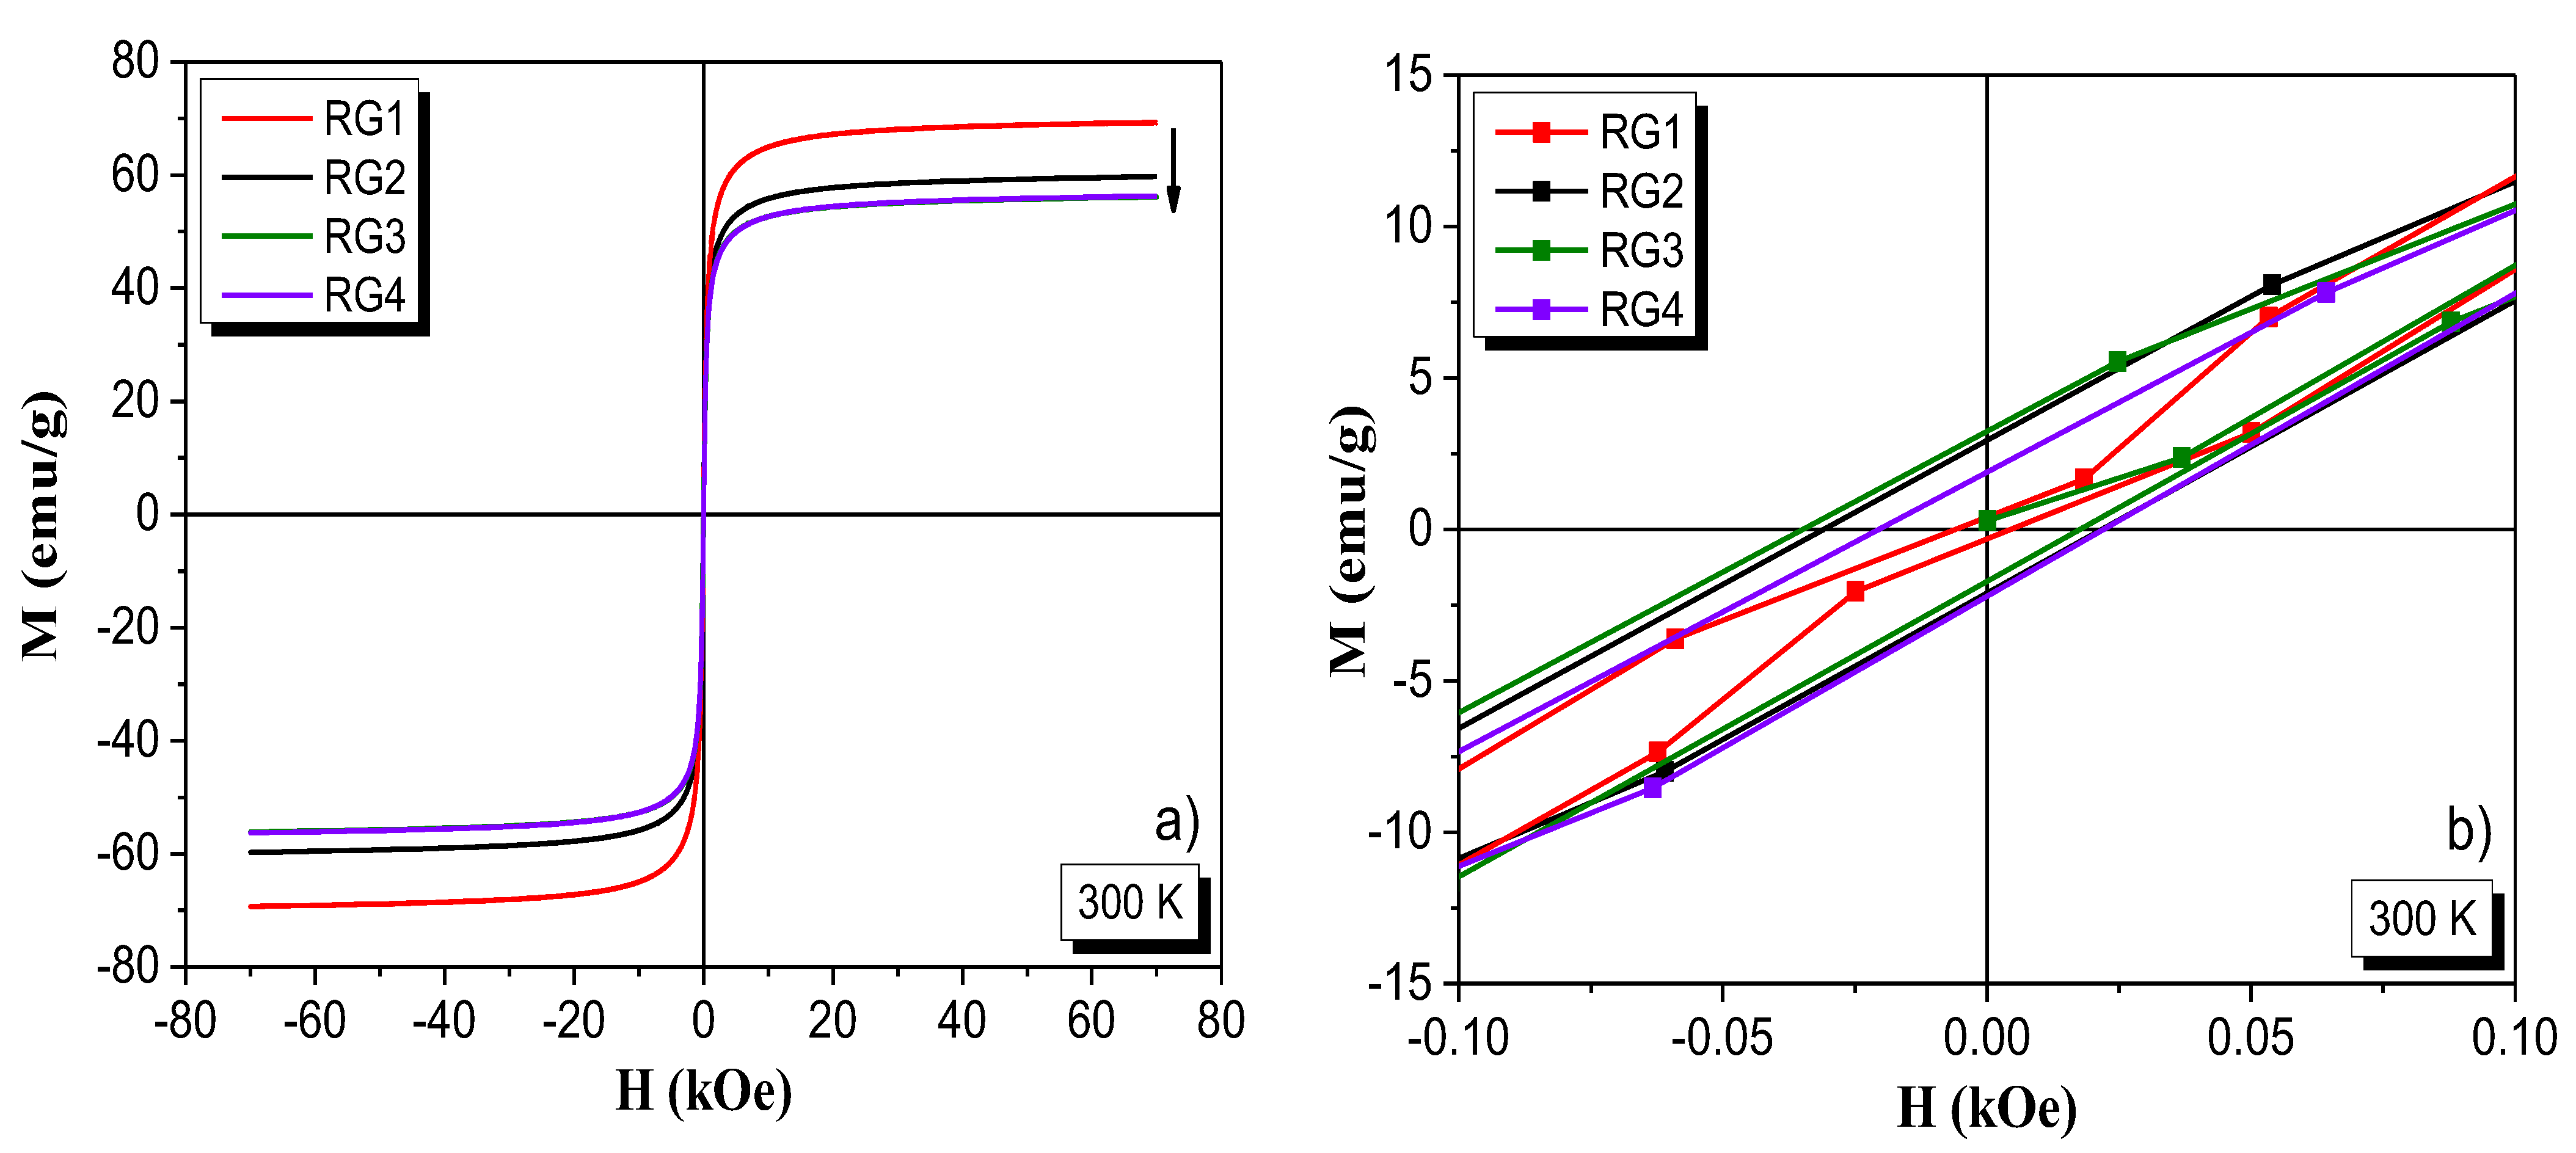
The M(H) curves were measured at RT and 5 K for the RGx series, and their results are shown in Figure 6a. In addition, the FC and ZFC protocols (M(H) curves shown in Figure S5) were also performed to check whether the samples could show, for example, the exchange bias effect or any remarkable change. The results indicated the absence of a bias effect. On the other hand, the RG1 sample exhibited, at RT, the highest saturation magnetization (Ms) at 69.2 emu g−1, a value that agrees with that reported for the bulk γ-Fe2O3 phase [30]. However, the samples with adsorbed Pb had a reduced Ms value of 59.7 emu g−1 for the RG2 sample and 56.2 emu g−1 for the RG3 and RG4 samples (samples used in the kinetic experiments). Hence, it is clear that when Pb surface adsorption occurs, a measurable reduction in the Ms values is detected, indicating a reduction in magnetic mass of the original sample (RG1). As expected, a similar trend is also observed for Ms values measured at 5 K, with values for RG1 > RG2 > RG3-RG4, as estimated from Figure S4a–d. By looking into the zoomed M(H) curves of Figure 6b, the coercive field (Hc) values are between ± 50 Oe. These small Hc fields indicate weak magnetic interactions among the NPs in the RGx series, while, at 5 K, the samples clearly exhibit a ferrimagnetic-like loop (see insets of Figure S5a–d) that is associated with the γ-Fe2O3 phase. The important parameter for magnetic remediation is, however, the Ms value at RT [12]. For the after-adsorption samples, we observed a reduction of ~19% of the Ms value at RT. Despite this reduced Ms value, it is still sufficient for remarkable Pb adsorption [12].

57Fe Mössbauer Spectroscopy Analysis

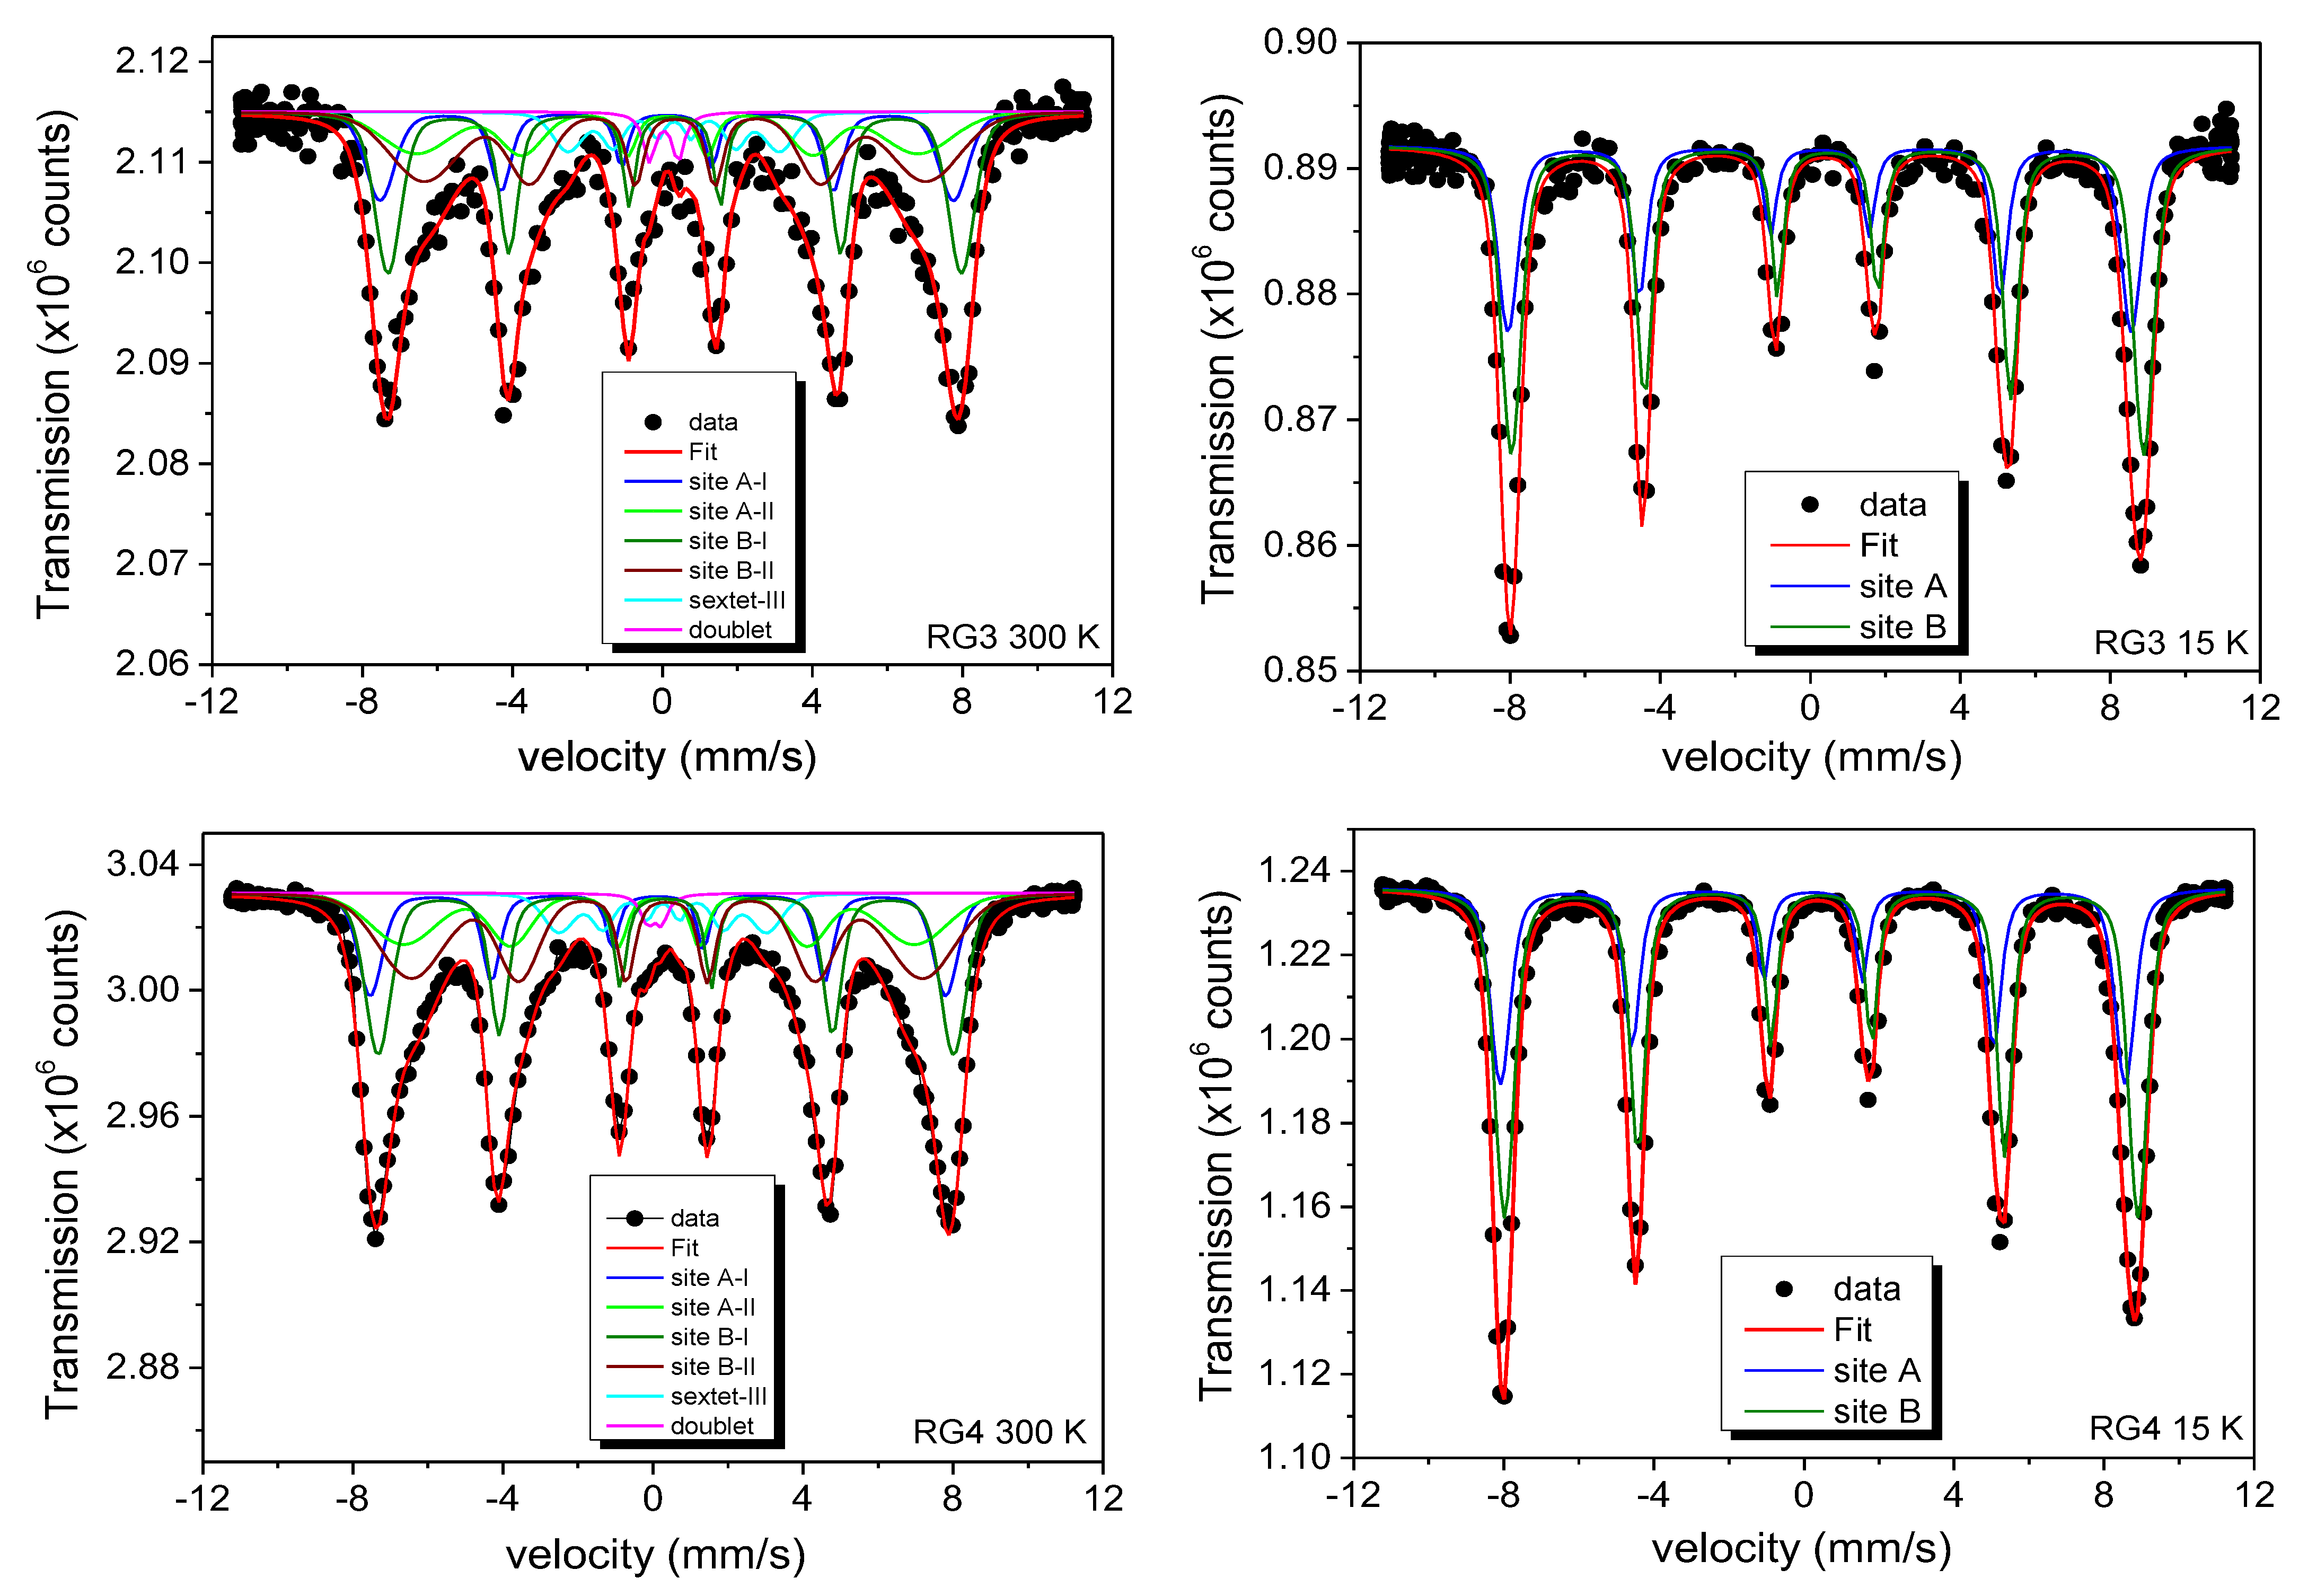
57Fe Mössbauer spectra were investigated, in particular, for the samples before (RG1) and after (RG3 and RG4) adsorption kinetic experiments. The spectra recorded at 15 and 17 K are displayed in Figure 7, and the results of the fits are summarized in Table 5. These spectra were fitted using two magnetic hyperfine patterns, i.e., sextets due to Fe trivalent tetrahedral (A) and octahedral (B) sites commonly found in cubic spinel structures [23]. The ratio of spectral areas of absorption for the two sites (R.A.A.(B)/R.A.A.(A)) was kept fixed to 1.666, as would be expected for the bulk γ-Fe2O3 phase. The values for center shifts CS and magnetic hyperfine fields Bhf of A and B sites are in excellent agreement with those reported in the literature for this phase [23].
The mean value of the nuclear electric quadrupole interaction Q could be kept at zero, as expected for γ-Fe2O3. The apparent broadening of the magnetic patterns seems clearly related to a field distribution of assumed Gaussian shape; the fits gave widths σ of about 1 T for all samples. These fits indicate that, in addition, the Lorentzian line widths are broadened even at low temperatures (about 0.38–0.39 mm/s), which can be attributed to the distribution of quadrupole shifts related to structural distortions in the nanometric sample particles.
The fits to the 57Fe Mössbauer spectra recorded at RT are also shown in Figure 7, and their hyperfine parameters are given in Table 6. For these fits, we required six components: (i) two sets (I and II) of magnetic hyperfine correlated components, each comprising two sextets for the A and B sites (I(A,B) and II(A,B)) with R.A.A.(B)/R.A.A.(A) spectral area ratios kept fixed at 1.666, as found for the ideal spinel structure; (ii) one extra sextet III (also with features of Fe3+) of lower weight (about 5–10% of total); and (iii) a doublet (also with Fe3+ characteristics) with even smaller fraction, which is either associated with very small grains of the sample in superparamagnetic regime at RT or due to the presence of an “pure Fe impurity”, as the XPS data suggest. Again, for all magnetic components, the quadrupolar shifts for the four sextets I (A,B) and II (A,B) were kept equal at 0. The center shift (CS) values were fixed by the relation CS(B) = CS(A) + 0.21 and, finally, the hyperfine magnetic fields were kept equal Bhf(A) = Bhf(B). The Bhf values for A and B sites are smaller for two sextets of the set II than those of sextets of the set I. The values of magnetic hyperfine fields for the RG1, RG3, and RG4 samples are practically the same for both sets of sextets I and II, and their relative spectral weights are nearly the same. The magnetic hyperfine fields again revealed a broadening effect, mainly related to an assumed Gaussian-shaped distribution with width σ. Notably, σ is larger for set II of the sextets than for set I.
In brief, both sets I and II of the four sextets (A and B) are compatible with the presence of stoichiometric γ-Fe2O3, indicating that our NPs have the well-organized atomic arrangement of a cubic spinel structure. The reduced magnetic hyperfine fields for set II compared with set I suggest a fraction with faster collective magnetic relaxation at RT [31] that could be related to smaller particles. At low temperatures, these spin fluctuations observed at RT are magnetically blocked and, therefore, the spectral contributions by both sets of particles coincide and cannot be distinguished by hyperfine interactions, i.e., only one set of the spinel hyperfine patterns is observed. Therefore, the spin relaxation effect at RT may help us to understand the magnetic features of the ensemble of the particle size distribution of our samples, showing most Fe ions in the magnetically blocked regime at RT but with some spins of small particles in the relaxation process.
Further, sextet III can only be detected in the spectra taken at RT. Its hyperfine parameters are also the same for the three samples. At low temperatures, we cannot resolve its spectral contribution, indicating that the related magnetic hyperfine field is in the range of the typical trivalent iron oxide species. The strongly reduced value of magnetic hyperfine splitting at RT suggests that this component may occur at the particle surface, where Pb adsorption will take place. Unfortunately, the present data do not allow us to further specify the nature of this Fe species. In fact, we will show below, using XPS results, that a new shell formed on the γ-Fe2O3 NPs, possibly with a type of Fe oxyhydroxide (FeOOH), but that the Mössbauer parameters of known and pure FeOOH species do not agree with those of sextet III.
In summary, the Mössbauer results suggest that the two samples (after Pb adsorption) are apparently identical if one considers the situations before and after Pb adsorption.
Notably, the Mössbauer spectra taken at 15 and RT before Pb adsorption only show trivalent magnetic Fe species as those typically found for the cubic γ-Fe2O3 phase. This appears to be in opposition with our earlier proposed core–shell model, where the Fe3O4 cores were derived from the discussion of Raman data (Section 3.4). It can, however, be understood when considering that these experiments (magnetic measurements, Mössbauer spectroscopy, adsorption experiments) were carried out, at least, two months after the structural, vibrational, and textural experiments of the as-prepared NPs, i.e., the Fe3O4 cores of the sample would be totally oxidized by this time and by the exposition to air under normal conditions [12,23]. After Pb removal, no apparent change was observed using Mössbauer spectrometry at 15 K, where a magnetically blocked state, characteristic of bigger particle sizes (>10 nm, as seen by TEM), can explain the spectra.
For improving our knowledge on the surface properties of the RGx series, XPS experiments were subsequently performed, and the results will be discussed in the next section.

3.8.3. XPS Analysis (Adsorption Mechanism)

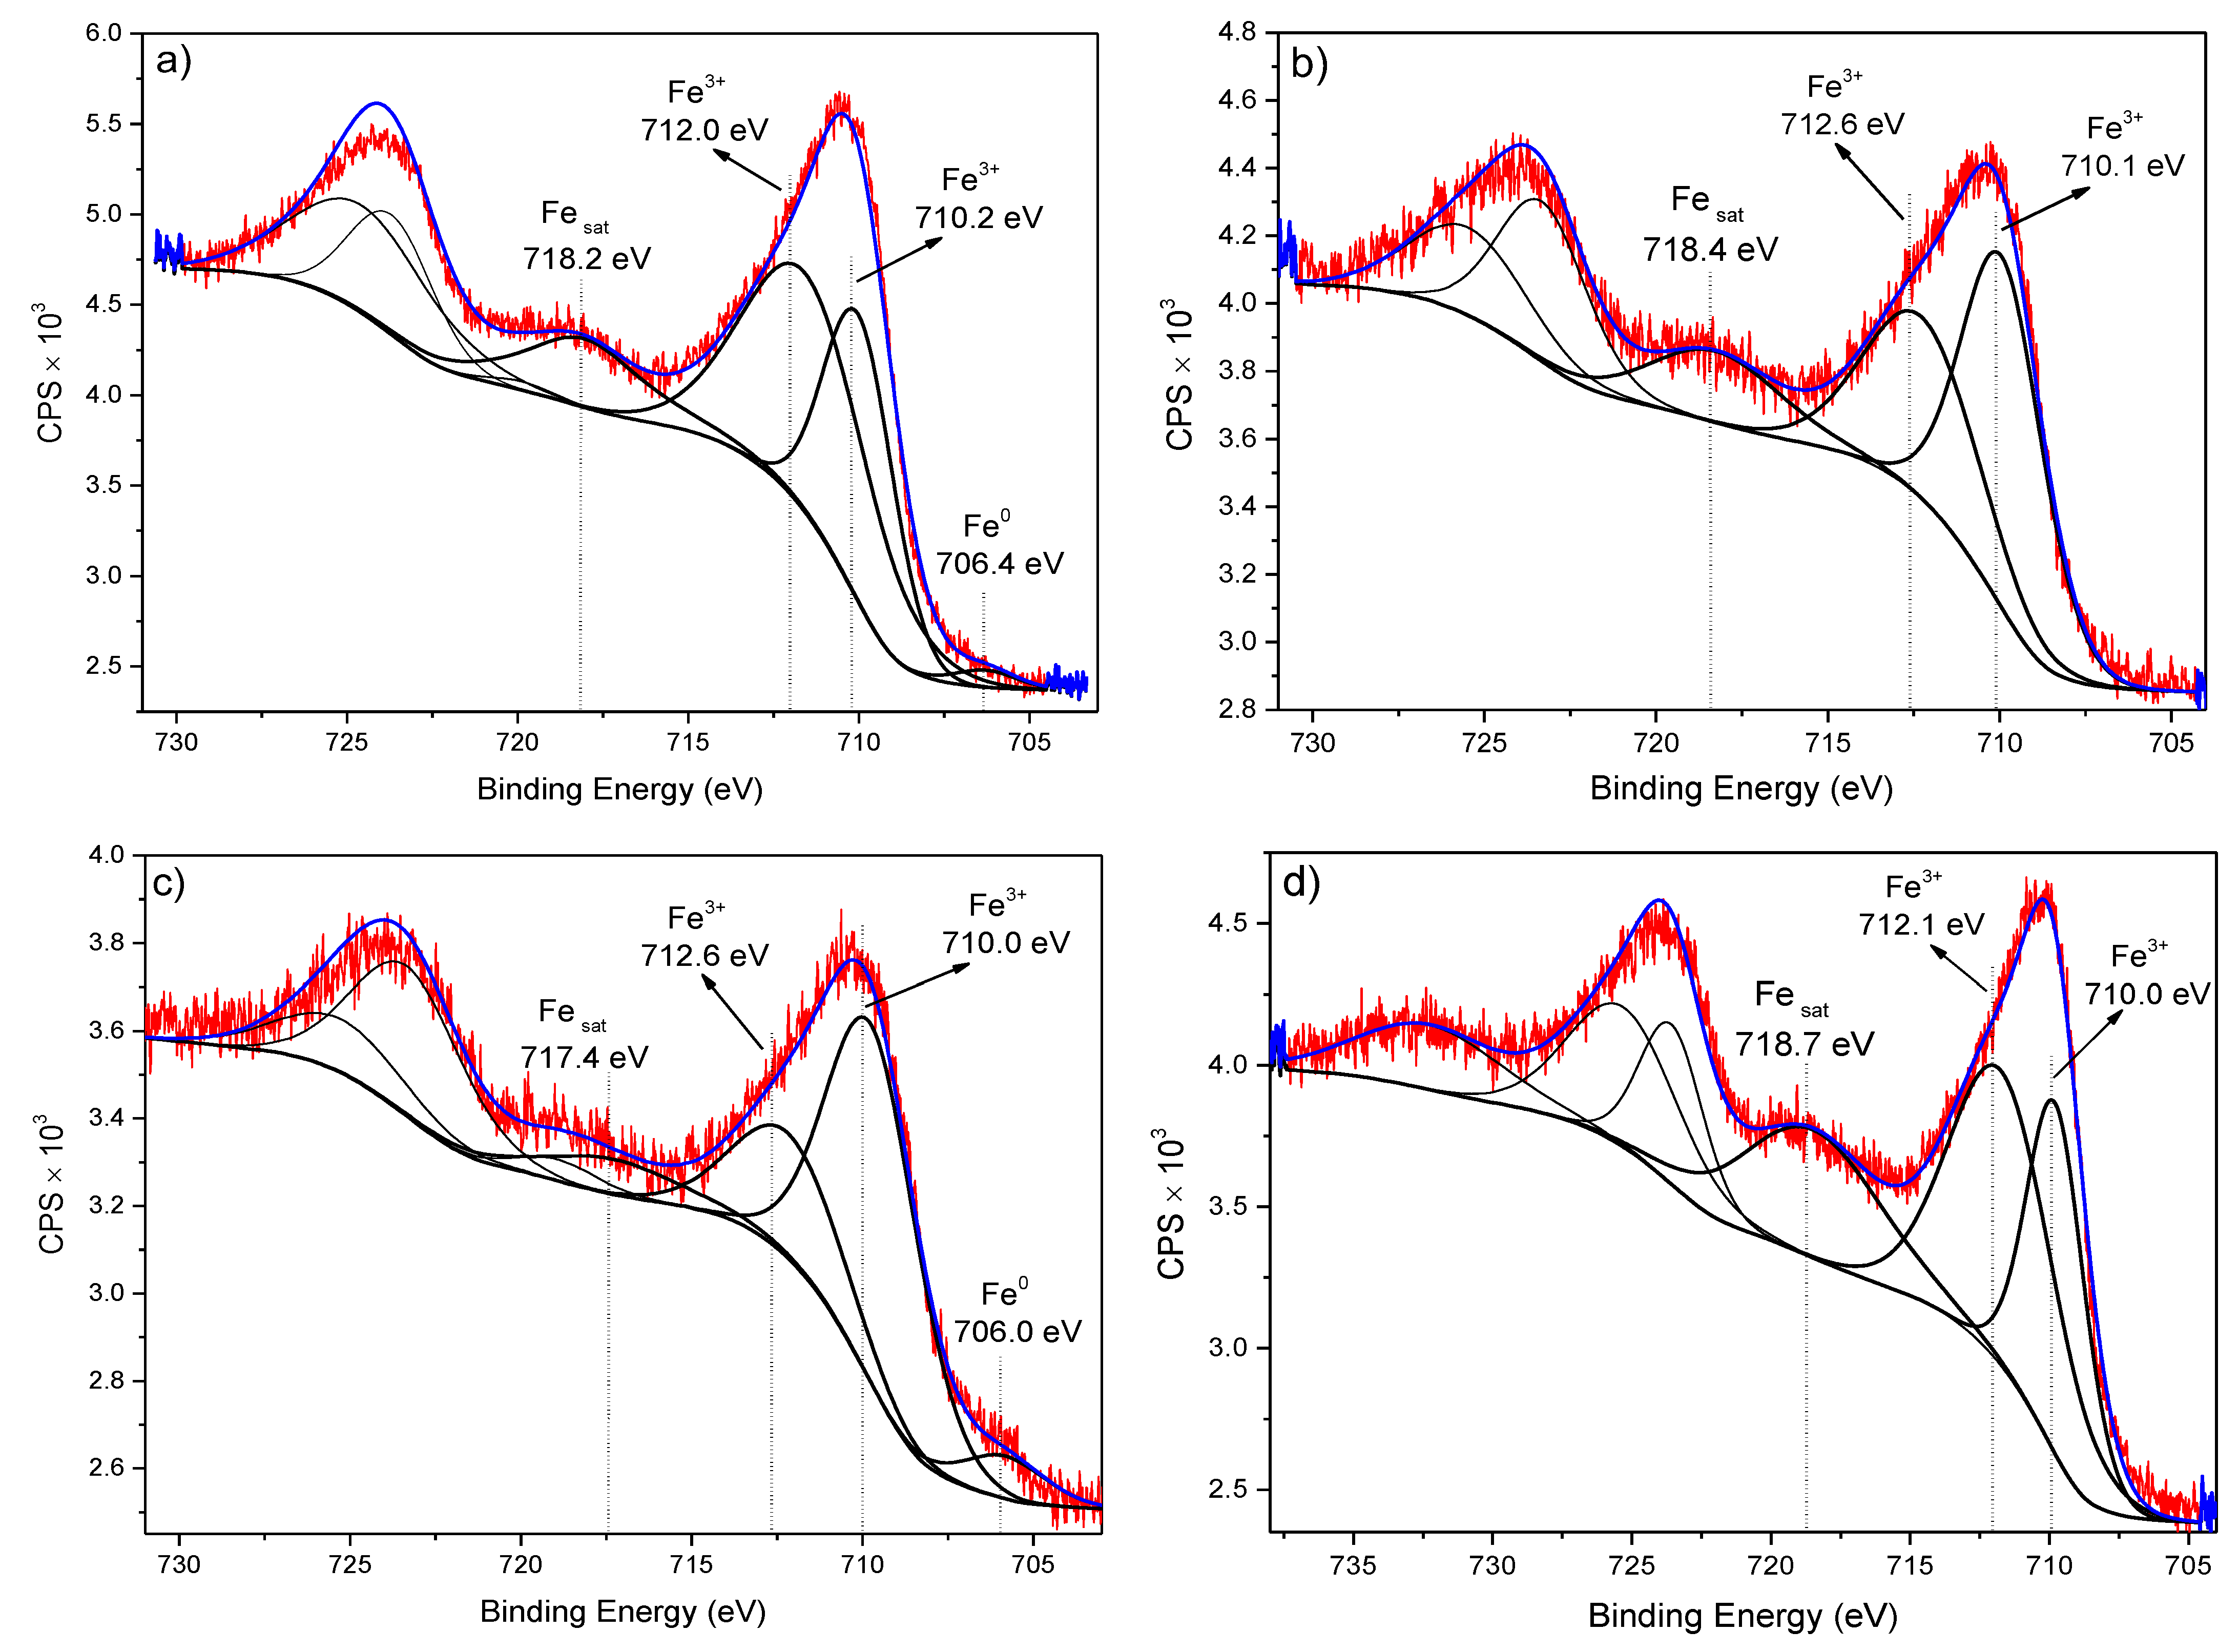
The RG1 sample showed binding energies at 710.2 eV for the Fe 2p3/2 level, representing an Fe3+ valence state, which is very close to the chemical compound of the γ-Fe2O3 phase [32]. In a γ-Fe2O3 phase, according to different authors, the peak in Fe 2p3/2 is positioned between 710.6 and 711.0 eV [33,34,35]. Although, in this work, the binding energy (BE) of Fe 2p3/2 is below 0.4–0.8 eV, the statement that this energy of 710.2 eV represents the γ-Fe2O3 is confirmed through the difference in energies between the respective peak (710.2 eV) and its satellite, which, for the γ-Fe2O3 phase, gives a value of 8.0 eV [35], as seen in Table 3 and Figure 8a. Hence, no Fe2+ spin state was found, suggesting a totally oxidized core in the γ-Fe2O3 phase. In the totally Pb adsorbed samples (Figure 8b–d), the BEs (principal Fe 2p3/2 peak) were not severely altered, indicating that the γ-Fe2O3 NPs (in their “bulk”) were not severely affected after Pb adsorption. However, it should be mentioned that there was a decrease in the atomic percentage of Fe at the NP surface, indirectly indicating that this was due to the presence of Pb-adsorbed ions.
Moreover, it should be said that there is another BE in the Fe 2p3/2 at 712.0 eV for the RG1 sample. It may refer to the formation of another species with Fe3+, and the most common chemical species should be a type of iron oxyhydroxide (FeOOH) [35,36]. It arises due to the hydrated and/or alkaline condition to which this sample was exposed [35]. Indeed, considering that the XPS is a surface technique and the amount of this chemical species is larger than that of the γ-Fe2O3 itself (see Table 7), one can infer that this hydrated species must only be found on the NP surface since 57Fe Mössbauer spectrometry suggested the presence of the spinel cubic structure for all RGx (x = 1, 3, and 4) series. Furthermore, the ratio of the amount of FeOOH against the total Fe2O3, being very small, prevents the detection of a sizable Mössbauer spectrum related to the FeOOH phase. We assumed that this shell is not totally homogenous at the surface due to the molecular size of the FeOOH phase. Finally, a small amount of metallic Fe (or FeO) was also identified in the RG1 sample, which could be related to the presence of the minor-intensity “impurity” doublet detected in the RT Mössbauer spectrum, as seen in Table 7. From the Pb-adsorbed samples (Figure 8b,c) [37], an increase of 0.6 eV in the Fe 2p3/2, representative of the FeOOH phase, was observed, which shows an alteration in its chemical state, possibly due to the incorporation of Pb in that species of hydrated Fe, especially for the RG2 and RG3 samples. Another important observation is associated with changes in the energy difference between the satellite peaks and the Fe3+ peak of the FeOOH species. These changes suggest that there was a greater decrease for the RG2 and RG3 samples (Figure 8b,c). This should be associated with changes in Fe3+ coordination due to the Pb adsorption occupying Fe3+ sites.
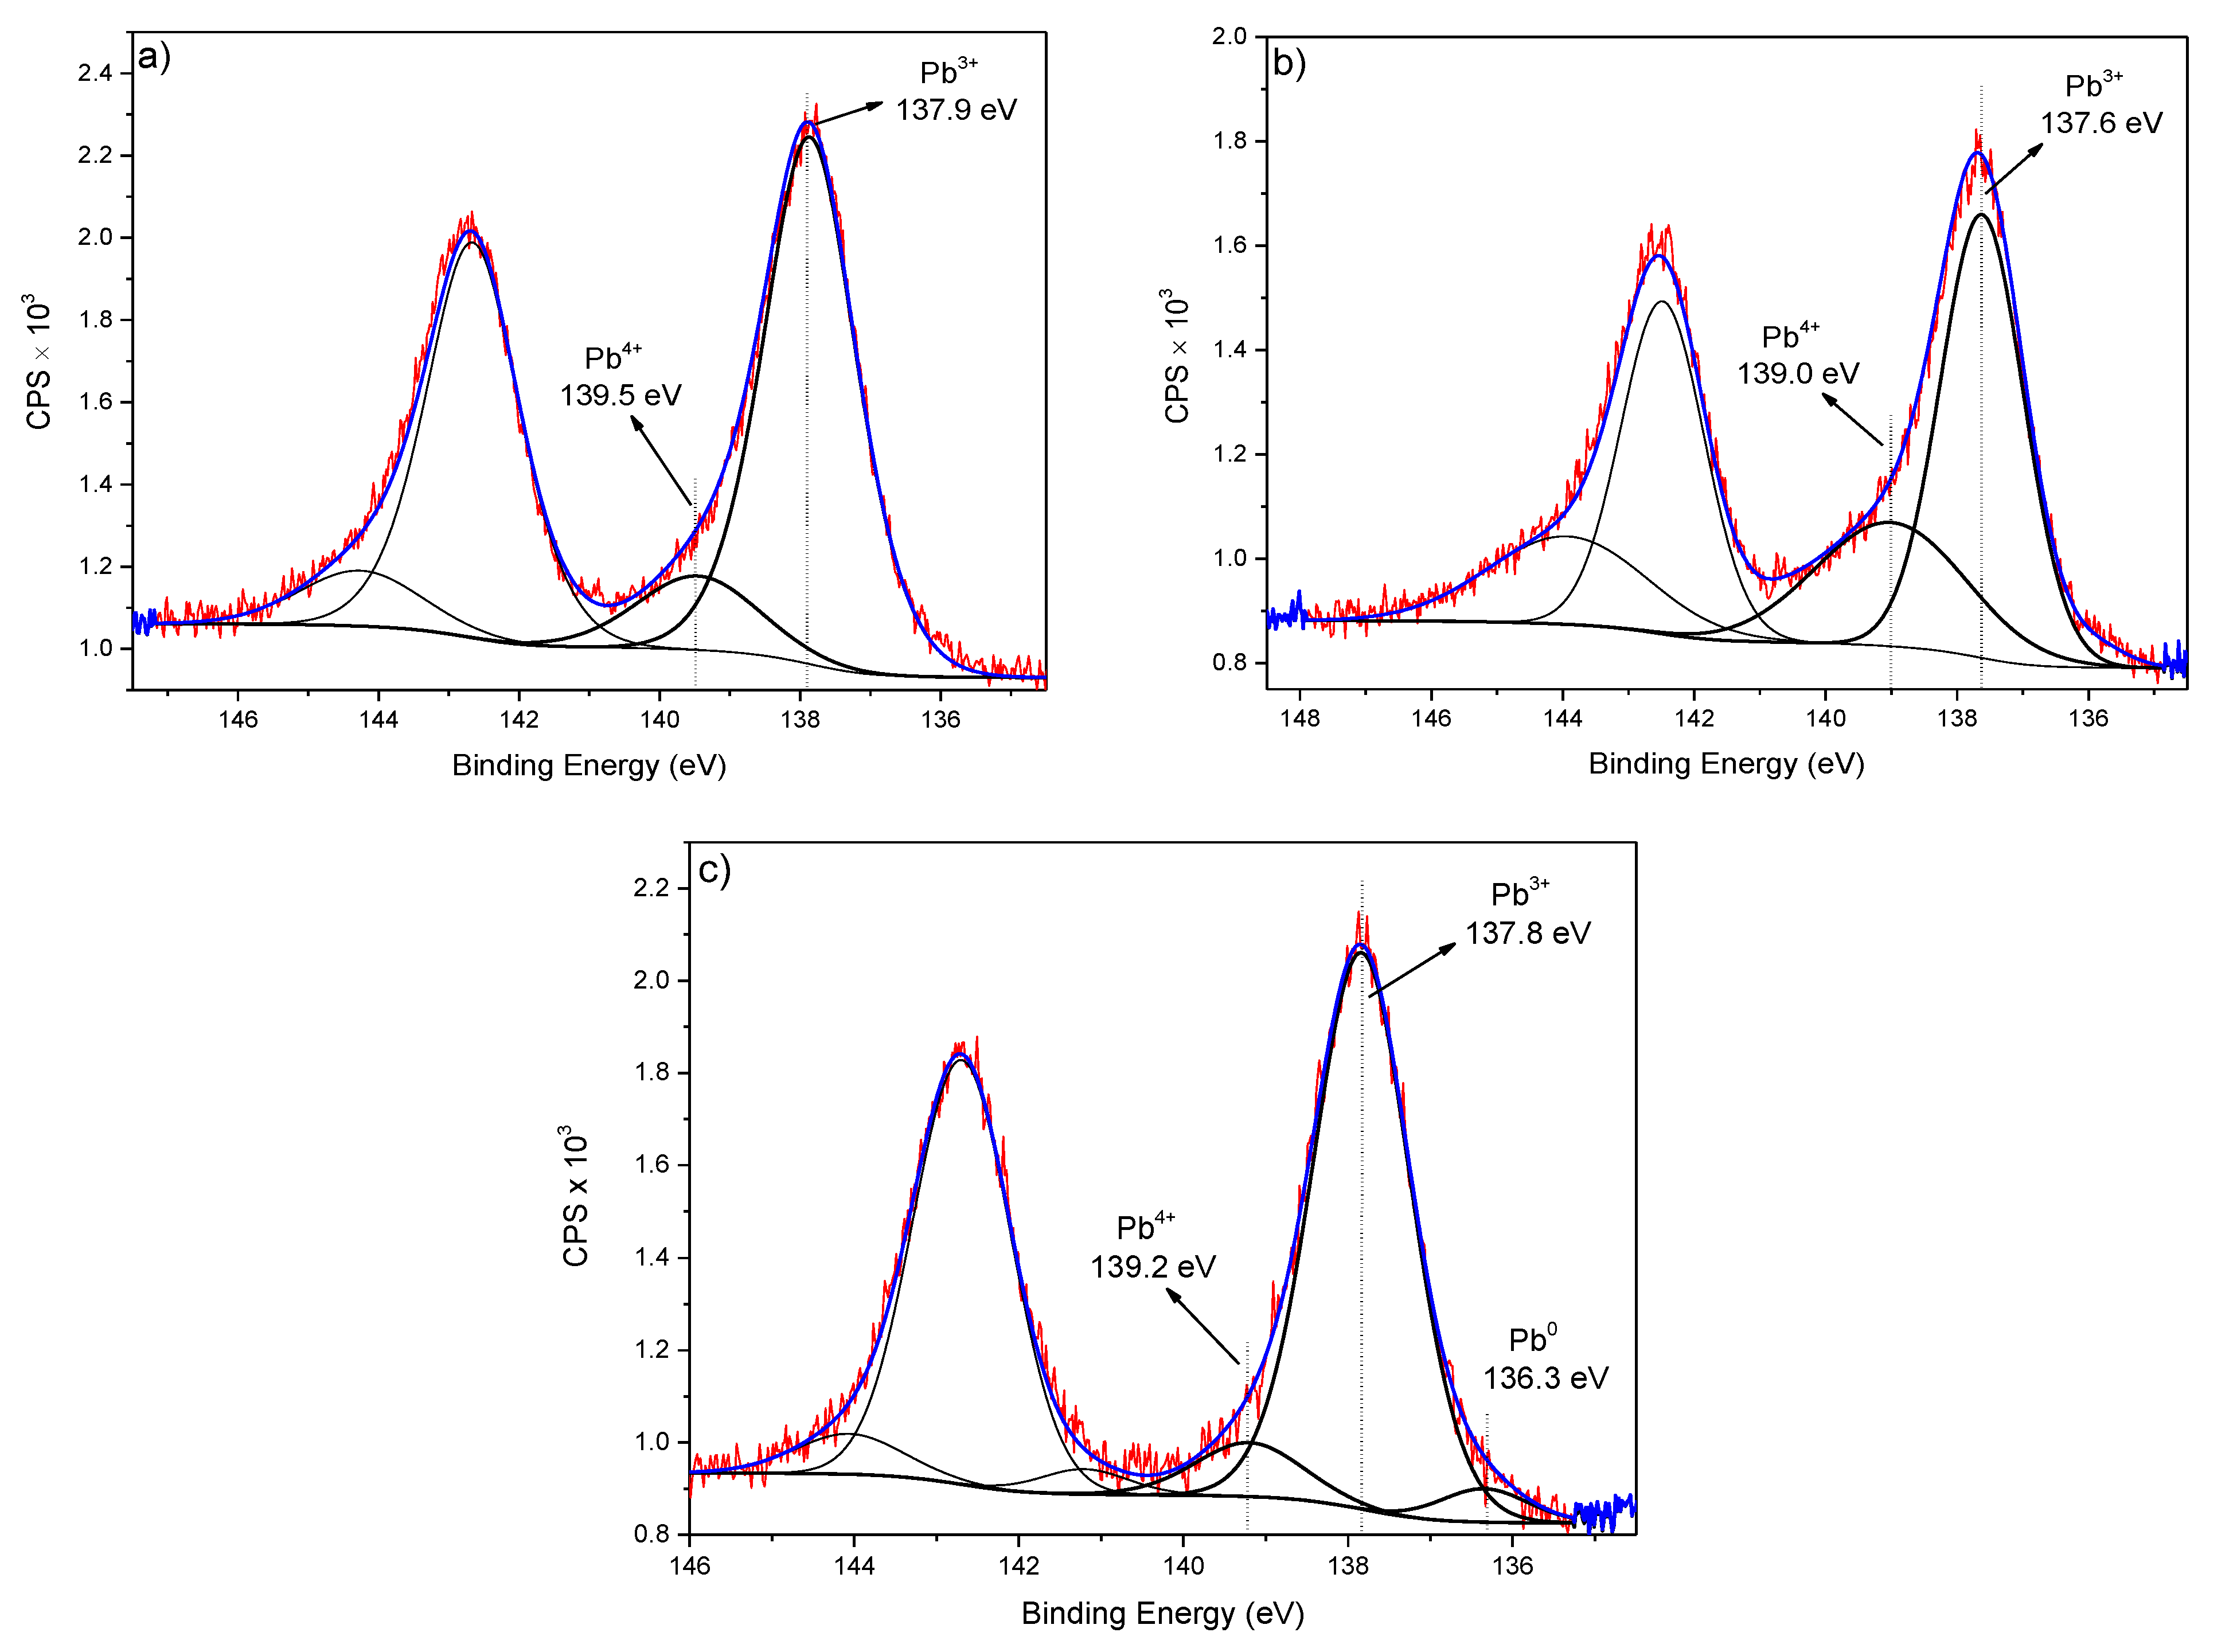
On the other hand, Figure 9 shows the high-energy-resolution peaks of Pb 4f associated with the RG2, RG3, and RG4 samples. From the fit of the Pb 4f peaks of these samples, the presence of two oxidation states of Pb (Pb(II) and Pb(IV)) was determined, with a stronger contribution by Pb(II). The energy associated with Pb(II) is similar to that of a Pb oxide and, more specifically, closer to the binding energy of Pb3O4 [36,37] and can also be related to the Pb(NO3)2 complex in the modified solutions. Actually, the Pb3O4 compound is a mixed valence compound of Pb(II) and Pb(IV). This latter result suggests that Pb(IV) ions are also present in real waters, and both Pb(II) and Pb(IV) adsorption is favored by the FeOOH/Fe2O3 interface and also due to the surface deprotonation reaction of γ-Fe2O3 given by Equation (2). In addition, it is possible to observe that the ratio of the elemental amount of the FeOOH/Fe2O3 decreases from 0.72 to 0.43, respectively, for the RG2 and RG3 samples (see Table 7); likewise, a proportional atomic quantity also decreases for Pb(II) from 1.5 to 0.9 at.% for these two samples. This confirms that the Pb adsorption also occurs on the γ-Fe2O3 surface, in a close agreement with kinetic adsorption experiments, at the same time that this adsorption increases the binding energy of hydrated Fe3+ (see Figure 9b,c). The total Pb adsorption may have produced changes in the oxygen coordination that opened their bonds to Fe3+ to accept Pb(II) (see Figure S6). In the RG4 sample, an increase in the atomic ratio of the FeOOH/Fe2O3 was observed, as well as an increase in the amount of Pb(II) adsorbed (1.2 at.%), indicating that this sample also adsorbed Pb, but was unable to alter the FeOOH shell, which led us to deduce that the Pb3O4 phase was adsorbed on the shell surface.
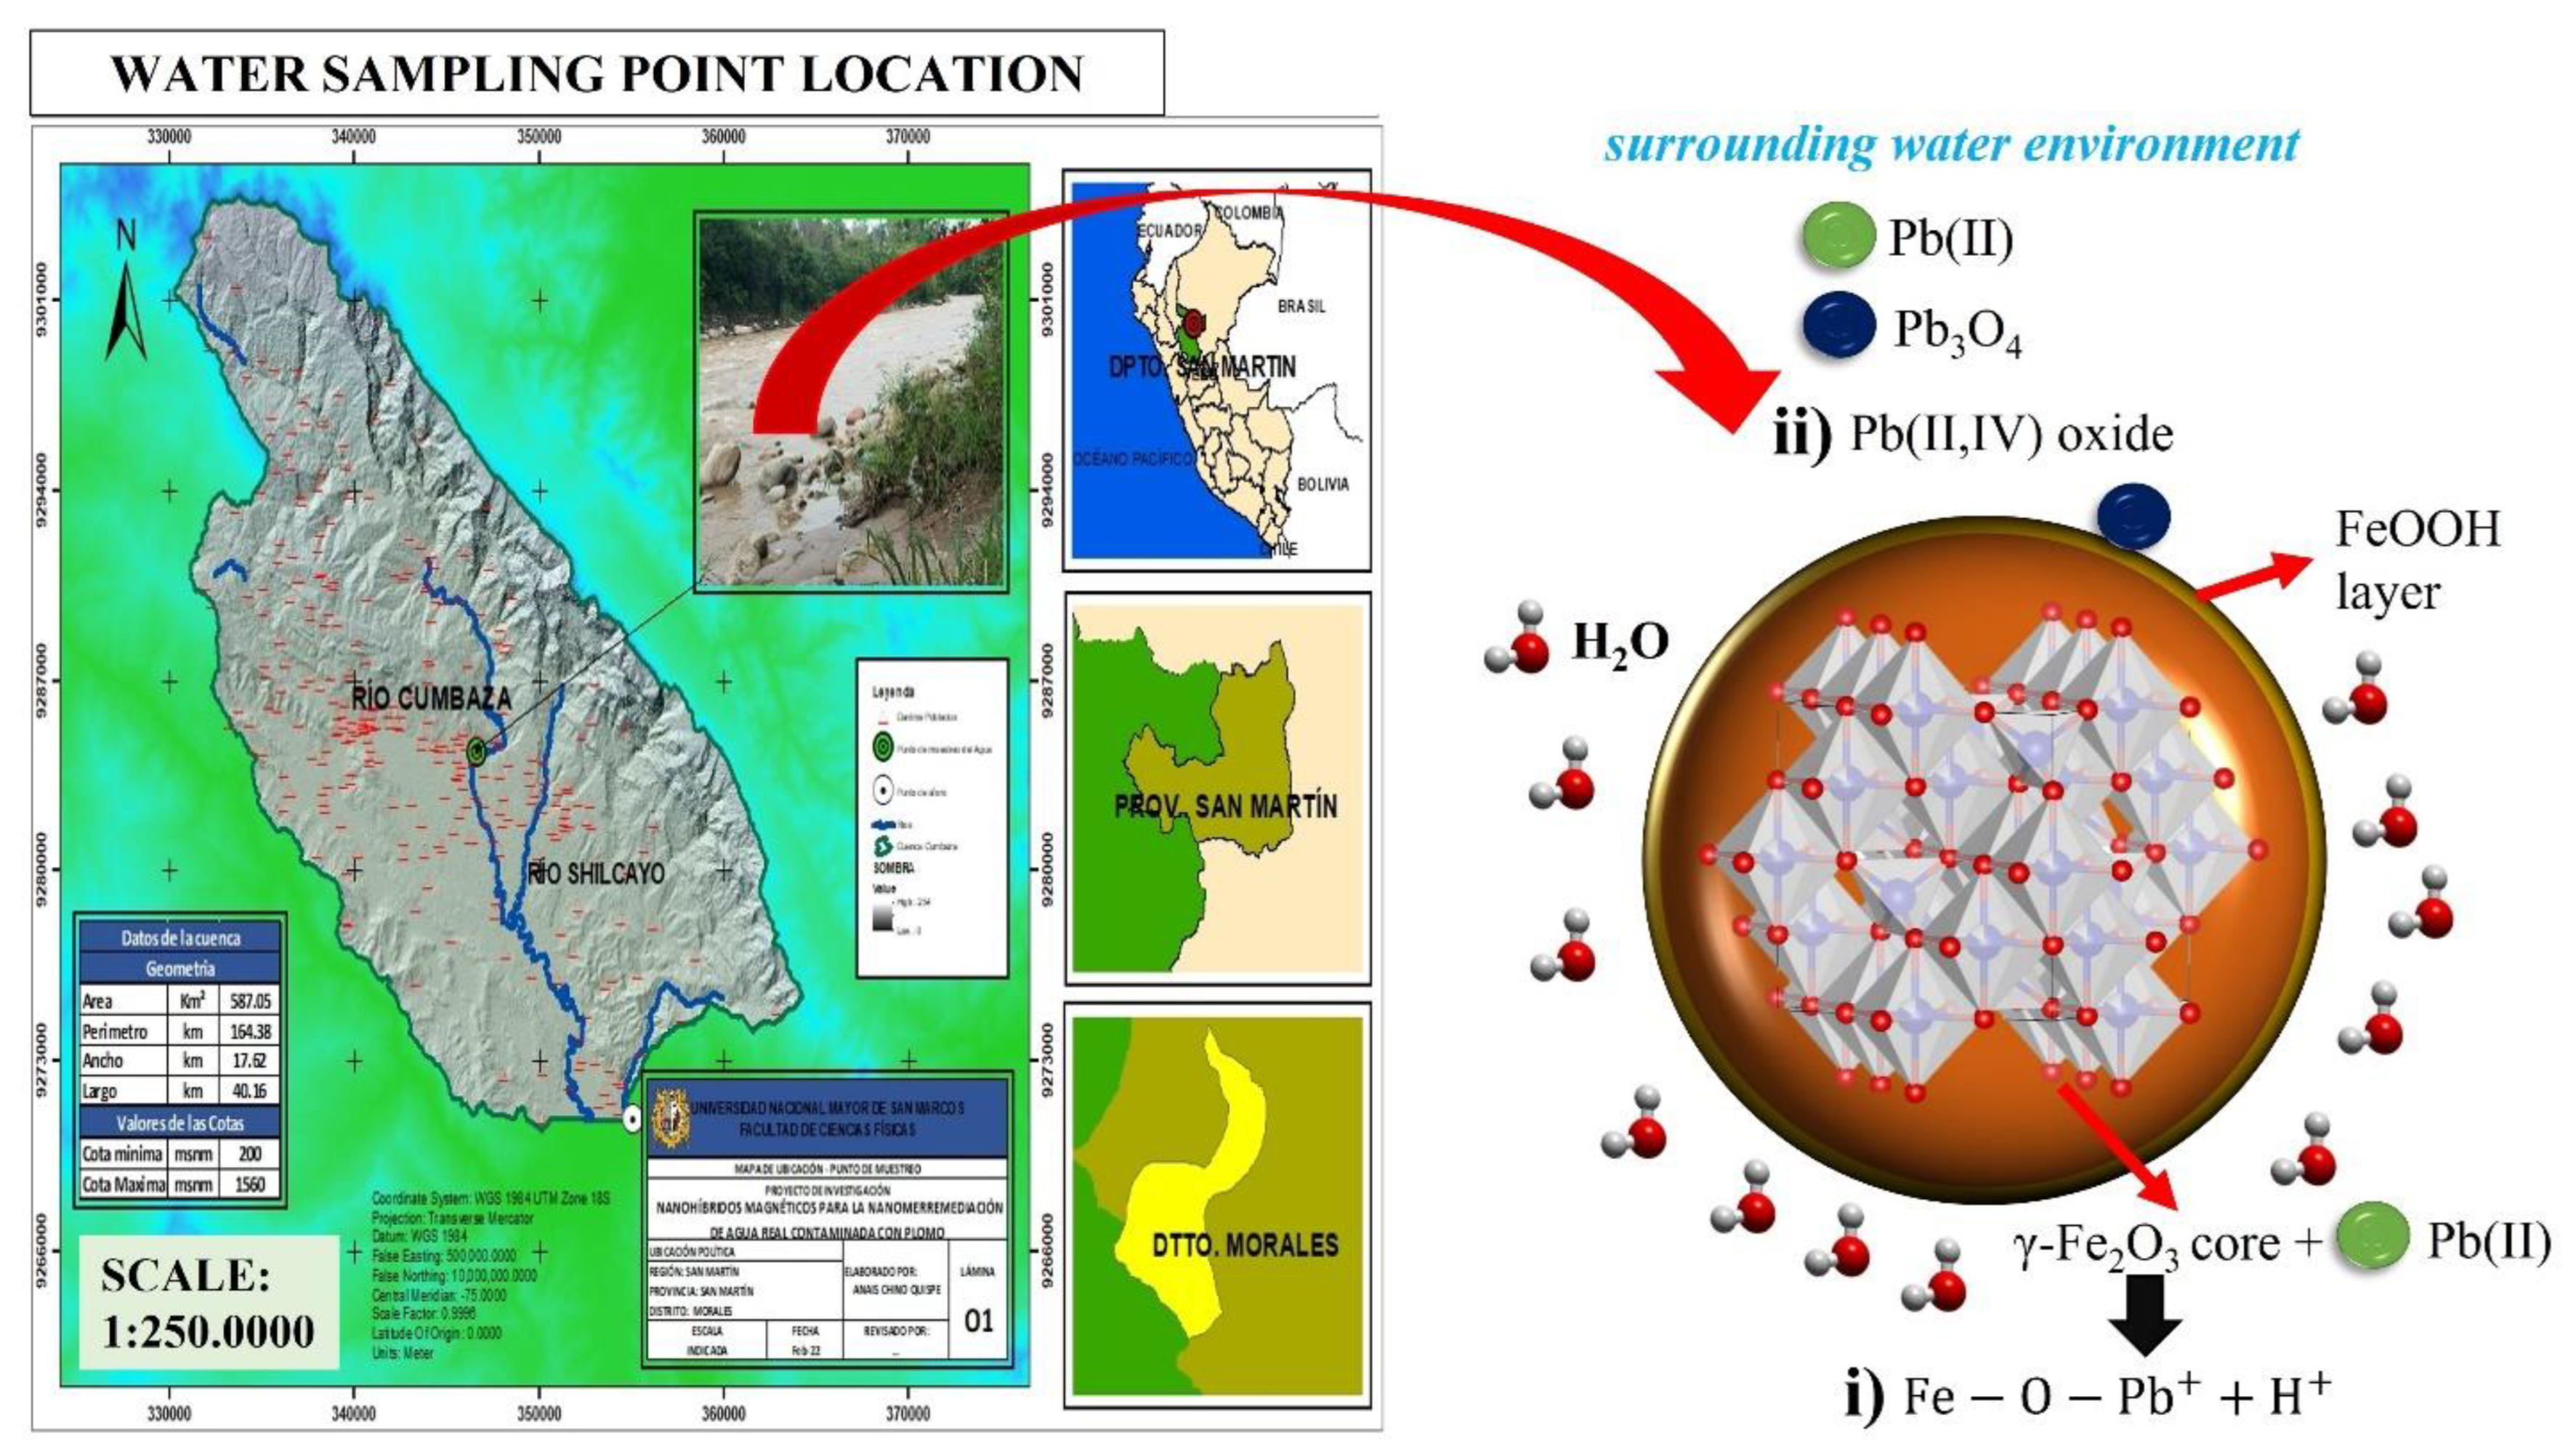
It is worth mentioning that only XPS allowed for a direct determination of the Pb oxidation state, which is important for understanding the surface adsorption mechanism. We must also recall that the experiments were conducted in real waters where many bodies were present during the adsorption process, making it more difficult and challenging. Hence, the adsorption mechanism among the iron surface coordination phases (protecting hydrated shell) and Pb occurs favorably, as we schematically suggest in Scheme 1.

4. Conclusions

Initially Fe3O4 NPs were synthesized following the alkaline co-precipitation route. Structural and vibrational characterization confirmed that cubic inverse spinel structures were formed (space group Fd 3 ¯ m). Laser power variations in Raman experiments on the RG1 sample (as-synthesized NPs) did not induce a local thermal structure transformation for intensities below 0.72 mW. However, for the after-burning protocol (>0.72 mW), the sample surface suffered transformation to the α -Fe2O3 phase. From the IR experiments with different laser power intensity, we concluded the formation of an Fe3O4-γ-Fe2O3 core–shell structure in the as-synthesized sample. This early stage revealed, however, to be chemically unstable, as proved using Mössbauer spectroscopy and XPS data, since it was oxidized by ambient air (these experiments were done months later of sample synthesis). Thus, the NPs finally employed as adsorbents were revealed to be entirely composed of the γ-Fe2O3 phase with a cubic spinel structure. The water samples for the adsorbent tests were collected from two Peruvian local rivers severely polluted with Pb. Conserved samples of the effluents from these two rivers were transported to the laboratory for batch adsorption experiments. Kinetic equilibrium times (Pb removal efficiencies) of 45 (90%) and 60 min (96%) were found for the Mantaro and Cumbaza rivers. Fe ions can also be removed using the RG1 adsorbent; the achieved values turned out to be below the permissible level of 10 µg L−1 in the case of Mantaro river. The adsorption rate was dominated by a pseudo-second-order kinetic model, suggesting a chemical sorption of Pb(II) ions on the RG1 surface. Hence, the adsorbent demonstrated remarkable selectivity for Pb and Fe in real waters, an effect mainly associated with their optimized textural properties (BET area of 75.9 m2/g and mesoporous size distribution). The optimum pH values during kinetic experiments were found to vary between 6.5 and 7.5, in agreement with the p.z.c. of the adsorbent located at 2.3 and negative zeta potential above this value. After Pb adsorption, the RG1 sample conserved its morphology, with slight variations in the PSD below 20 nm for the RG2-RG4 samples. The Ms values of samples after Pb adsorption had a reduction of 19% at RT but maintained a relatively high magnitude. These values indicated that the adsorbent can be reused for water remediation in subsequent cycles. Kinetic adsorption data and XPS measurements revealed two possible mechanisms for the Pb surface adsorption: (i) surface deprotonation reaction of γ-Fe2O3 NPs (above p.z.c. of 2.3) forming Fe O Pb + + H + complexes and (ii) formation of a thin secondary inhomogeneous layer of FeOOH coordinating with Pb species (Pb3O4 compound). Thus, this surface chemical affinity explains the high removal efficiency in real waters, suggesting the implementation of this RG1 adsorbent as a promising nano-remediator.

Supplementary Materials

The following supporting information can be downloaded at: https://www.mdpi.com/article/10.3390/nano13101684/s1, Figure S1: Raman spectra (after) for the RG1 sample (after burning protocol). Figure S2: (a) pH vs. time of Mantaro river, (b) pH vs. time of Cumbaza river, and (c) pH vs. RG1 adsorbent mass. Figure S3: Zeta potential measurement at various pH for the RG1 adsorbent. Figure S4: Particle size distribution histograms obtained from TEM images for the RGx series (x = 1–4). Figure S5: ZFC and FC 5K M(H) loops for the RGx series (x = 1–4). Field cooling values are shown in the figure. The insets depict the zoomed region for each hysteresis curve. Figure S6: High-resolution XPS spectra of O1s regions for the (a) RG1, (b) RG2, (c) RG3, and (d) RG4 samples.

Author Contributions

Conceptualization, J.A.R.-G.; methodology, J.A.R.-G.; software, J.A.R.-G., N.-R.C.-H.; validation, J.A.R.-G., N.-R.C.-H., F.J.L. and E.C.P.; formal analysis, J.A.R.-G. and N.-R.C.-H.; investigation, J.A.R.-G., N.-R.C.-H., F.J.L. and E.C.P.; resources, J.A.R.-G., N.-R.C.-H., F.J.L. and E.C.P.; data curation, J.A.R.-G., N.-R.C.-H., F.J.L. and E.C.P.; writing—original draft preparation, J.A.R.-G., N.-R.C.-H., F.J.L. and E.C.P.; writing—review and editing, J.A.R.-G., N.-R.C.-H., F.J.L. and E.C.P.; visualization, J.A.R.-G., N.-R.C.-H., F.J.L. and E.C.P.; supervision, J.A.R.-G.; project administration, J.A.R.-G.; funding acquisition, J.A.R.-G. All authors have read and agreed to the published version of the manuscript.

Funding

This work was financed by PROCIENCIA, project number 177-2020-FONDECYT, and the APC was funded by PROCIENCIA.

Data Availability Statement

The original data related to this research can be requested at the corresponding author’s email: [email protected].

Acknowledgments

This work was financed by PROCIENCIA, project number 177-2020-FONDECYT. The authors thank Amaya Arencibia for facilitating the IR and adsorption/desorption N2 isotherm measurements. Edson C. Passamani would also like to thank Fundação de Amparo à Pesquisa e Inovação do Espírito Santo (FAPES: TO-975/2022 and TO-496/2021) and Conselho Nacional de Desenvolvimento Científico e Tecnológico (CNPq) for their financial support.

Conflicts of Interest

The authors declare no conflict of interest.

References

  1. Liu, Y.; Wang, P.; Gojenko, B.; Yu, J.; Lezhang, W.; Luo, D.; Xiao, T. A review of water pollution arising from agriculture and mining activities in Central Asia: Facts, causes and effects. Environ. Pollut. 2021, 291, 118209. [Google Scholar] [CrossRef] [PubMed]
  2. Aguilar-Pesantes, A.; Peña Carpio, E.; Vitvar, T.; Koepke, R.; Menéndez-Aguado, J.M. A Comparative Study of Mining Control in Latin America. Mining 2021, 1, 6–18. [Google Scholar] [CrossRef]
  3. Quispe Yana, R.; Quispe, G.B.; Betancur, H.N.C.; Cáceres, S.H.; Mendoza, A.P.C.; Miranda, P.S.Y. Concentración de metales pesados: Cromo, cadmio y plomo en los sedimentos superficiales en el río Coata, Perú. Rev. Boliv. Quim. 2019, 36, 83–90. [Google Scholar]
  4. Jarvis, P.; Fawell, J. Lead in drinking water–an ongoing public health concern? Curr. Opin. Environ. Sci. Health 2021, 20, 100239. [Google Scholar] [CrossRef]
  5. Naranjo, V.I.; Hendricks, M.; Jones, K.S. Lead toxicity in children: An unremitting public health problem. Pediatr. Neurol. 2020, 113, 51–55. [Google Scholar] [CrossRef]
  6. Vaziri, N.D.; Gonick, H.C. Cardiovascular effects of lead exposure. Indian J. Med. Res. 2008, 128, 426–435. [Google Scholar]
  7. Sanders, T.; Liu, Y.; Buchner, V.; Tchounwou, P.B. Neurotoxic effects and biomarkers of lead exposure: A review. Rev. Environ. Health 2009, 24, 15–46. [Google Scholar] [CrossRef]
  8. Liu, T.; Lawluvy, Y.; Shi, Y.; Ighalo, J.O.; He, Y.; Zhang, Y.; Yap, P.S. Adsorption of cadmium and lead from aqueous solution using modified biochar: A review. J. Environ. Chem. Eng. 2022, 10, 106502. [Google Scholar] [CrossRef]
  9. Jjagwe, J.; Olupot, P.W.; Menya, E.; Kalibbala, H.M. Synthesis and application of Granular activated carbon from biomass waste materials for water treatment: A review. J. Bioresour. Bioprod. 2021, 6, 292–322. [Google Scholar] [CrossRef]
  10. Obey, G.; Adelaide, M.; Ramaraj, R. Biochar derived from non-customized matamba fruit shell as an adsorbent for wastewater treatment. J. Bioresour. Bioprod. 2022, 7, 109–115. [Google Scholar] [CrossRef]
  11. Thakur, A.K.; Singh, R.; Pullela, R.T.; Pundir, V. Green adsorbents for the removal of heavy metals from Wastewater: A review. Mater Today Proc. 2022, 57, 1468–1472. [Google Scholar] [CrossRef]
  12. Ramos-Guivar, J.A.; Flores-Cano, D.A.; Passamani, E.C. Differentiating nanomaghemite and nanomagnetite and discussing their importance in arsenic and lead removal from contaminated effluents: A critical review. Nanomaterials 2021, 11, 2310. [Google Scholar] [CrossRef] [PubMed]
  13. Mollideno Romero, L.F. Propuesta de un Sistema Natural Utilizando la Cáscara de Banano Para la Remoción de Plomo II. Bachelor’s Thesis, Universidad del Valle de Guatemala, Guatemala, Guatemala, 2021. [Google Scholar]
  14. Pinargote Arauz, M.E.; Vera Ramos, M.V. Adsorción de Plomo Mediante la Utilización del Exoesqueleto de Camarón y Cascarilla de Arroz en Aguas Residuales de la Industria Fabricante de Baterías. Bachelor’s Thesis, Escuela Superior Politécnica Agropecuaria de Manabí Manuel Félix López, Calceta, Ecuador, 2021. [Google Scholar]
  15. Ramos-Guivar, J.A.; Taipe, K.; Schettino, M.A.; Silva, E.; Torres, M.A.M.; Passamani, E.C.; Litterst, F.J. Improved removal capacity and equilibrium time of maghemite nanoparticles growth in zeolite type 5A for Pb (II) adsorption. Nanomaterials 2020, 10, 1668. [Google Scholar] [CrossRef] [PubMed]
  16. Ramos-Guivar, J.A.; Lopez, E.O.; Greneche, J.M.; Litterst, F.J.; Passamani, E.C. Effect of EDTA organic coating on the spin canting behavior of maghemite nanoparticles for lead (II) adsorption. Appl. Surf. Sci. 2021, 538, 148021. [Google Scholar] [CrossRef]
  17. Chen, B.; Chen, S.; Zhao, H.; Liu, Y.; Long, F.; Pan, X. A versatile β-cyclodextrin and polyethyleneimine bi-functionalized magnetic nanoadsorbent for simultaneous capture of methyl orange and Pb(II) from complex wastewater. Chemosphere 2019, 216, 605–616. [Google Scholar] [CrossRef]
  18. Oyem, H.H.; Oyem, I.M.; Usese, A.I. Iron, manganese, cadmium, chromium, zinc and arsenic groundwater contents of Agbor and Owa communities of Nigeria. Springerplus 2015, 4, 104. [Google Scholar] [CrossRef]
  19. Thommes, M.; Kaneko, K.; Niemark, A.V.; Olivier, J.P.; Rodríguez-Reinoso, F.; Rouquerol, J.; Sing, K.S.W. Physisorption of gases, with special reference to the evaluation of surface area and pore size distribution (IUPAC Technical Report). Pure Appl. Chem. 2015, 87, 1051–1069. [Google Scholar] [CrossRef]
  20. Vidal-Vidal, J.; Rivas, J.; López-Quintela, M.A. Synthesis of monodisperse maghemite nanoparticles by the microemulsion method. Colloids Surf. A Physicochem. Eng. Asp. 2006, 288, 44–51. [Google Scholar] [CrossRef]
  21. Jing, Z.; Wu, S. Synthesis, characterization and magnetic properties of γ-Fe2O3 nanoparticles via a non-aqueous medium. J. Solid State Chem. 2004, 177, 1213–1218. [Google Scholar] [CrossRef]
  22. Chamritski, I.; Burns, G. Infrared-and Raman-active phonons of magnetite, maghemite, and hematite: A computer simulation and spectroscopic study. J. Phys. Chem. B 2005, 109, 4965–4968. [Google Scholar] [CrossRef]
  23. Ramos-Guivar, J.A.; Gonzalez-Gonzalez, J.C.; Litterst, F.J.; Passamani, E.C. Rietveld Refinement, μ-Raman, X-ray Photoelectron, and Mössbauer Studies of Metal Oxide-Nanoparticles Growth on Multiwall Carbon Nanotubes and Graphene Oxide. Cryst. Growth Des. 2021, 21, 2128–2141. [Google Scholar] [CrossRef]
  24. El Mendili, Y.; Bardeau, J.F.; Randrianantoandro, N.; Grasset, F.; Greneche, J.M. Insights into the mechanism related to the phase transition from γ-Fe2O3 to α-Fe2O3 nanoparticles induced by thermal treatment and laser irradiation. J. Phys. Chem. C 2012, 116, 23785–23792. [Google Scholar] [CrossRef]
  25. Flores-Cano, D.A.; Checca-Huaman, N.R.; Castro-Merino, I.L.; Pinotti, C.N.; Passamani, E.C.; Litterst, F.J.; Ramos-Guivar, J.A. Progress toward Room-Temperature Synthesis and Functionalization of Iron oxide Nanoparticles. Int. J. Mol. Sci. 2022, 23, 8279. [Google Scholar] [CrossRef] [PubMed]
  26. Ramos-Guivar, J.A.; Zarria-Romero, J.Y.; Castro-Merino, I.L.; Greneche, J.M.; Passamani, E.C. Improvement of the thermal stability of nanomaghemite by functionalization with type 5A zeolite and magnetic properties studied by in-field 57Fe Mössbauer measurements. J. Magn. Magn. Mater. 2022, 552, 169241. [Google Scholar] [CrossRef]
  27. Soler, M.A.G.; Alcantara, G.B.; Soares, F.Q.; Viali, W.R.; Sartoratto, P.P.C.; Fernandez, J.R.L.; da Silva, S.W.; Garg, V.K.; Oliveira, A.C.; Morais, P.C. Study of molecular surface coating on the stability of maghemite nanoparticles. Surf. Sci. 2007, 601, 3921–3925. [Google Scholar] [CrossRef]
  28. Kumari, M.; Pittman, C.U., Jr.; Mohan, D. Heavy metals [chromium (VI) and lead (II)] removal from water using mesoporous magnetite (Fe3O4) nanospheres. J. Colloid Interface Sci. 2015, 442, 120–132. [Google Scholar] [CrossRef]
  29. Roca, A.G.; Niznansky, D.; Poltierova-Vejpravova, J.; Bittova, B.; González-Fernández, M.A.; Serna, C.J.; Morales, M.P. Magnetite nanoparticles with no surface spin canting. J. Appl. Phys. 2009, 105, 114309. [Google Scholar] [CrossRef]
  30. Cornell, R.M.; Schwertmann, U. The Iron Oxides; Wiley-VCH: Weinheim, Germany, 2003. [Google Scholar]
  31. Mørup, S.; Tronc, E. Superparamagnetic relaxation of weakly interacting particles. Phys. Rev. Lett. 1994, 72, 3278. [Google Scholar] [CrossRef]
  32. Biesinger, M.C.; Payne, B.P.; Grosvenor, A.P.; Lau, L.W.M.; Gerson, A.R.; Smart, R.S.C. Resolving surface chemical states in XPS analysis of first row transition metals, oxides and hydroxides: Cr, Mn, Fe, Co and Ni. App. Surf. Sci. 2011, 257, 2717–2730. [Google Scholar] [CrossRef]
  33. Hawn, D.D.; DeKoven, B.M. Deconvolution as a correction for photoelectron inelastic energy losses in the core level XPS spectra of iron oxides. Surf. Interface Anal. 1987, 10, 63–74. [Google Scholar] [CrossRef]
  34. Radu, T.; Iacovita, C.; Benea, D.; Turcu, R. X-ray photoelectron spectroscopy characterization of iron oxide nanoparticles. Appl. Surf. Sci. 2017, 405, 337–343. [Google Scholar] [CrossRef]
  35. McIntyre, N.S.; Zetaruk, D.G. X-ray Photoelectron Spectroscopy Studies of Iron Oxides. Anal. Chem. 1977, 49, 1521–1529. [Google Scholar] [CrossRef]
  36. Moulder, J.F.; Stickle, W.F.; Sobol, P.E.; Bomben, K.D. Handbook of X-ray Photoelectron Spectroscopy; Perkin-Elmer Corporation Physical Electronics Division: Eden Prairie, MN, USA, 1992. [Google Scholar]
  37. Morgan, W.E.; Van Wazer, J.R. Binding Energy Shifts in the X-ray Photoelectron Spectra of a Series of Related Group IV-a Compounds. J. Phys. Chem. 1973, 77, 964–969. [Google Scholar] [CrossRef]
  38. Beamson, G.; Briggs, D. High Resolution XPS of Organic Polymers the Scienta ESCA300 Database; John Wiley & Sons: New York, NY, USA, 1992. [Google Scholar]
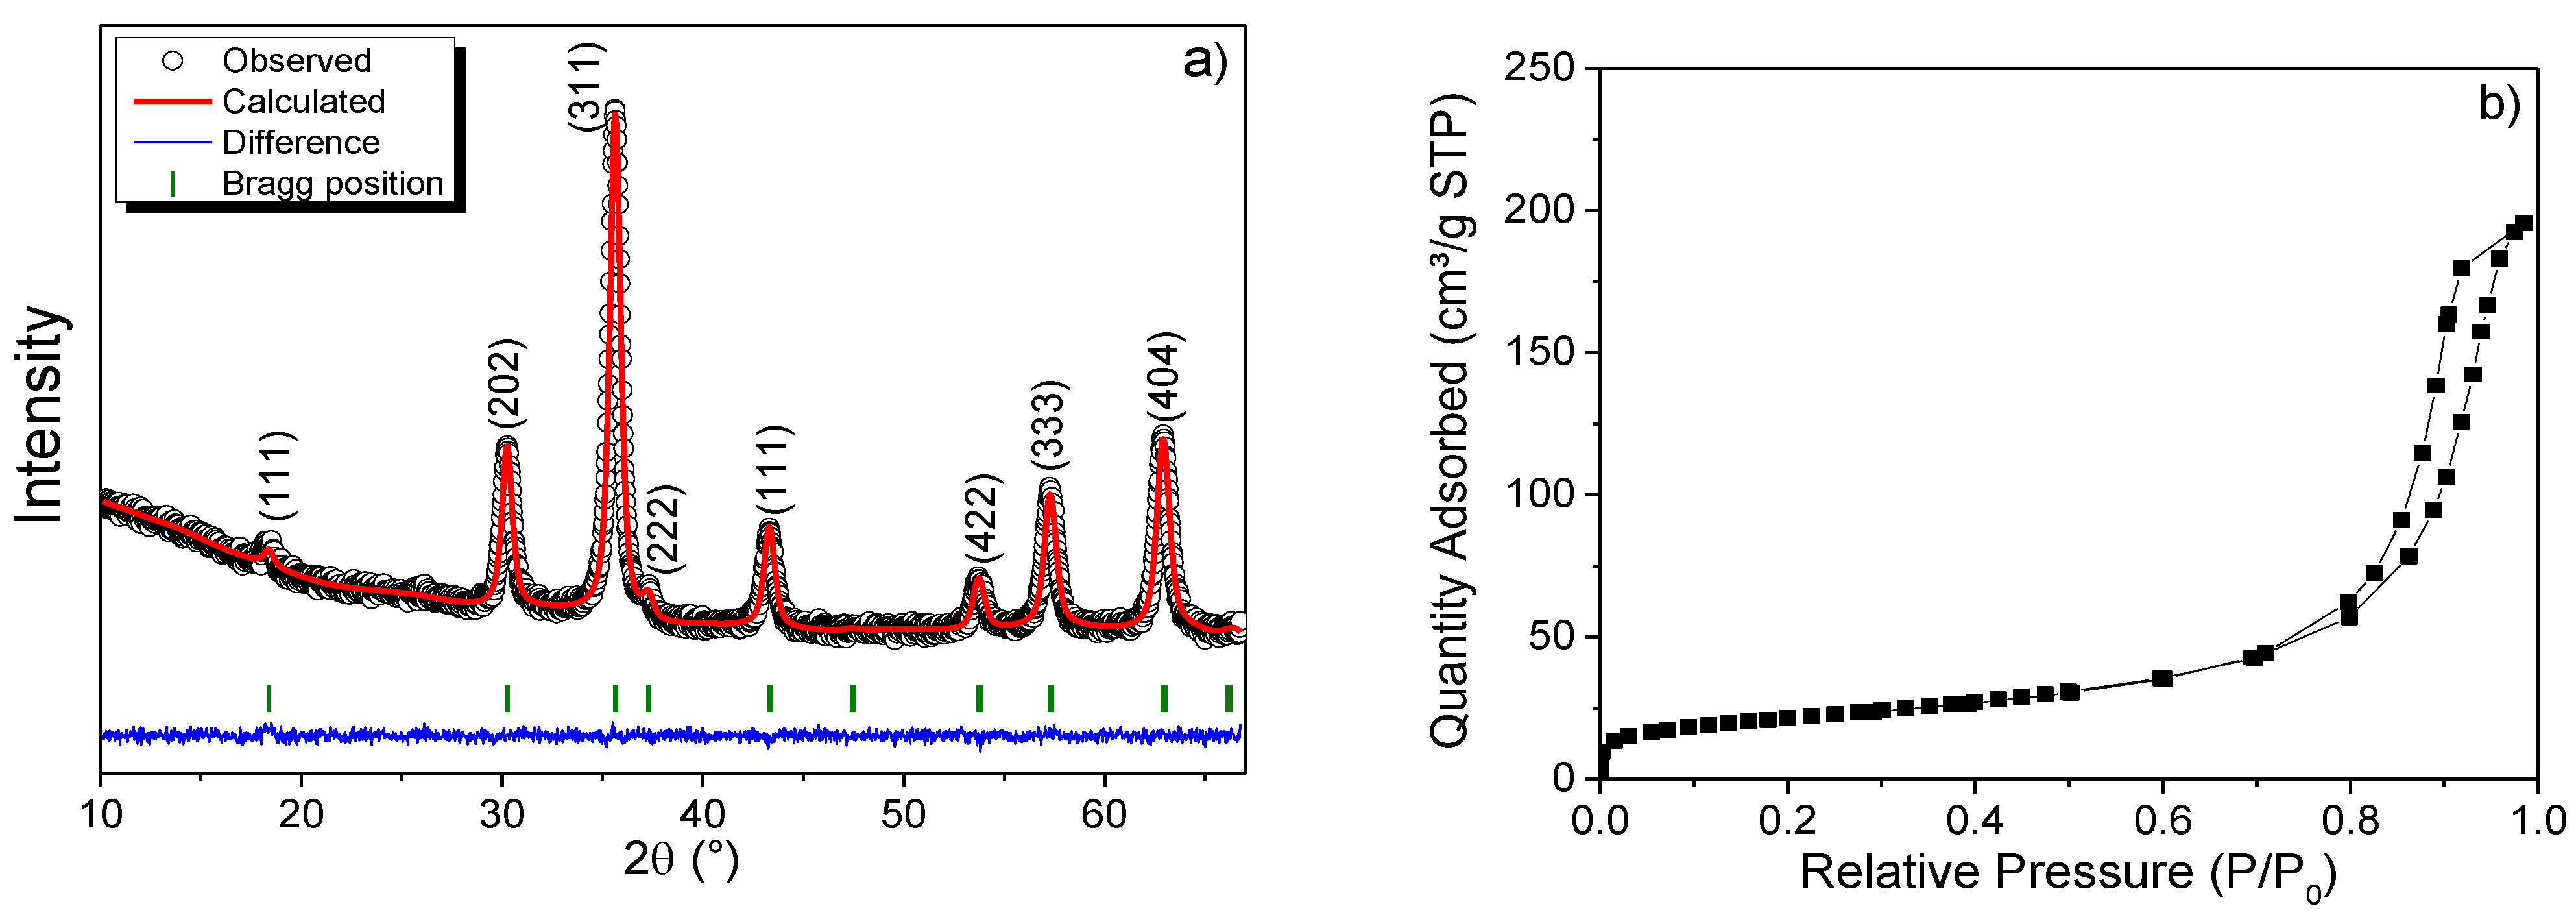
Figure 1. (a) Refined diffractogram, (b) N2 adsorption–desorption obtained at 77 K, (c) pore size distribution, and (d) IR absorbance spectrum for the RG1 sample.
Nanomaterials 13 01684 g001aNanomaterials 13 01684 g001b
Figure 2. Raman spectra of the RG1 sample recorded at several laser powers. The arrow indicates the main optical Raman mode usually found in γ-Fe2O3 NPs.
Nanomaterials 13 01684 g002
Figure 3. (a) Total Pb removal efficiency vs. time, (b) total Pb removal efficiency vs. RG1 adsorbent dose, (c,d) linear fits for the pseudo-second-order model of data recorded from the Mantaro and Cumbaza rivers.
Nanomaterials 13 01684 g003aNanomaterials 13 01684 g003b
Figure 4. (a,b) TEM and STEM images of the RG1 sample. (c) EDS mapping image and (d,e) elemental EDS images for Fe and O. (f,g) TEM and STEM images of the RG2 sample (RG1 applied at different adsorbent dose). (h) EDS mapping image and (ik) elemental EDS images for Pb, Fe, and O. (l,m) TEM and STEM images of the RG3 sample (RG1 applied in Cumbaza river). (n) EDS mapping image and (oq) elemental EDS images for Pb, Fe, and O. (r,s) TEM and STEM images of the RG4 sample (RG1 applied in Mantaro river). (t) EDS mapping image and (uw) elemental EDS images for Pb, Fe, and O.
Nanomaterials 13 01684 g004
Figure 5. EDS spectra for the RGx series (x = 1, 2, 3 and 4). RG2 sample is the RG1 applied at different adsorbent dose, RG3 sample is the RG1 applied in Cumbaza river, and the RG4 sample is the RG1 applied in Mantaro river.
Nanomaterials 13 01684 g005
Figure 6. (a) RT M(H) curves for the RGx series (x = 1–4) and (b) zoomed region for scan field of ±0.10 kOe. In a) RG2 and RG4 are overlapping. RG2 sample is the RG1 applied at different adsorbent dose, RG3 sample is the RG1 applied in Cumbaza river, and the RG4 sample is the RG1 applied in Mantaro river.
Nanomaterials 13 01684 g006
Figure 7. 57Fe Mössbauer spectra for the RGx series (x = 1,3, and 4) taken at 300 K, 15 K, and 17 K. The two Fe sites (A: tetragonal (blue) and B: Octahedral (green)) of the spinel-like structure of the γ Fe 2 O 3 are clearly shown for measurements at 15 K. The other subspectra are discussed in the text. RG3 sample is the RG1 applied in Cumbaza river and the RG4 sample is the RG1 applied in Mantaro river.
Nanomaterials 13 01684 g007aNanomaterials 13 01684 g007b
Figure 8. High-resolution XPS spectra of Fe2p regions for the (a) RG1, (b) RG2, (c) RG3, and (d) RG4 samples. RG3 sample is the RG1 applied in Cumbaza river and the RG4 sample is the RG1 applied in Mantaro river. Red curve is the experimental data, blue line is the fit spectra, and black lines are the fit components.
Nanomaterials 13 01684 g008
Figure 9. High-resolution XPS spectra of Pb4f regions for the (a) RG2, (b) RG3, and (c) RG4 samples. RG3 sample is the RG1 applied in Cumbaza river and the RG4 sample is the RG1 applied in Mantaro river. Red curve is the experimental data, blue line is the fit spectra, and black lines are the fit components.
Nanomaterials 13 01684 g009
Scheme 1. Surface adsorption mechanism for Pb removal in Cumbaza river using γ-Fe2O3 NPs.
Nanomaterials 13 01684 sch001
Table 1. Rietveld refined parameters for the RG1 sample. Rp (%) is the profile refinement, Rwp (%) the weighted profile residual, Rexp (%) the expected profile residual, and χ2 the goodness of fit.
SampleAtomsAtomic Positions Thermal Parameters
( 2 )
Lattice Parameters
( )
Statistical Parameters
xyz
γ-Fe2O3Fe-A0.125000.125000.125000.80137a = b = c = 8.339
α = β = γ = 90°
Rp = 256.0 %
Rwp = 71.4 %
Rexp = 68.6 %
χ2 = 1.04
Fe-B0.500000.500000.500001.87565
O0.249550.249300.249300.55897
Table 2. Linear fit parameters obtained from the pseudo-second-order kinetic model for the Cumbaza and Mantaro rivers using the RG1 sample as adsorbent. qe is the adsorbed quantity at the equilibrium time and k2 the kinetic adsorption constant.
SampleCumbaza RiverMantaro River
Intercept0.072731.27702
Slope0.029310.34992
R20.999770.99947
qe (mg g−1)34.22.7
k2 (mg g−1 min−1) × 10−31296
Table 3. TEM parameters obtained for the RGx series after fitting the data with log-normal distribution. <D> is the mean particle size and Dm the mode size obtained from the distribution. RG2 sample is the RG1 applied at different adsorbent dose, RG3 sample is the RG1 applied in Cumbaza river and the RG4 sample is the RG1 applied in Mantaro river.
Samples<D> (nm)Dm (nm)Standard DeviationAsymmetry
RG112.6511.743.50.85
RG217.0715.215.981.09
RG316.3114.735.361.02
RG414.2912.375.631.24
Table 4. EDS atomic composition for the RGx series. RG2 sample is the RG1 applied at different adsorbent dose, RG3 sample is the RG1 applied in Cumbaza river and the RG4 sample is the RG1 applied in Mantaro river.
SampleFe (% at)O (% at)Pb (% at)
RG131.268.8-
RG230.268.80.9
RG331.667.01.4
RG429.070.40.6
Table 5. Hyperfine magnetic parameters obtained from the fits of the 57Fe Mössbauer spectra recorded at 17 and 15 K for the RGx series. RG3 sample is the RG1 applied in Cumbaza river and the RG4 sample is the RG1 applied in Mantaro river.
R.A.A. (%)CS(vs Fe) (mm/s)B (T)σ(T)Q (mm/s)W (mm/s)
RG1 17K
A 38 (2)0.303 (5)51.8 (2)1.1 (1)0.00 (2)0.39 (1)
B 62 (2)0.514 (5)52.6 (2)1.0 (1)0.00 (2)0.39 (1)
RG3 15K
A 38 (2)0.359 (5)51.6 (2)1.1 (1)0.00 (2)0.37 (1)
B 62 (2)0.469 (5)52.4 (2)1.1 (1)0.00 (2)0.37 (1)
RG4 15K
A 38 (2)0.344 (5)51.8 (2)1.1 (1)0.00 (2)0.37 (1)
B 62 (2)0.569 (5)52.5 (2)1.0 (1)0.00 (2)0.37 (1)
Table 6. Hyperfine magnetic parameters obtained from the fits of the 57Fe Mössbauer spectra recorded at RT for the RGx series. RG3 sample is the RG1 applied in Cumbaza river and the RG4 sample is the RG1 applied in Mantaro river.
R.A.A. (%)CS(vs Fe) (mm/s)B (T)σ (T)Q (mm/s)W (mm/s)
RG1 300 K
I,A19 (2)0.20 (1)47.6 (1)1.2 (1)0.00 (1)0.37 (1)
I,B32 (2)0.41 (1)47.6 (1)1.8 (1)0.00 (1)0.37 (1)
II,A16 (2)0.22 (1)42.0 (1)4.5 (2)0.00 (1)0.37 (1)
II,B27 (2)0.43 (1)42.0 (1)4.5 (2)0.00 (1)0.37 (1)
III5 (2)0.30 (4)17.4 (3)1.0 (2)−0.17 (5)0.37 (1)
“impurity“2 (2)0.15 (4) 0.8 (1)0.4 (1)
RG3 300 K
I,A17 (2)0.23 (1)47.5 (1)1.9 (1)0.00 (1)0.37 (1)
I,B28 (2)0.44 (1)47.5 (1)1.6 (1)0.00 (1)0.37 (1)
II,A17 (2)0.24 (1)41.6 (1)5.1 (2)0.00 (1)0.37 (1)
II,B28 (2)0.45 (1)41.6 (1)5.1 (2)0.00 (1)0.37 (1)
III8 (2)0.42 (4)17.5 (3)1.9 (2)−0.01 (5)0.37 (1)
“impurity“2 (2)0.15 (4) 0.8 (1)0.4 (1)
RG4 300 K
I,A16 (2)0.24 (1)47.7 (1)1.4 (1)0.00 (2)0.37 (1)
I,B26 (2)0.45 (1)47.7 (1)1.6 (1)0.00 (2)0.37 (1)
II,A19 (2)0.27 (1)42.4 (1)4.9 (2)0.00 (2)0.37 (1)
II,B31 (2)0.48 (1)42.4 (1)4.9 (2)0.00 (2)0.37 (1)
III7 (2)0.37 (4)17.2 (3)2.0 (2)−0.01 (2)0.37 (1)
“impurity“1 (1)0.15 (4) 0.4 (1)0.4 (1)
Table 7. Result of fitting the XPS peaks for the RG samples.
SampleLevelBE (eV)at.%Bond TypeRef.
RG1 O 1s529.550.4O-Metal[35,36]
O 1s531.217.9OH-Metal[32]
O 1s533.011.8OH-Organic[38]
Fe 2p3/2706.40.5Fe0[36]
Fe 2p3/2710.28.1Fe3+ (Fe2O3)[32]
Fe 2p3/2712.011.4Fe3+ (FeOOH)[35,36]
RG2 O 1s529.432.6O-Metal[35,36]
O 1s531.427.8OH-Metal[32]
O 1s533.024.2OH-Organic[38]
Fe 2p3/2710.16.3Fe3+ (Fe2O3)[32]
Fe 2p3/2712.64.6Fe3+(FeOOH)
Pb 4f7/2137.93.8Pb2+ (PbOx)[36,37]
Pb 4f7/2139.50.7Pb4+ (complex)[37]
RG3 O 1s529.122.0O-Metal [35,36]
O 1s531.751.6OH-Metal[32]
O 1s533.513.6OH-Organic[38]
Fe 2p3/2706.00.6Fe0[36]
Fe 2p3/2710.05.9Fe2+ (Fe2O3)[32]
Fe 2p3/2712.62.5Fe3+(FeOOH)
Pb 4f7/2137.62.5Pb2+ (PbOx)[36,37]
Pb 4f7/2139.01.2Pb4+ (complex)[37]
RG4 O 1s529.436.5O-Metal[35,36]
O 1s530.86.2O-Organic[36,38]
O 1s531.812.5OH-Metal[32]
O 1s533.216.6OH-Organic[38]
Fe 2p3/2710.05.9Fe3+ (Fe2O3)[32]
Fe 2p3/2712.18.9Fe3+ (FeOOH)[36]
Si 2p3/2100.510.1Si-C[36]
Pb 4f7/2136.30.2Pb0[36]
Pb 4f7/2137.82.8Pb2+ (PbOx)[36,37]
Pb 4f7/2139.20.3Pb4+ (complex)[37]
Disclaimer/Publisher’s Note: The statements, opinions and data contained in all publications are solely those of the individual author(s) and contributor(s) and not of MDPI and/or the editor(s). MDPI and/or the editor(s) disclaim responsibility for any injury to people or property resulting from any ideas, methods, instructions or products referred to in the content.