Article

The Thermophysical and Physicochemical Properties of the Aqueous Dispersion of Graphene Oxide Dual-Beam Thermal Lens Spectrometry

by
Vladislav R. Khabibullin
1,
Daria-Maria V. Ratova
1,
Dmitrii N. Stolbov
2,
Ivan V. Mikheev
1,* and
Mikhail A. Proskurnin
1,*
1
Analytical Chemistry Division, Chemistry Department, M. V. Lomonosov Moscow State University, d. 1, Str. 3, Lenin Hills, GSP-1, Moscow 119234, Russia
2
Physical Chemistry Division, Chemistry Department, M. V. Lomonosov Moscow State University, d. 1, Str. 3, Lenin Hills, GSP-1, Moscow 119234, Russia
*
Authors to whom correspondence should be addressed.
Nanomaterials 2023, 13(14), 2126; https://doi.org/10.3390/nano13142126
Submission received: 16 June 2023 / Revised: 16 July 2023 / Accepted: 19 July 2023 / Published: 21 July 2023
(This article belongs to the Special Issue Photoacoustic and Photothermal Phenomena in Nanomaterials)

Abstract

:
Modern heat-conducting materials require special attention to analyze their thermophysical properties. Compared to classical methods, thermal lens spectrometry (TLS) has advantages due to its high sensitivity to physical and chemical composition. To avoid a systematic error in the analysis of complex systems, it is necessary to realize the limits of the applicability of the method. This study considers the features of thermal-diffusivity measurements by TLS in the stationary state for dispersed systems with absorbances up to 0.05. The limits of applicability of the method in analyzing heterogeneous systems are shown, and a mathematical apparatus is proposed for indicating a systematic error in finding thermal diffusivity that does not exceed 1%. Graphene oxide (GO), which has attractive physicochemical properties, was used as the object of analysis. GO belongs to 2D objects, the study of which requires highly sensitive methods and special attention when discussing the results. The thermophysical properties of aqueous dispersions of graphene oxide in a wide range of concentrations (up to 2 g/L) and lateral sizes (up to 4 µm) were studied by TLS. It has been found that with increasing nanophase concentration, the thermal diffusivity of graphene oxide dispersions passes through a minimum, which can be used in solving thermal insulation problems. It has been established that prolonged laser irradiation of the dispersion leads to a change in thermal diffusivity, which indicates the photochemical reduction of graphene oxide.

1. Introduction

In recent decades, the importance of the problems of heat transfer efficiency and heat storage has increased. The explosive development of electronics and microelectronics, increasing the power of devices, as well as the proper functioning of engines, power units, etc. (where the operating temperature must be maintained by continuous heat removal), have led to the need for new approaches to cooling and heat exchange. The increased number of publications on this topic evidences this; the literature shows that new heat-conducting materials and approaches to analysing thermophysical properties are required [1,2,3,4,5,6]. Classical cooling and heat-conducting materials (glycerin, water, glycols, metals, etc.) are not always effective. Liquid heat-conducting substances (water, ethylene glycol, etc.) have a high heat capacity. They can store thermal energy for a long time, but they dissipate it poorly due to low thermal conductivity. Extended surfaces (fins and microchannels), vibration, liquid suction/injection, and special/magnetic fields to improve heat transfer have come to a standstill. On the other hand, solid particles of millimeter or micrometer sizes have excellent thermal conductivity, and adding them to a base fluid increases heat transfer. However, the use of particles of this size causes problems. Dispersions have poor stability, leading to channel clogging [7].
One of the solutions to this problem is using heat-conducting nanofluids (NFs) [8,9,10]. Choi et al. [11] in 1995 found that the addition of a small amount of nanoparticles (NPs) to a solvent leads to a qualitative change in the thermophysical properties of pure solvents (water, ethanol, and ethylene glycol) and introduced a new term, nanofluids.
Two groups of fillers are used to obtain heat-conducting NFs: metal-based and carbon nanomaterials. The first group includes metals (e.g., Cu, Ag, Au, Ag, etc. [12,13,14,15]), their oxides (ZnO, Fe3O4, TiO2, etc. [16,17,18,19,20]), quantum dots [21], nanocrystals [22], etc. The second group includes all carbon materials (nanotubes [23,24], graphene [25], carbon nanoparticles and dots [26], soot, etc.) [27,28]. The use of metal nanoparticles is complicated by dispersion stabilization as well as the chemical degradation of particles. Considering the surface modification of nanoparticles, obtaining stable dispersions in a wide range of concentrations is difficult [29]. The aggregation and sedimentation of nanoparticles in a dispersion worsen the thermal parameters of a nanofluid [19]. On the other hand, carbon nanomaterials (CNM) have more attractive properties, making them promising candidates for stable dispersions with desirable heat-conducting parameters [30]. Due to its developed surface and many functional groups, CNM has higher aggregative and sedimentary stability [31]. Due to the π–π-conjugation, carbon nanomaterials are more chemically inert than metal nanoparticles, which undergo chemical degradation in water [32,33]. Particular attention should be paid to the thermophysical properties, where carbon materials occupy a special place. The thermal conductivity of various CNMs at room temperature covers an extensive range of more than five orders of magnitude. For amorphous carbon, the thermal conductivity is ca. 0.01 W/(m·K). For diamond and graphene, it is more than 2000 W/(m·K); for carbon nanotubes, it is ca. 3000–3500 W/(m·K) [32,34]. For a type II diamond, the thermal conductivity can reach 10,000 W/(m·K) [34]. Compared to CNTs, metal nanoparticles have a lower thermal conductivity, reaching several hundred W/(m·K) [35]. The thermal conductivity of polymers is even lower, in the range of 0.1–0.5 W/(m·K) [36].
Graphene oxide occupies a special place among carbon nanomaterials. This is indicated by many studies, review articles, and monographs published over the past 5–7 years. To date, graphene oxide (GO) has already proven itself in solving medical problems (biosensors [37,38,39], bioelectronics [40], targeted drug delivery [41,42]) and environmental glitches (wastewater treatment [43,44,45]). As a classic 2D material, GO exhibits special electrically conductive properties and is successfully used to solve energy-related (supercapacitors [46]) problems [47]. Adding small amounts of GO to building materials qualitatively improves their physical and mechanical properties. With the addition of graphene oxide, new types of cement [48,49], anticorrosion and refractory materials, coatings [50,51], and polymer composite materials with variable properties [52] are obtained. In addition, GO has a high thermal conductivity [53,54], which makes it a promising candidate as a filler for heat-conducting nanofluids. At the same time, despite its many valuable properties and wide range of applications, there are currently no systematic studies of the thermophysical properties of aqueous dispersions of graphene oxide in a wide range of concentrations and sizes.
Various fillers for heat-conducting NFs and their morphological and physicochemical features require new approaches to analyzing thermal parameters. In reviews devoted to heat-conducting nanofluids, the authors point out contradictions in measuring the same or similar systems regarding physicochemical and morphological properties [55,56]. This issue requires the unification and standardization of approaches to analyzing complex heterogeneous systems. At the same time, for heat-conducting NFs, it is necessary to measure not only thermal conductivity (k), heat capacity (Cp), viscosity (η), and density (ρ) but also thermal diffusivity (D). Classical methods for measuring thermal parameters show low sensitivity to the nanophase, which makes these methods unsuitable for thermal parameters and thermal diffusivity in particular [57].
One of the solutions to this problem is the use of photothermal spectroscopy (PTS). The group of photothermal methods is based on registering the nonradiative relaxation of excited molecules. It has proven to be a fast and highly sensitive approach to analyzing the thermophysical properties of liquids, solids, and complex systems [58,59,60]. Among the methods of PTS, a special place is occupied by thermal-lens spectrometry (TLS), which is used to analyze the thermophysical properties of various dispersed systems and heat-conducting nanofluids [19,61,62,63]. TLS is highly sensitive to low concentrations of the solid phase and differences in the morphological properties of the nanophase [21,26,27,64]. Using TLS, differences in the thermophysical properties of bimetallic nanoparticles with different ratios of metals were determined [65]. In another study [66], TLS displayed significant changes in the temperature diffusivity of particles in a narrow size range of 4.6–5.2 nm. It is worth noting that the measurement of thermophysical properties is one of the applications of TLS. Due to the possibility of continuous measurement and recording of transient curves, the method is successfully used to analyze the kinetics of physical and chemical processes, in the analysis of photochemical reactions, in flow analysis, as a detector for high-performance liquid chromatography, etc. [67]
However, despite the significant advantages of TLS in analyzing heterogeneous systems, measurement accuracy issues require special attention. Additionally, in many cases, the results of TLS cannot be applied to other systems. This significantly limits the applicability of TLS. Earlier papers devoted to the influence of systematic errors on the determination of thermophysical parameters for homogeneous systems [68] pose questions regarding the correctness of measurements for heterogeneous systems [57]. In [57], general recommendations for thermal-lens measurements were proposed for low-absorbing silicon oxide nanoparticles.
In this study, the thermophysical properties of aqueous dispersions of graphene oxide were measured by dual-beam thermal lens spectrometry in a wide range of concentrations and sizes of the nanophase. Primary attention is paid to validating thermal diffusivity measurements as a key issue in analyzing dispersions with high absorbances. In conclusion, the influence of continuous long-term laser radiation on the physicochemical and thermal properties of the GO–water system is considered. The results of this study make a contribution to the development of thermal lens spectrometry. This article will be helpful for researchers involved in the analysis of the thermophysical and physicochemical properties of complex systems. The research results expand the understanding of the thermophysical properties of aqueous graphene oxide dispersions and can help solve problems in heat engineering, energy, and materials science.

2. Materials and Methods

2.1. Preparation of Graphene Oxide Dispersions

The aqueous graphene oxide (Hummers’ type) (LLC Rusgraphene, Moscow, Russia) dispersions were prepared with extra exfoliation, including ultrasound probe usage (25 mL, 2 g/L). Purification procedures have been conducted elsewhere, published in [69]. The sized fractions of graphene oxide were prepared using the standard protocol published elsewhere [70] with slight modification using another membrane type. The stock solution of graphene oxide was purified using a 0.5 kDa membrane (dialysis bag). The following fraction was prepared: bulk >0.5 kDa, >14 kDa, 0.5–14 kDa, 3.5–14 kDa, 3.5–1.0 kDa, and 0.5–1.0 kDa after preliminary purification from: (1) oxidizing agents for synthesis GO such as KMnO4, H2SO4, etc., and (2) oxidation debris (OD) [71]. The SEM images of the graphene oxide fraction are presented in Figure S2 (Supplementary Materials).

2.2. Thermal-Lens SPECTROMETER

A dual-beam thermal lens spectrometer was used. Optimization of the spectrometer and measurement parameters is presented in [57,68]. The scheme and description of the spectrometer are explained in detail in the Supplementary Materials (Figure S1 and Procedures section, thermal-lens spectrometer). Measurement parameters are presented in Table S1.

2.3. Thermal-Lens Measurements

The Shen–Snook model presented in the Supplementary Materials (Procedures, Shen–Snook model) was used to describe thermal lens measurements. This section shows the adaptation of the model to measurements of heterogeneous systems and represents the equation needed to find the thermal diffusivity of heterogeneous systems. Below are the basic equations necessary to find the thermal diffusivity of GO dispersions with slight changes.
For ease of use of Equation (S1), we introduce substitutions and represent them as:
I t = I 0 1 0.5 θ t a n 1 a / ( b t c / 2 t + c ) 2 ,
where a, b, and c are constants, a = 2 mV, b = (1 + 2 m)2 + V2, c = 1 + 2 m + V2, respectively. As proposed in [57], Equation (1) is presented as a function of the effective characteristic time t c ~ t at each moment of the transient development curve:
t c ~ t = [ ( a / t a n [ 2 × ( 1 I t / I ) / θ ] ) c ] × 2 t / b .
Here, θ = 2[1 − I(∞)/I(0)]/tan−1(a/c), where I is the stationary-state probe intensity. This study uses the full development of the thermal field and the achievement of a stationary state. The data for the last 300 ms of the transient curve were averaged for homogeneous and heterogeneous systems with no thermophoresis. For the transition from effective to the true value of t c , the first 150 ms of the function t c ~ t were averaged, after which, using Equation (S5), the thermal diffusivity of the system was found.
When pronounced thermophoresis is present in disperse systems, the characteristic time and thermal diffusivity are determined according to the recommendations in [57]. In this case, the corrected steady-state probe laser intensity I ( ) is used, which is found by fitting the first 150 ms of the theoretical transient curve with the experimental one so that the first 150 ms correlate well.
In this case, the characteristic time can be found according to Equation (1) using the corrected intensity I ( ) :
t c ~ t = [ ( a / t a n [ 2 × ( 1 I t / I ) / θ ] ) c ] × 2 t / b ,
The transition from effective to true characteristic time was also carried out by averaging the first 150 ms of the function t c ~ t , after which, using Equation (S5), the thermal diffusivity of the system was found.
Transient thermal-lens curves in this study are used in two normalized forms. In the first form, normalization is made using the largest value I(t)/I(0). In the second, the normalization was performed as
I ~ t = [ I ( t ) I ( ) ] [ I ( 0 ) I ( ) ] ,
where I ( ) is the intensity of the probe beam in the stationary state. Depending on the presence/absence of thermophoresis, I ( ) is found either by fitting (in which case it is I ( ) ), or by averaging the last 300 ms of the transition curve (true I ). This normalisation form makes distinguishing between the thermal lens and thermophoresis processes possible.
In addition to thermal diffusivity, a thermal lens signal was used as an analytical signal, which is found according to the following equation:
ϑ = I 0 I I 0
Here, the transient curve average of the last 300 ms was used as the steady state. Since the excitation laser range of absorbances and powers were widely varied, the thermal-lens signal in two forms was used for comparison. In the first form, the thermal lens signal was normalized to the excitation radiation power ( ϑ / P ) . In the second form, the signal was normalized concerning power and absorbance, obtaining ϑ / ( P A ) .
To compare the normalized thermal-lens signals with each other, an additional normalization 1 ÷ 0 was carried out while obtaining ϑ ~ / P   and ϑ ~ / P A , where the normalized thermal lens signals ϑ / P   and ϑ / ( P A ) at the highest concentration of GO were taken as unity.
Random errors in finding the thermal diffusivity and thermal lens signal were carried out according to known equations presented in detail in the Supplementary Materials (see Procedures section, Statistical analysis).

2.4. Other Instruments and Their Operation Parameters

ATR-FTIR spectra for GO samples were recorded on a Bruker Vertex 70 single-beam IR Fourier spectrometer (Bruker Optik GmbH, Ettlingen, Germany) equipped with a GladiATR™ (PIKE Technologies, Fitchburg, WI, USA) monolithic diamond ATR for the entire spectral range from 4000 to 400 cm−1.
The morphology and structure of the samples were studied using a JEOL JSM-6390 LA scanning electron microscope (SEM) (JEOL, Tokyo, Japan). Samples were freeze-dried, placed on a double-sided carbon conductive tape, pumped, and checked at an acceleration voltage of 20 kV. The samples were preliminarily frozen for freeze-drying at a temperature of −60 °C. Frozen samples were dried in vacuo at temperatures of 3, 10, and 20 °C for 24 h.
UV/visible absorption spectra were recorded using a Cary 4000 scanning double-beam spectrophotometer (Varian, Mulgrave, Australia). Spectrophotometric measurements were carried out in Agilent Quartz Cuvettes with an optical path length of 1 mm and a registration pitch of 1 nm in the 190–800 nm range.

3. Results

3.1. Verification of Correct Operation of the Spectrometer

To confirm the correct operation of the spectrometer, the model and measurement conditions, before analyzing aqueous graphene oxide dispersions, the thermal diffusivity of an object with precisely known thermal and optical properties was measured. A pure solvent (ethanol, toluene, acetonitrile, water, etc.) is usually used as a reference material [28]. The research objects are aqueous graphene oxide dispersions, and pure water was used as a reference. Figure 1 shows the transient curves (normalized form, according to Equation (4)) of an aqueous solution of a photostable dye, Ferroin, with a concentration of 1 μmol/L.
The transient curves of the model approximation clearly describe the experimental transition curves. The average (n = 5) thermal diffusivity (Equation (S9)) was 0.143 mm2/s, which agrees well with the reference data [72]. The low relative standard deviation (Equation (S7), 2.4%) indicates high reproducibility of the results and a low random error. Thus, the thermal lens spectrometer works correctly, and the selection of operating measurement parameters is optimal. Hence, all deviations that were observed for dispersions of graphene oxides are related to the features of the samples.

3.2. Effect of Graphene Oxide Concentration and Size on the Thermophysical Properties of Aqueous Dispersions

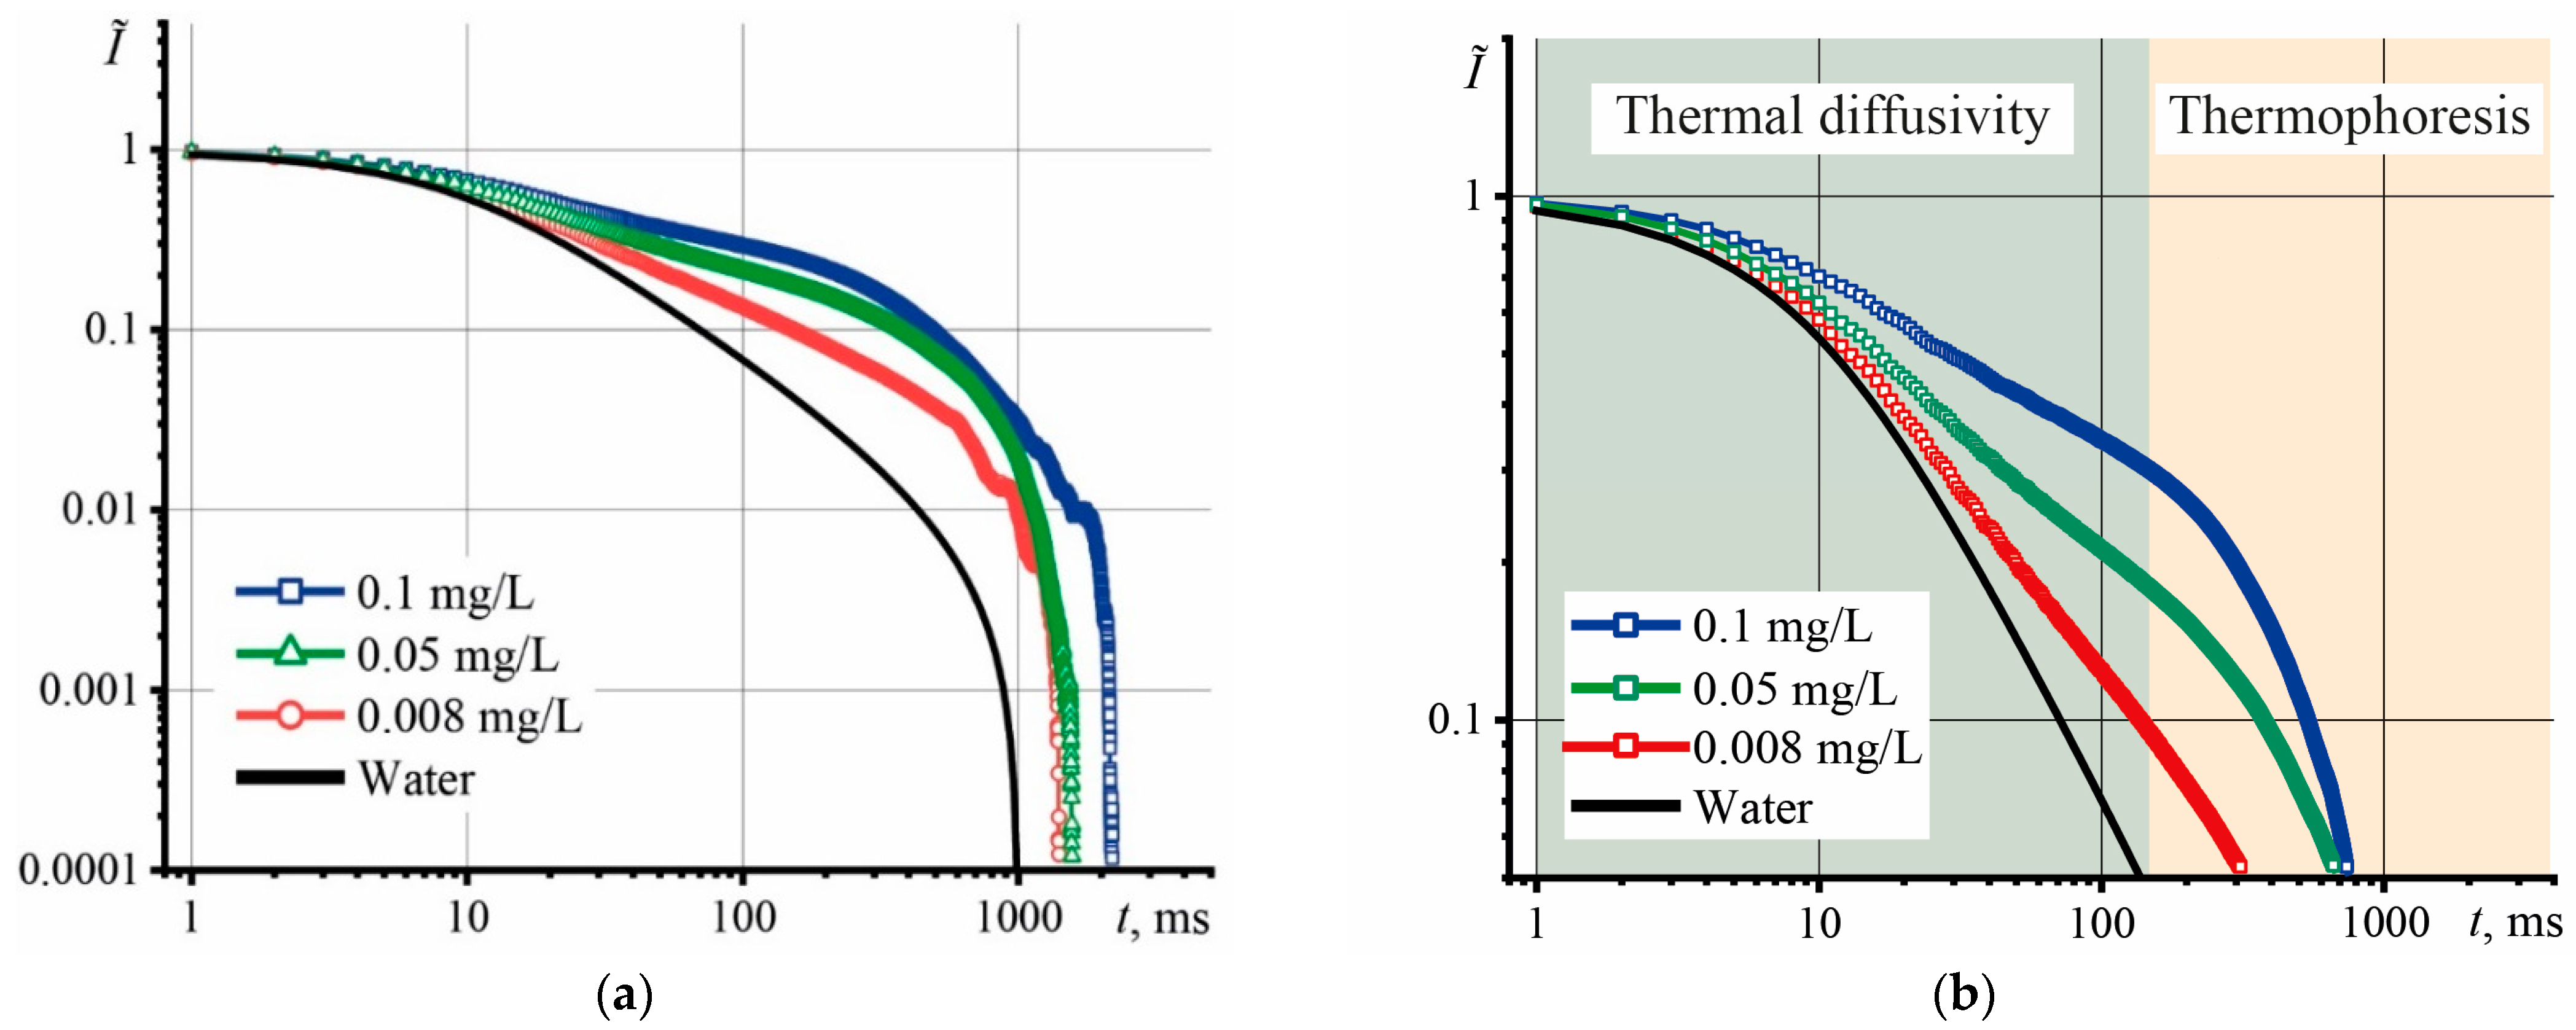
The size and concentration of the nanophase are the key parameters that affect the thermal properties of heat-conducting nanofluids [56]. The logarithmic coordinates of transient curves make it possible to identify thermal effects (in addition to thermal lens) that occur in disperse systems, as recommended in [57]. Figure 2a shows the transient heating curves, using the example of the largest fraction of GO for several concentrations.
The shape of the transient curves demonstrates the presence of thermophoresis, which increases its influence with increasing concentration. An increase in the characteristic time occurs before the onset of thermophoresis, which appears after 150–200 ms and does not affect the determination of D (Figure 2b). The section up to 150 ms is responsible for thermal diffusivity and is used to determine D with a minimum systematic error. The behavior of the transient curves of GO dispersions (Figure 2a) indicates slow heating and a longer time to reach the steady state. As the concentration increases to 0.1 mg/L, the time to reach the steady state increases, which indicates a longer time to reach thermal equilibrium. Hence, it can be assumed that GO dispersions exhibit good thermal insulation properties at a concentration level of 0.1 mg/L.
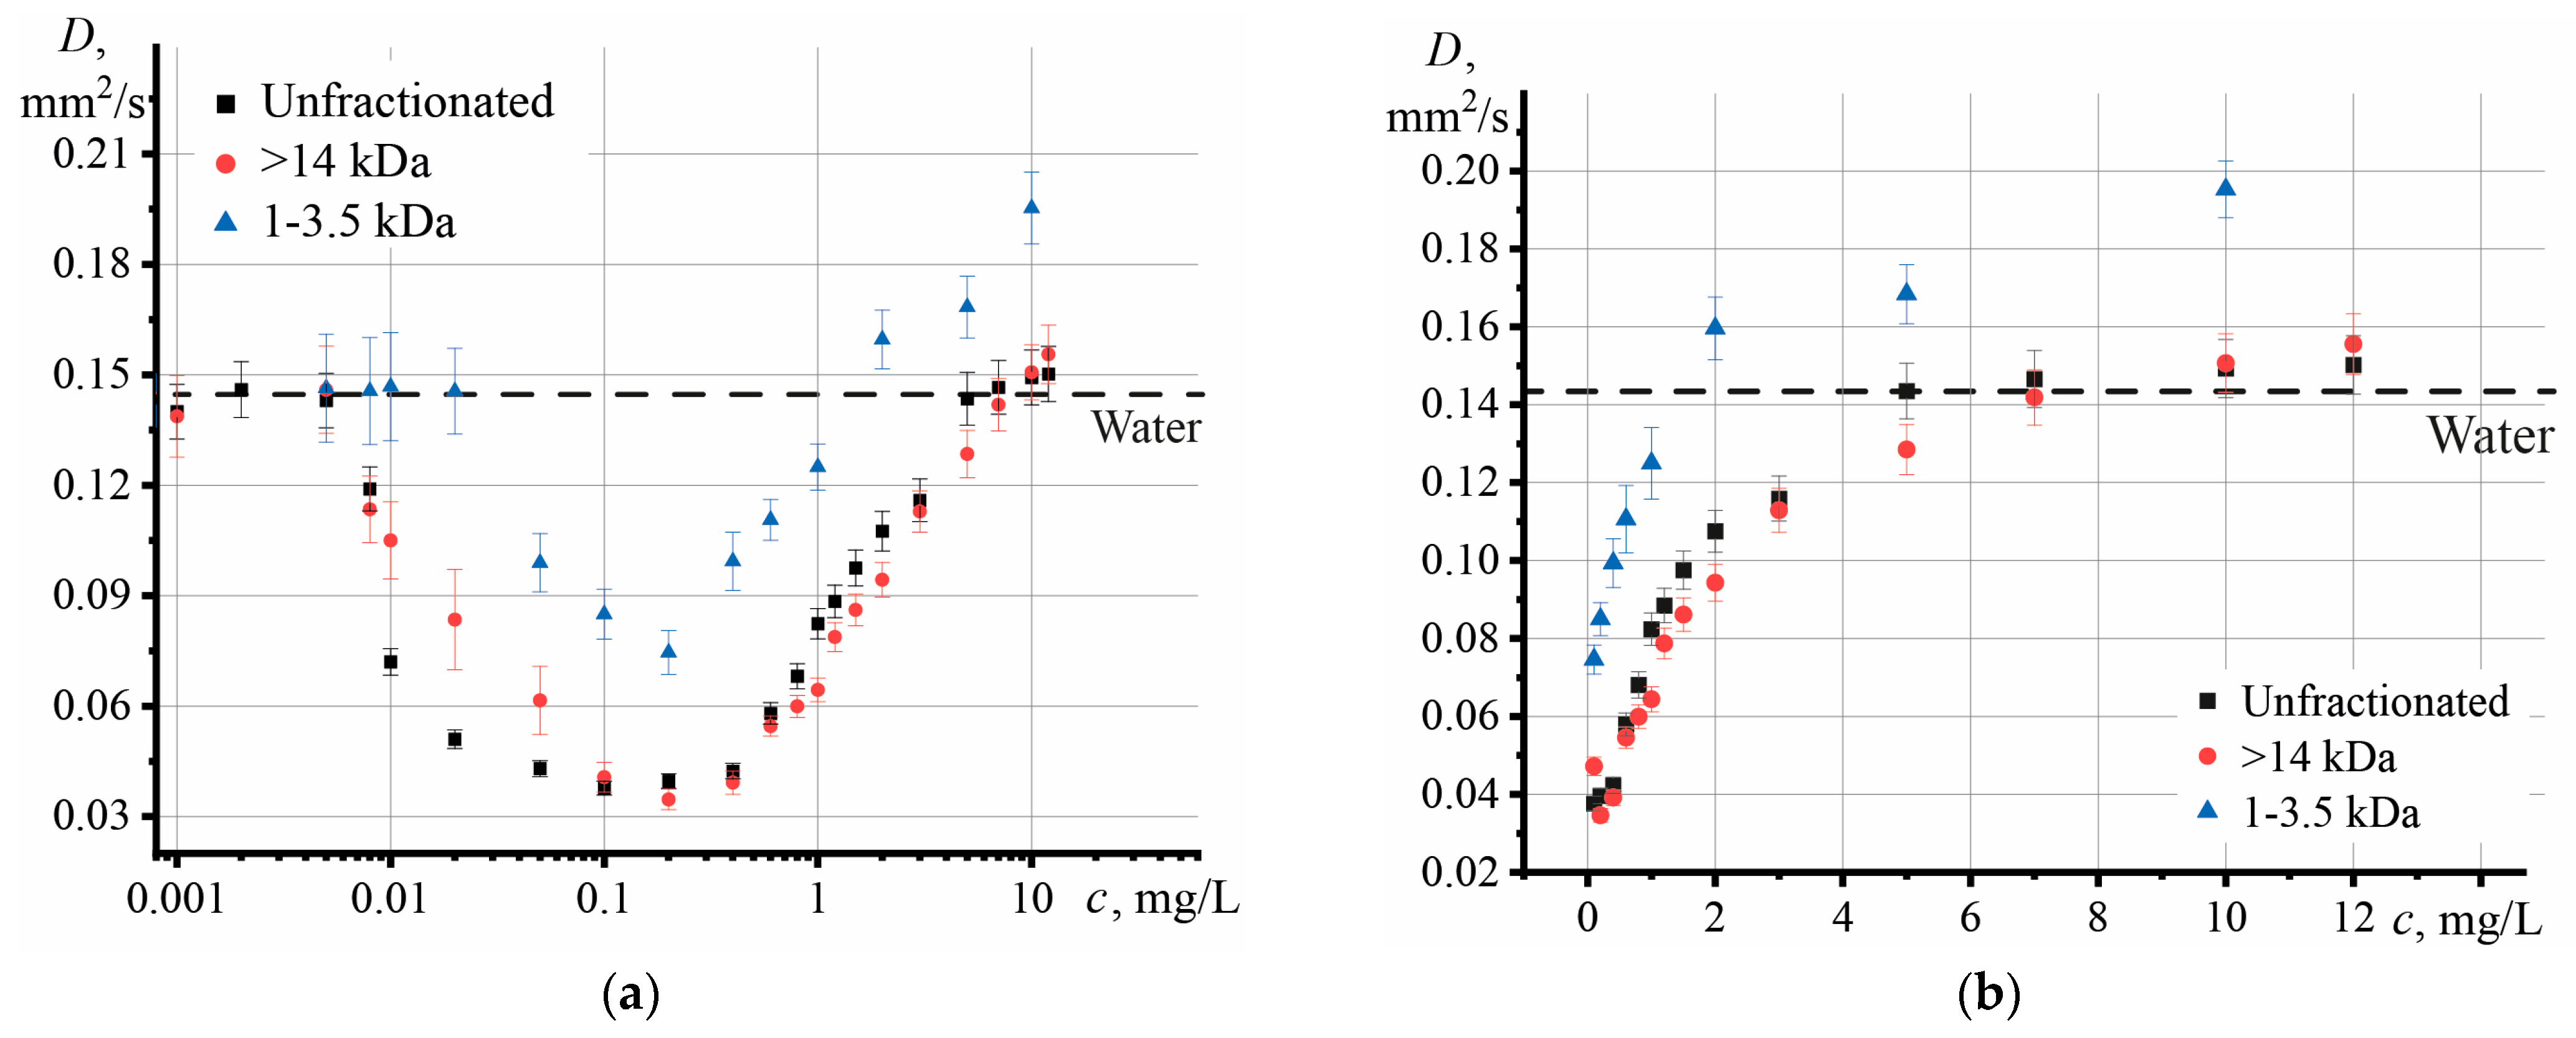
The found thermal diffusivity (using Equations (2), (3) and (S5)) showed (Figure 3a) that all GO fractions demonstrated similar behavior with increasing concentration. As the concentration of the nanophase in the dispersion increased to 0.1 mg/L, the thermal diffusivity decreased. The lowest value was observed at 0.1 mg/L. A further increase in the graphene oxide concentration led to an increase in thermal diffusivity. After 2–3 mg/L, all samples demonstrated a decrease in the rate of increase in D and reached a constant value (Figure 3b).
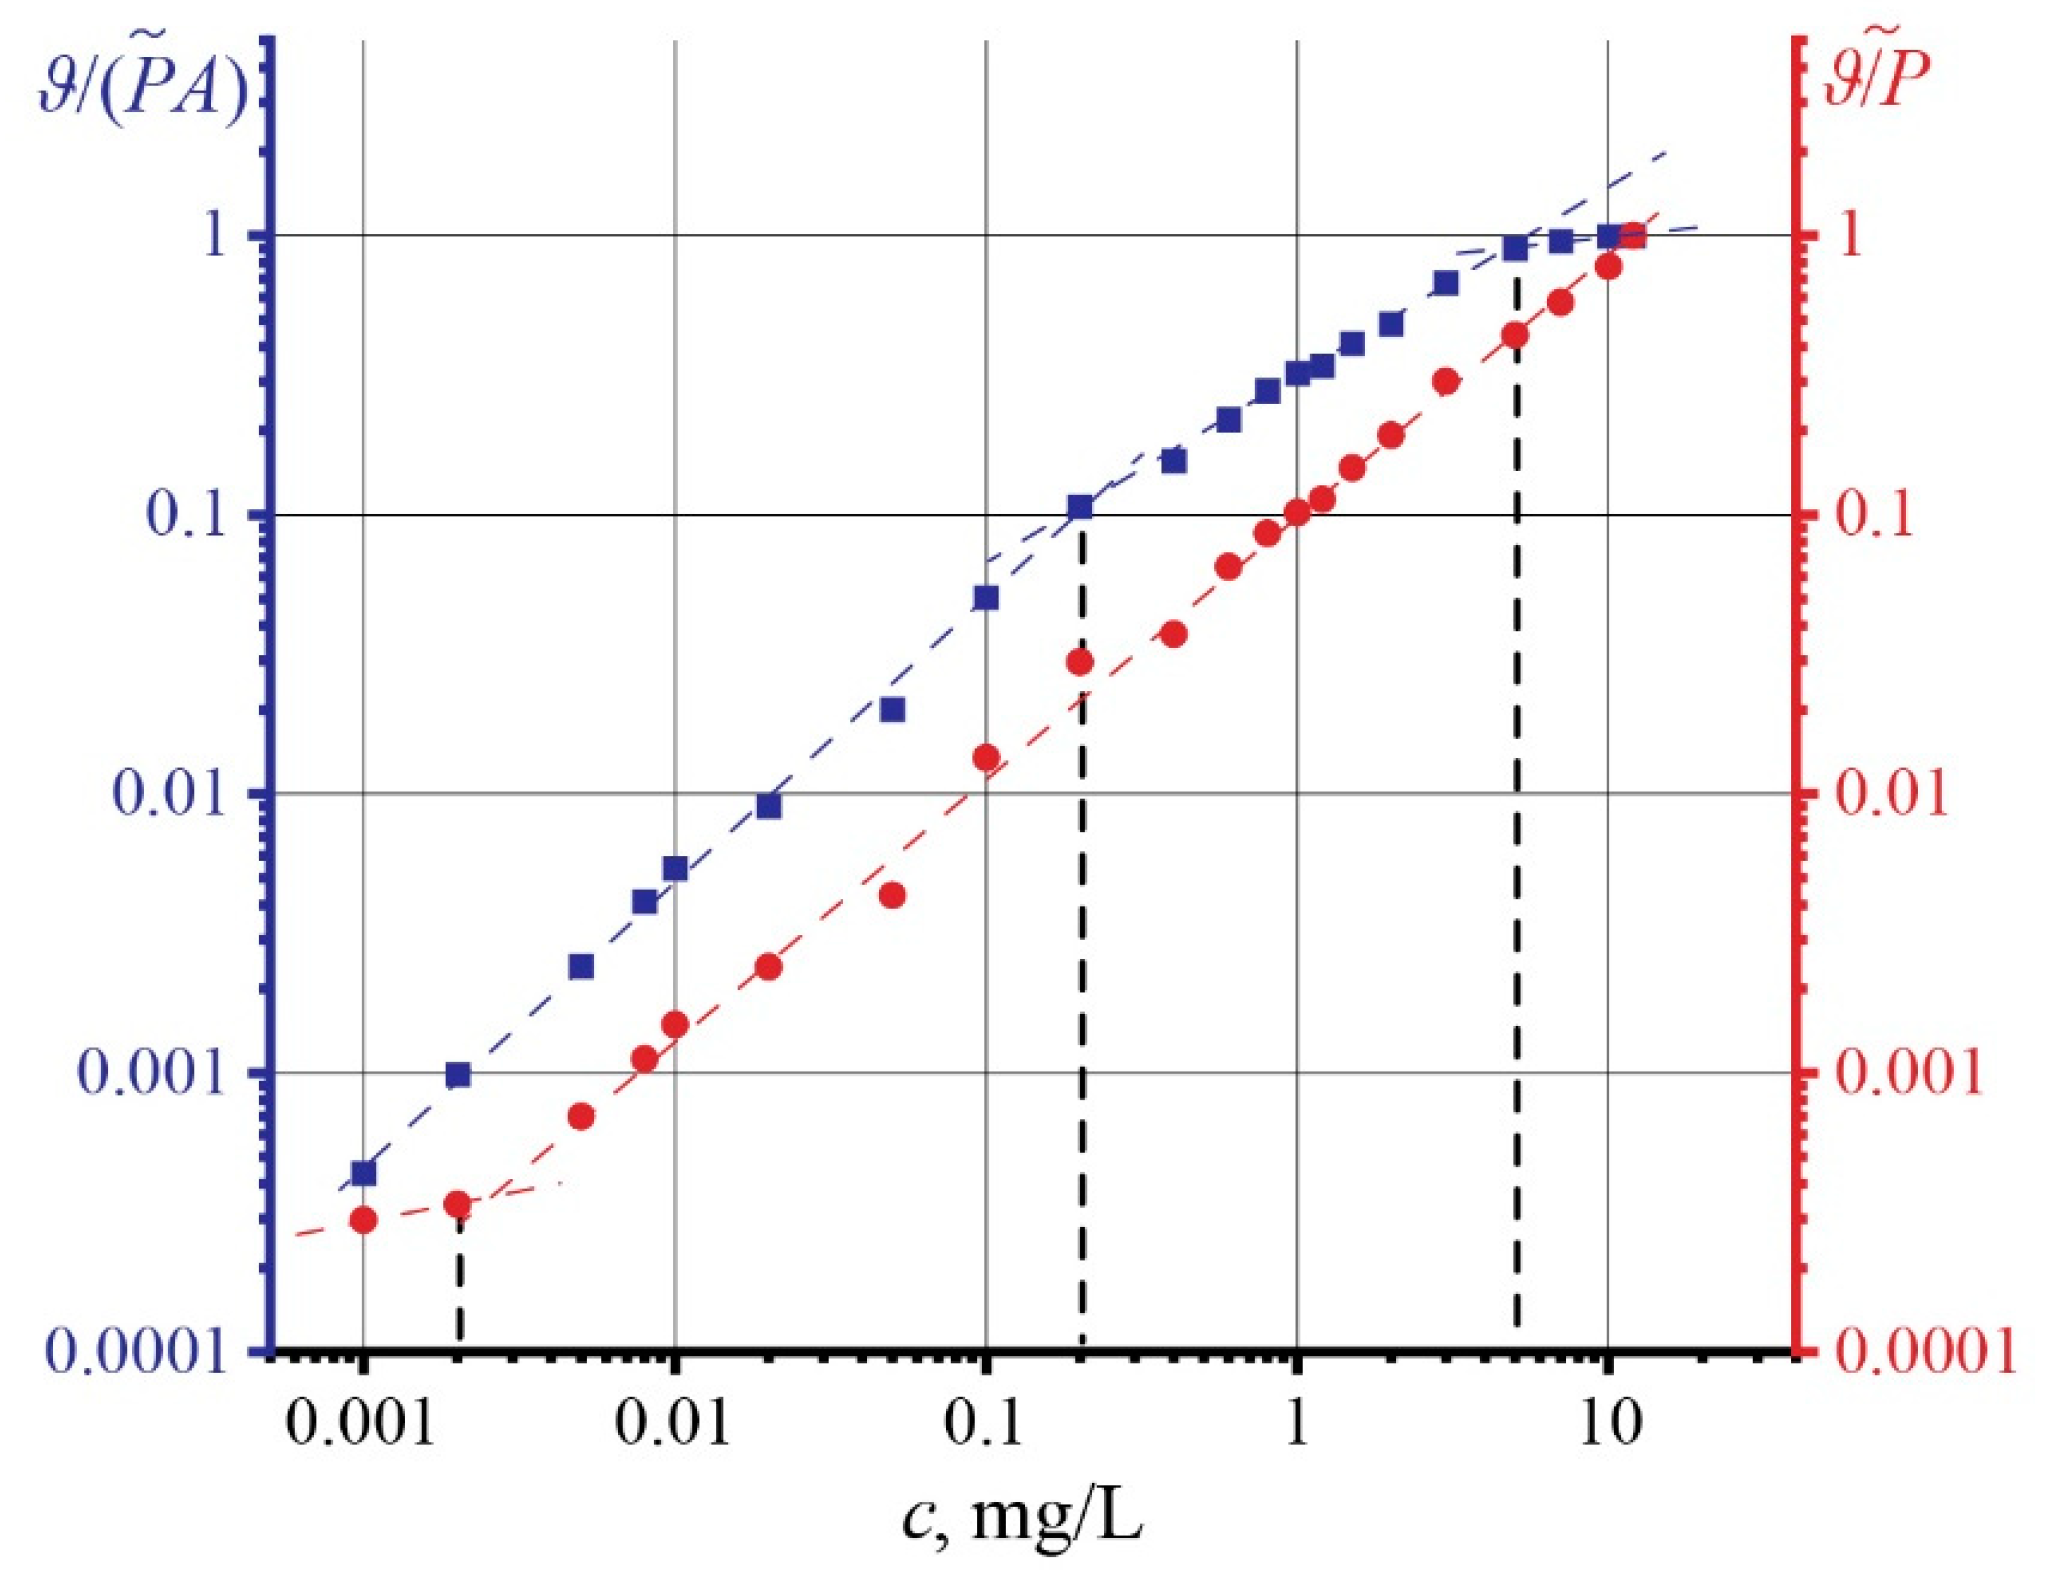
Figure 4 shows the dependences of the concentration of unfractionated GO on the thermal lens signal (found by Equation (5)) in two forms: red is the ratio of the thermal lens signal to the power of the excitation laser ϑ/P, and blue is the ratio of the thermal lens signal to the power and absorbance of the samples ϑ/(PA). It was found that the ϑ/P signal curve changes the nature of its dependence with increasing concentration at c > 0.005 mg/L, where a linear increase for ϑ/(PA) is observed. On the other hand, three regions can be distinguished for the thermal lens signal ϑ/(PA) with increasing concentration. The first change in linearity is observed at a concentration of 0.2 mg/L. At c > 7 mg/L, the second change in the dynamics of the signal occurs, where the signal reaches a constant value, repeating the dynamics of thermal diffusivity.
Figure 5 shows the dependences of the absorbance of the GO samples on the concentration, where the red rectangle corresponds to the area of the significant influence of the systematic error and is outside the performance limits of the Shen–Snook model.
The influence of graphene oxide size on thermal diffusivity showed that, compared to pure water, samples of different fractions demonstrate a decrease in thermal diffusivity (Figure 6).
The largest particles make the most considerable contribution to the decrease in thermal diffusivity, and the smallest value of D is observed for the GO fraction of >14 kDa. The 0.5–1 kDa fraction showed the highest thermal diffusivity of 0.139 mm2/s, which is close to the value of pure water. The relative standard deviation sr for all samples did not exceed 5%, and in the case of the initial GO, it was 2.1%.

3.3. Influence of an Excitation Laser on the Physicochemical and Thermal Properties of GO

Continuous measurement of the thermal lens signal and thermal diffusivity makes it possible to use TLS to analyze long-term processes and to register the dynamics of physicochemical and photochemical reactions occurring in the system [73,74]. For disperse systems, a change in thermal diffusivity may indicate aggregation/agglomeration or, on the contrary, decay and destruction. In this regard, the long-term behavior of GO under the action of radiation is of interest. We used thermal diffusivity and the thermal lens signal as analytical signals. The analysis was carried out for more than four days. The largest fraction of graphene oxide (>14 kDa) with a concentration of 0.1 mg/L was used. In this case, averaging was carried out over 600 transition curves (1 h of measurements).
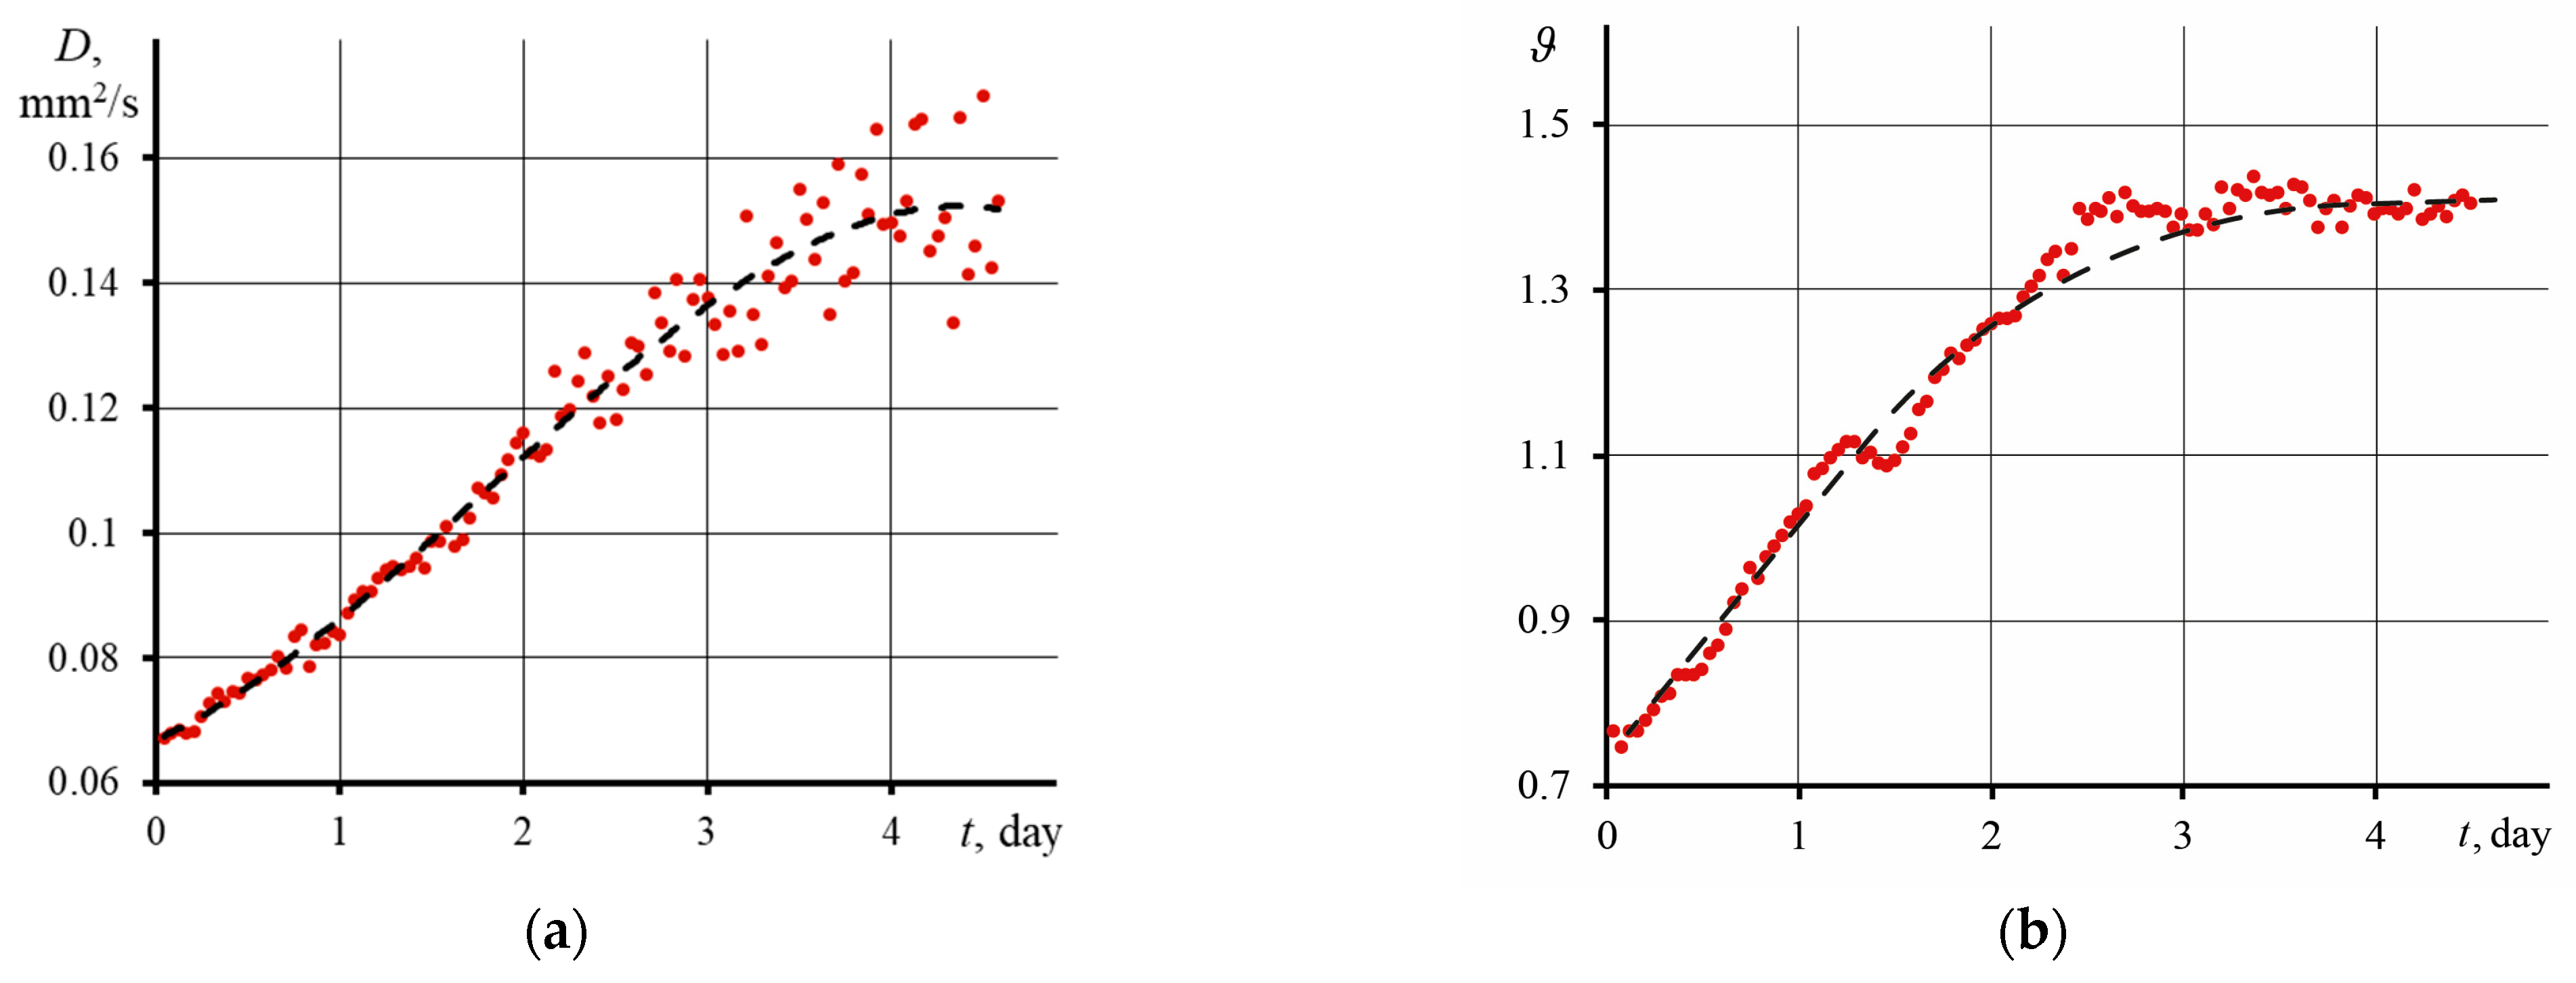
Figure 7 shows graphs of thermal diffusivity (a) and thermal-lens signal (b) versus time. The thermal diffusivity of dispersions (found by Equation (S5)) increases with irradiation time. During the first three days, a linear increase in thermal diffusivity was observed, after which the trend changed, and thermal diffusivity reached a constant value.
Similar dynamics were observed for the thermal lens signal (found using Equation (5)), where after three days of measurements, ϑ reached a constant. For thermal diffusivity, after three days, an increase in the spread of D relative to the average was observed (dashed line), which was not observed for the thermal lens signal. This indicates that the observed fluctuations result from physicochemical processes in the system that affect the development and shape of transient curves.
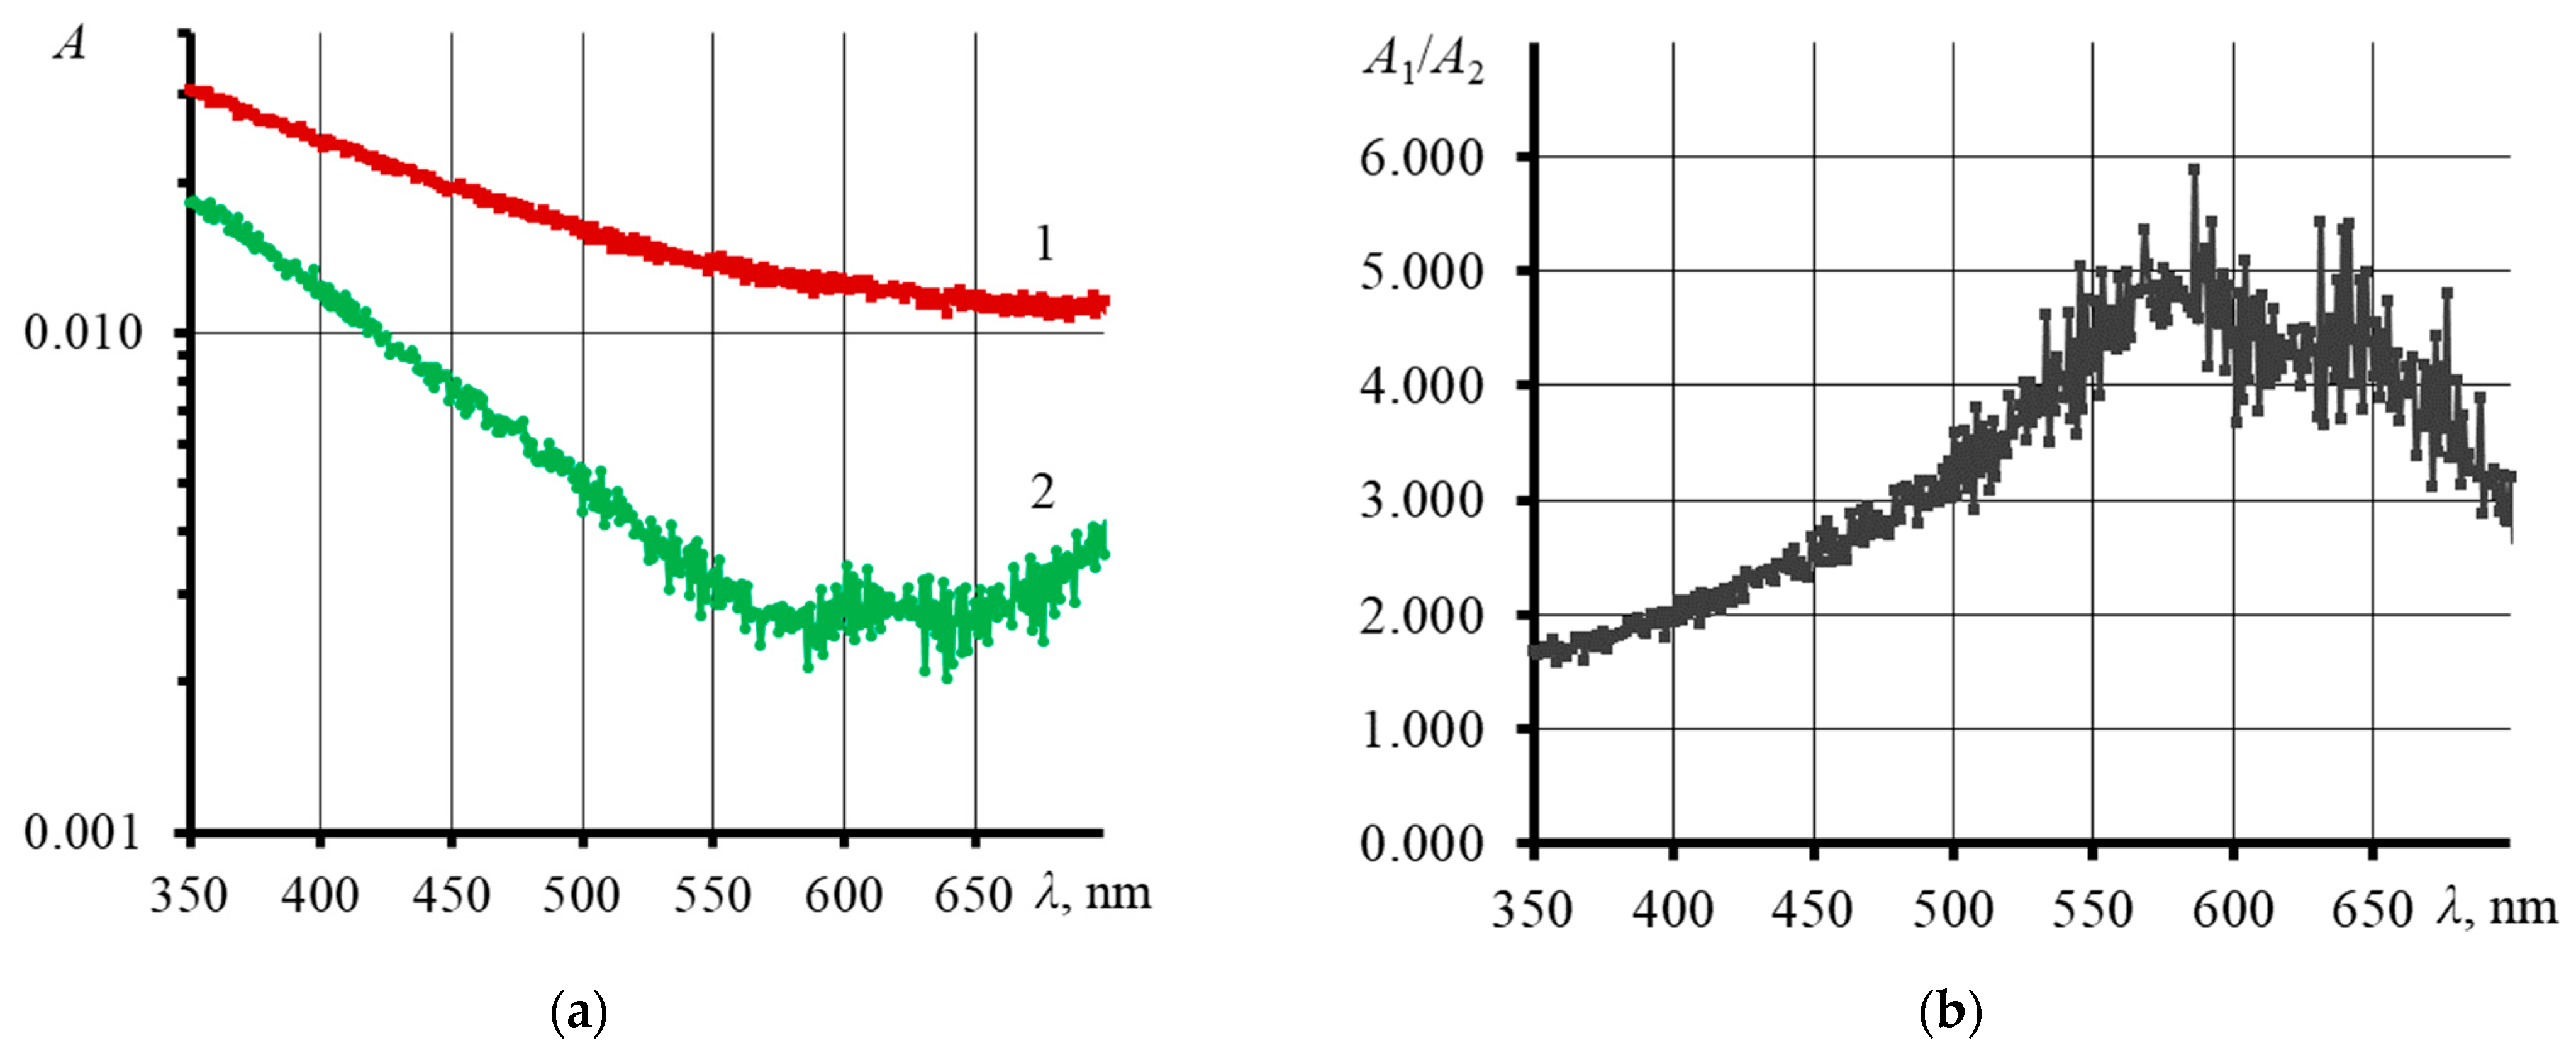
After a long-term thermal-lens experiment, an increase in absorbance was observed (Figure 8a,b) and a change in the GO UV spectra. This indicates changes in the chemical structure of GO and an increase in the number of particles in the system.
Below are the IR spectra of graphene oxide samples before and after prolonged irradiation.
The overall ATR-FTIR spectrum of graphene oxide samples before and after laser treatment and sedimented graphene oxide samples is given in Figure 9a. The broad absorption band in the region of 3600–2400 cm−1 includes the absorption band of water [75], νO–H fragments (3350 cm−1), and νC–H (–CH at 2925 cm−1, –CH2– at 2850 cm−1). Overlapping bands of oxygen groups in the fingerprint region (Figure 9b), which refer to νC=O (1728 and 1620 cm−1) in ketone and acidic forms, aromatic νC=C (1592 cm−1), βO–H (C–OH 1380 cm−1), νC–O–C (1225 cm−1), and νC–O (1080 cm−1), are also observed [76]. In the fingerprint region, one can observe that the laser treatment of aqueous dispersions of graphene oxide increased the intensity of the νC=C band (1592 cm−1) and decreased the intensity of the νC=O (1728 and 1620 cm−1), and νC–O (1080 and 980 cm−1) bands, which may indicate the formation of reduced –OH moieties [77]. It should be noted that the intensity of the νC–O–C band (1225 cm−1) did not change relative to the others, which indicates the preservation of the graphene oxide plane (likely fewer defects).

4. Discussion

4.1. Effect of Graphene Oxide Concentration and Size on the Thermophysical Properties of Aqueous Dispersions

To explain the results of the concentration and size dependences of thermal diffusivity obtained in this work, it is necessary to consider the effects and physical principles that affect heat transfer in dispersed systems.
According to the well-known relation D = k/ρCp, thermal diffusivity is proportional to thermal conductivity and inversely proportional to density and heat capacity. An increase in the content of a nanophase in a nanofluid, as a rule, leads to an increase in density and thermal conductivity as well as a decrease in the heat capacity of the system [78]. Zhou et al. [79] demonstrated that for nanofluids in low concentrations, in a narrow range of concentrations, the volumetric heat capacity (product ρCp) is a constant. In this work, GO dispersion densities and specific heats were not measured, so it cannot be approved that ρCp is a constant. However, the literature analysis allows us to draw the following conclusions. To obtain nanofluids, as a rule, concentrations above ca. 0.1 vol.% are used, where noticeable changes in heat capacity, density, and viscosity are observed [78,80,81]. In such a case, dispersions with nanophase concentrations of <1 × 10⁻⁴ vol.% are used. This makes it possible to neglect a change in heat capacity and density in GO dispersions and assume that ρCp = const.
Following further considerations, the thermal diffusivity of a dispersion largely depends on thermal conductivity and, as shown below, often repeats its behavior. The mechanism of thermal conductivity of nanofluids and an aqueous dispersion of graphene oxide is complex and multifactor [56]. To explain the results obtained, it is necessary to briefly consider the main mechanisms of thermal conductivity in GO dispersions, which are currently distinguished in the literature. Being a solid material, graphene oxide shows the main mechanism of the thermal conductivity of lattice vibrations (phonons) and the movement of free electrons [82,83]. The scattering of primary energy carriers at the boundary is called phonon scattering. As the size of the material decreases, the surface area and the interfacial boundary increase significantly. This leads to an increase in phonon scattering and heat transfer efficiency. However, as the size of the material decreases below 35 nm (phonon mean free path), the intrinsic thermal diffusivity of NPs decreases, and the efficiency of heat transfer decreases [81].
For liquids (particularly water), thermal conductivity is mainly due to Brownian motion (molecular diffusion). Hence, the thermal diffusivity of the GO nanofluid depends on the phonon-transport properties, the motion of free electrons, and the Brownian motion [27]. For nanofluids, several additional factors are distinguished, among which are: thermophoresis, thermal conductivity at the nanophase-liquid interface, where the surface area of the nanophase affects, and alignment of the transverse temperature gradient in the liquid due to nanoparticles [29,84].
An analysis of the existing data has shown that, in many cases, the presence of carbon nanomaterials in large quantities (mg/mL level) increases the thermal conductivity of the dispersion [28,84,85,86]. As previously shown [27,78,87,88,89,90], an increase in the GO concentration leads to an increase in k of the dispersion, which is the main reason for the increase in thermal diffusivity.
Rarely increasing the nanophase concentration leads to a decrease in thermal diffusivity. Here, it is difficult to identify the main cause common to all. In each case, it has its own. Thus, in the case of the toluene–InP system, the decrease in thermal diffusivity is due to low D of InP nanocrystals themselves [22]. The authors pointed out that clustering and aggregation, on the contrary, contributed to an increase in phonon transport properties and an increase in D [22]. In [26,91], the reason for a decrease in thermal diffusivity, as noted by the authors, is the enhancement of the phonon-phonon interaction in the medium. In another study [92], the decrease in thermal diffusivity at low concentrations was explained by the influence of osmophoretic motion, and the increase in thermal diffusivity, which was observed in the range of high concentrations, was explained by Brownian motion, which began to play a major role. Attention is also drawn to the fact that high concentrations lead to radiation scattering, which distorts the value of D [92].
The dependences presented in Figure 3 reflect the effect of the mass concentration of GO on thermal diffusivity. On the other hand, the fractions have different molecular weights of GO, and it is necessary to use a correction for the number of particles in each sample.
Using these recommendations, several conclusions can be drawn:
(1)
The largest particles contribute the most to the decrease in thermal diffusivity;
(2)
The contribution of particles with different molar masses to the increase in thermal diffusivity, which was observed at c > 0.1 mg/L, is comparable with each other.
At the same time, the first position is also confirmed by the results presented in Figure 6. An increase in particle size leads to a decrease in Brownian motion, which worsens thermal diffusivity [21]. Significant Brownian motion is observed for smaller particles, leading to slight thermal diffusion [56]. This was observed previously for quantum dots [21] and some nanoparticles [66]. In [93], for nickel-oxide nanoparticles coated with PVP, a slight increase in size (from 6.9 to 8.9 nm) led to a significant decrease in D (by three times). The same dynamics are demonstrated by the thermal conductivity of dispersion, which, as a rule, decreases with an increase in the nanophase size [78]. For graphene, it was found [25] that single-layer graphene has the highest thermal conductivity, and with an increase in the number of atomic layers, thermal conductivity approaches the value for bulk graphite.
However, it is necessary to make a small digression and note that an increase in the size of a nanophase in a dispersion, as a rule, leads to an increase in the thermal conductivity of a nanofluid. This behavior is typical for metal nanoparticles [15,18,19,57,94,95,96], where the largest particles make the greatest contribution to the thermal diffusivity of the system. This can be caused by clustering effects at high concentrations, which contribute to an increase in thermal conductivity [56].
The change in the dynamics of thermal diffusivity, which was observed at c > 0.1 mg/L (Figure 3b), may indicate a difference in the heat transfer mechanism. With increasing concentration, the thermal conductivity of the particles begins to play a significant role, which significantly enhances its effect due to the possible agglomeration of GO [56]. At the same time, we do not consider the extreme case, when a high concentration leads to precipitation and a decrease in k. The behavior of the thermal-lens signal ϑ/(PA) also exhibits a change in dynamics at a ca. 0.2 mg/L concentration. Signal normalization to both power and absorbance makes obtaining the contribution of only thermophysical properties possible. The thermal lens signal ϑ/(PA) repeats the behavior of the dependence of thermal diffusivity on concentration. This makes ϑ/(PA) an additional analytical indicator of thermal processes in the system.
Of interest are the results of measurements of high concentrations of GO. Here, a change in the increase in thermal diffusivity rate was found for c > 5 mg/L. Thus, two questions arise: Is the found value of thermal diffusivity true, and the change in the linear growth of D vs. c dependence at high concentrations a consequence of the thermal effects of the system (for example, clustering and a decrease in Brownian motion)? Or is the found thermal diffusivity incorrect, and do the observed changes in growth rate D increase the systematic error? Thus, the question of the correctness of determining D for strongly absorbing systems is a key one and will be considered in detail below.

4.2. Influence of High Optical Absorption on the Reliability of Finding the Thermal Diffusivity

Despite the high sensitivity of TLS to detecting changes in the composition of the medium and the precision of the obtained values of thermal diffusivity, the question of the reliability of D measurements requires special attention. Previously, questions of the quantitative influence of systematic errors on determining the thermal diffusivity of pure solvents were considered [68]. The questions of the correctness of D measurements for dispersed systems were also assessed using an example of weakly absorbing SiO2 nanoparticles [57]. Here, the questions of the correctness of measuring the thermal diffusivity for dispersions with high optical absorption are considered using an example of dispersions with the largest fraction and unfractionated graphene oxide.
The change in the dynamics of the concentration dependence of thermal diffusivity at c >5 mg/L can have two causes: thermophysical and instrumental. The first reason may be the deterioration of the Brownian motion of graphene oxide particles at high GO concentrations. Previously [16], it was found that with increasing concentration, the thermal diffusivity reaches a maximum and then decreases, which the authors attributed to the deterioration of Brownian motion due to a high concentration of the nanophase. Additionally, an increase in the GO concentration leads to particle agglomeration, which also reduces the efficiency of thermal diffusivity due to a decrease in the Brownian motion [56].
The second reason may be related to the limitation caused by the high absorbance of the sample [97]. As noted in [98], an increase in the absorbance leads to an increase in the apparent thermal diffusivity. Similar dynamics have been observed previously [68]. It was shown that in TLS, it is necessary to use colored solutions with an absorbance no higher than 0.05. Absorbances above this value contribute to an increase in systematic error, manifested as an increase in the found thermal diffusivity. In our case, the absorbance for the unfractionated and largest GO concentration above 3 mg/L (Figure 5, red zone) is higher than the threshold value, which may adversely affect the reliability of finding D.
To confirm the second reason, let us consider the dynamics of the thermal lens signal changes. Figure 4 shows the effect of the concentration of unfractionated GO on the thermal-lens signal in two forms. The sample selection is associated with a low random error (using Equation (S7)) in determining the thermal diffusivity. It can be seen from the results that after 0.005 mg/L, the normalized thermal-lens signal ϑ/P changes. At the same time, the signal ϑ/PA in the same region demonstrates a linear increase with increasing concentration. At high concentrations, the shape of the thermal lens signal ϑ/P is disadvantaged. ϑ/P retains its linear dependence up to the limiting power level of the spectrometer and the highest absorbance while going beyond the model applicability.
Here, it is necessary to use the thermal lens signal ϑ/AP, which allows for considering absorbance. As can be seen from Figure 4, in the region of c >7 mg/L, there is a change in the dependence and reaching a constant, repeating the dynamics of thermal diffusivity. With a reliable measurement of the absorbance and power of the excitation beam, the observed changes in the thermal lens signal ϑ/AP are caused by the limitations of the TLS.
Thus, it can be concluded that the thermal diffusivity for a GO sample with a concentration above 7 mg/L has a high systematic error caused by the optical limitations of the Shen–Snook thermal-lens model. As a recommendation in the analysis of highly absorbing disperse systems by TLS, it is proposed to use a normalized thermal-lens signal concerning power and absorbance as a criterion of correctness. This will make it possible to reveal the limits of applicability of the method in analyzing heterogeneous systems and reduce the systematic error.
As for the dynamics of the D vs. c dependence for the smallest fraction of GO, in this case, absorbance over the entire range of concentrations is within the acceptable absorbance limits. In this case, as mentioned above, the assessment of the effect of GO on thermal diffusivity, corrected for the number of particles, is approximately the same. A decrease in the rate of change in thermal diffusivity here may be caused by the deterioration of the Brownian motion due to a high concentration of particles, which leads to a deterioration in heat transfer.

4.3. Influence of Laser Radiation on Physicochemical and Thermal Properties of Graphene Oxide Dispersion

After prolonged irradiation, a black precipitate was found at the bottom of the cell. Provided that the dispersion of graphene oxide is stable for several months, the precipitate formed indicates changes in the physicochemical nature of graphene oxide. The behavior of the thermal diffusivity, thermal lens signal, UV (Figure 8a,b), and IR spectra (Figure 9a,b) of GO may indicate the destructive effect of laser radiation and the decomposition of GO into separate layers. After two days of irradiation, as seen in Figure 7a, the spread in thermal diffusivity increases from the average (Figure 7a, dotted line). In such long-term experiments, fluctuations and convection effects appear, which have a longer period. The relative standard deviation (Equation (S7)) for the initial thermal diffusivity values was less than 0.3%, and by the end of the analysis, RSD increased by an order of magnitude and amounted to more than 3%. This low random error eliminates random fluctuations and noise affecting the measurement result. In other words, the observed increasing amplitude of thermal diffusivity is a consequence of ongoing changes in the GO dispersion under the action of laser irradiation. A possible explanation for this could be the following. Over time, in the irradiation zone of the excitation beam, products of decomposition and degradation of GO accumulate, which contribute to the value of D. At the same time, it is still difficult to guess which chemical process prevails. Thermophoresis begins to appear, periodically renewing the irradiation zone, and transferring the products of GO transformations outside this zone. Hence, a large spread in thermal diffusivity is observed: the largest D refers to the effects of chemical degradation and decomposition of GO, and the smallest D to graphene oxide, where the changes occurred to a lesser extent.
In confirmation of these assumptions, several works in the literature are committed to GO chemical transformations under laser radiation and oxidants. As noted in [99], for 2D materials, the mutual arrangement of layers is of great importance. Material properties can vary greatly depending on the layered packing. At the same time, in the coating itself, there may be no changes at all (in chemical bonds, functional groups, etc.). Many 2D materials show eliminating oxygen-containing groups under laser or thermal action [99].
The method of GO recovery is based on the use of lasers (usually with UV radiation) [100]. As noted in [101,102,103], UV radiation decreases the size and changes the structure of graphene oxide by removing functional oxygen groups. The decrease in the intensity of the bands of oxygen-containing groups in our case (Figure 9b) confirms the occurrence of a photochemical reduction reaction. It was also shown in [104] that UV radiation (λ = 266 nm) effectively reduces the oxygen content in GO, reducing it, while IR radiation (λ = 1064 nm) more effectively promotes transformation into a typical sp2-carbon structure of graphene. Of interest is the study in [105], where it was found that GO, under the action of irradiation with a wavelength of 440 nm and in the presence of FeCl3 and H2O2, underwent significant oxidation and decomposition: the number of layers decreased by more than an order of magnitude.
In the review in [34], it was said that with an increase in the number of layers, the thermal conductivity decreases, approaching the graphite value, and even drops lower at n ≈ 8. The degree of oxidation can also significantly affect the thermal characteristics of graphene oxide [106]. A low degree of oxidation improves the phonon transport properties of GO [106]. Oxygen functional groups, on the contrary, reduce the efficiency of phonon transfer in GO and adversely affect the thermal characteristics. The calculated thermal conductivity of graphene oxide at room temperature is about 72 W/(m·K) at an oxidation state of 0.35 and ca. 670 W/(m·K) at an oxidation state of 0.05 [106].
Thus, taking into account the previous fact that a decrease in oxygen groups contributes to an increase in thermal conductivity [106,107] as well as the literature data described above, we can conclude that two processes occur in this system under the action of radiation: GO decay and its (photo)reduction.

5. Conclusions

In this study, thermal lens spectrometry was used to consider the thermophysical properties of the aqueous dispersion of graphene oxide in a wide range of concentrations and sizes. It was found that the largest fraction of graphene oxide has the greatest effect on thermal diffusivity. All considered fractions demonstrate a significant decrease in thermal diffusivity with an increase in the amount of nanophase, reaching a minimum of thermal diffusivity at concentrations of ca. 0.1 mg/L. A further increase in the graphene oxide concentration increases the dispersion thermal diffusivity. Thus, graphene oxide is a promising candidate as a filler in heat-conducting nanofluids for heat-insulating purposes. Prolonged exposure of the dispersion to laser radiation leads to the decay and reduction of graphene oxide, increasing the thermal diffusivity of the dispersion. In this paper, questions regarding the correctness of measuring the thermal diffusivity of heterogeneous systems with high optical absorption were considered. The proposed approaches, analysis methodology, and processing of thermal lens spectrometry results make it possible to reveal the limitations regarding the applicability of the method and avoid a high systematic error in the analysis of the thermal diffusivity of heterogeneous systems with high optical absorption.

Supplementary Materials

The following supporting information can be downloaded at: https://www.mdpi.com/article/10.3390/nano13142126/s1, Figure S1: Schematic of the thermal lens setup; Table S1. Thermal-lens measurement parameters; Figure S2: SEM images of graphene oxide with different scales: (a–d) unfractionated, non-purified sample, (e–h) purified and separated fraction with a mass higher than 14 kDa, and (i–l) purified fraction with a mass between 0.5 and 14 kDa. References [97,108,109,110] are cited in the Supplementary Materials.

Author Contributions

Conceptualization, M.A.P.; methodology, M.A.P.; software, M.A.P.; validation, V.R.K.; formal analysis, V.R.K.; investigation, V.R.K., D.N.S. and D.-M.V.R.; resources, I.V.M.; data curation, V.R.K., D.-M.V.R. and I.V.M.; writing—original draft preparation, D.-M.V.R. and V.R.K.; writing—review and editing, M.A.P. and I.V.M.; visualization, V.R.K., D.-M.V.R., D.N.S. and I.V.M.; supervision, I.V.M. and M.A.P.; project administration, I.V.M. and M.A.P.; funding acquisition, I.V.M. and M.A.P. All authors have read and agreed to the published version of the manuscript.

Funding

The research was funded by the Ministry of Science and Higher Education of the Russian Federation M. V. Lomonosov Moscow State University No. AAAA-A21-121011590089-1 “Development of highly informative and high-tech methods of chemical analysis for the protection of ecosystems, the creation of new materials and advanced production technologies, the transition to environmentally friendly and resource-saving energy, the development of nature-like technologies, high-tech healthcare and rational use of natural resources”.

Data Availability Statement

Not applicable.

Acknowledgments

This research was performed according to the Development program of the Interdisciplinary Scientific and Educational School of Lomonosov Moscow State University «The future of the planet and global environmental change». We are grateful to Sofiya M. Byvsheva (Lomonosov Moscow State University, Chemistry Department) for the graphene oxide fraction preparation.

Conflicts of Interest

The authors declare no conflict of interest.

References

  1. Dinker, A.; Agarwal, M.; Agarwal, G.D. Heat storage materials, geometry and applications: A review. J. Energy Inst. 2017, 90, 1–11. [Google Scholar] [CrossRef]
  2. Sarbu, I.; Sebarchievici, C. A Comprehensive Review of Thermal Energy Storage. Sustainability 2018, 10, 191. [Google Scholar] [CrossRef] [Green Version]
  3. Sarbu, I.; Dorca, A. Review on heat transfer analysis in thermal energy storage using latent heat storage systems and phase change materials. Int. J. Energy Res. 2018, 43, 29–64. [Google Scholar] [CrossRef] [Green Version]
  4. Qiu, L.; Ouyang, Y.; Li, F. Experimental techniques overview. In Micro and Nano Thermal Transport; Qiu, L., Feng, Y., Eds.; Academic Press: Cambridge, MA, USA, 2022; pp. 19–45. [Google Scholar]
  5. Souza, R.R.; Faustino, V.; Gonçalves, I.M.; Moita, A.S.; Bañobre-López, M.; Lima, R. A Review of the Advances and Challenges in Measuring the Thermal Conductivity of Nanofluids. Nanomaterials 2022, 12, 2526. [Google Scholar] [CrossRef]
  6. Elarem, R.; Alqahtani, T.; Mellouli, S.; Askri, F.; Edacherian, A.; Vineet, T.; Badruddin, I.A.; Abdelmajid, J. A comprehensive review of heat transfer intensification methods for latent heat storage units. Energy Storage 2020, 3, e127. [Google Scholar] [CrossRef] [Green Version]
  7. Gupta, M.; Singh, V.; Kumar, R.; Said, Z. A review on thermophysical properties of nanofluids and heat transfer applications. Renew. Sustain. Energy Rev. 2017, 74, 638–670. [Google Scholar] [CrossRef]
  8. Mamat, H.; Ramadan, M. Nanofluids: Thermal Conductivity and Applications. In Encyclopedia of Smart Materials; Olabi, A.-G., Ed.; Elsevier: Oxford, UK, 2022; pp. 288–296. [Google Scholar]
  9. Muneeshwaran, M.; Srinivasan, G.; Muthukumar, P.; Wang, C.-C. Role of hybrid-nanofluid in heat transfer enhancement—A review. Int. Commun. Heat Mass Transf. 2021, 125, 105341. [Google Scholar] [CrossRef]
  10. Moreira, T.A.; Moreira, D.C.; Ribatski, G. Nanofluids for heat transfer applications: A review. J. Braz. Soc. Mech. Sci. Eng. 2018, 40, 303. [Google Scholar] [CrossRef]
  11. Choi, S.U.S.; Eastman, J. Enhancing Thermal Conductivity of Fluids with Nanoparticles. In Proceedings of the ASME International Mechanical Engineering Congress & Exposition, San Francisco, CA, USA, 12–17 November 1995; Volume 66. [Google Scholar]
  12. Zamiri, R.; Azmi, B.Z.; Shahriari, E.; Naghavi, K.; Saion, E.; Rizwan, Z.; Husin, M.S. Thermal diffusivity measurement of silver nanofluid by thermal lens technique. J. Laser Appl. 2011, 23, 042002. [Google Scholar] [CrossRef]
  13. Zamiri, R.; Azmi, B.Z.; Shahril Husin, M.; Zamiri, G.; Ahangar, H.A.; Rizwan, Z. Thermal diffusivity measurement of copper nanofluid using pulsed laser thermal lens technique. J. Eur. Opt. Soc. Rapid Publ. 2012, 7, 12022. [Google Scholar] [CrossRef] [Green Version]
  14. Joseph, S.A.; Hari, M.; Mathew, S.; Sharma, G.; Soumya; Hadiya, V.M.; Radhakrishnan, P.; Nampoori, V.P.N. Thermal diffusivity of rhodamine 6G incorporated in silver nanofluid measured using mode-matched thermal lens technique. Opt. Commun. 2010, 283, 313–317. [Google Scholar] [CrossRef]
  15. Shahriari, E.; Moradi, M.; Raeisi, M. An experimental study of thermal diffusivity of Au nanoparticles: Effects of concentration particle size. J. Theor. Appl. Phys. 2016, 10, 259–263. [Google Scholar] [CrossRef] [Green Version]
  16. Mathew, S.; Francis, F.; Joseph, S.A.; Kala, M.S. Enhanced thermal diffusivity of water based ZnO nanoflower/rGO nanofluid using the dual-beam thermal lens technique. Nano-Struct. Nano-Objects 2021, 28, 100784. [Google Scholar] [CrossRef]
  17. Francis, F.; Anila, E.I.; Joseph, S.A. Dependence of thermal diffusivity on nanoparticle shape deduced through thermal lens technique taking ZnO nanoparticles and nanorods as inclusions in homogeneous dye solution. Optik 2020, 219, 165210. [Google Scholar] [CrossRef]
  18. Lenart, V.M.; Astrath, N.G.C.; Turchiello, R.F.; Goya, G.F.; Gómez, S.L. Thermal diffusivity of ferrofluids as a function of particle size determined using the mode-mismatched dual-beam thermal lens technique. J. Appl. Phys. 2018, 123, 085107. [Google Scholar] [CrossRef] [Green Version]
  19. Ramya, M.; Nideep, T.K.; Nampoori, V.P.N.; Kailasnath, M. Particle size and concentration effect on thermal diffusivity of water-based ZnO nanofluid using the dual-beam thermal lens technique. Appl. Phys. B 2019, 125, 181. [Google Scholar] [CrossRef]
  20. Sebastian, R.; Swapna, M.S.; Raj, V.; Hari, M.; Sankararaman, S. Thermal diffusivity control in titanium dioxide nanofluid through phase tuning. Mater. Res. Express 2018, 5, 075001. [Google Scholar] [CrossRef]
  21. Nideep, T.K.; Ramya, M.; Nampoori, V.P.N.; Kailasnath, M. The size dependent thermal diffusivity of water soluble CdTe quantum dots using dual beam thermal lens spectroscopy. Phys. E Low-Dimens. Syst. Nanostruct. 2020, 116, 113724. [Google Scholar] [CrossRef]
  22. Sánchez Ramírez, J.F.; Arvizu Amador, S.F.; Jiménez Pérez, J.L.; Bautista Hernández, A.; Delgado Macuil, R.J.; Díaz Reyes, J.; Chigo Anota, E. Decreased thermal diffusivity in fluids containing InP nanocrystals. J. Therm. Anal. Calorim. 2015, 120, 1563–1571. [Google Scholar] [CrossRef]
  23. Swapna, M.N.S.; Korte, D.; Sankararaman, S.I. Solid-Volume-Fraction Retained Tailoring of Thermal Diffusivity of Multiwalled Carbon Nanotube Nanofluid: A Photothermal Investigation. Phys. Status Solidi A 2023, 220, 2200797. [Google Scholar] [CrossRef]
  24. Sindhu Swapna, M.N.; Raj, V.; Cabrera, H.; Sankararaman, S.I. Thermal Lensing of Multi-walled Carbon Nanotube Solutions as Heat Transfer Nanofluids. ACS Appl. Nano Mater. 2021, 4, 3416–3425. [Google Scholar] [CrossRef]
  25. Cabrera, H.; Mendoza, D.; Benítez, J.L.; Bautista Flores, C.; Alvarado, S.; Marín, E. Thermal diffusivity of few-layers graphene measured by an all-optical method. J. Phys. D 2015, 48, 465501. [Google Scholar] [CrossRef]
  26. Vijesh, K.R.; Sony, U.; Ramya, M.; Mathew, S.; Nampoori, V.P.N.; Thomas, S. Concentration dependent variation of thermal diffusivity in highly fluorescent carbon dots using dual beam thermal lens technique. Int. J. Therm. Sci. 2018, 126, 137–142. [Google Scholar] [CrossRef]
  27. Jiménez-Pérez, J.L.; López-Gamboa, G.; Sánchez-Ramírez, J.F.; Correa-Pacheco, Z.N.; Netzahual-Lopantzi, A.; Cruz-Orea, A. Thermal Diffusivity Dependence with Highly Concentrated Graphene Oxide/Water Nanofluids by Mode-Mismatched Dual-Beam Thermal Lens Technique. Int. J. Thermophys. 2021, 42, 107. [Google Scholar] [CrossRef]
  28. Swapna, M.S.; Raj, V.; Sankararaman, S. Allotropic transformation instigated thermal diffusivity of soot nanofluid: Thermal lens study. Phys. Fluids 2019, 31, 117106. [Google Scholar] [CrossRef]
  29. Awais, M.; Bhuiyan, A.A.; Salehin, S.; Ehsan, M.M.; Khan, B.; Rahman, M.H. Synthesis, heat transport mechanisms and thermophysical properties of nanofluids: A critical overview. Int. J. Thermofluids 2021, 10, 100086. [Google Scholar] [CrossRef]
  30. Trong Tam, N.; Viet Phuong, N.; Hong Khoi, P.; Ngoc Minh, P.; Afrand, M.; Van Trinh, P.; Hung Thang, B.; Żyła, G.; Estellé, P. Carbon Nanomaterial-Based Nanofluids for Direct Thermal Solar Absorption. Nanomaterials 2020, 10, 1199. [Google Scholar] [CrossRef] [PubMed]
  31. Fritea, L.; Banica, F.; Costea, T.O.; Moldovan, L.; Dobjanschi, L.; Muresan, M.; Cavalu, S. Metal Nanoparticles and Carbon-Based Nanomaterials for Improved Performances of Electrochemical (Bio)Sensors with Biomedical Applications. Materials 2021, 14, 6319. [Google Scholar] [CrossRef]
  32. Varshney, K. Carbon Nanotubes: A Review on Synthesis, Properties and Applications. Int. J. Eng. Res. Gen. Sci. 2014, 2, 660. [Google Scholar]
  33. Liu, W.; Speranza, G. Functionalization of Carbon Nanomaterials for Biomedical Applications. C—J. Carbon Res. 2019, 5, 72. [Google Scholar] [CrossRef] [Green Version]
  34. Balandin, A.A. Thermal properties of graphene and nanostructured carbon materials. Nat. Mater. 2011, 10, 569–581. [Google Scholar] [CrossRef] [Green Version]
  35. Apmann, K.; Fulmer, R.; Soto, A.; Vafaei, S. Thermal Conductivity and Viscosity: Review and Optimization of Effects of Nanoparticles. Materials 2021, 14, 1291. [Google Scholar] [CrossRef]
  36. Ebadi-Dehaghani, H.; Nazempour, M. Thermal Conductivity of Nanoparticles Filled Polymers. In Smart Nanoparticles Technology; Abbass, H., Ed.; IntechOpen: Rijeka, Croatia, 2012; Chapter 23. [Google Scholar]
  37. Idris, A.O.; Akanji, S.P.; Orimolade, B.O.; Olorundare, F.O.; Azizi, S.; Mamba, B.; Maaza, M. Using Nanomaterials as Excellent Immobilisation Layer for Biosensor Design. Biosensors 2023, 13, 192. [Google Scholar] [CrossRef] [PubMed]
  38. Singh, N.; Dkhar, D.S.; Chandra, P.; Azad, U.P. Nanobiosensors Design Using 2D Materials: Implementation in Infectious and Fatal Disease Diagnosis. Biosensors 2023, 13, 166. [Google Scholar] [CrossRef] [PubMed]
  39. Joshi, D.J.; Koduru, J.R.; Malek, N.I.; Hussain, C.M.; Kailasa, S.K. Surface modifications and analytical applications of graphene oxide: A review. TrAC Trends Anal. Chem. 2021, 144, 116448. [Google Scholar] [CrossRef]
  40. Karbalaei Akbari, M.; Siraj Lopa, N.; Shahriari, M.; Najafzadehkhoee, A.; Galusek, D.; Zhuiykov, S. Functional Two-Dimensional Materials for Bioelectronic Neural Interfacing. J. Funct. Biomater. 2023, 14, 35. [Google Scholar] [CrossRef] [PubMed]
  41. Dabrowski, B.; Zuchowska, A.; Brzozka, Z. Graphene oxide internalization into mammalian cells—A review. Colloids Surf. B 2023, 221, 112998. [Google Scholar] [CrossRef] [PubMed]
  42. Itoo, A.M.; Vemula, S.L.; Gupta, M.T.; Giram, M.V.; Kumar, S.A.; Ghosh, B.; Biswas, S. Multifunctional graphene oxide nanoparticles for drug delivery in cancer. J. Control. Release 2022, 350, 26–59. [Google Scholar] [CrossRef]
  43. Deshwal, N.; Singh, M.B.; Bahadur, I.; Kaushik, N.; Kaushik, N.K.; Singh, P.; Kumari, K. A review on recent advancements on removal of harmful metal/metal ions using graphene oxide: Experimental and theoretical approaches. Sci. Total Environ. 2023, 858, 159672. [Google Scholar] [CrossRef]
  44. Singh, S.; Naik, T.S.S.K.; Shehata, N.; Aguilar-Marcelino, L.; Dhokne, K.; Lonare, S.; Chauhan, V.; Kumar, A.; Singh, J.; Ramamurthy, P.C.; et al. Novel insights into graphene oxide-based adsorbents for remediation of hazardous pollutants from aqueous solutions: A comprehensive review. J. Mol. Liq. 2023, 369, 120821. [Google Scholar] [CrossRef]
  45. Joel, E.F.; Lujanienė, G. Progress in Graphene Oxide Hybrids for Environmental Applications. Environments 2022, 9, 153. [Google Scholar] [CrossRef]
  46. Rashi. Exploring the methods of synthesis, functionalization, and characterization of graphene and graphene oxide for supercapacitor applications. Ceram. Int. 2023, 49, 40–47. [Google Scholar] [CrossRef]
  47. Smith, A.T.; LaChance, A.M.; Zeng, S.; Liu, B.; Sun, L. Synthesis, properties, and applications of graphene oxide/reduced graphene oxide and their nanocomposites. Nano Mater. Sci. 2019, 1, 31–47. [Google Scholar] [CrossRef]
  48. Anwar, A.; Liu, X.; Zhang, L. Nano-cementitious composites modified with Graphene Oxide—A review. Thin-Walled Struct. 2023, 183, 110326. [Google Scholar] [CrossRef]
  49. Zhao, W.; Chen, Y.; Liu, Z.; Wang, L.; Li, X. Effects of surface-modified coal-bearing metakaolin and graphene oxide on the properties of cement mortar. Constr. Build. Mater. 2023, 372, 130796. [Google Scholar] [CrossRef]
  50. Jena, G.; Philip, J. A review on recent advances in graphene oxide-based composite coatings for anticorrosion applications. Prog. Org. Coat. 2022, 173, 107208. [Google Scholar] [CrossRef]
  51. Li, F.-F. Comprehensive Review of Recent Research Advances on Flame-Retardant Coatings for Building Materials: Chemical Ingredients, Micromorphology, and Processing Techniques. Molecules 2023, 28, 1842. [Google Scholar] [CrossRef] [PubMed]
  52. Fu, X.; Lin, J.; Liang, Z.; Yao, R.; Wu, W.; Fang, Z.; Zou, W.; Wu, Z.; Ning, H.; Peng, J. Graphene oxide as a promising nanofiller for polymer composite. Surf. Interfaces 2023, 37, 102747. [Google Scholar] [CrossRef]
  53. Ye, M.; Zhang, Z.; Zhao, Y.; Qu, L. Graphene Platforms for Smart Energy Generation and Storage. Joule 2018, 2, 245–268. [Google Scholar] [CrossRef] [Green Version]
  54. Balandin, A.A.; Ghosh, S.; Bao, W.; Calizo, I.; Teweldebrhan, D.; Miao, F.; Lau, C.N. Superior thermal conductivity of single-layer graphene. Nano Lett. 2008, 8, 902–907. [Google Scholar] [CrossRef] [PubMed]
  55. Bobbo, S.; Buonomo, B.; Manca, O.; Vigna, S.; Fedele, L. Analysis of the Parameters Required to Properly Define Nanofluids for Heat Transfer Applications. Fluids 2021, 6, 65. [Google Scholar] [CrossRef]
  56. Das, P.K. A review based on the effect and mechanism of thermal conductivity of normal nanofluids and hybrid nanofluids. J. Mol. Liq. 2017, 240, 420–446. [Google Scholar] [CrossRef]
  57. Khabibullin, V.R.; Usoltseva, L.O.; Mikheev, I.V.; Proskurnin, M.A. Thermal Diffusivity of Aqueous Dispersions of Silicon Oxide Nanoparticles by Dual-Beam Thermal Lens Spectrometry. Nanomaterials 2023, 13, 1006. [Google Scholar] [CrossRef] [PubMed]
  58. Thakur, S.N. Photoacoustic and photothermal spectroscopy. In Photoacoustic and Photothermal Spectroscopy; Thakur, S.N., Rai, V.N., Singh, J.P., Eds.; Elsevier: Amsterdam, The Netherlands, 2023; pp. 1–19. [Google Scholar]
  59. Shimizu, H.; Chen, C.; Tsuyama, Y.; Tsukahara, T.; Kitamori, T. Photothermal spectroscopy and micro/nanofluidics. J. Appl. Phys. 2022, 132, 060902. [Google Scholar] [CrossRef]
  60. Proskurnin, M.A.; Khabibullin, V.R.; Usoltseva, L.O.; Vyrko, E.A.; Mikheev, I.V.; Volkov, D.S. Photothermal and optoacoustic spectroscopy: State of the art and prospects. Phys. Uspekhi 2022, 65, 270–312. [Google Scholar] [CrossRef]
  61. Lopes, C.S.; Lenart, V.M.; Turchiello, R.F.; Gómez, S.L. Determination of the Thermal Diffusivity of Plasmonic Nanofluids Containing PVP-Coated Ag Nanoparticles Using Mode-Mismatched Dual-Beam Thermal Lens Technique. Adv. Condens. Matter Phys. 2018, 2018, 3052793. [Google Scholar] [CrossRef] [Green Version]
  62. Mikheev, I.V.; Usoltseva, L.O.; Ivshukov, D.A.; Volkov, D.S.; Korobov, M.V.; Proskurnin, M.A. Approach to the Assessment of Size-Dependent Thermal Properties of Disperse Solutions: Time-Resolved Photothermal Lensing of Aqueous Pristine Fullerenes C60 and C70. J. Phys. Chem. C 2016, 120, 28270–28287. [Google Scholar] [CrossRef]
  63. Usoltseva, L.O.; Korobov, M.V.; Proskurnin, M.A. Photothermal spectroscopy: A promising tool for nanofluids. J. Appl. Phys. 2020, 128, 190901. [Google Scholar] [CrossRef]
  64. Netzahual-Lopantzi, Á.; Sánchez-Ramírez, J.F.; Jiménez-Pérez, J.L.; Cornejo-Monroy, D.; López-Gamboa, G.; Correa-Pacheco, Z.N. Study of the thermal diffusivity of nanofluids containing SiO2 decorated with Au nanoparticles by thermal lens spectroscopy. Appl. Phys. A 2019, 125, 588. [Google Scholar] [CrossRef]
  65. Gutierrez Fuentes, R.; Pescador Rojas, J.A.; Jiménez-Pérez, J.L.; Sanchez Ramirez, J.F.; Cruz-Orea, A.; Mendoza-Alvarez, J.G. Study of thermal diffusivity of nanofluids with bimetallic nanoparticles with Au(core)/Ag(shell) structure. Appl. Surf. Sci. 2008, 255, 781–783. [Google Scholar] [CrossRef]
  66. Augustine, A.K.; Mathew, S.; Girijavallabhan, C.P.; Radhakrishnan, P.; Nampoori, V.P.N.; Kailasnath, M. Size dependent variation of thermal diffusivity of CdSe nanoparticles based nanofluid using laser induced mode-matched thermal lens technique. J. Opt. 2014, 44, 85–91. [Google Scholar] [CrossRef]
  67. Franko, M.; Tran, C.D. Thermal Lens Spectroscopy. In Encyclopedia of Analytical Chemistry; Meyers, R.A., Ed.; John Wiley & Sons, Ltd.: Hoboken, NJ, USA, 2010. [Google Scholar] [CrossRef]
  68. Khabibullin, V.R.; Franko, M.; Proskurnin, M.A. Accuracy of Measurements of Thermophysical Parameters by Dual-Beam Thermal-Lens Spectrometry. Nanomaterials 2023, 13, 430. [Google Scholar] [CrossRef] [PubMed]
  69. Mikheev, I.V.; Byvsheva, S.M.; Sozarukova, M.M.; Kottsov, S.Y.; Proskurnina, E.V.; Proskurnin, M.A. High-Throughput Preparation of Uncontaminated Graphene-Oxide Aqueous Dispersions with Antioxidant Properties by Semi-Automated Diffusion Dialysis. Nanomaterials 2022, 12, 4159. [Google Scholar] [CrossRef]
  70. Matsumoto, I.; Sekiya, R.; Haino, T. A protocol for size separation of nanographenes. RSC Adv. 2019, 9, 33843–33846. [Google Scholar] [CrossRef]
  71. Bonanni, A.; Ambrosi, A.; Chua, C.K.; Pumera, M. Oxidation Debris in Graphene Oxide Is Responsible for Its Inherent Electroactivity. ACS Nano 2014, 8, 4197–4204. [Google Scholar] [CrossRef] [PubMed]
  72. Dovichi, N.J.; Bialkowski, S.E. Thermo-Optical Spectrophotometries in Analytical Chemistry. Crit. Rev. Anal. Chem. 1987, 17, 357–423. [Google Scholar] [CrossRef]
  73. Constantino, R.; Lenzi, G.G.; Franco, M.G.; Lenzi, E.K.; Bento, A.C.; Astrath, N.G.C.; Malacarne, L.C.; Baesso, M.L. Thermal Lens Temperature Scanning technique for evaluation of oxidative stability and time of transesterification during biodiesel synthesis. Fuel 2017, 202, 78–84. [Google Scholar] [CrossRef]
  74. Deus, W.B.; Ventura, M.; Silva, J.R.; Andrade, L.H.C.; Catunda, T.; Lima, S.M. Monitoring of the ester production by near-near infrared thermal lens spectroscopy. Fuel 2019, 253, 1090–1096. [Google Scholar] [CrossRef]
  75. Muhmood, T.; Xia, M.; Lei, W.; Wang, F.; Mahmood, A. Fe-ZrO2 imbedded graphene like carbon nitride for acarbose (ACB) photo-degradation intermediate study. Adv. Powder Technol. 2018, 29, 3233–3240. [Google Scholar] [CrossRef]
  76. Dimiev, A.M.; Alemany, L.B.; Tour, J.M. Graphene Oxide. Origin of Acidity, Its Instability in Water, and a New Dynamic Structural Model. ACS Nano 2013, 7, 576–588. [Google Scholar] [CrossRef]
  77. Ratova, D.-M.V.; Mikheev, I.V.; Chermashentsev, G.R.; Maslakov, K.I.; Kottsov, S.Y.; Stolbov, D.N.; Maksimov, S.V.; Sozarukova, M.M.; Proskurnina, E.V.; Proskurnin, M.A. Green and Sustainable Ultrasound-Assisted Anodic Electrochemical Preparation of Graphene Oxide Dispersions and Their Antioxidant Properties. Molecules 2023, 28, 3238. [Google Scholar] [CrossRef] [PubMed]
  78. Angayarkanni, S.A.; Philip, J. Review on thermal properties of nanofluids: Recent developments. Adv. Colloid Interface Sci. 2015, 225, 146–176. [Google Scholar] [CrossRef] [PubMed]
  79. Zhou, L.-P.; Wang, B.-X.; Peng, X.-F.; Du, X.-Z.; Yang, Y.-P. On the Specific Heat Capacity of CuO Nanofluid. Adv. Mech. Eng. 2015, 2, 172085. [Google Scholar] [CrossRef] [Green Version]
  80. Ganvir, R.B.; Walke, P.V.; Kriplani, V.M. Heat transfer characteristics in nanofluid—A review. Renew. Sustain. Energy Rev. 2017, 75, 451–460. [Google Scholar] [CrossRef]
  81. Simpson, S.; Schelfhout, A.; Golden, C.; Vafaei, S. Nanofluid Thermal Conductivity and Effective Parameters. Appl. Sci. 2019, 9, 87. [Google Scholar] [CrossRef] [Green Version]
  82. Maldovan, M. Sound and heat revolutions in phononics. Nature 2013, 503, 209–217. [Google Scholar] [CrossRef]
  83. Li, A.; Zhang, C.; Zhang, Y.-F. Thermal Conductivity of Graphene-Polymer Composites: Mechanisms, Properties, and Applications. Polymers 2017, 9, 437. [Google Scholar] [CrossRef] [Green Version]
  84. de Freitas Cabral, A.J.; Furtado, C.A.; Fantini, C.; Alcantara, P., Jr. Thermal Diffusivity of Multi-Walled Carbon Nanotubes Dispersed in Oleic Acid. J. Nano Res. 2012, 21, 125–130. [Google Scholar] [CrossRef]
  85. Leal, N.N.S.; Brandão-Silva, A.C.; Fantini, C.; Hickmann, J.M.; Fonseca, E.J.S.; Alencar, M.A.R.C. Thermo-optical response of colloidal metallic and semiconducting single-walled carbon nanotubes. Opt. Laser Technol. 2019, 116, 315–321. [Google Scholar] [CrossRef]
  86. Usoltseva, L.O.; Volkov, D.S.; Avramenko, N.V.; Korobov, M.V.; Proskurnin, M.A. Nanodiamond aqueous dispersions as potential nanofluids: The determination of properties by thermal lensing and other techniques. Nanosyst. Phys. Chem. Math. 2018, 9, 17–20. [Google Scholar] [CrossRef] [Green Version]
  87. Esfahani, M.R.; Languri, E.M.; Nunna, M.R. Effect of particle size and viscosity on thermal conductivity enhancement of graphene oxide nanofluid. Int. Commun. Heat Mass Transf. 2016, 76, 308–315. [Google Scholar] [CrossRef]
  88. Hajjar, Z.; Rashidi, A.M.; Ghozatloo, A. Enhanced thermal conductivities of graphene oxide nanofluids. Int. Commun. Heat Mass Transf. 2014, 57, 128–131. [Google Scholar] [CrossRef]
  89. Mei, X.; Sha, X.; Jing, D.; Ma, L. Thermal Conductivity and Rheology of Graphene Oxide Nanofluids and a Modified Predication Model. Appl. Sci. 2022, 12, 3567. [Google Scholar] [CrossRef]
  90. Cham Saard, W.; Fawcett, D.; Fung, C.C.; Chapman, P.; Rattan, S.; Poinern, G.E.J. Synthesis, characterisation and thermo-physical properties of highly stable graphene oxide-based aqueous nanofluids for potential low-temperature direct absorption solar applications. Sci. Rep. 2021, 11, 16549. [Google Scholar] [CrossRef] [PubMed]
  91. Mathew, R.M.; Zachariah, E.S.; Jose, J.; Thomas, T.; John, J.; Titus, T.; Unni, N.G.; Mathew, S.; Mujeeb, A.; Thomas, V. Synthesis, characterization and evaluation of tunable thermal diffusivity of phosphorus-doped carbon nanodot. Appl. Phys. A 2020, 126, 828. [Google Scholar] [CrossRef]
  92. Joseph, M.; Anugop, B.; Vijesh, K.R.; Balan, V.; Nampoori, V.P.N.; Kailasnath, M. Morphology and concentration-dependent thermal diffusivity of biofunctionalized zinc oxide nanostructures using dual-beam thermal lens technique. Mater. Lett. 2022, 323, 132599. [Google Scholar] [CrossRef]
  93. Pradeep Kumar, V.; Radhakrishnan, P.; Mujeeb, A. Thermal Diffusivity Measurement of PVP Capped Nickel Oxide Nanoparticles by Dual Beam Thermal Lens Technique. In Proceedings of the ICOL-2019, Dehradun, India, 19–22 October 2019; Springer: Singapore, 2021; pp. 841–843. [Google Scholar]
  94. Shahriari, E.; Varnamkhasti, M.G.; Zamiri, R. Characterization of thermal diffusivity and optical properties of Ag nanoparticles. Optik 2015, 126, 2104–2107. [Google Scholar] [CrossRef]
  95. Zamiri, R.; Zakaria, A.; Shahriari, E.; Mat Yunus, W.M.; Naghavi, K.; Saion, E.; Mahdi, M.A.; Husin, M. Dependence of thermal diffusivity on particle size in Au nano-fluid. Optoelectron. Adv. Mater. Rapid. Commun. 2010, 4, 1551–1553. [Google Scholar]
  96. Philip, J.; Shima, P.D. Thermal properties of nanofluids. Adv. Colloid Interface Sci. 2012, 183–184, 30–45. [Google Scholar] [CrossRef]
  97. Shen, J.; Lowe, R.D.; Snook, R.D. A model for cw laser induced mode-mismatched dual-beam thermal lens spectrometry. Chem. Phys. 1992, 165, 385–396. [Google Scholar] [CrossRef]
  98. Rodriguez, L.G.; Iza, P.; Paz, J.L. Study of dependence between thermal diffusivity and sample concentration measured by means of frequency-resolved thermal lens experiment. J. Nonlinear Opt. Phys. Mater. 2016, 25, 1650022. [Google Scholar] [CrossRef]
  99. Mu, H.; Yu, W.; Yuan, J.; Lin, S.; Zhang, G. Interface and surface engineering of black phosphorus: A review for optoelectronic and photonic applications. Mater. Futures 2022, 1, 012301. [Google Scholar] [CrossRef]
  100. Gómez-Mancebo, M.B.; Fernández-Martínez, R.; Ruiz-Perona, A.; Rubio, V.; Bastante, P.; García-Pérez, F.; Borlaf, F.; Sánchez, M.; Hamada, A.; Velasco, A.; et al. Comparison of Thermal and Laser-Reduced Graphene Oxide Production for Energy Storage Applications. Nanomaterials 2023, 13, 1391. [Google Scholar] [CrossRef] [PubMed]
  101. Gallegos-Perez, W.R.; Reynosa-Martinez, A.C.; Soto-Ortiz, C.; Angelica Alvarez-Lemus, M.; Barroso-Flores, J.; Garcia Montalvo, V.; Lopez-Honorato, E. Effect of UV radiation on the structure of graphene oxide in water and its impact on cytotoxicity and As(III) adsorption. Chemosphere 2020, 249, 126160. [Google Scholar] [CrossRef] [PubMed] [Green Version]
  102. Konkena, B.; Vasudevan, S. Engineering a Water-Dispersible, Conducting, Photoreduced Graphene Oxide. J. Phys. Chem. C 2015, 119, 6356–6362. [Google Scholar] [CrossRef]
  103. Huang, L.; Liu, Y.; Ji, L.-C.; Xie, Y.-Q.; Wang, T.; Shi, W.-Z. Pulsed laser assisted reduction of graphene oxide. Carbon 2011, 49, 2431–2436. [Google Scholar] [CrossRef]
  104. de Lima, B.S.; Bernardi, M.I.B.; Mastelaro, V.R. Wavelength effect of ns-pulsed radiation on the reduction of graphene oxide. Appl. Surf. Sci. 2020, 506, 144808. [Google Scholar] [CrossRef]
  105. Bai, H.; Jiang, W.; Kotchey, G.P.; Saidi, W.A.; Bythell, B.J.; Jarvis, J.M.; Marshall, A.G.; Robinson, R.A.; Star, A. Insight into the Mechanism of Graphene Oxide Degradation via the Photo-Fenton Reaction. J. Phys. Chem. C Nanomater. Interfaces 2014, 118, 10519–10529. [Google Scholar] [CrossRef]
  106. Chen, J.; Li, L. Thermal Conductivity of Graphene Oxide: A Molecular Dynamics Study. JETP Lett. 2020, 112, 117–121. [Google Scholar] [CrossRef]
  107. Chen, J.; Li, L. Effect of oxidation degree on the thermal properties of graphene oxide. J. Mater. Res. Technol. 2020, 9, 13740–13748. [Google Scholar] [CrossRef]
  108. Pattarith, K.; Areerob, Y. Fabrication of Ag nanoparticles adhered on RGO based on both electrodes in dye-sensitized solar cells (DSSCs). Renew. Wind Water Solar 2020, 7, 1. [Google Scholar] [CrossRef] [Green Version]
  109. Faria, A.F.; Perreault, F.; Elimelech, M. Elucidating the Role of Oxidative Debris in the Antimicrobial Properties of Graphene Oxide. ACS Appl. Nano Mater. 2018, 1, 1164–1174. [Google Scholar] [CrossRef]
  110. Valmonte, Z.; Baker, Z.; Loor, J.; Sarkar, A. Concurrent Reduction and Stabilization of Graphene Oxide Dispersion by Silk-Inspired Polymer. ACS Appl. Polym. Mater. 2023, 5, 7. [Google Scholar] [CrossRef] [PubMed]
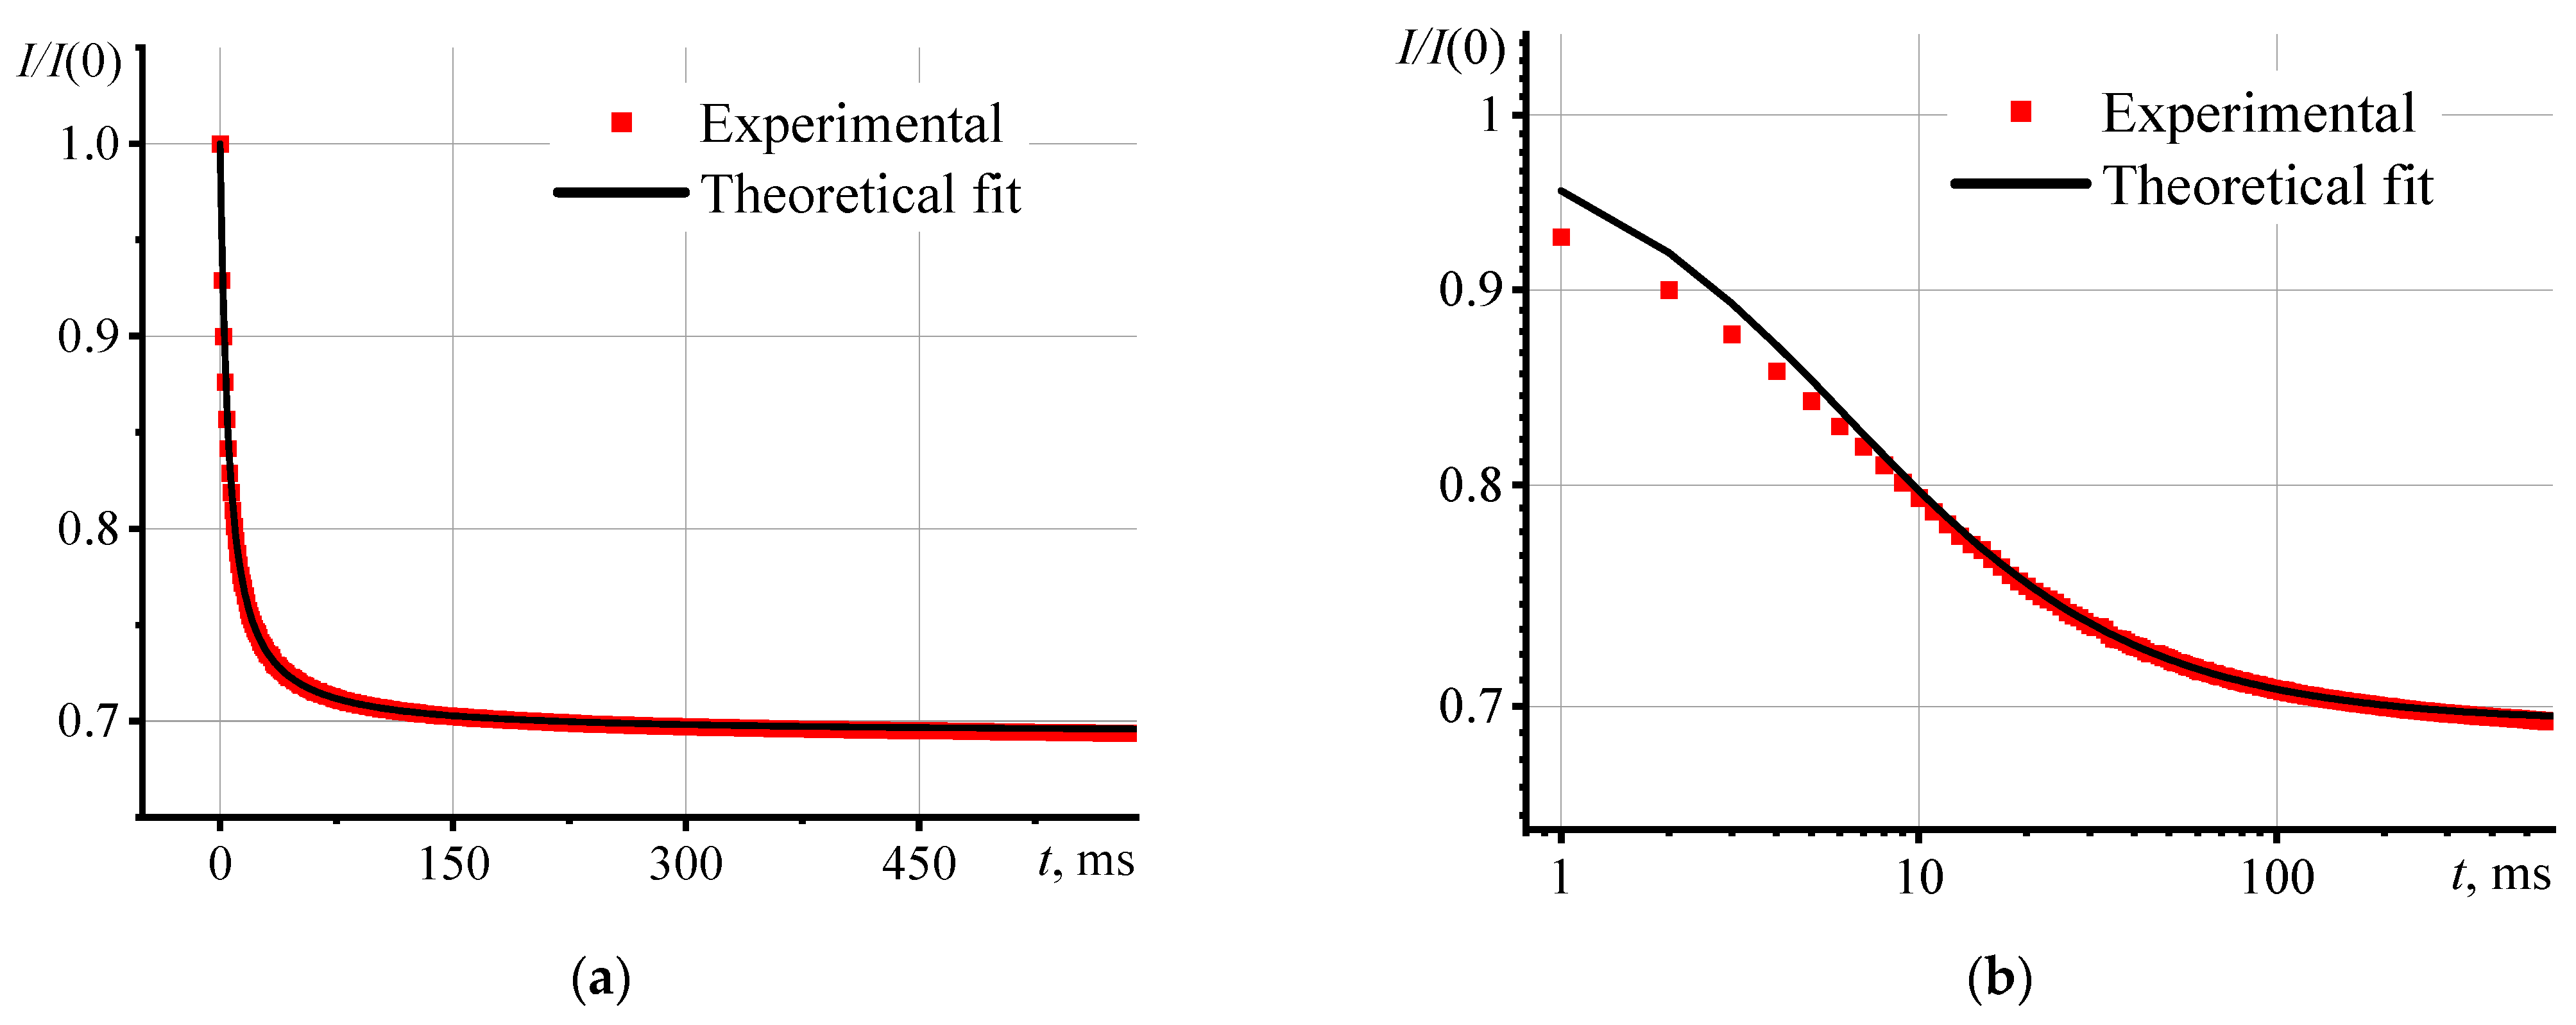
Figure 1. Transient curves for an aqueous solution of Ferroin (1 μmol/L) in linear (a) and logarithmic (b) scales.
Nanomaterials 13 02126 g001
Figure 2. Transient curves of aqueous dispersions of GO, fraction > 14 kDa with different concentrations, where (a) complete transient curves, and (b) the initial segment of transient curves.
Nanomaterials 13 02126 g002
Figure 3. Effect of graphene oxide concentration on thermal diffusivity for an unfractionated sample and two fractions: > 14 kDa and 1–3.5 kDa (n = 5, p = 0.95), where (a) over the entire concentration range, (b) at c > 0.1 mg/L.
Nanomaterials 13 02126 g003
Figure 4. Dependence of normalized thermal lens signals on concentration for unfractionated GO.
Nanomaterials 13 02126 g004
Figure 5. Dependence of the absorbance of GO samples with increasing concentration. The red zone corresponds to the significant influence of the systematic error on finding the thermal diffusivity.
Nanomaterials 13 02126 g005
Figure 6. Effect of graphene oxide size on the thermal diffusivity of an aqueous dispersion at a solid phase concentration of 1 mg/L (n = 3, p = 0.95).
Nanomaterials 13 02126 g006
Figure 7. Changes of (a) thermal diffusivity and (b) the thermal lens signal with time for GO (fraction > 14 kDa) at a concentration of 1 mg/L.
Nanomaterials 13 02126 g007
Figure 8. (a) Absorption spectra of graphene oxide (>14 kDa, c = 1 mg/L), before (1) and after (2) a long-term thermal lens experiment; (b) ratio of absorbance for GO after laser irradiation to absorbance before irradiation.
Nanomaterials 13 02126 g008
Figure 9. ATR FTIR spectra for the graphene oxide samples before (solid black line) and after (solid red line) the laser irradiation. The solid blue line is for the sample, which had precipitated during laser irradiation for four days: (a) in the range of 4000 to 400 cm−1, and (b) the fingerprint region.
Nanomaterials 13 02126 g009
Disclaimer/Publisher’s Note: The statements, opinions and data contained in all publications are solely those of the individual author(s) and contributor(s) and not of MDPI and/or the editor(s). MDPI and/or the editor(s) disclaim responsibility for any injury to people or property resulting from any ideas, methods, instructions or products referred to in the content.