
Quantifying the Structure and Properties of Nanomagnetic Iron Oxide Particles for Enhanced Functionality through Chemical Synthesis

 , , ,
, , ,  ,
,  and
and
Abstract
:1. Introduction
2. Materials and Methods
2.1. Materials
2.2. Nanoparticle Synthesis
2.3. Nanoparticle Characterization
2.4. Preparation and Characterization of PCL/CNMIOP Membranes
2.5. Statistical Analysis
3. Results
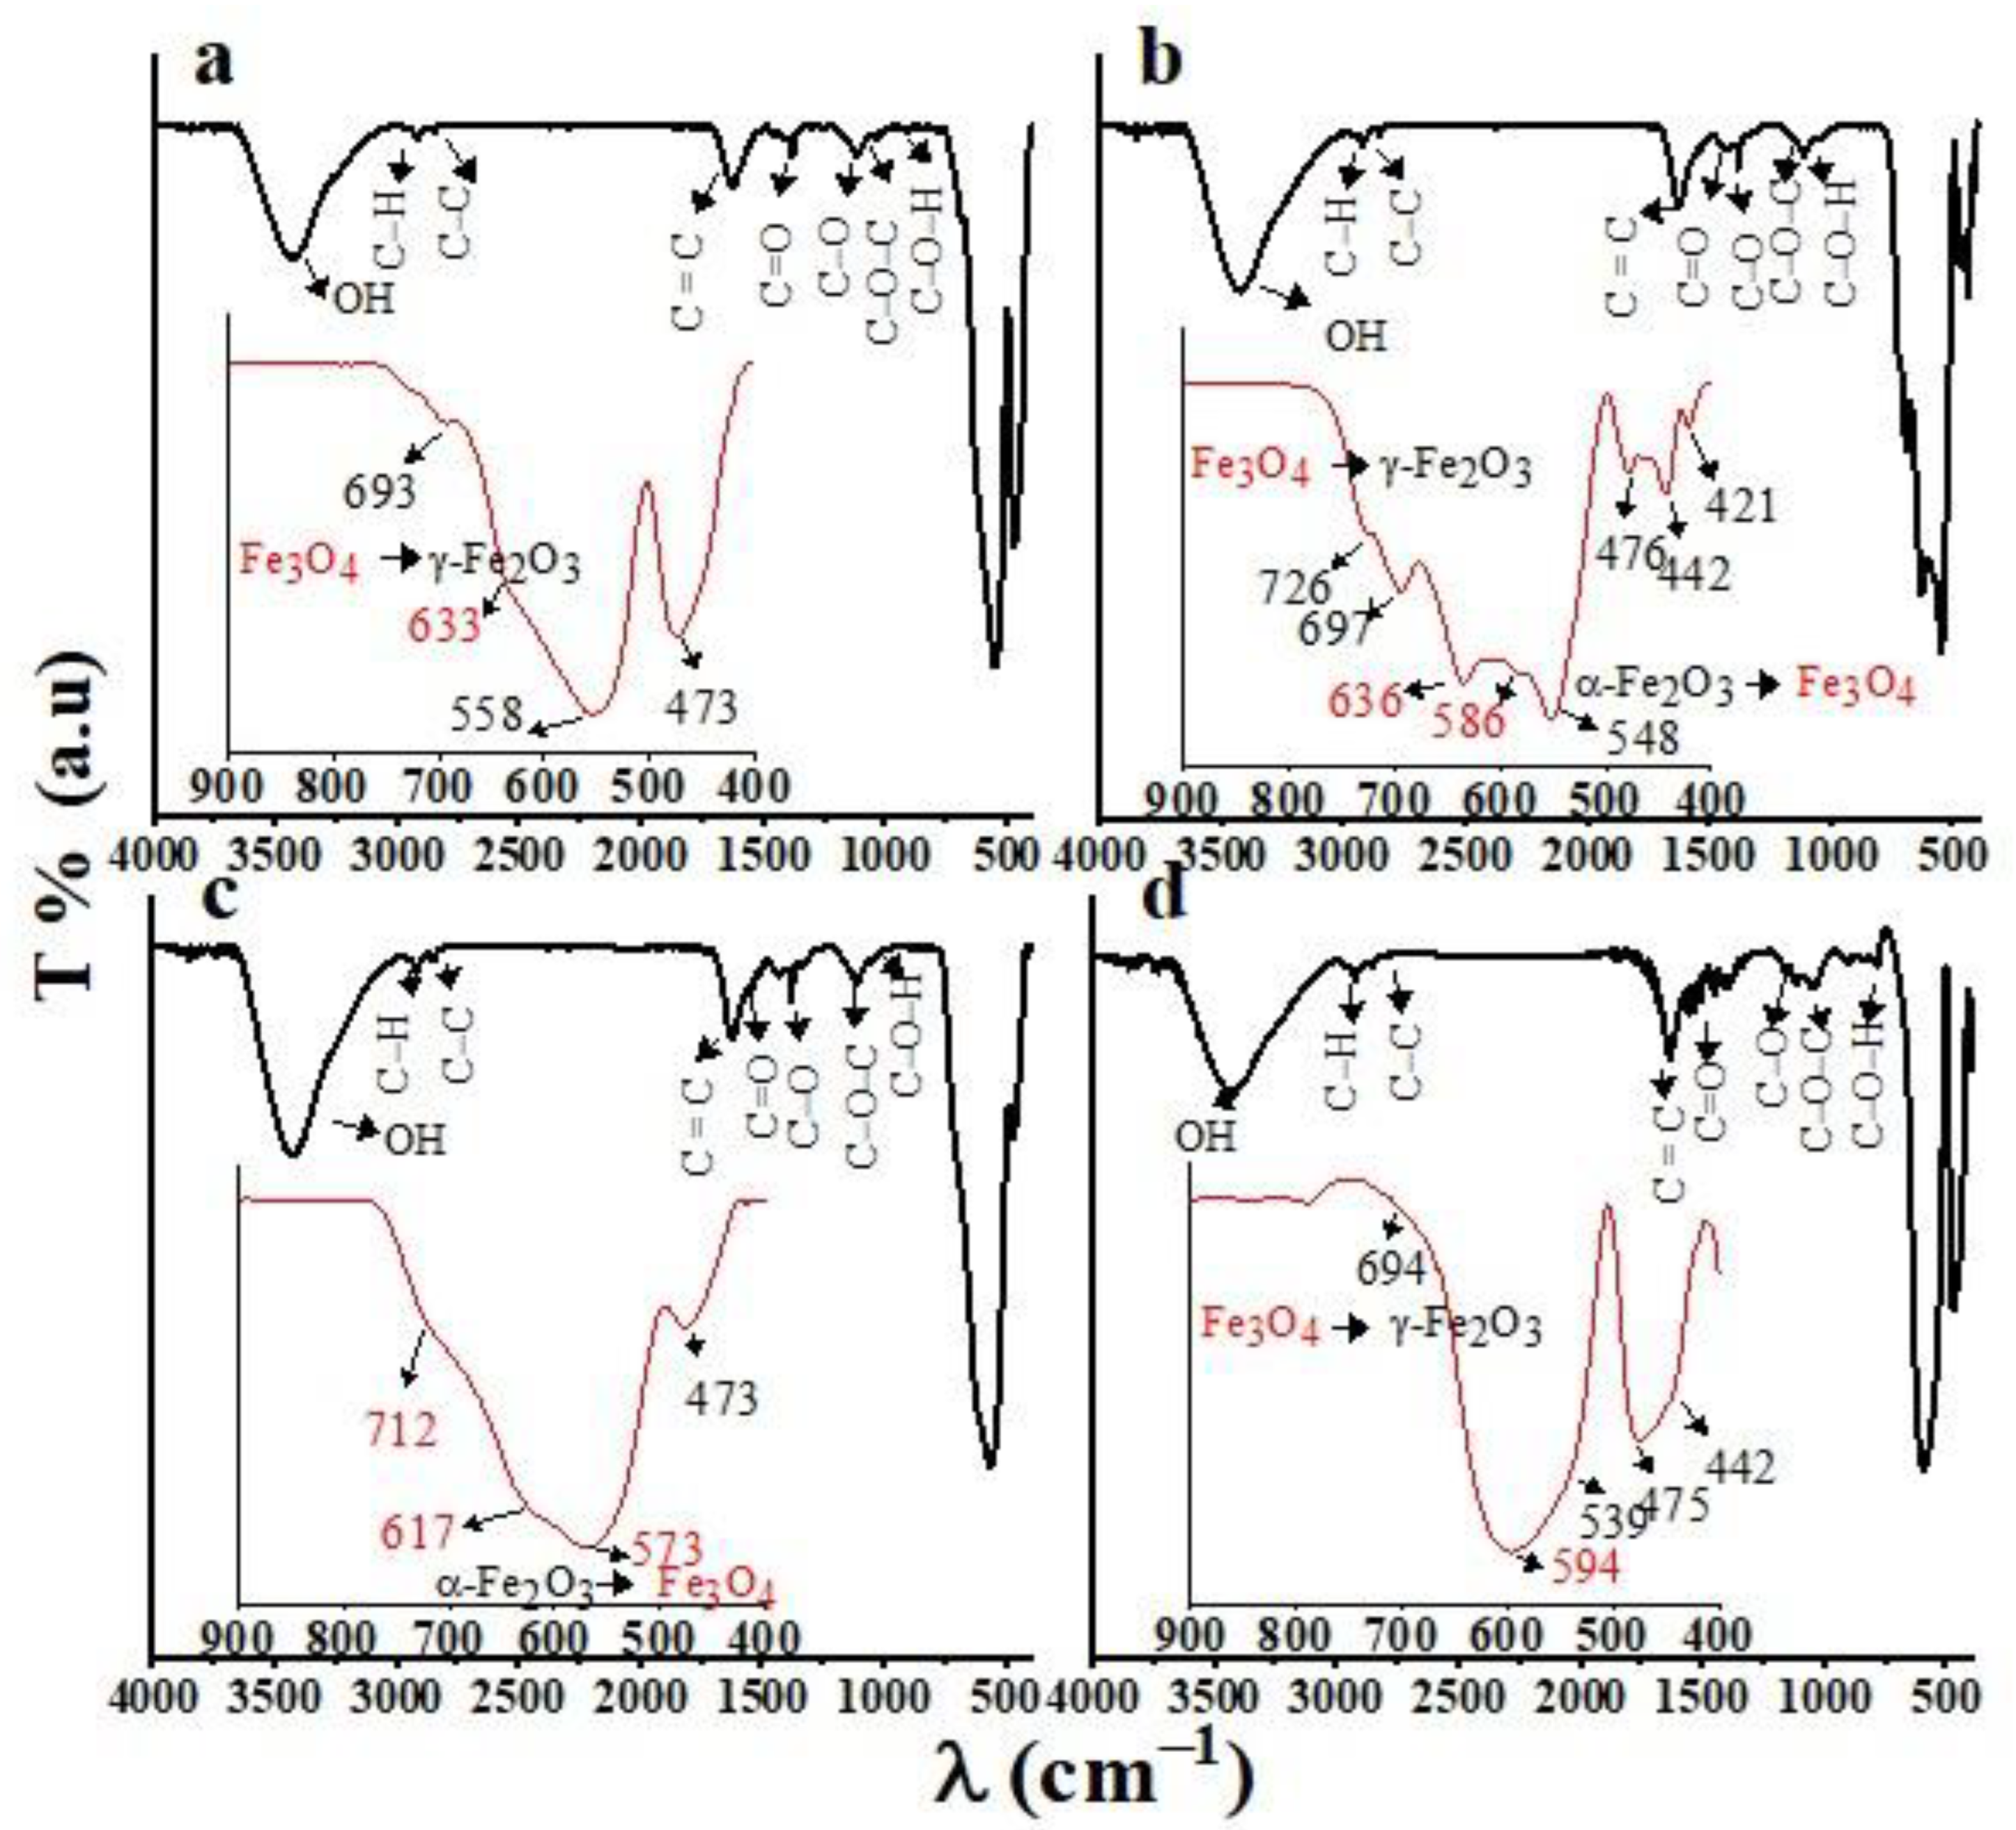
3.1. FTIR
3.2. SEM
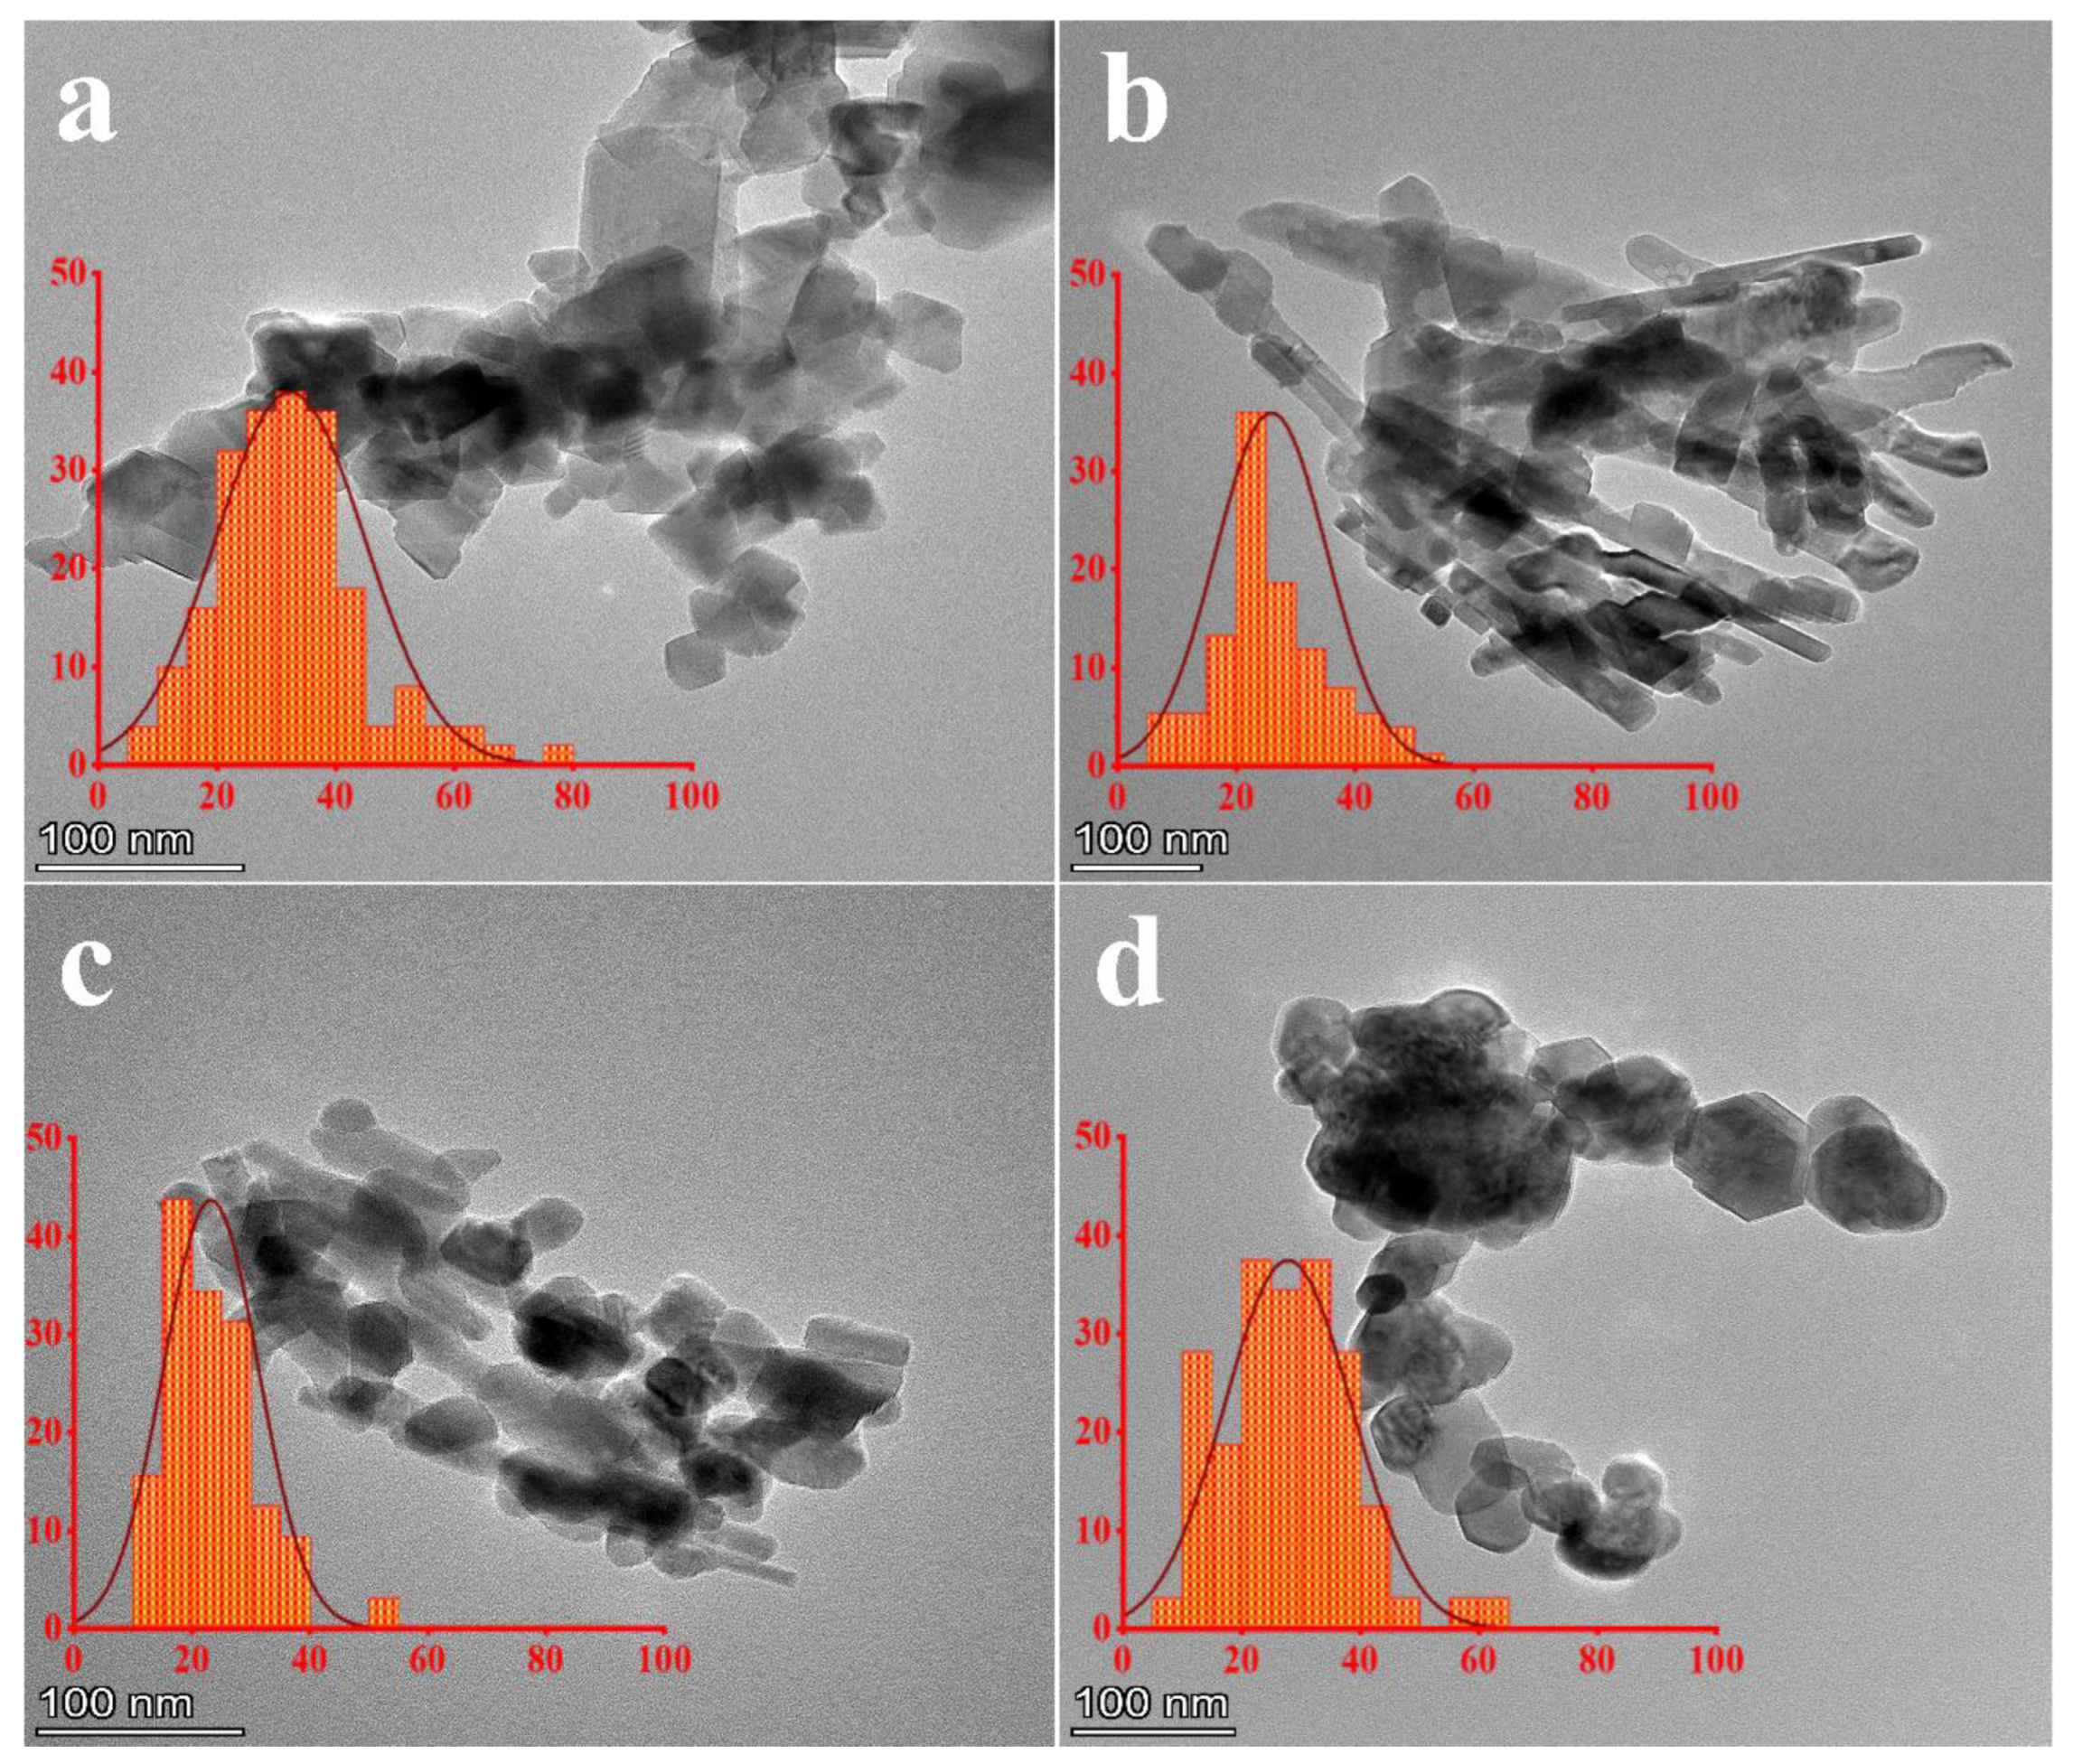
3.3. TEM
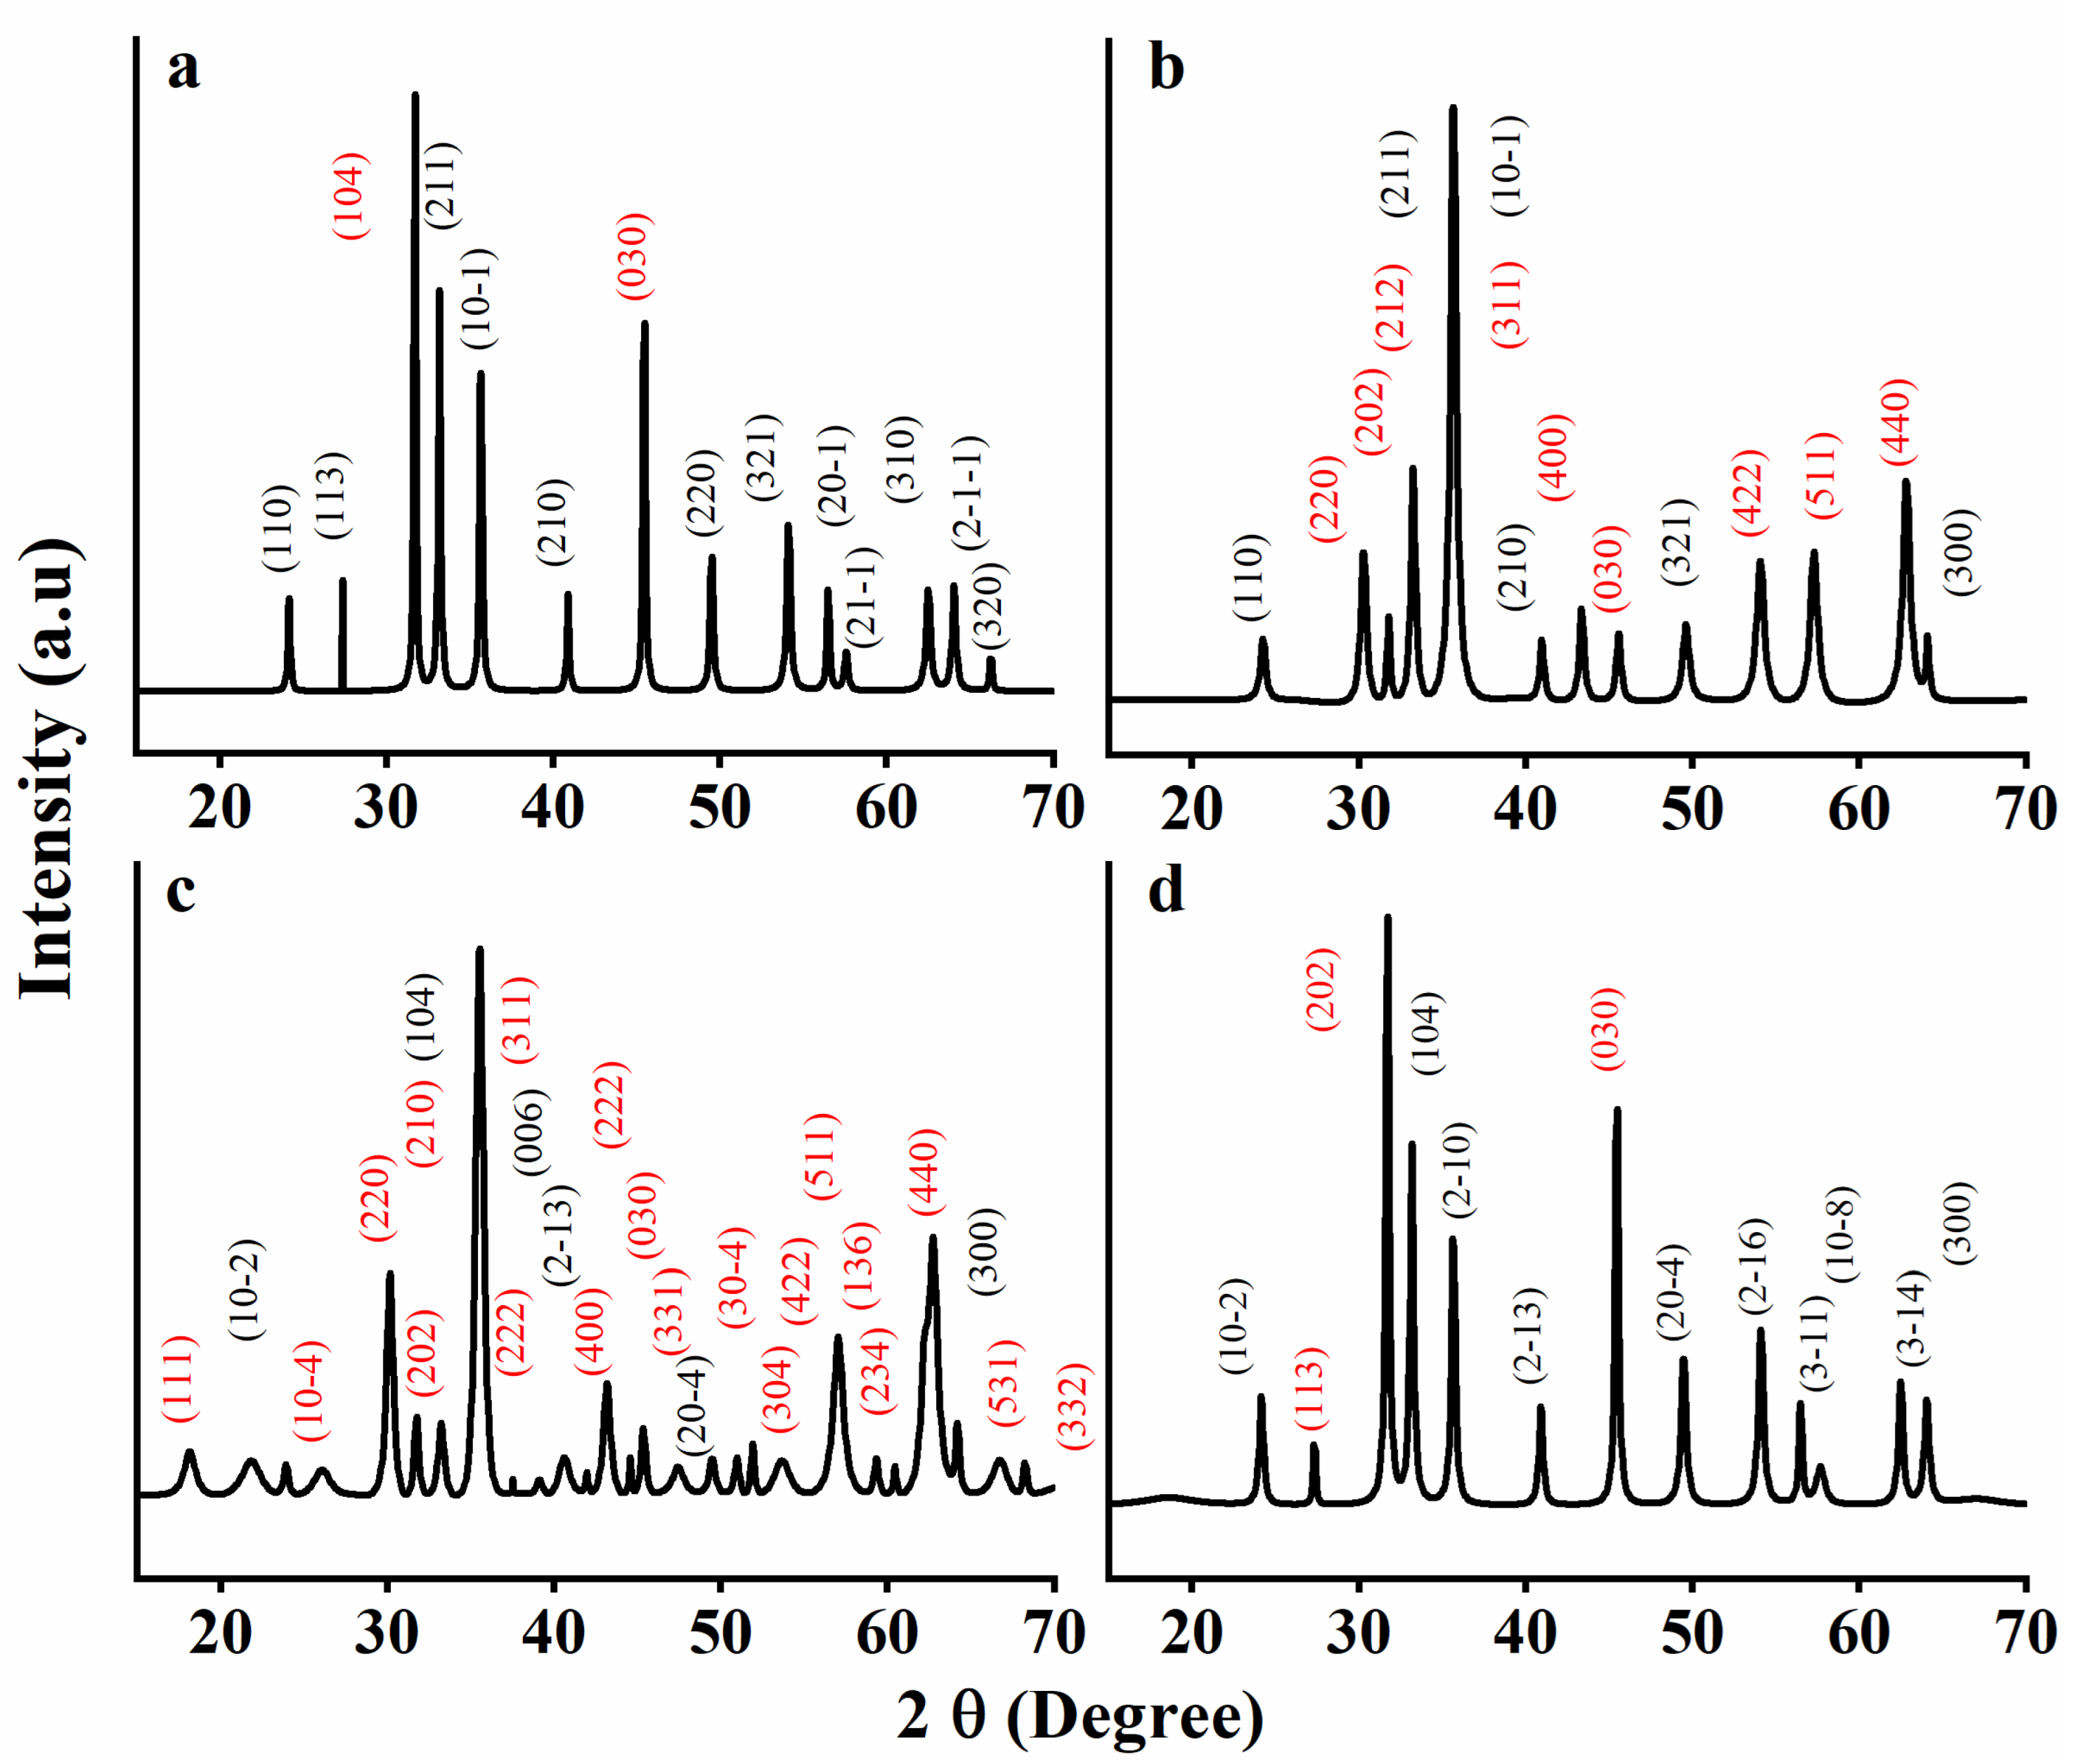
3.4. XRD
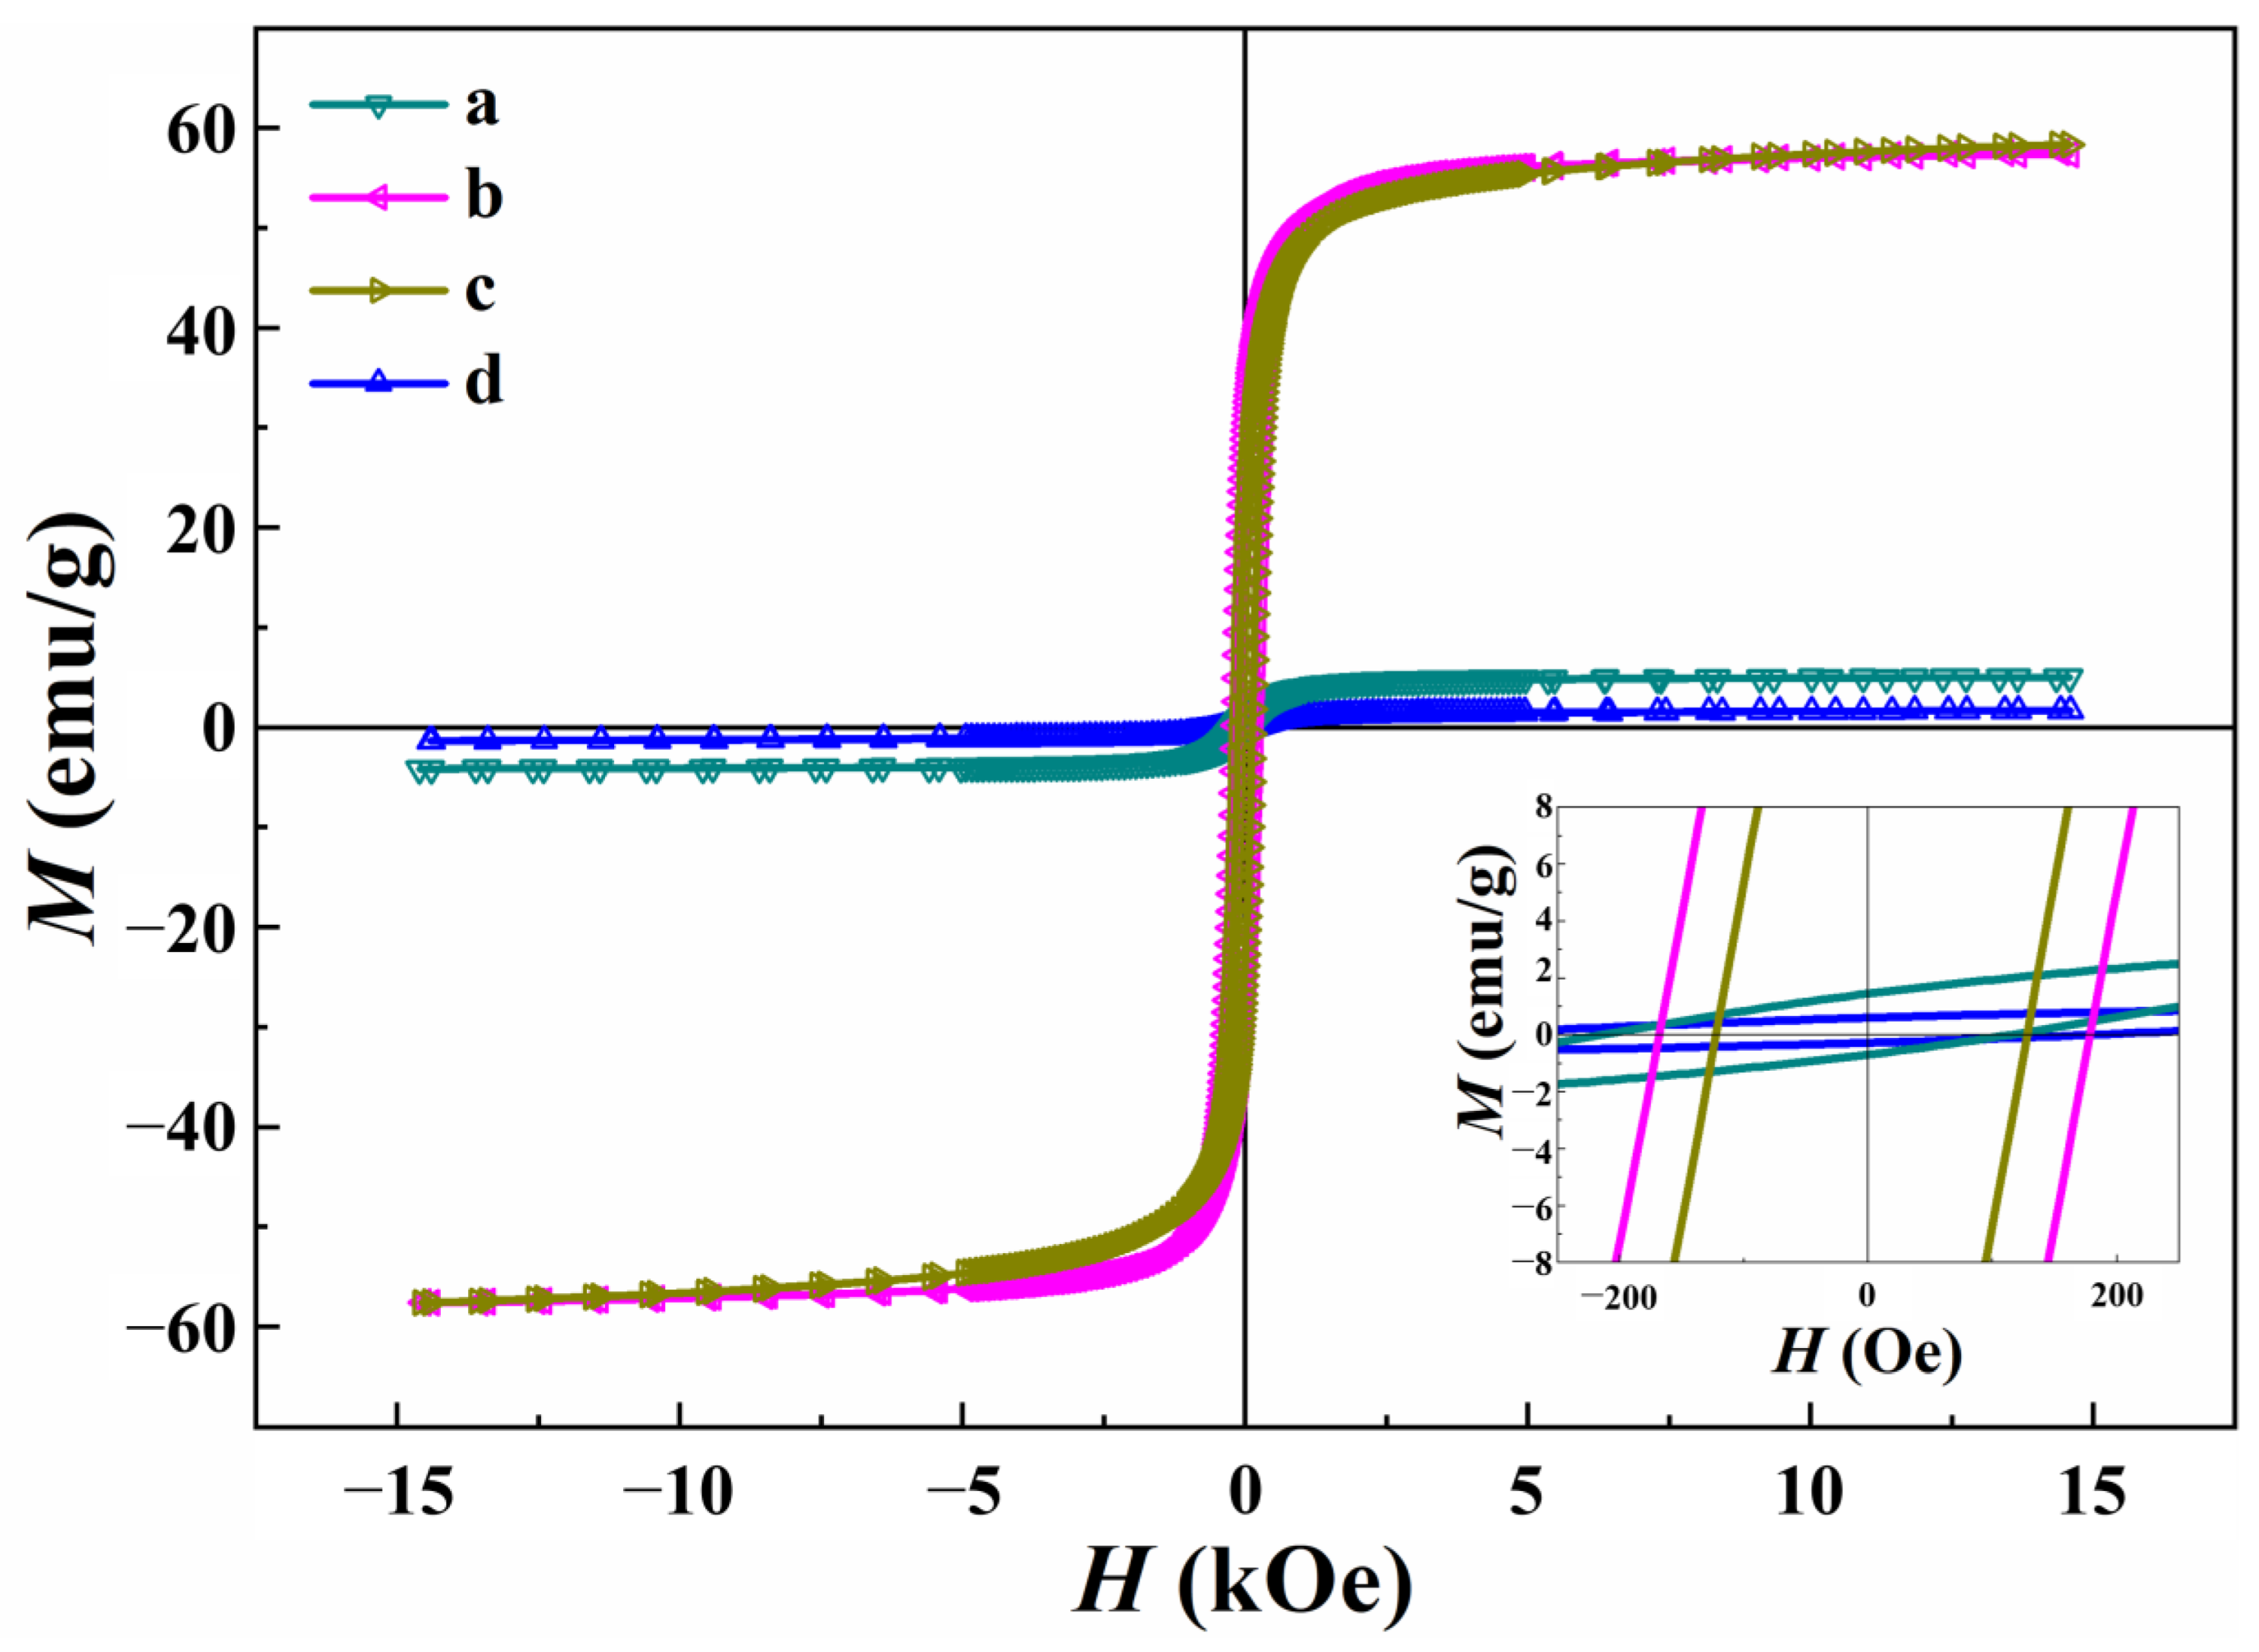
3.5. Magnetic Properties
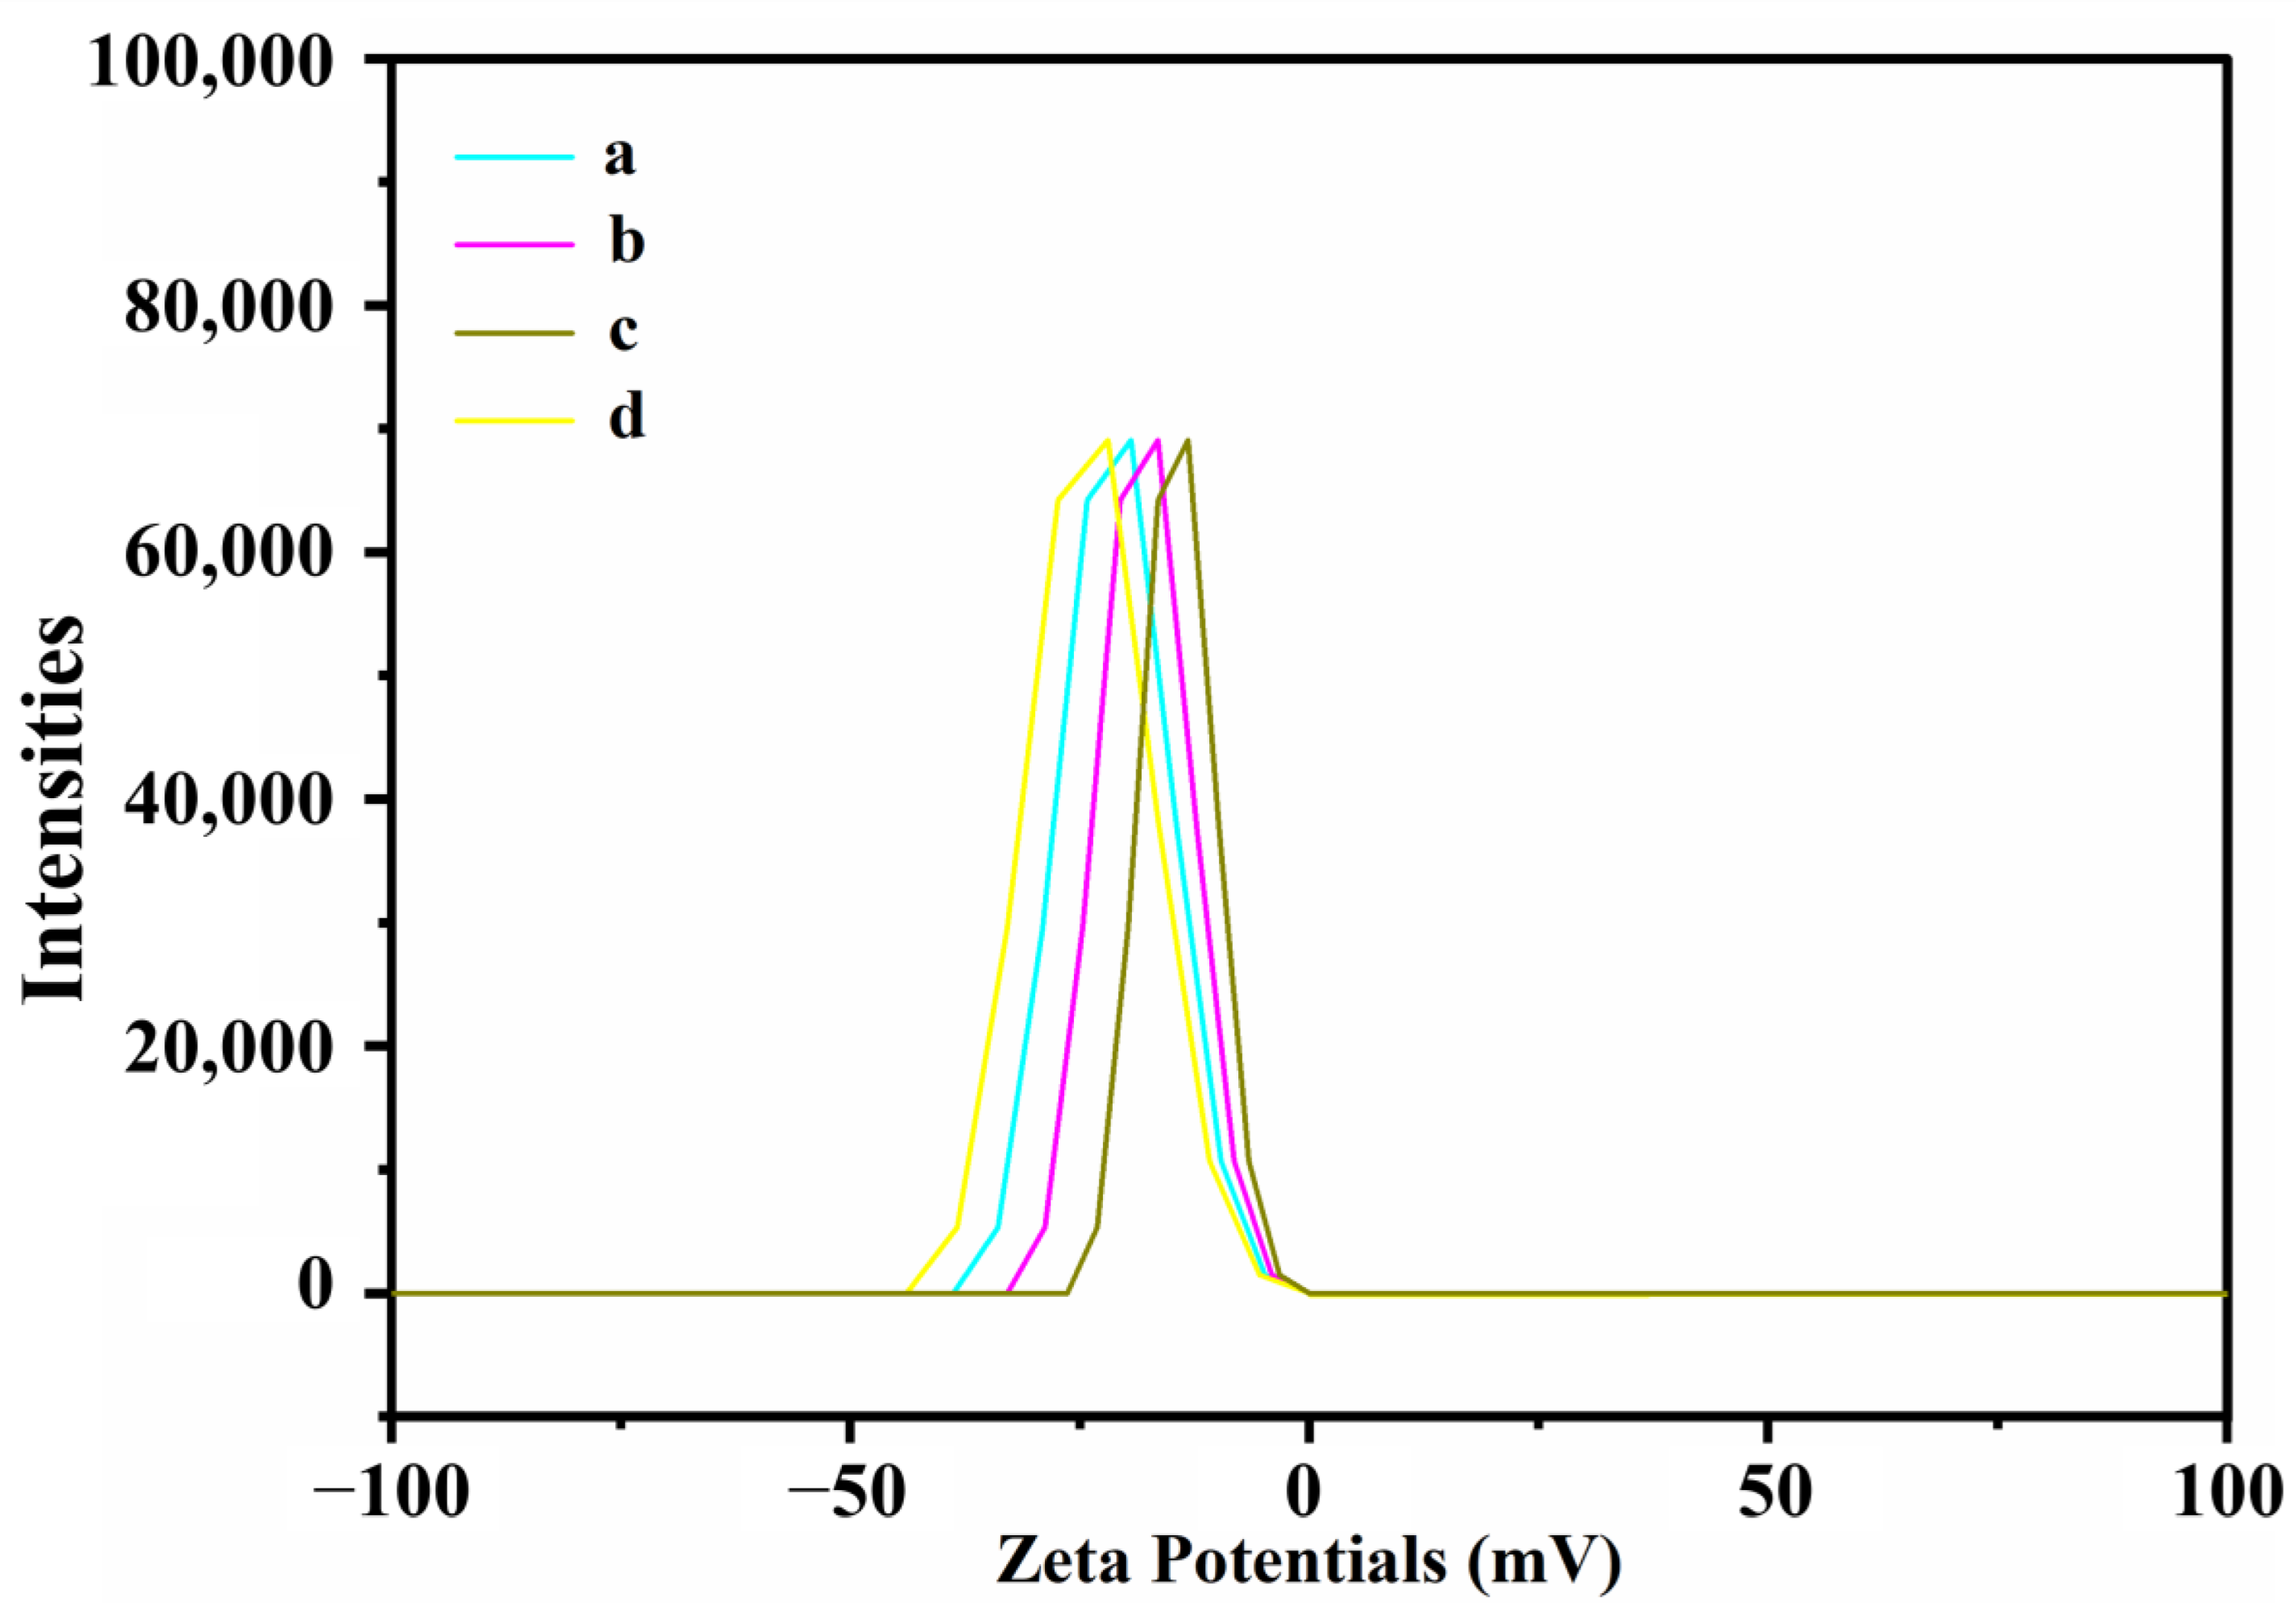
3.6. Nanoparticle Stability
3.7. Antioxidant Activity
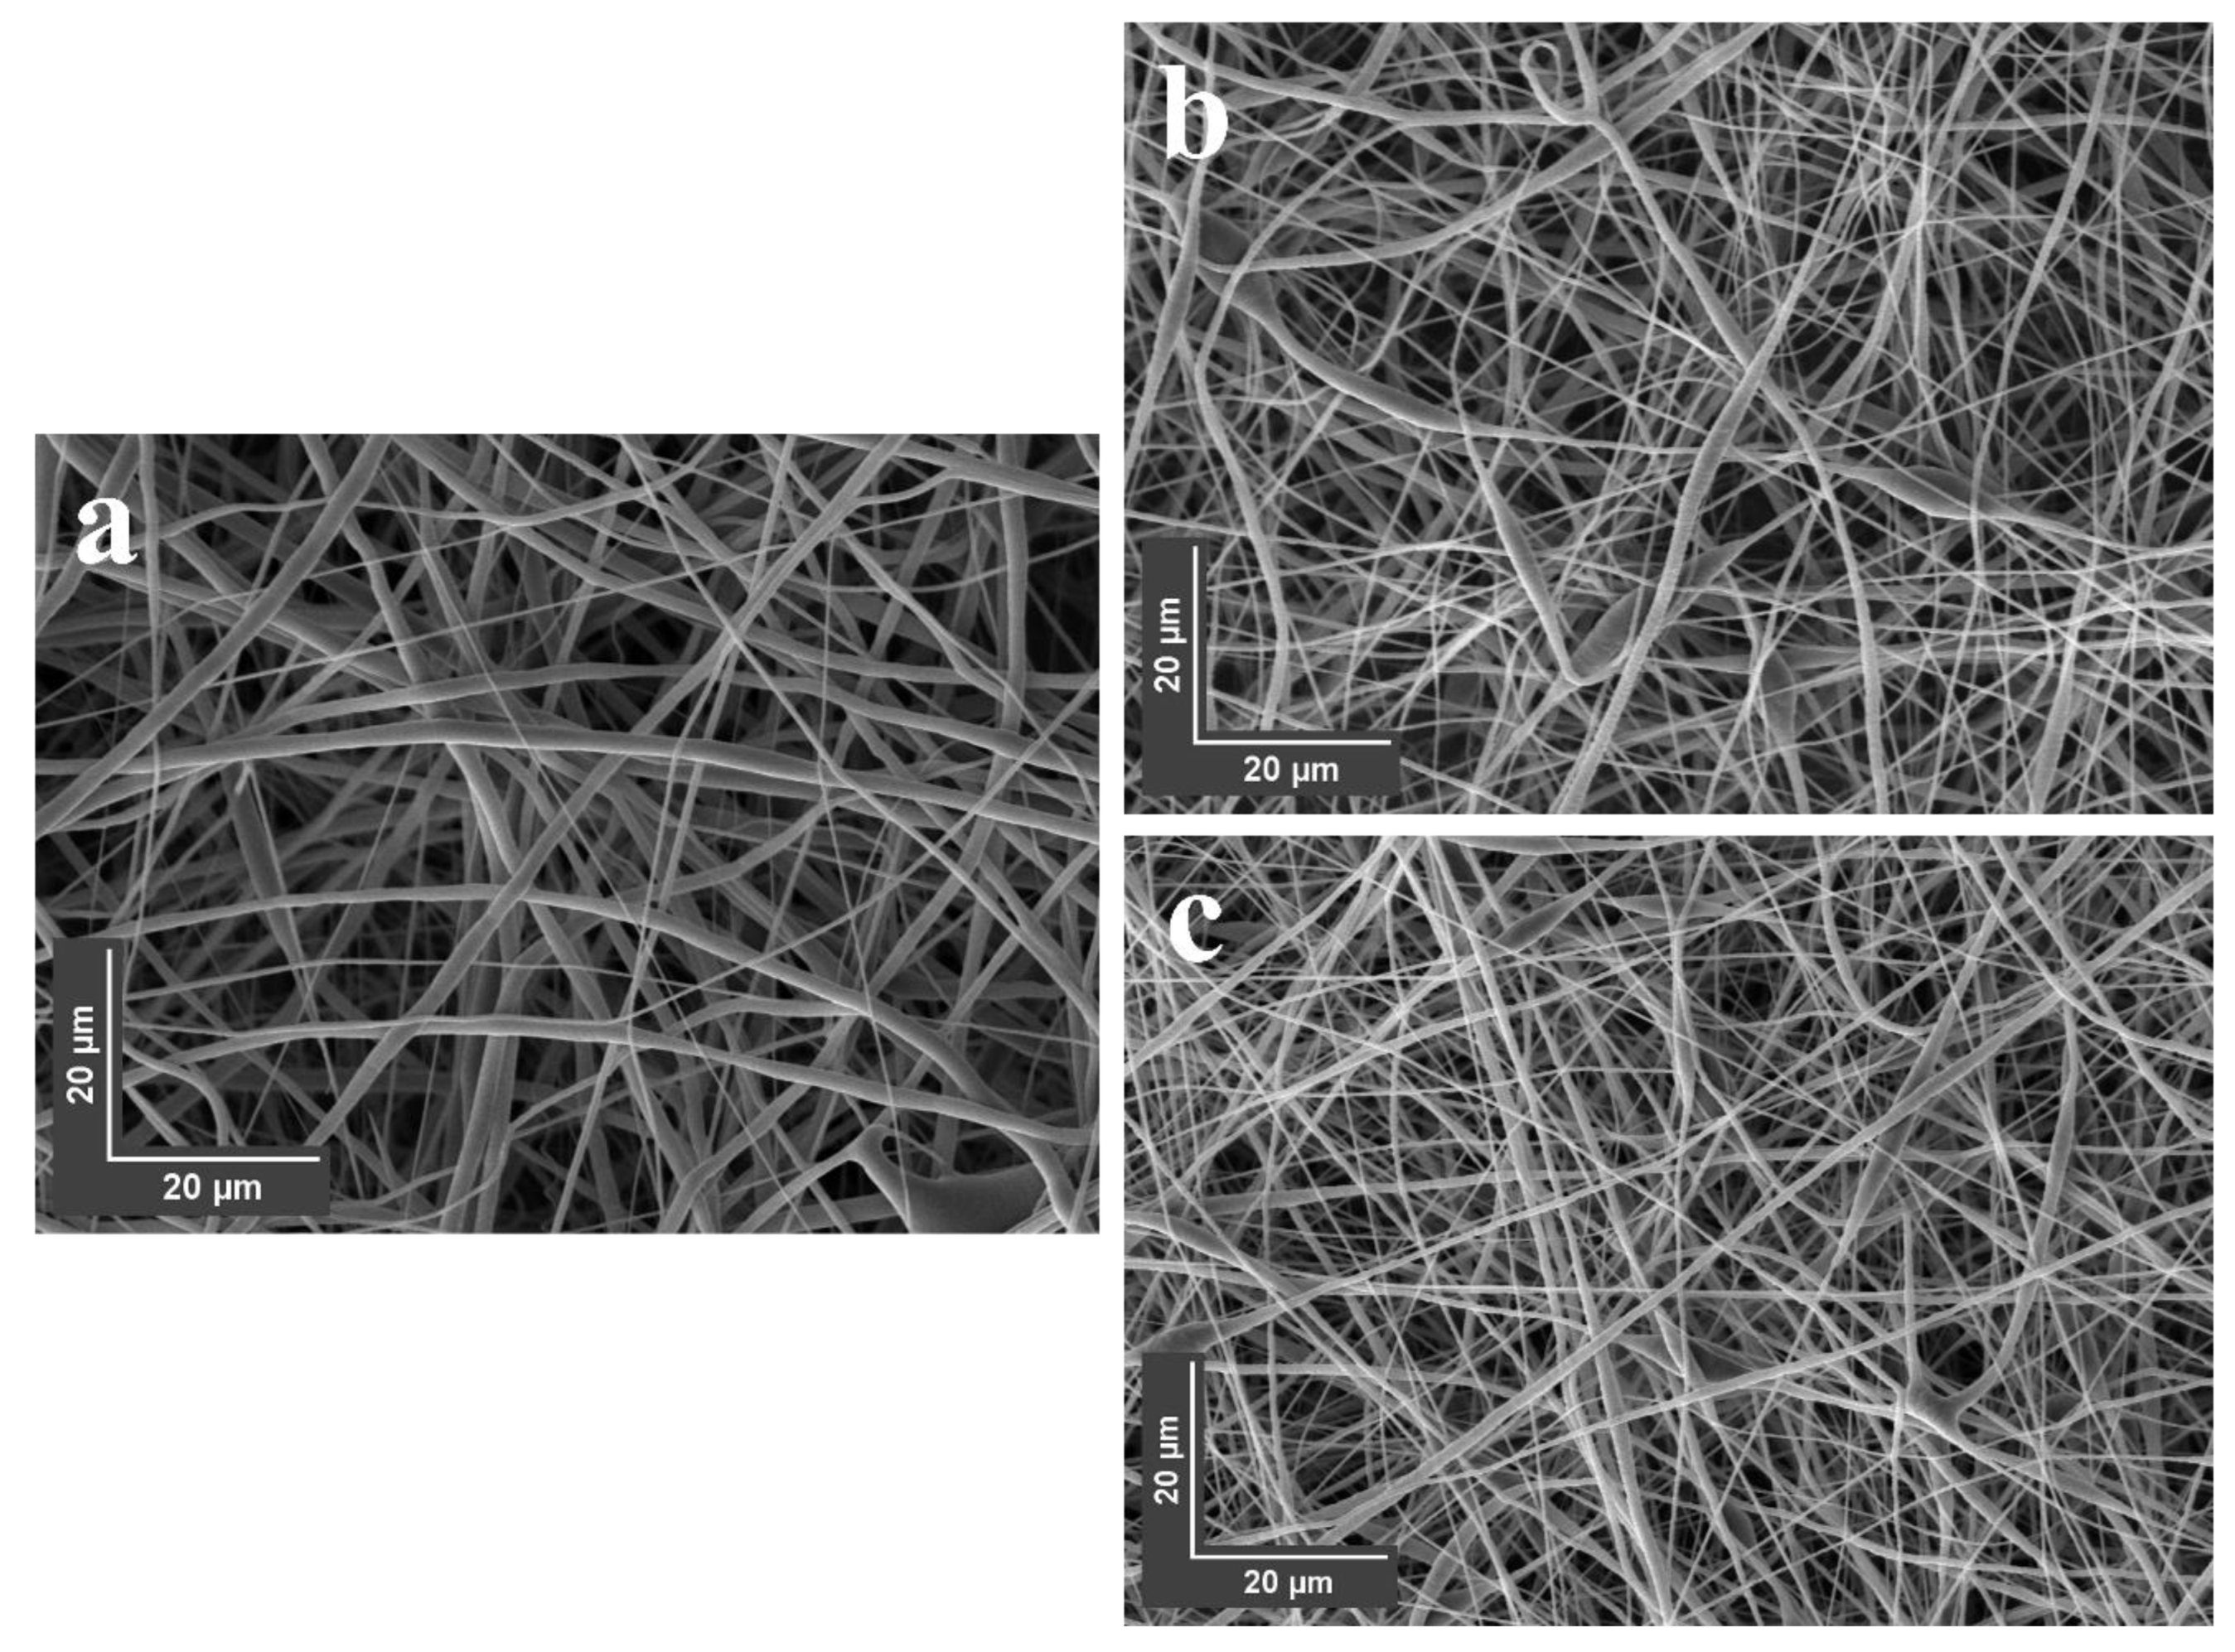
3.8. SEM Imaging of Nanofibers
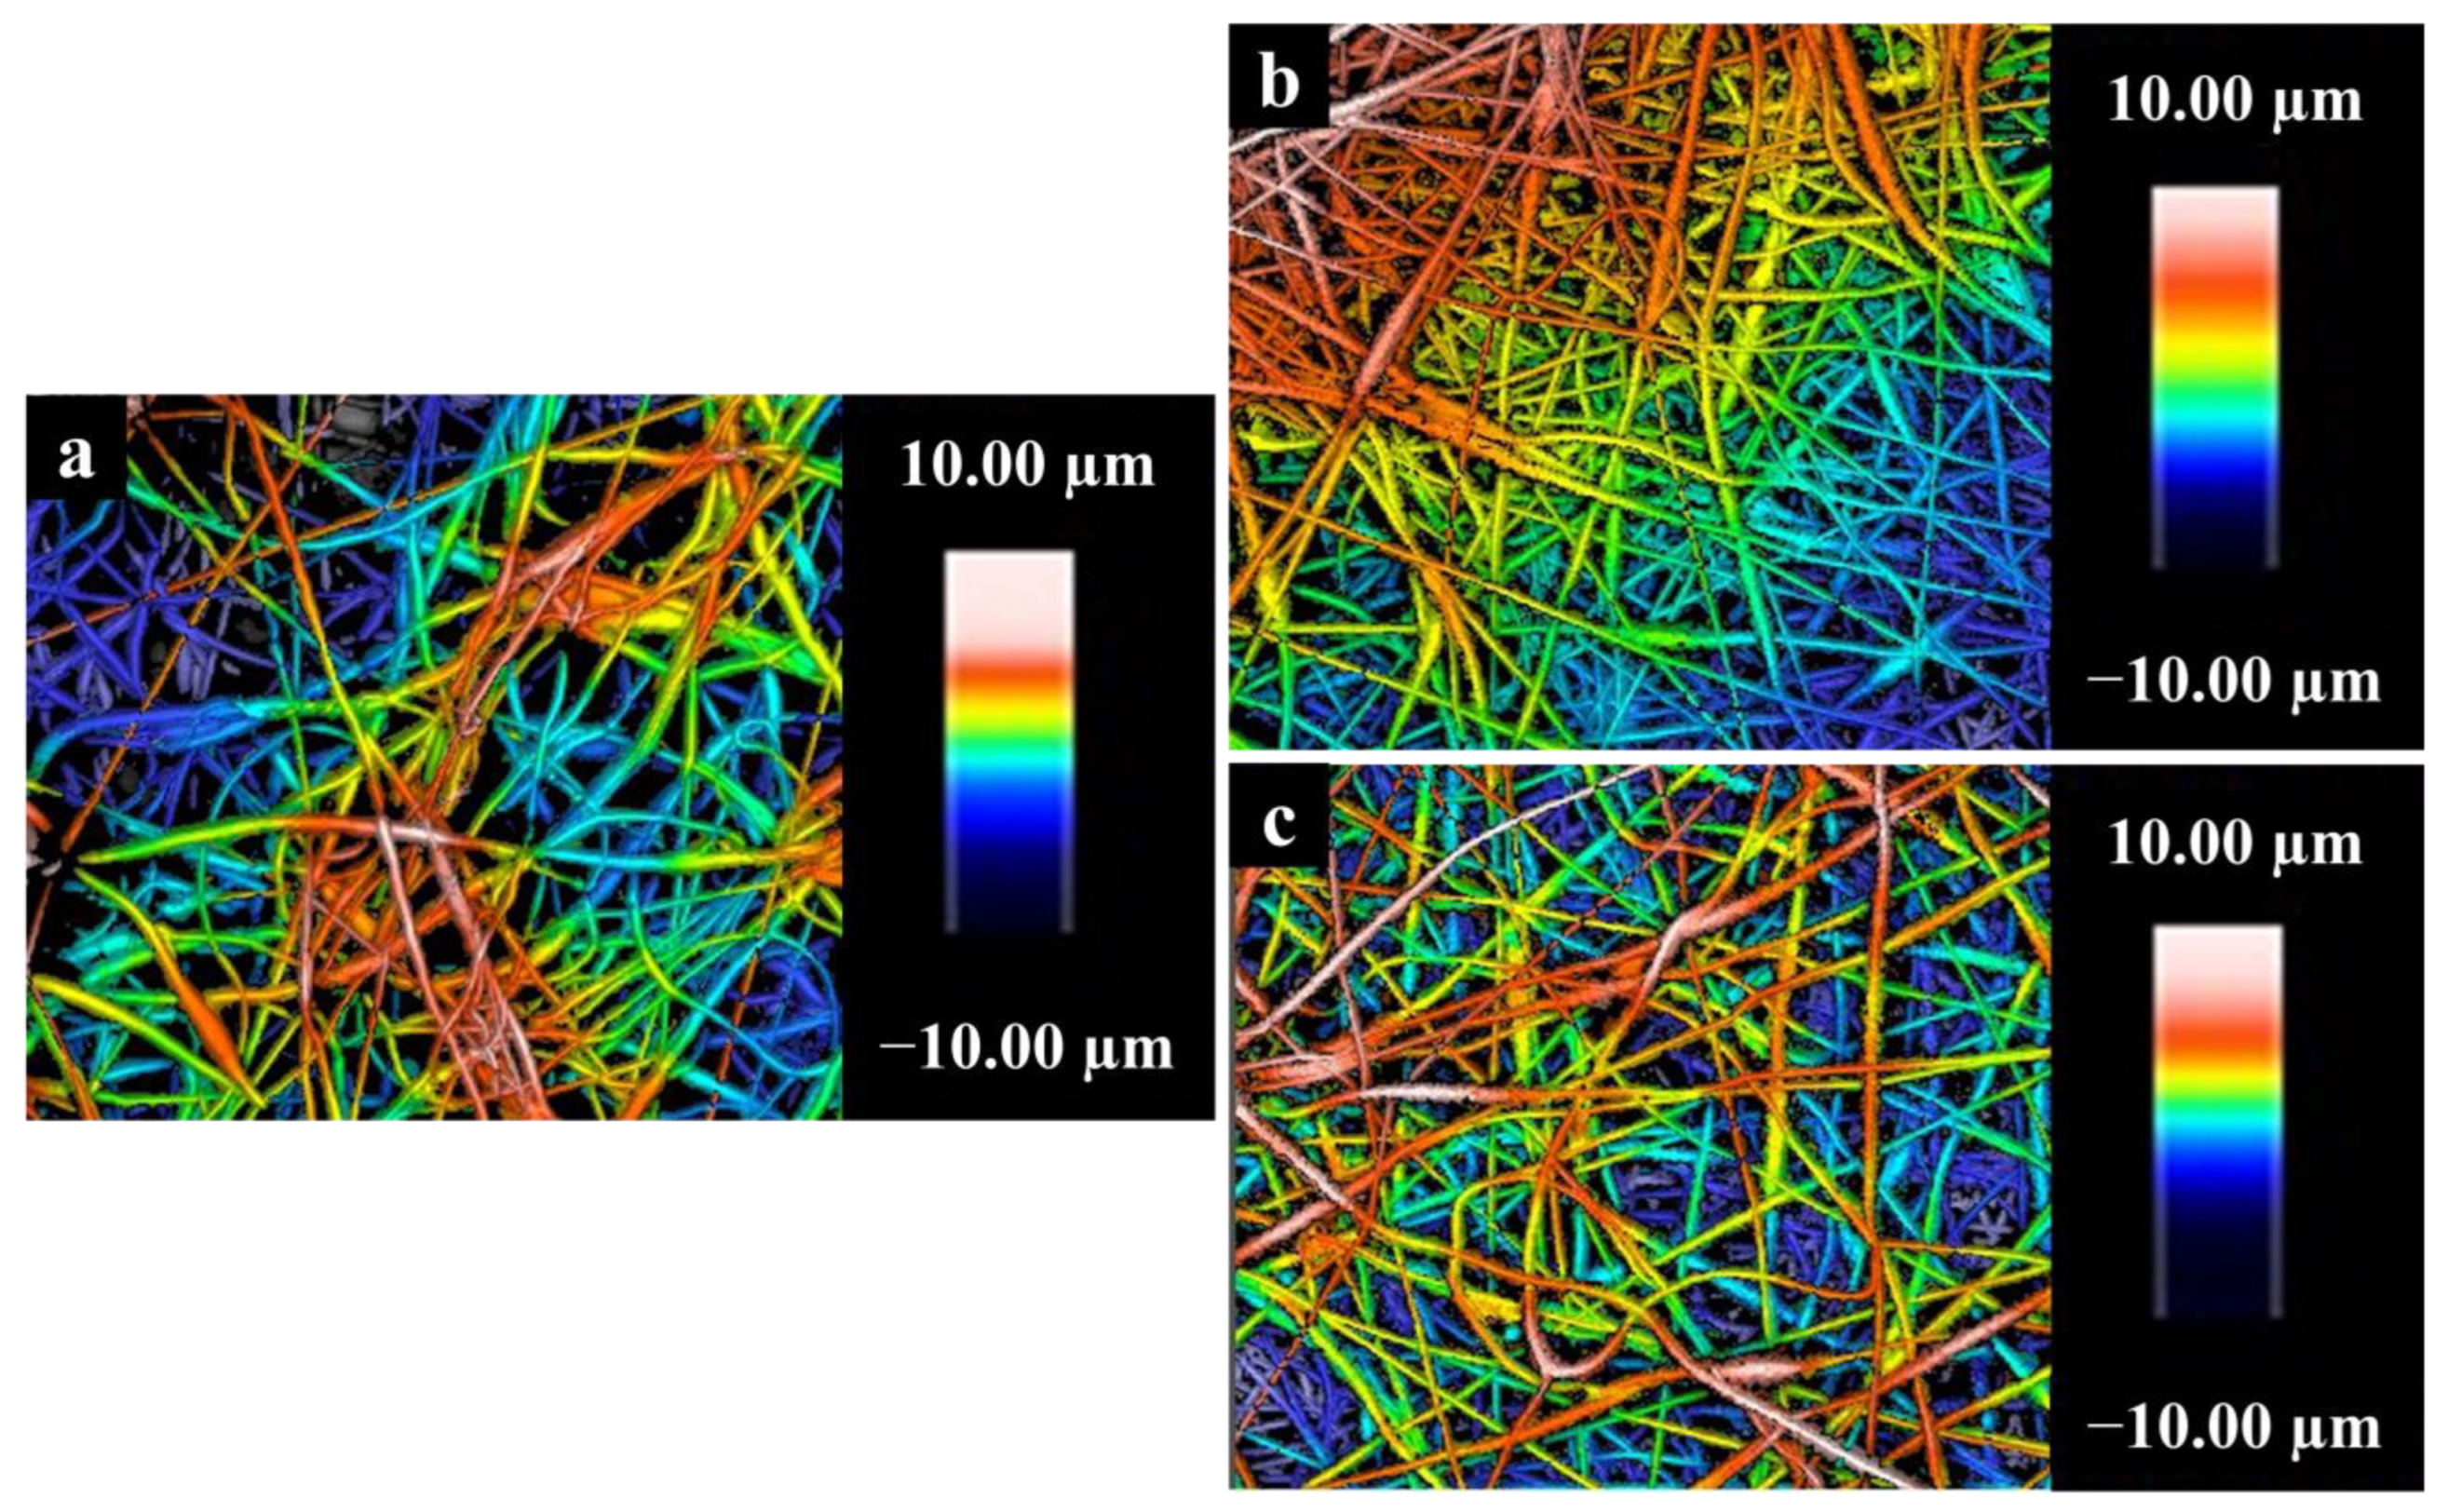
3.9. Surface Roughness of Nanofibers
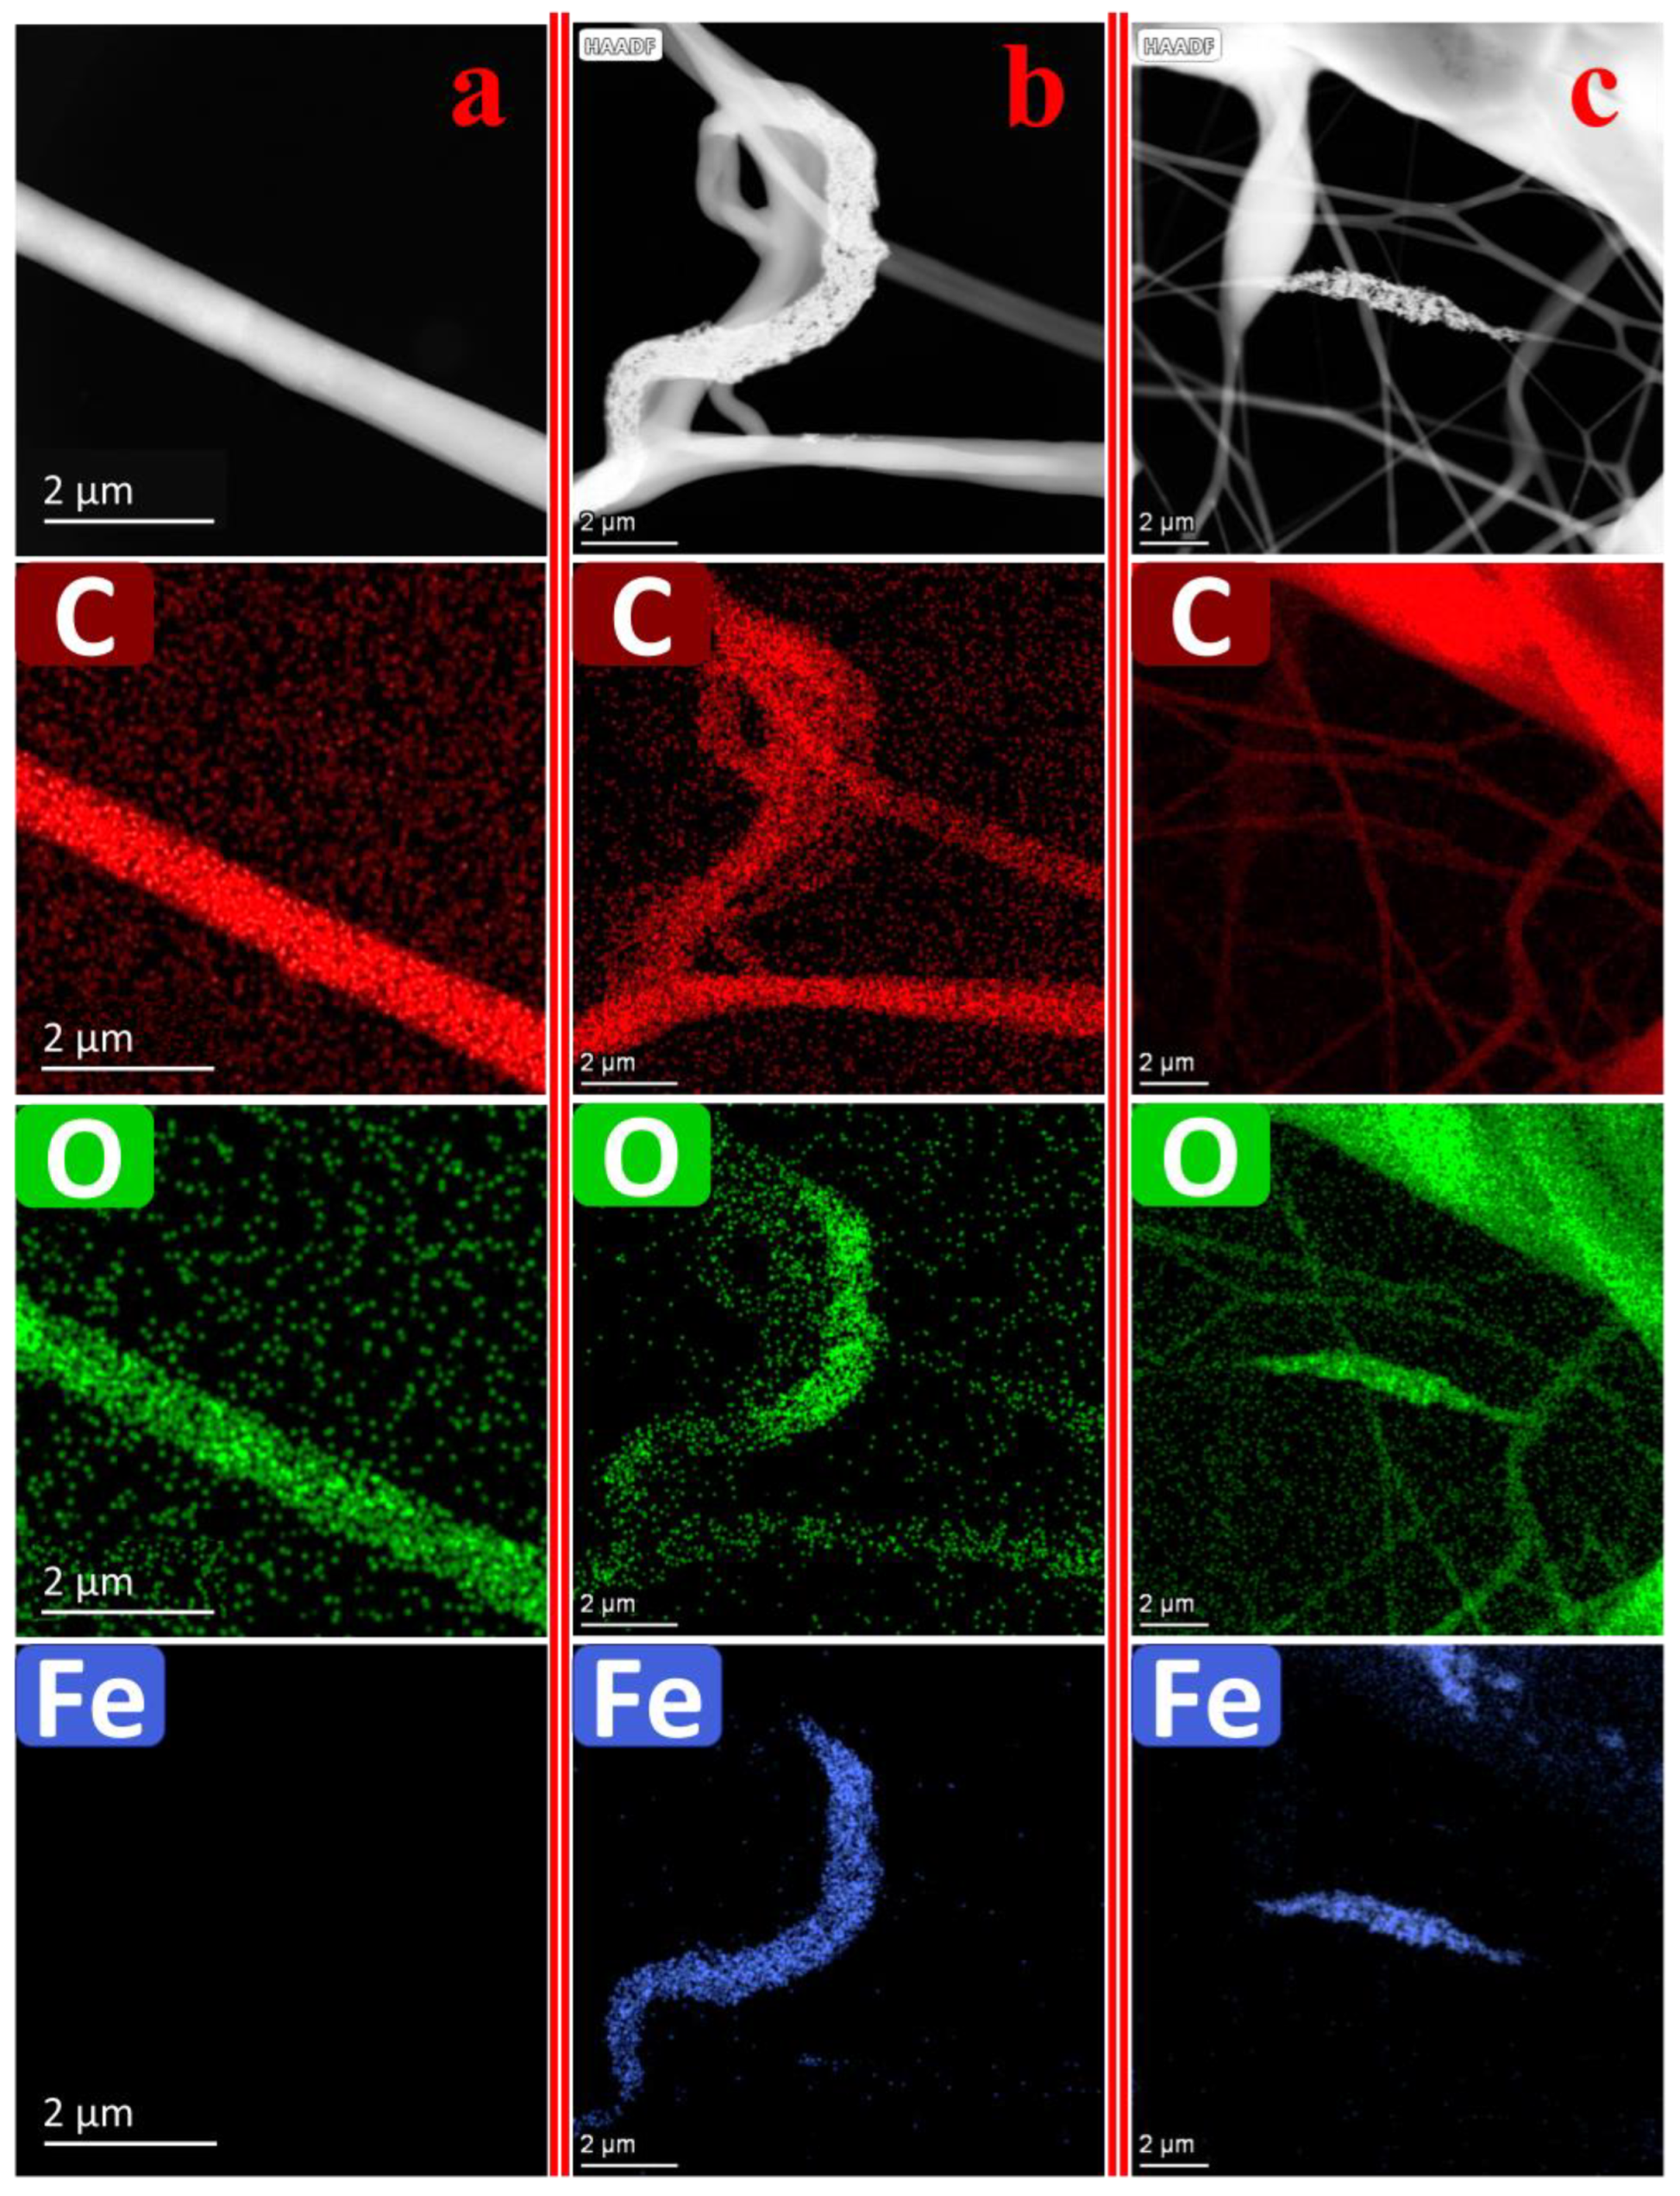
3.10. TEM Imaging of Nanofibers
4. Conclusions
Author Contributions
Funding
Data Availability Statement
Acknowledgments
Conflicts of Interest
References
- Chaudhuri, S.K.; Malodia, L. Biosynthesis of zinc oxide nanoparticles using leaf extract of Calotropis gigantea: Characterization and its evaluation on tree seedling growth in nursery stage. Appl. Nanosci. 2017, 7, 501–512. [Google Scholar] [CrossRef]
- Li, G.; Jiang, Y.; Huang, K.; Ding, P.; Chen, J. Preparation and properties of magnetic Fe3O4—chitosan nanoparticles. J. Alloys Compd. 2008, 466, 451–456. [Google Scholar] [CrossRef]
- Maldonado-Camargo, L.; Unni, M.; Rinaldi, C. Magnetic characterization of iron oxide nanoparticles for biomedical applications. Methods Mol. Biol. 2017, 1570, 47–71. [Google Scholar] [CrossRef] [PubMed]
- Tran, N.; Mir, A.; Mallik, D.; Sinha, A.; Nayar, S.; Webster, T.J. Bactericidal effect of iron oxide nanoparticles on Staphylococcus aureus. Int. J. Nanomed. 2010, 5, 277–283. [Google Scholar] [CrossRef] [Green Version]
- Laurent, S.; Forge, D.; Port, M.; Roch, A.; Robic, C.; Vander Elst, L.N.; Muller, R.; Muller, R.N. Magnetic Iron Oxide Nanoparticles: Synthesis, Stabilization, Vectorization, Physicochemical Characterizations, and Biological Applications. Chem. Rev. 2008, 108, 2064–2110. [Google Scholar] [CrossRef] [PubMed]
- Deepak, P.; Amutha, V.; Kamaraj, C.; Balasubramani, G.; Aiswarya, D.; Perumal, P. Chemical and Green Synthesis of Nanoparticles and Their Efficacy on Cancer Cells; Elsevier Inc.: Amsterdam, The Netherlands, 2019; ISBN 9780081025796. [Google Scholar]
- Toropov, N.; Vartanyan, T. Noble Metal Nanoparticles: Synthesis and Optical Properties. Compr. Nanosci. Nanotechnol. 2019, 61–88. [Google Scholar] [CrossRef]
- Bashir, M.; Riaz, S.; Naseem, S. Effect of pH on Ferromagnetic Iron Oxide Nanoparticles; Elsevier Ltd.: Amsterdam, The Netherlands, 2015; Volume 2. [Google Scholar]
- Yu, X.; Yang, X.; Li, G. Magnetically Separable Fe2O3/g-C3N4 Nanocomposites with Cocoon-Like Shape: Magnetic Properties and Photocatalytic Activities. J. Electron. Mater. 2018, 47, 672–676. [Google Scholar] [CrossRef]
- Noruzi, M.; Zare, D.; Khoshnevisan, K.; Davoodi, D. Rapid green synthesis of gold nanoparticles using Rosa hybrida petal extract at room temperature. Spectrochim. Acta Part A Mol. Biomol. Spectrosc. 2011, 79, 1461–1465. [Google Scholar] [CrossRef]
- Abdullah, J.A.A.; Salah Eddine, L.; Abderrhmane, B.; Alonso-González, M.; Guerrero, A.; Romero, A.; Ahmed, J.A.; Salah, L.; Abderrhmane, B. Green synthesis and characterization of iron oxide nanoparticles by pheonix dactylifera leaf extract and evaluation of their antioxidant activity. Sustain. Chem. Pharm. 2020, 17, 100280. [Google Scholar] [CrossRef]
- Bibi, I.; Kamal, S.; Ahmed, A.; Iqbal, M.; Nouren, S.; Jilani, K.; Nazar, N.; Amir, M.; Abbas, A.; Ata, S.; et al. Nickel nanoparticle synthesis using Camellia Sinensis as reducing and capping agent: Growth mechanism and photo-catalytic activity evaluation. Int. J. Biol. Macromol. 2017, 103, 783–790. [Google Scholar] [CrossRef]
- Abdullah, J.A.A.; Perez-Puyana, V.; Guerrero, A.; Romero, A. Novel hybrid electrospun poly(ε-caprolactone) nanofibers containing green and chemical magnetic iron oxide nanoparticles. J. Appl. Polym. Sci. 2023, 140, e54345. [Google Scholar] [CrossRef]
- ISO 4287:1997/Amd.1:2009; Geometrical Product Specifications (GPS)—Surface Texture: Profile Method—Terms, Definitions and Surface Texture Parameters—Amendment 1: Peak Count Number. International Standard ISO: Geneva, Switzerland, 2009.
- Răcuciu, M.; Oancea, S. ATR-FTIR Versus Raman spectroscopy used for structural analyses of the iron oxide nanoparticles. Rom. Reports Phys. 2019, 71, 1–10. [Google Scholar]
- Zhang, S.; Wu, W.; Xiao, X.; Zhou, J.; Ren, F.; Jiang, C. Preparation and characterization of spindle-like Fe3O4 mesoporous nanoparticles. Nanoscale Res. Lett. 2011, 6, 89. [Google Scholar] [CrossRef] [PubMed] [Green Version]
- Nalbandian, L.; Patrikiadou, E.; Zaspalis, V.; Patrikidou, A.; Hatzidaki, E.N.; Papandreou, C. Magnetic Nanoparticles in Medical Diagnostic Applications: Synthesis, Characterization and Proteins Conjugation. Curr. Nanosci. 2015, 12, 455–468. [Google Scholar] [CrossRef]
- Bertolucci, E.; Galletti, A.M.R.; Antonetti, C.; Marracci, M.; Tellini, B.; Piccinelli, F.; Visone, C. Chemical and magnetic properties characterization of magnetic nanoparticles. Conf. Rec.-IEEE Instrum. Meas. Technol. Conf. 2015, 2015, 1492–1496. [Google Scholar] [CrossRef]
- Manzo, M.; Ahmed, H.; Nasrazadani, S. Study on emission spectral lines of hematite and magnetite for purity’s differentiation. AIP Adv. 2020, 10, 105327. [Google Scholar] [CrossRef]
- Noukelag, S.K.; Arendse, C.J.; Maaza, M. Biosynthesis of hematite phase a-Fe2O3nanoparticles using an aqueous extract of Rosmarinus officinalis leaves. Mater. Today Proc. 2020, 43, 3679–3683. [Google Scholar] [CrossRef]
- Rajeswari, V.D.; Khalifa, A.S.; Elfasakhany, A.; Badruddin, I.A.; Kamangar, S.; Brindhadevi, K. Green and ecofriendly synthesis of cobalt oxide nanoparticles using Phoenix dactylifera L: Antimicrobial and photocatalytic activity. Appl. Nanosci. 2021, 13, 1367–1375. [Google Scholar] [CrossRef]
- Chandrasekar, N.; Mohan Kumar, K.M.; Balasubramnian, K.S.; Karunamurthy, K.; Varadharajan, R. Facile synthesis of iron oxide, iron-cobalt and zero valent iron nanoparticles and evaluation of their anti microbial activity, free radicle scavenginging activity and antioxidant assay. Dig. J. Nanomater. Biostructures 2013, 8, 765–775. [Google Scholar]
- Salgado, P.; Márquez, K.; Rubilar, O.; Contreras, D.; Vidal, G. The effect of phenolic compounds on the green synthesis of iron nanoparticles (FexOy-NPs) with photocatalytic activity. Appl. Nanosci. 2019, 9, 371–385. [Google Scholar] [CrossRef]
- Junaid, M.; Dowlath, H.; Anjum, S.; Khalith, S.B.M.; Varjani, S.; Kumar, S.; Munuswamy, G.; Woong, S.; Jin, W.; Ravindran, B. Comparison of characteristics and biocompatibility of green synthesized iron oxide nanoparticles with chemical synthesized nanoparticles. Environ. Res. 2021, 201, 111585. [Google Scholar] [CrossRef]
- Ayachi, A.A.; Mechakra, H.; Silvan, M.M.; Boudjaadar, S.; Achour, S. Monodisperse α-Fe2O3 nanoplatelets: Synthesis and characterization. Ceram. Int. 2015, 41, 2228–2233. [Google Scholar] [CrossRef]
- Hendricks, S.B.; Pauling, L. The crystal structures of sodium and potassium trinitrides and potassium cyanate and the nature of the trinitride group. J. Am. Chem. Soc. 1925, 47, 2904–2920. [Google Scholar] [CrossRef]
- Maslen, E.N.; Streltsov, V.A.; Streltsova, N.R.; Ishizawa, N. Synchrotron X-ray study of the electron density in α-Fe2O3. Acta Crystallogr. Sect. B Struct. Sci. 1994, 50, 435–441. [Google Scholar] [CrossRef]
- Wright, J.P.; Attfield, J.P.; Radaelli, P.G. Charge ordered structure of magnetite. Phys. Rev. B 2002, 66, 214422. [Google Scholar] [CrossRef]
- Wright, J.P.; Bell, A.M.T.; Attfield, J.P. Variable temperature powder neutron diffraction study of the Verwey transition in magnetite Fe3O4. Solid State Sci. 2000, 2, 747–753. [Google Scholar] [CrossRef]
- Solano, E.; Frontera, C.; Puente Orench, I.; Puig, T.; Obradors, X.; Ricart, S.; Ros, J. Neutron and X-ray diffraction study of ferrite nanocrystals obtained by microwave-assisted growth. A structural comparison with the thermal synthetic route. Corrigendum. J. Appl. Crystallogr. 2014, 47, 1478. [Google Scholar] [CrossRef]
- Fjellvåg, H.; Grønvold, F.; Stølen, S.; Hauback, B.C.; Fjellvag, H.; Gronvold, F.; Stolen, S.; Hauback, B.C. On the crystallographic and magnetic structures of nearly stoichiometric iron monoxide. J. Solid State Chem. 1996, 124, 52–57. [Google Scholar] [CrossRef]
- El Mendili, Y.; Abdelouas, A.; Bardeau, J.-F. Insight into the mechanism of carbon steel corrosion under aerobic and anaerobic conditions. Phys. Chem. Chem. Phys. 2013, 15, 9197. [Google Scholar] [CrossRef]
- Baskar, M.; Patania, A. X-ray Powder Diffraction Data—Identification and Structure Elucidation of Unknown Stone—Rietveld Refinement Approach. J. Biophys. Chem. 2020, 11, 51–61. [Google Scholar] [CrossRef]
- Jiang, X.C.; Yu, A.B.; Yang, W.R.; Ding, Y.; Xu, C.X.; Lam, S. Synthesis and growth of hematite nanodiscs through a facile hydrothermal approach. J. Nanoparticle Res. 2010, 12, 877–893. [Google Scholar] [CrossRef]
- Franco, V.; Conde, C.F.; Conde, A.; Kiss, L.F. Relationship between coercivity and magnetic moment of superparamagnetic particles with dipolar interaction. Phys. Rev. B 2005, 72, 174424. [Google Scholar] [CrossRef]
- Roca, A.G.; Gutiérrez, L.; Gavilán, H.; Fortes Brollo, M.E.; Veintemillas-Verdaguer, S.; del Puerto Morales, M. Design strategies for shape-controlled magnetic iron oxide nanoparticles. Adv. Drug Deliv. Rev. 2019, 138, 68–104. [Google Scholar] [CrossRef]
- Gutiérrez, L.; De La Cueva, L.; Moros, M.; Mazarío, E.; De Bernardo, S.; De La Fuente, J.M.; Morales, M.P.; Salas, G. Aggregation effects on the magnetic properties of iron oxide colloids. Nanotechnology 2019, 30, 112001. [Google Scholar] [CrossRef] [PubMed] [Green Version]
- Wang, Y.; Ahn, J.; Kim, D.; Ren, W.J.J.; Liu, W.; Zhang, Z.D.D.; Choi, C.J.J. Effect of washing process on the magnetic properties of Nd-Fe-B nanoparticles prepared by reduction-diffusion method. J. Magn. Magn. Mater. 2017, 439, 91–94. [Google Scholar] [CrossRef]
- Bélteky, P.; Rónavári, A.; Zakupszky, D.; Boka, E.; Igaz, N.; Szerencsés, B.; Pfeiffer, I.; Vágvölgyi, C.; Kiricsi, M.; Kónya, Z. Are smaller nanoparticles always better? Understanding the biological effect of size-dependent silver nanoparticle aggregation under biorelevant conditions. Int. J. Nanomed. 2021, 16, 3021–3040. [Google Scholar] [CrossRef]
- Alangari, A.; Alqahtani, M.S.; Mateen, A.; Kalam, M.A.; Alshememry, A.; Ali, R.; Kazi, M.; Alghamdi, K.M.; Syed, R. Iron Oxide Nanoparticles: Preparation, Characterization, and Assessment of Antimicrobial and Anticancer Activity. Adsorpt. Sci. Technol. 2022, 2022, 1562051. [Google Scholar] [CrossRef]
- Baldassarre, F.; Cacciola, M.; Ciccarella, G. A predictive model of iron oxide nanoparticles flocculation tuning Z-potential in aqueous environment for biological application. J. Nanoparticle Res. 2015, 17, 1–21. [Google Scholar] [CrossRef]
- Zhao, X.; Zhou, L.; Shahid, M.; Rajoka, R.; Yan, L.; Shao, D.; Zhu, J.; Shi, J.; Huang, Q.; Yang, H. Critical Reviews in Biotechnology Fungal silver nanoparticles: Synthesis, application and challenges. Crit. Rev. Biotechnol. 2018, 38, 817–835. [Google Scholar] [CrossRef] [PubMed]
- Shah, S.T.; Yehye, W.A.; Chowdhury, Z.Z.; Simarani, K. Magnetically directed antioxidant and antimicrobial agent: Synthesis and surface functionalization of magnetite with quercetin. PeerJ 2019, 7, e7651. [Google Scholar] [CrossRef] [Green Version]
- Borbolla-torres, C.I.; Palacios-pineda, L.M.; Ulloa-castillo, N.A.; El, A. Composite Polycaprolactone Membranes Reinforced with TiO2 Nanoparticles. Polymers 2019, 11, 1955. [Google Scholar]
- Villasante, J.; Martin-Lujano, A.; Almajano, M.P. Characterization and application of gelatin films with pecan walnut and shell extract (Carya illinoiensis). Polymers 2020, 12, 1424. [Google Scholar] [CrossRef] [PubMed]
- Phothisarattana, D.; Wongphan, P.; Promhuad, K.; Promsorn, J.; Harnkarnsujarit, N. Biodegradable Poly(Butylene Adipate-Co-Terephthalate) and Thermoplastic Starch-Blended TiO2 Nanocomposite Blown Films as Functional Active Packaging of Fresh Fruit. Polymers 2021, 13, 4192. [Google Scholar] [CrossRef] [PubMed]
- Phothisarattana, D.; Harnkarnsujarit, N. Migration, aggregations and thermal degradation behaviors of TiO2 and ZnO incorporated PBAT/TPS nanocomposite blown films. Food Packag. Shelf Life 2022, 33, 100901. [Google Scholar] [CrossRef]


| Sample | CNMIOPs | |||
|---|---|---|---|---|
| Conditions | 1.2 | 7.5 | 12.5 | |
| Ethanol | Water | |||
| D SEM (nm) | 38.0 ± 1.9 a | 25.4 ± 0.6 c | 27.5 ± 0.5 b | 16.3 ± 4.6 d |
| D TEM (nm) | 30.4 ± 0.5 a | 24.4 ± 0.5 c | 27.1 ± 0.9 b | 21.6 ± 0.3 d |
| D XRD (nm) | 39.5 ± 5.0 a | 26.6 ± 3.3 c | 29.6 ± 0.9 b | 16.8 ± 1.4 d |
| Crystallinity % | 84.8 | 93.0 | 85.6 | 97.0 |
| IC50 (mg/mL) | 12.1 ± 0.3 a | 4.8 ± 1.9 c | 7.1 ± 0.4 b | 2.1 ± 0.3 d |
| CNMIOPs | |||||||
|---|---|---|---|---|---|---|---|
| 1.2 | 7.5 | 12.5 | |||||
| Ethanol | Water | ||||||
| 2θ (°) | planes | 2θ (°) | planes | 2θ (°) | planes | 2θ (°) | planes |
| 24.18 | (110) Fe+3 | 24.24 | (110) Fe+3 | 18.30 | (003) Fe+3 | 18.21 | (111) Fe+2 |
| 27.36 | (113) Fe+3 | 30.30 | (220) Fe+2 | 24.12 | (10-2) Fe+3 | 21.85 | (10-2) Fe+3 |
| 31.70 | (104) Fe+2 | 31.77 | (202) Fe+2 | 26.58 | (113) Fe+2 | 23.93 | (10-4) Fe+2 |
| 33.17 | (211) Fe+3 | 33.20 | (211) Fe+3 | 31.70 | (202) Fe+2 | 26.11 | (220) Fe+2 |
| 35.68 | (10-1) Fe+3 | 33.23 | (212) Fe+2 | 33.17 | (104) Fe+3 | 30.17 | (202) Fe+2 |
| 40.88 | (210) Fe+3 | 35.66 | (311) Fe+2 | 35.62 | (2-10) Fe+3 | 31.76 | (210) Fe+2 |
| 45.47 | (030) Fe+2 | 35.69 | (10-1) Fe+3 | 40.88 | (2-13) Fe+3 | 33.23 | (104) Fe+3 |
| 49.51 | (220) Fe+3 | 40.94 | (210) Fe+3 | 45.47 | (030) Fe+2 | 35.56 | (311) Fe+2 |
| 54.09 | (321) Fe+3 | 43.34 | (400) Fe+2 | 49.45 | (20-4) Fe+3 | 37.51 | (222) Fe+2 |
| 56.48 | (20-1) Fe+3 | 45.59 | (030) Fe+2 | 54.09 | (2-16) Fe+3 | 39.14 | (006) Fe+3 |
| 57.57 | (21-1) Fe+3 | 49.60 | (321) Fe+3 | 56.48 | (3-11) Fe+3 | 40.62 | (2-13) Fe+3 |
| 62.48 | (310) Fe+3 | 54.05 | (422) Fe+2 | 57.66 | (10-8) Fe+3 | 41.96 | (400) Fe+2 |
| 64.02 | (2-1-1) Fe+3 | 57.27 | (511) Fe+2 | 62.48 | (3-14) Fe+3 | 43.14 | (222) Fe+2 |
| 66.21 | (320) Fe+3 | 62.78 | (440) Fe+2 | 64.01 | (300) Fe+3 | 44.55 | (030) Fe+2 |
| 64.08 | (300) Fe+3 | 45.35 | (311) Fe+2 | ||||
| 47.43 | (20-4) Fe+3 | ||||||
| 49.44 | (30-4) Fe+2 | ||||||
| 50.97 | (304) Fe+2 | ||||||
| 51.89 | (422) Fe+2 | ||||||
| 53.67 | (511) Fe+2 | ||||||
| 57.03 | (136) Fe+2 | ||||||
| 60.44 | (234) Fe+2 | ||||||
| 62.72 | (440) Fe+2 | ||||||
| 64.19 | (300) Fe+3 | ||||||
| 66.73 | (531) Fe+2 | ||||||
| 68.23 | (332) Fe+2 | ||||||
| Samples | CNMIOPs | |||||||
|---|---|---|---|---|---|---|---|---|
| Conditions | 1.2 | 7.5 | 12.5 | |||||
| Ethanol | Water | |||||||
| Crystal system | Fe+3 (%) | Fe+2 (%) | Fe+3 (%) | Fe+2 (%) | Fe+3 (%) | Fe+2 (%) | Fe+3 (%) | Fe+2 (%) |
| Monoclinic | 57.5 | 1 | 50.5 | 1.1 | ||||
| Space Group | C 1 2/c 1 | P 1 2/c 1 | C 1 2/c 1 | P 1 2/c 1 | ||||
| Trigonal (Hexagonal Axis) | 0.6 | 1.6 | 30.2 | 16.3 | 13.5 | |||
| Space Group | R-3 c:H | R-3 m:H | R-3 c:H | R-3 m:H | R-3 c:H | |||
| Trigonal (Rhombohedral Axis) | 39.3 | 28 | 1.9 | |||||
| Space Group | R-3 c:R | R-3 c:R | R-3 c:R | |||||
| Rhombohedral | ||||||||
| Space Group | ||||||||
| Cubic | 0.5 | 71.5 | 86.5 | |||||
| Space Group | P 43 3 2 | F d-3 m:2 | F d 3 m:1 | |||||
| Tetragonal | ||||||||
| Total | 97.4 | 2.6 | 28.5 | 71.5 | 82.6 | 17.4 | 13.5 | 86.5 |
| Sample | CNMIOPs | |||
|---|---|---|---|---|
| Conditions | 1.2 | 7.5 | 12.5 | |
| Ethanol | Water | |||
| Ms (emu/g) | 5.0 c | 57.5 b | 1.7 d | 58.3 a |
| Hc (Oe) | 163.1 c | 173.4 b | 268 a | 125.8 d |
| Mr (emu/g) | 1.2 c | 28.8 a | 0.5 d | 23.0 b |
| Mr/Ms | 0.20 | 0.50 | 0.30 | 0.39 |
| ζ (mV) | −21.0 b | −17.0 c | −23.8 a | −14.7 d |
| Sample | Diameter (nm) | Ra (nm) | Rq (nm) |
|---|---|---|---|
| a | 256 ± 106 | 17.7 ± 10.4 | 20.8 ± 12.9 |
| b | 314 ± 118 | 56.6 ± 11.5 | 64.7 ± 12.4 |
| c | 352 ± 147 | 60.1 ± 22.0 | 71.2 ± 23.1 |
Disclaimer/Publisher’s Note: The statements, opinions and data contained in all publications are solely those of the individual author(s) and contributor(s) and not of MDPI and/or the editor(s). MDPI and/or the editor(s) disclaim responsibility for any injury to people or property resulting from any ideas, methods, instructions or products referred to in the content. |
© 2023 by the authors. Licensee MDPI, Basel, Switzerland. This article is an open access article distributed under the terms and conditions of the Creative Commons Attribution (CC BY) license (https://creativecommons.org/licenses/by/4.0/).
Share and Cite
Abdullah, J.A.A.; Díaz-García, Á.; Law, J.Y.; Romero, A.; Franco, V.; Guerrero, A. Quantifying the Structure and Properties of Nanomagnetic Iron Oxide Particles for Enhanced Functionality through Chemical Synthesis. Nanomaterials 2023, 13, 2242. https://doi.org/10.3390/nano13152242
Abdullah JAA, Díaz-García Á, Law JY, Romero A, Franco V, Guerrero A. Quantifying the Structure and Properties of Nanomagnetic Iron Oxide Particles for Enhanced Functionality through Chemical Synthesis. Nanomaterials. 2023; 13(15):2242. https://doi.org/10.3390/nano13152242
Chicago/Turabian StyleAbdullah, Johar Amin Ahmed, Álvaro Díaz-García, Jia Yan Law, Alberto Romero, Victorino Franco, and Antonio Guerrero. 2023. "Quantifying the Structure and Properties of Nanomagnetic Iron Oxide Particles for Enhanced Functionality through Chemical Synthesis" Nanomaterials 13, no. 15: 2242. https://doi.org/10.3390/nano13152242