Article

Effect of Water on CO2 Adsorption on CaNaY Zeolite: Formation of Ca2+(H2O)(CO2), Ca2+(H2O)(CO2)2 and Ca2+(H2O)2(CO2) Complexes

by
Nikola L. Drenchev
1,
Boris L. Shivachev
2,
Lubomir D. Dimitrov
1 and
Konstantin I. Hadjiivanov
1,*
1
Institute of General and Inorganic Chemistry, Bulgarian Academy of Sciences, 1113 Sofia, Bulgaria
2
Institute of Mineralogy and Crystallography, Bulgarian Academy of Sciences, 1113 Sofia, Bulgaria
*
Author to whom correspondence should be addressed.
Nanomaterials 2023, 13(16), 2278; https://doi.org/10.3390/nano13162278
Submission received: 11 July 2023 / Revised: 31 July 2023 / Accepted: 5 August 2023 / Published: 8 August 2023

Abstract

:
Efficient CO2 capture materials must possess a high adsorption capacity, suitable CO2 adsorption enthalpy and resistance to water vapor. We have recently reported that Ca2+ cations exchanged in FAU zeolite can attach up to three CO2 molecules. Here we report the effect of water on the adsorption of CO2. Formation of Ca2+(H2O)(CO2), Ca2+(H2O)(CO2)2 and Ca2+(H2O)2(CO2) mixed ligand complexes were established. The Ca2+(H2O)(CO2) species are readily formed even at ambient temperature and are characterized by ν(12CO2) and ν(13CO2) infrared bands at 2358 and 2293 cm−1, respectively. The Ca2+(H2O)(CO2)2 species are produced at low temperature and are identified by a ν(13CO2) band at 2291 cm−1. In the presence of large amounts of water, Ca2+(H2O)2(CO2) complexes were also evidenced by ν(12CO2) and ν(13CO2) bands at 2348 and 2283 cm−1, respectively. The results demonstrate that, although it has a negative effect on CO2 adsorption uptake, water in moderate amounts does not block CO2 adsorption sites.

1. Introduction

One of the main current challenges facing society is global warming. It is mainly caused by CO2 emissions, and much of atmospheric carbon dioxide originates from human activity [1]. Therefore, CO2 capture is a very important process [2,3]. There are various ways to control CO2 emissions, and adsorption is considered very promising. Developed adsorbents can be conditionally divided into two main groups. One of them relies on reactive adsorption: CO2 is transformed into various surface species (e.g., hydrogen carbonates [4]), which then decompose during adsorbent regeneration. The second is based on a type of adsorption where CO2 retains its chemical identity. In this case, CO2 is usually bound to the surface by one or both of its oxygen atoms.
There are many works proposing the utilization of sodium-exchanged faujasite zeolites prepared from coal fly ash as CO2 adsorbents [5,6,7,8,9,10,11]. Indeed, to ensure a high adsorption capacity, it is necessary to use zeolites with a high concentration of exchanged cations, i.e., having a low silica-to-alumina ratio, as faujasites. However, we started our studies with NaY zeolites, because the overly high density of sodium cations in NaX has been suggested to lead to the formation of bridging CO2 ad-species [12,13].
We previously reported that two small molecules, such as CO and N2, can be simultaneously bound to one Na+ cation in NaY [14]. Thus, it was logical to expect that these Na+ sites could also be able to coordinate two CO2 molecules. Moreover, two CO2 molecules have been reported to simultaneously bind to one Na+ site in Na–ZSM-5 [15,16]. Indeed, in a recent study [17], we demonstrated that one Na+ site in the SII position in NaY can attach two CO2 molecules. However, the second molecule binds at low temperatures or at very high CO2 equilibrium pressures, and therefore the process is not suitable for practical use.
To overcome this problem, we decided to change the nature of the exchanged cation. In making the selection, we considered the following factors: (i) at first, the cation should be large enough in order to be able to form geminal adsorption complexes [18,19], but not too large to significantly reduce the pore volume; (ii) the cation must be more electrophilic than Na+ in order to form more stable complexes with CO2, thereby shifting the equilibrium to higher temperatures; and (iii) the cation should be in a stable oxidation state, preferably +1 or +2 to be able to occupy a cationic position in zeolites.
Considering the possible candidates, we selected Ca2+ cations as the most suitable. Indeed, the cationic radius of Ca2+ (114 pm) is very close to that of Na+ (116 pm) [20]. Calcium is stable in the +2 oxidation state, and this high charge results in a high electrophilicity. Another important fact in favor of the choice of Ca2+ is that in CaY zeolites three CO molecules can be simultaneously coordinated to one Ca2+ site [21,22] (vs. two CO molecules to one Na+ site in NaY) [14], suggesting that a similar situation can be realized with CO2.
In the pilot communication to this study [23], we reported that indeed three CO2 molecules can be attached to one Ca2+ site in CaNaY. The one-ligand Ca2+–OCO species are produced at very low equilibrium pressure. Increasing the CO2 pressure leads to formation of diligand Ca2+(CO2)2 species, which become dominant at pressures above 1 mbar. At pressures of 65 mbar and above (or at low temperature), a third CO2 molecule attaches to the same Ca2+ site, thereby forming Ca2+(CO2)3 adducts.
Adsorption and desorption of CO2 depend on many factors: the nature and chemical composition of the adsorbent, its pore structure, temperature, pressure and the presence of other gases. Several conditions were highlighted for an effective adsorbent for CO2 capture [24]: high CO2 adsorption capacity and high CO2 selectivity, fast kinetics, low heat capacity, stability under extensive cycling and low-cost raw materials.
In particular, adsorption processes are usually strongly affected by water, and this is important from a practical point of view, because water is usually present in waste gases. In some cases, a small amount of water has a positive effect on CO2 adsorption uptake [25,26,27,28] (e.g., by creating OH groups which then act as adsorption sites [25] or by promoting the formation of hydrogen-carbonates [26,28]). However, at high concentrations, water usually suppresses CO2 adsorption because it concurrently occupies the adsorption sites [29,30]. Therefore, an important step in the design of CO2 capture materials is to study the effect of water in detail. A deep knowledge of this mechanism can help in developing strategies to minimize the negative effect of water.
In this study, we report a comprehensive picture of CO2 adsorption on CaNaY zeolites and how the process is affected by water vapor. In the pilot communication [23], we mainly reported the results with a CaNaY sample with a low calcium content in order to achieve an optimal intensity of the IR bands. Here we concentrate on a CaNaY sample with a high exchange degree that demonstrates a good adsorption capacity as well as examine the effect of water on the CO2 adsorption process. Although the main technique we used was in situ IR spectroscopy, we also utilized other complementary techniques, such as isothermal adsorption measurements, XRD, TEM with EDX elemental mapping and thermal analysis. We have found that although water has a negative effect on CO2 adsorption, it is mitigated due to the formation of mixed-ligand Ca2+(H2O)(CO2) species.

2. Materials and Methods

The parent NaY sample was provided by Grace Davison (SP No. 6 5257.0101, Si/Al ratio of 2.6) and was used in previous studies [14,17]. The CaNaY sample was prepared by conventional ion exchange of NaY with a 0.05 M CaCl2 solution (80 mL solution per 1 g zeolite). The procedure was carried out twice for 4 h at 363 K under continuous stirring. After each exchange procedure, the sample was washed extensively with deionized water and dried overnight at 393 K. Then the sample was calcined at 853 K for 5 h (heating rate 3 K min−1) and the described ion-exchange procedure was repeated. The sample thus prepared contained 3.96 at % Ca and 0.45 at % Na.
The FTIR spectra were recorded in transmission mode with a Thermo Scientific Nicolet 6700 FTIR spectrometer equipped with an MCT-A detector, accumulating 64 scans at a spectral resolution of 2 cm−1. A self-supporting pellet (ca. 10 mg cm−2) was prepared from the sample powder and treated directly in a purpose-made IR cell allowing measurement at ambient and low (down to ca. 100 K) temperatures. The IR cell was connected to a vacuum-adsorption apparatus with a residual pressure below 10−3 Pa. Prior to the adsorption experiments, the sample was activated by heating in O2 at 673 K followed by vacuum treatment at the same temperature. When appropriate, the spectrum of the activated sample was subtracted from the spectra registered after adsorption (background corrected spectra). A video article visualizing our experimental protocol is available [25].
CO2 (99.995%) was supplied by Messer. The variable temperature IR (VTIR) CO2 adsorption measurements were performed using a NORHOF LN2 Microdosing System #915. It allows maintaining a preset temperature between 100 and 293 K by adjusting the flow of liquid nitrogen vapor cooling the sample.
The chemical composition of the samples was determined by Energy dispersive X-ray analysis (EDX/TEM, JEOL—2100, 200 kV).
The CO2 adsorption isotherms were measured at 274 K using a Micromeritics 3Flex automatic surface area and pore size analyzer. Prior to the measurements, the sample was activated in vacuum at 443 or 673 K.
Thermogravimetric (TG) analyses and differential thermal analysis (DTA) were carried out on a SETSYS2400, SETARAM analyzer in the temperature range from 298 to 973 K. Al2O3 crucibles were used, and a heating rate of 10 K min−1 at static air was applied.
In situ HTXRD patterns of the CaNaY sample were collected using an AntonParr 600TTK XRD sample stage mounted on an Empyrean Powder X-ray diffractometer (Malvern Panalytical, The Netherlands) in the 3–90° 2θ range using Cu radiation (λ = 1.5406 Å) and a PIXcel3D detector. The powder sample was loaded in the 600TTK cuvette and dehydrated in situ at 443 K and 640 mbar for 1h (heating rate RT to 443 was 5 K min−1, TA Instruments degassing station). Samples were cooled to 298 K and the diffraction pattern of the dehydrated CaNaY sample was collected. Subsequently, the residual atmosphere inside the chamber was replaced by CO2 (avoiding contact with ambient atmosphere). After 30 min of equilibration at 298 K and 500 mbar CO2, the CO2-CaNaY pattern was collected.

3. Results and Discussion

3.1. Basic Characterization of the Samples

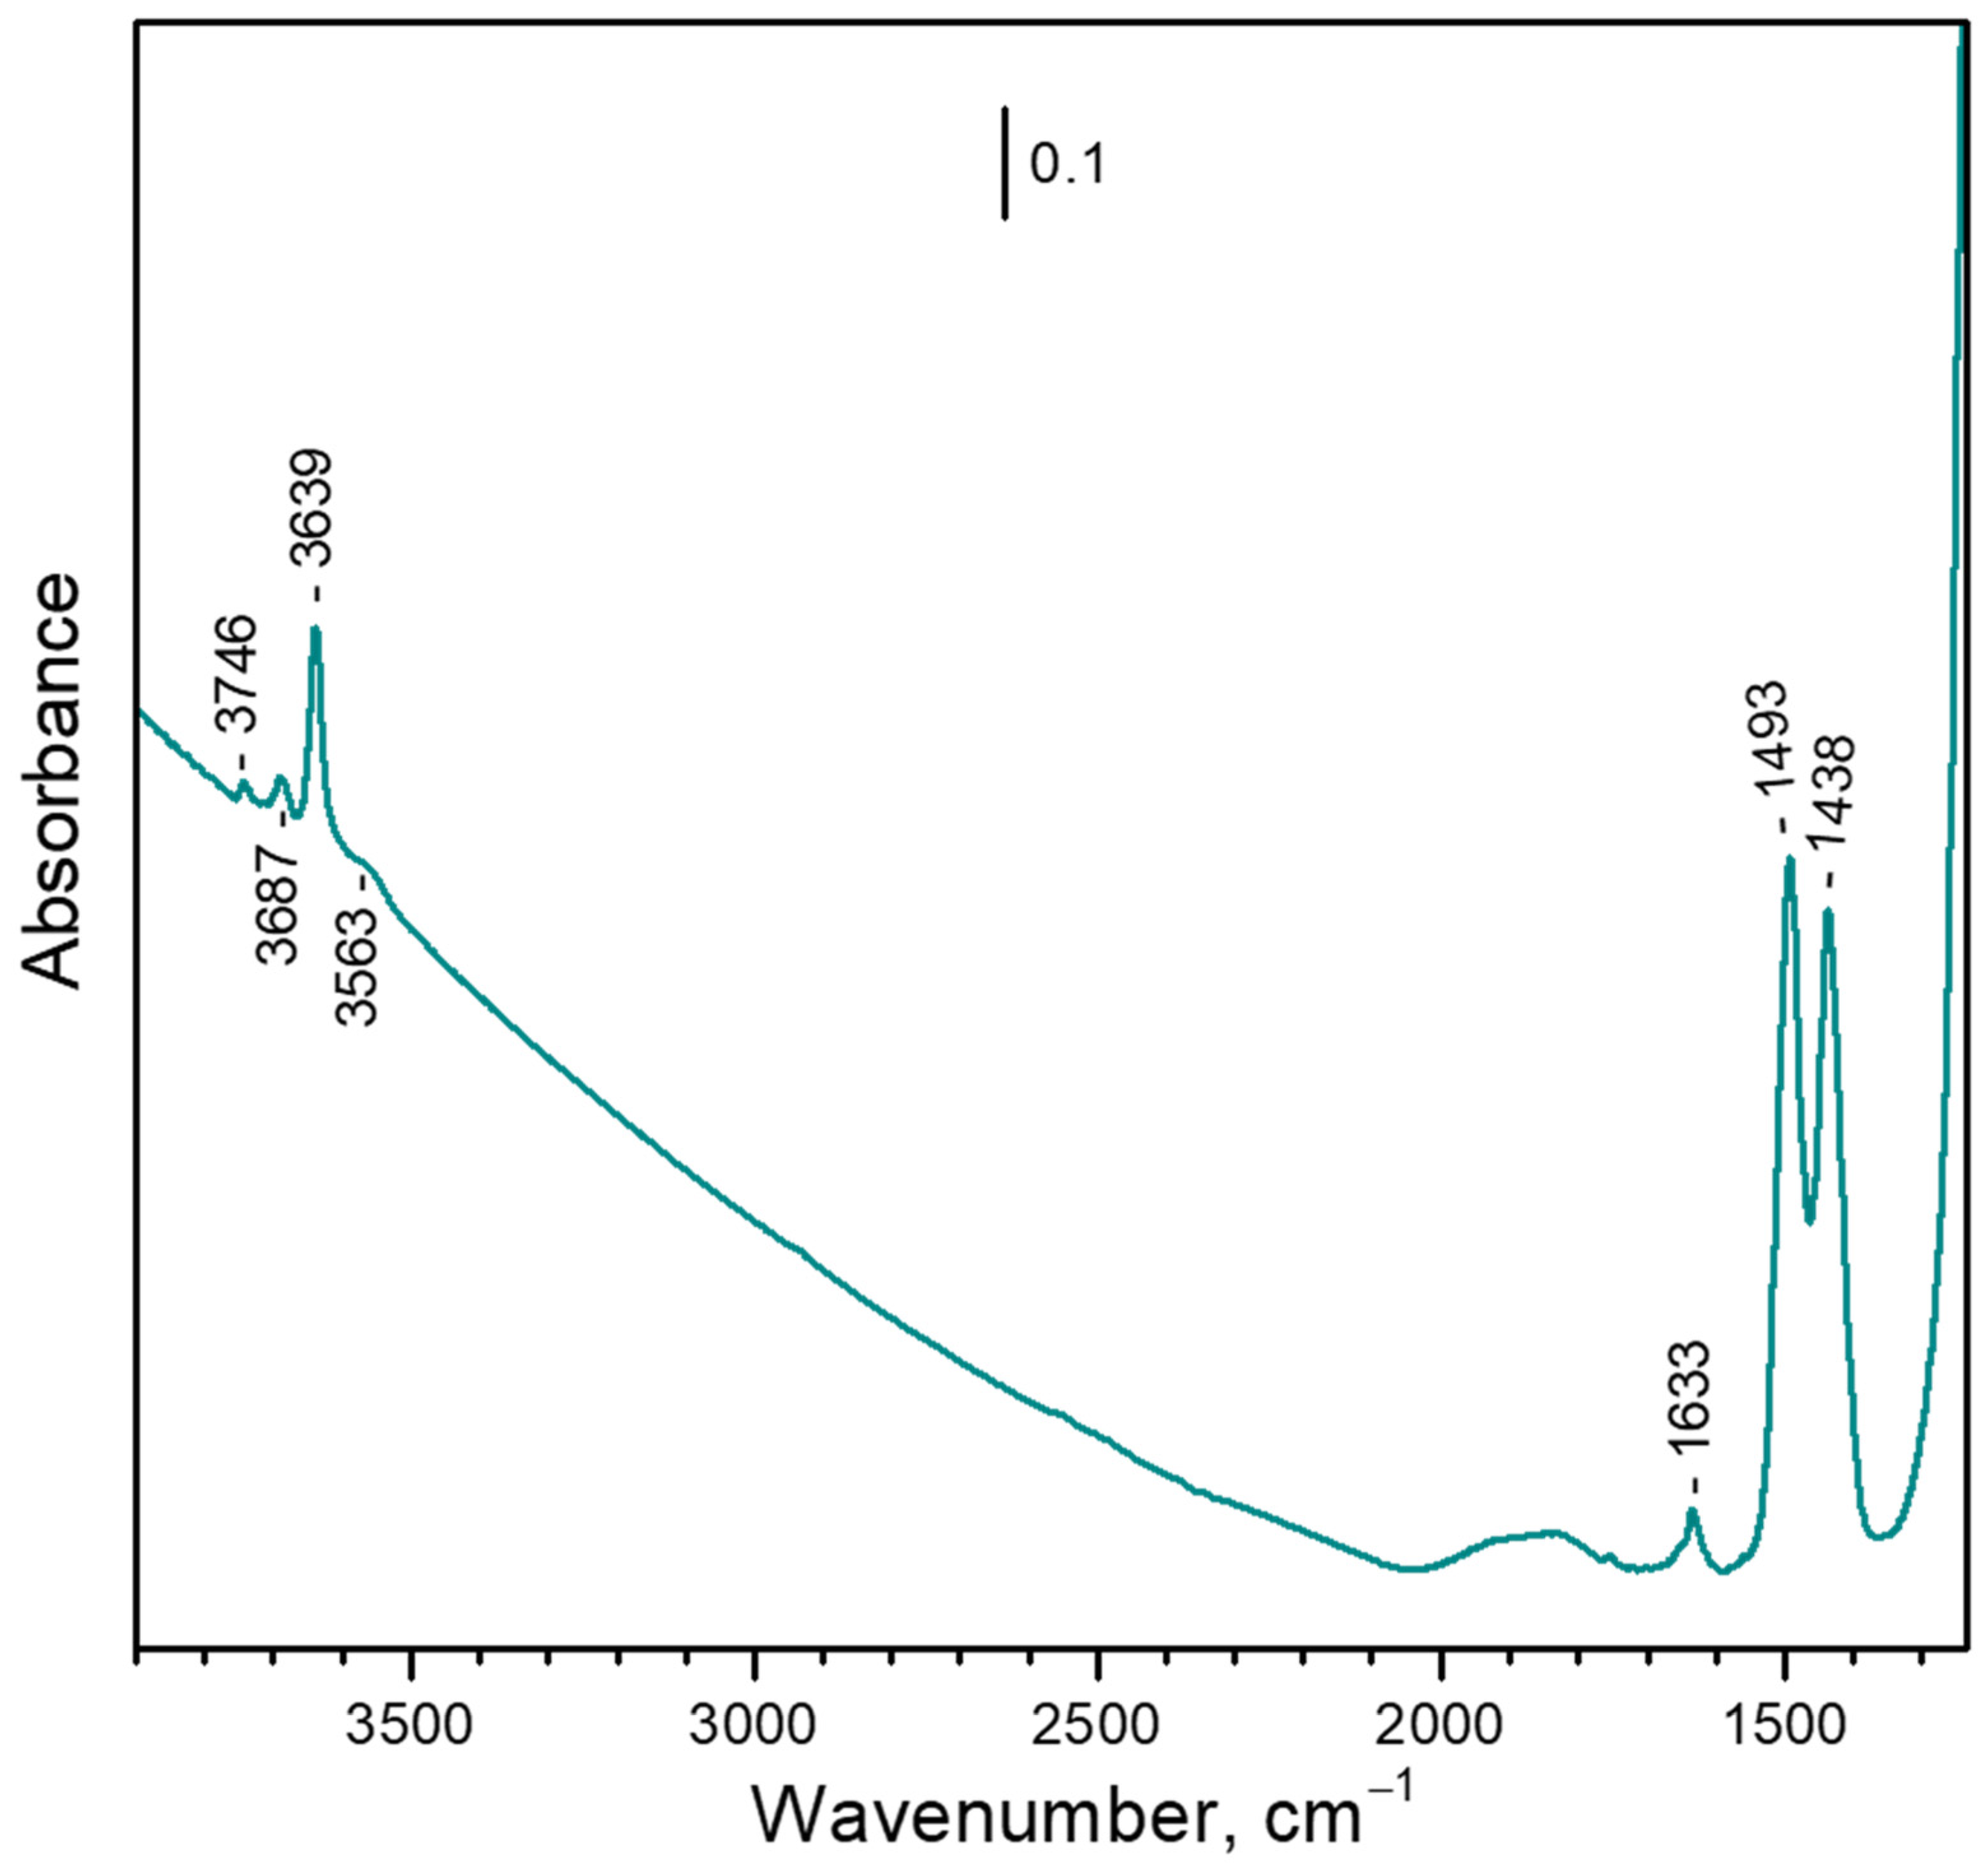
3.1.1. Background IR Spectrum

The background IR spectrum of the sample (Figure 1, spectrum a) is typical of metal-exchanged faujasite. Zeolite skeletal vibrations are observed below 1300 cm−1, as well as several combination modes in the 2050–1700 cm−1 region. Two bands at 1493 and 1438 cm−1 indicate the admixture of calcium carbonate [31]. A weak feature at 1633 cm−1 is attributed to the δ(H2O) modes and shows that some water remains in the sample even after this evacuation temperature. Because the feature was practically the same after evacuation at 573 K, we infer that this residual water is occluded in some pores with blocked entrances. In the ν(OH) region, a band at 3639 cm−1 (absent from the spectrum of the parent NaY sample) dominates and indicates that some bridging hydroxyls were formed during the synthesis procedure [32]. A very weak band at 3746 cm−1 characterizes external silanols. Two bands at 3687 and 3563 cm−1 together with the feature at 1633 cm−1 are associated with the occluded water.

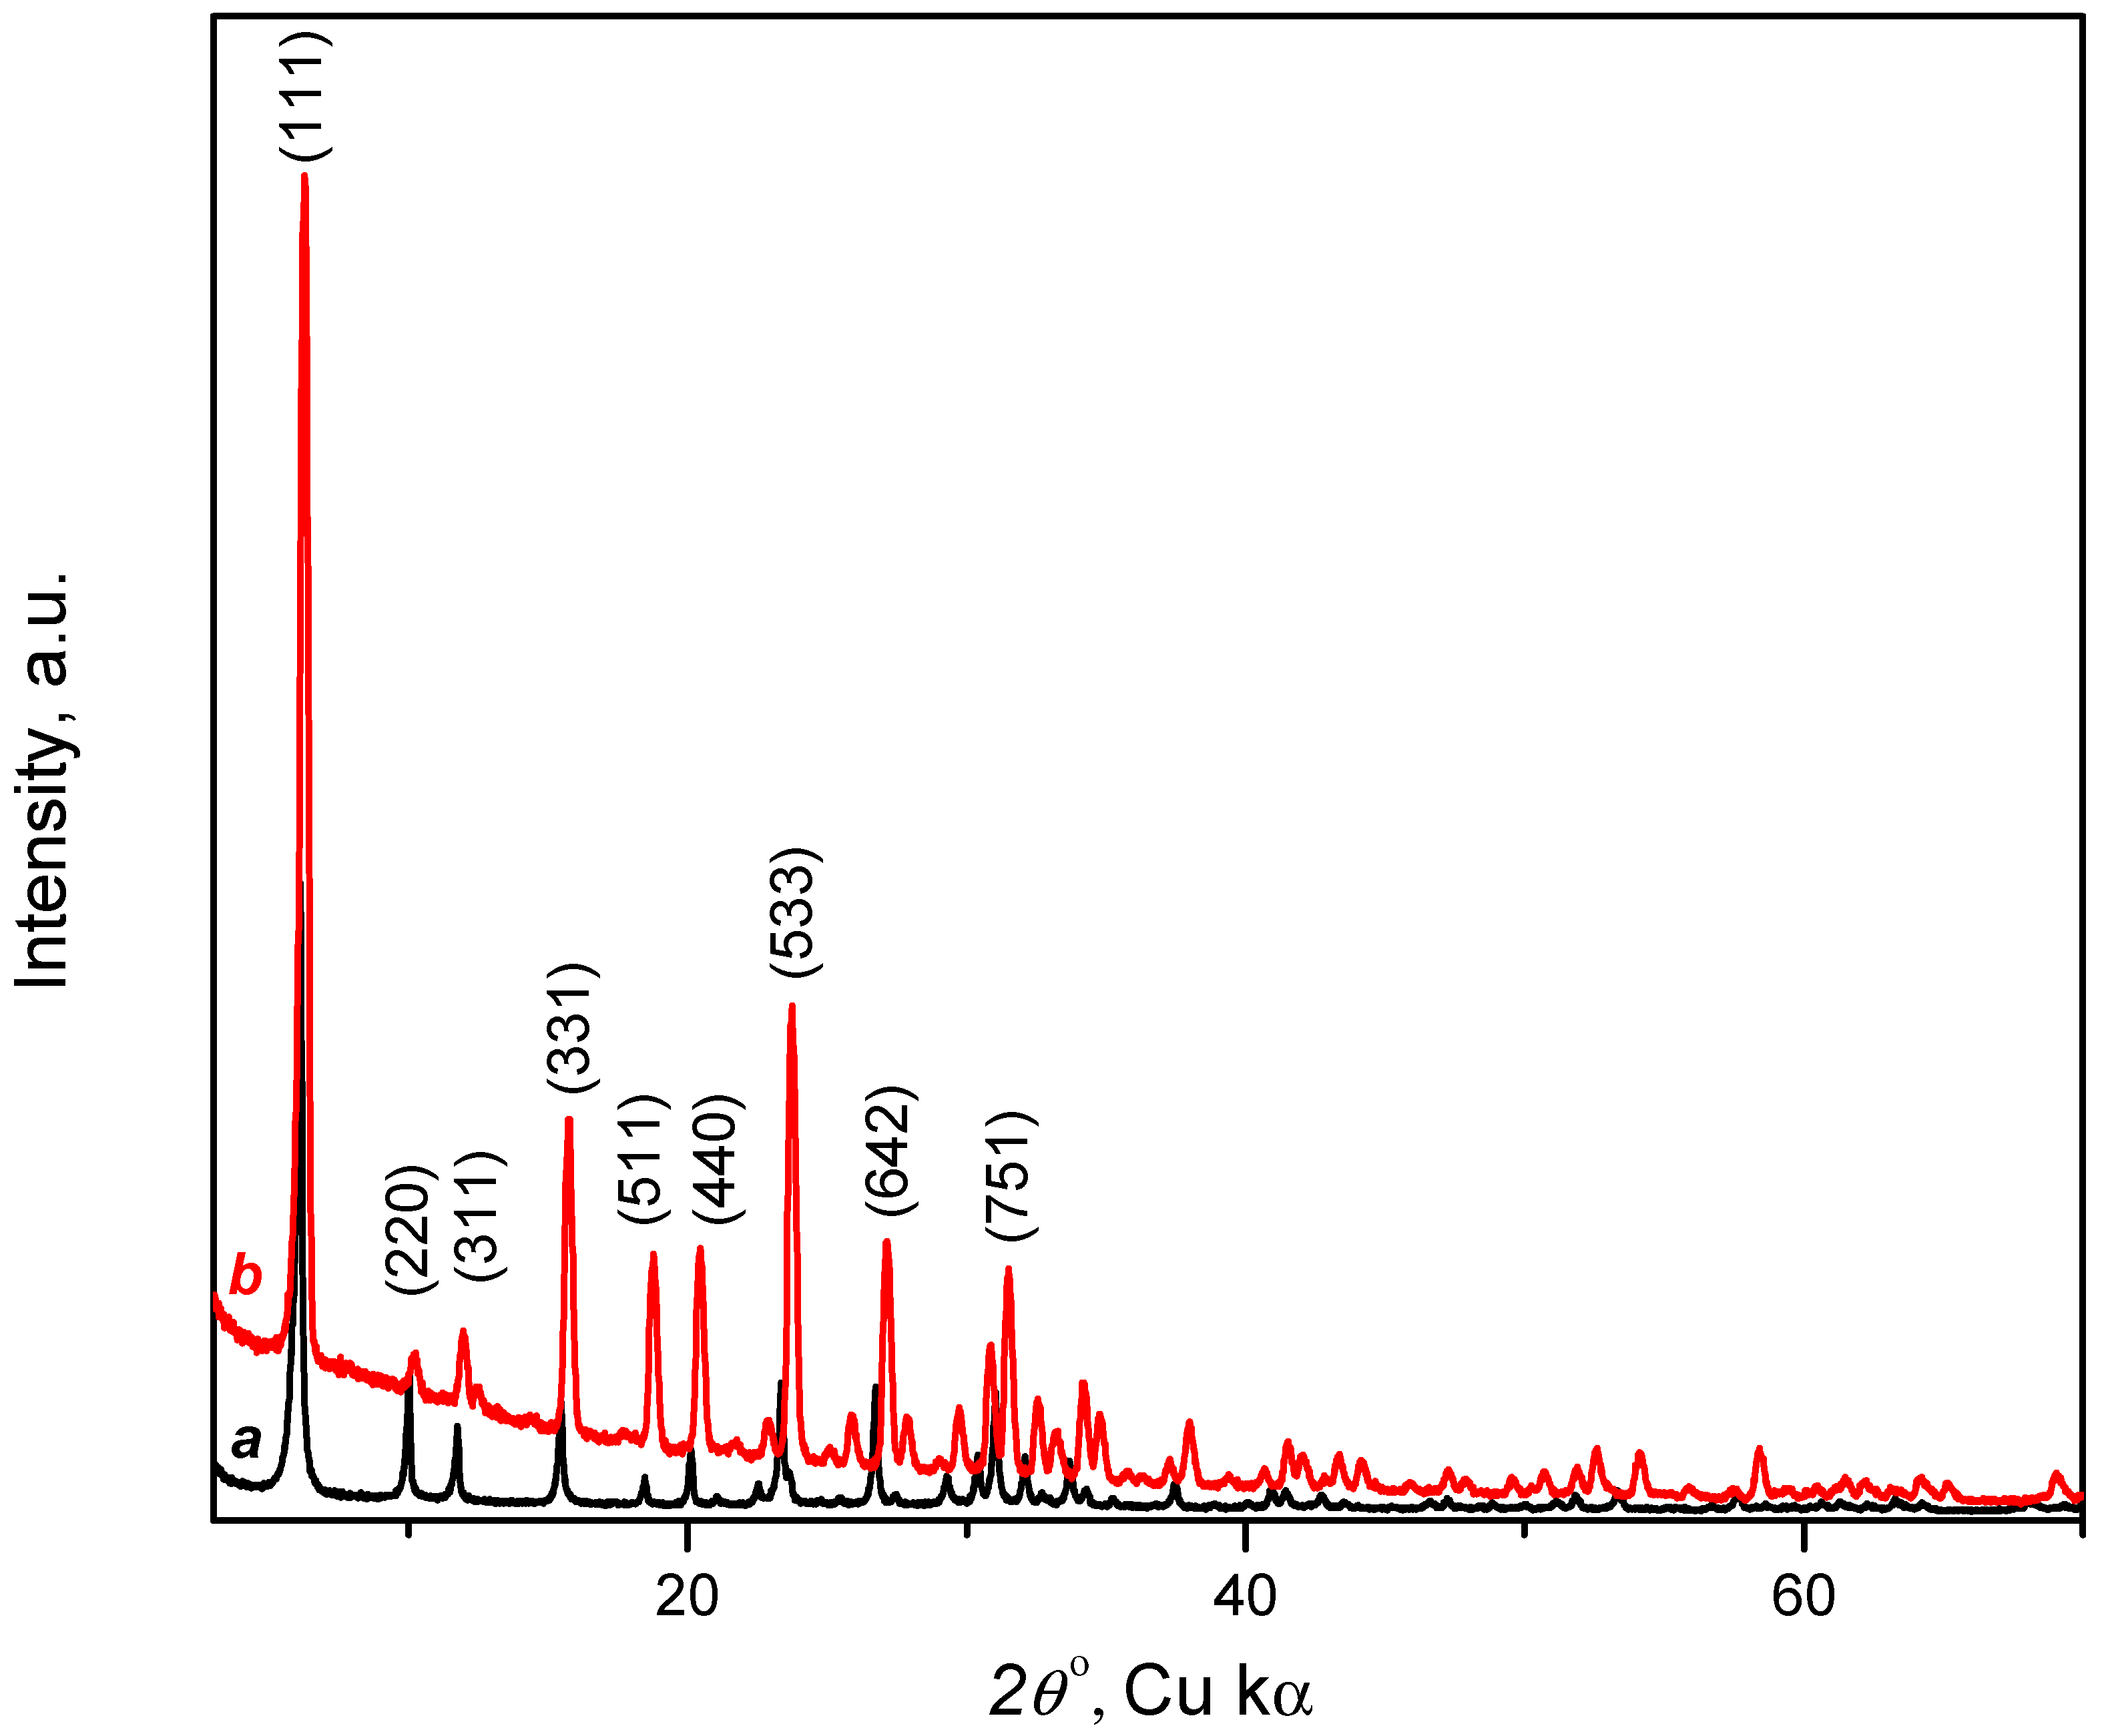
3.1.2. X-ray Diffraction

The diffraction patterns of the CaNaY sample dehydrated at 443 K are shown in Figure 2. The pattern is in agreement with published results on dehydrated CaY zeolite [33], which confirms that the faujasite structure has been preserved after the ion-exchange procedure.

3.1.3. Electron Microscopy and EDX

According to the EDX analysis, the distribution of Si, Al, Na and Ca for our sample is uniform for all these elements. The results also revealed that the Si-to-Al molar ratio (2.65) is very close to that reported for the parent NaY zeolite (2.6) (see Table S1 from the Supporting information). The (2Ca + Na)/Al ratio (0.92) is slightly lower than unity, which is justified by the presence of some acidic hydroxyls (IR band at 3639 cm−1).

3.2. Adsorption of CO2 in Absence of Water

The general picture of CO2 adsorption on dehydrated CaNaY material was reported elsewhere [23]. However, in order to obtain optimal intensities of the bands, the work concerned mainly results in a sample with low-calcium content and having a large amount of residual sodium. Here we provide some details from a CaNaY sample with a higher calcium content.

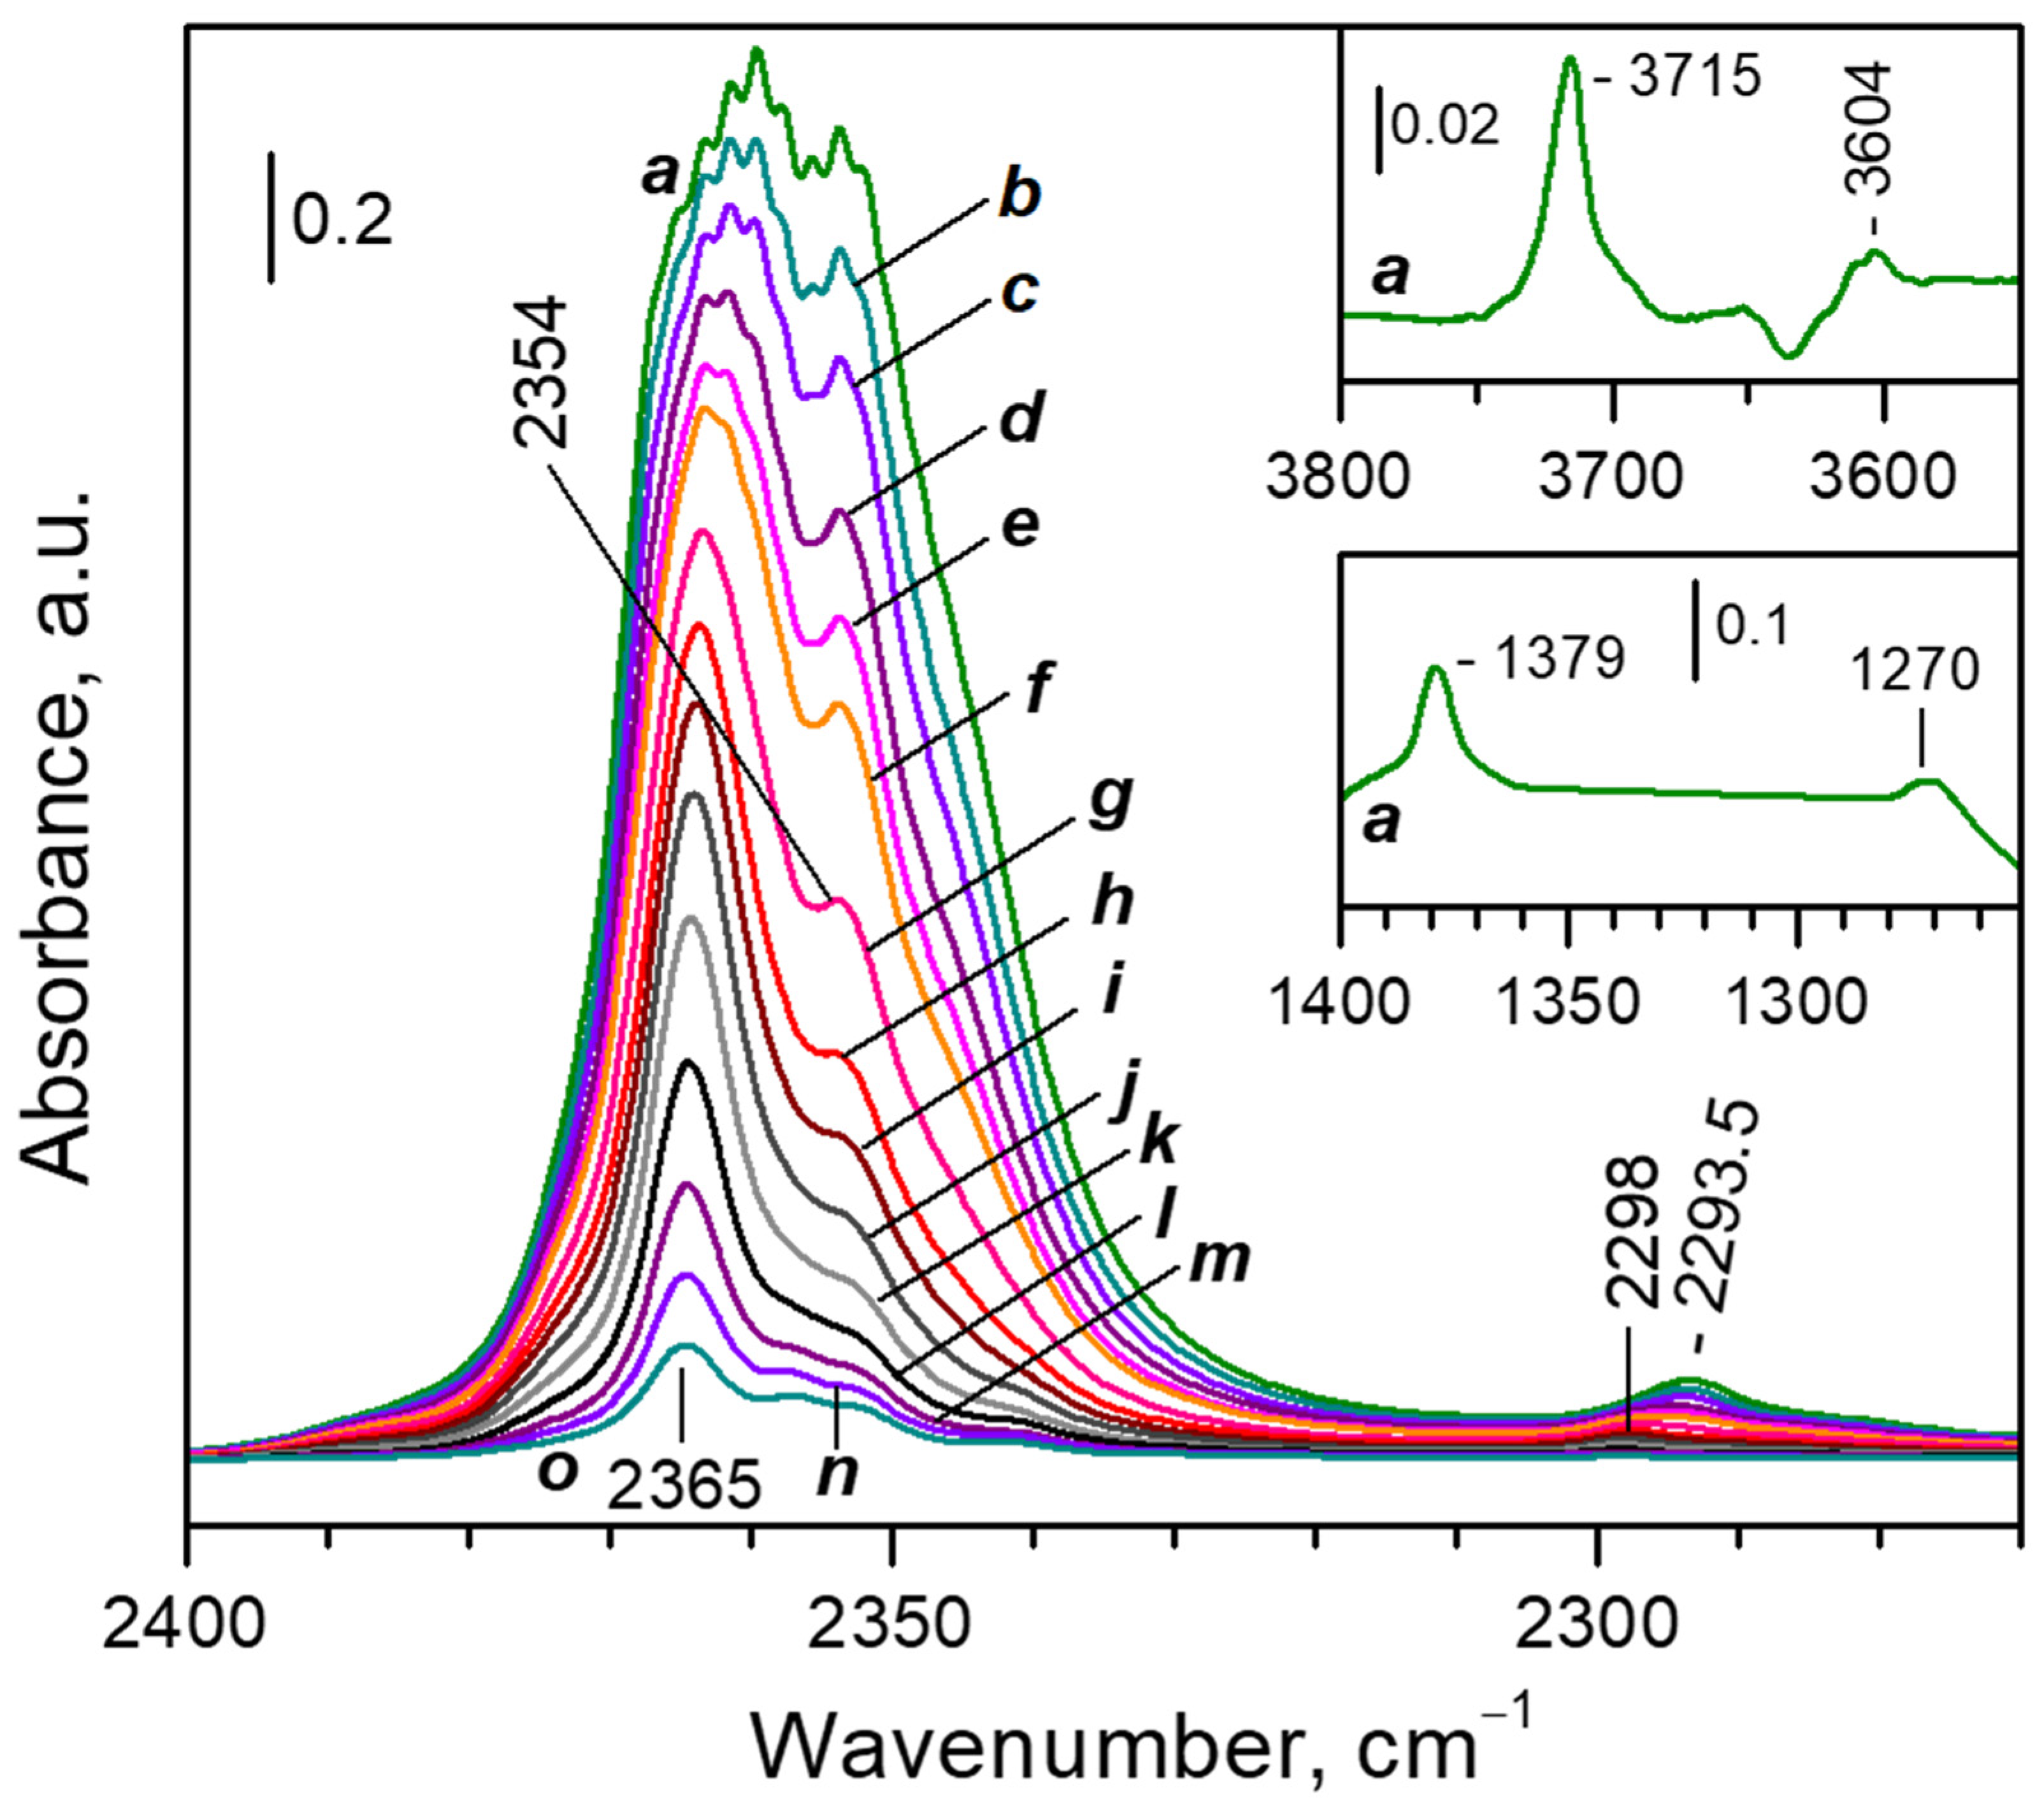
3.2.1. FTIR Spectra of CO2 Adsorbed at Ambient Temperature

Figure 3 shows the IR spectra of CO2 adsorbed at different equilibrium pressures on the CaNaY sample. First we will briefly describe the general picture. Because of the high calcium content, the ν3(12CO2) band reaches a very high intensity even at low equilibrium pressures, which leads to distortion of the spectrum [34] (Figure 3, spectra a–e). At low coverage (Figure 3, spectra g–f), a band at 2365 cm−1 dominates in the spectra and is associated with Ca2+···O=12C=O species formed with Ca2+ in SII positions [23,35]. Using the value of 2339 cm−1 as a reference frequency for CO2 adsorbed in porous materials [12], the shift of the ν3(12CO2) modes appears to be 26 cm−1, which indicates a relatively strong interaction. Another band at 2354 cm−1 develops at slightly higher coverages. Small bands are also detected at 2357 and 2342 cm−1. The intensity of these bands is negligible as compared to the intensity of the ν3(12CO2) band at saturation. Taking this into account, along with the relatively high stability of the bands, we tentatively assign them to bridging CO2 (bound to the surface through its two oxygen atoms) [36].
The ν3(13CO2) satellite band is observed at 2298 cm−1 [37] and is shifted to 2293.5 cm−1 with coverage increase. In addition, we detected the (ν1 + ν3)(12CO2) and (2ν2 + ν3)(12CO2) combination modes [14,23,37], which at high coverage appeared at 3715 and 3604 cm−1, respectively (see the upper inset in Figure 3). Two more bands were recorded at lower frequencies, at 1379 and 1270 cm−1 (see the lower inset in Figure 3). They are attributed to the IR forbidden ν1 mode and the overtone of the ν2 vibration, respectively [14,23,37]. No other bands were detected.
In order to achieve a better resolution, for the more detailed analysis we used the second derivatives of the spectra. Figure 4 compares the 12CO2 and 13CO2 regions of the ν3 mode. The set of spectra in the ν3(12CO2) region is restricted because at high coverage the band goes out of scale. Note that the X-axis of panel B is considered with the isotopic shift factor, so the analogous bands should appear right under each other.
Consider first the ν3(13CO2) region (Figure 4A). Due to the low concentration of the 13CO2 isotopologue, the spectra in this region are free of any 13CO213CO2 vibrational interaction. For clarity we shall discuss the spectra starting from low and going to high coverage. Two main regimes of CO2 adsorption can be distinguished:
(i)
At low coverage a band at 2298 cm−1 develops with the coverage increase (Figure 4A, lower set of spectra). This band is attributed to Ca2+···O=13C=O species [37].
(ii)
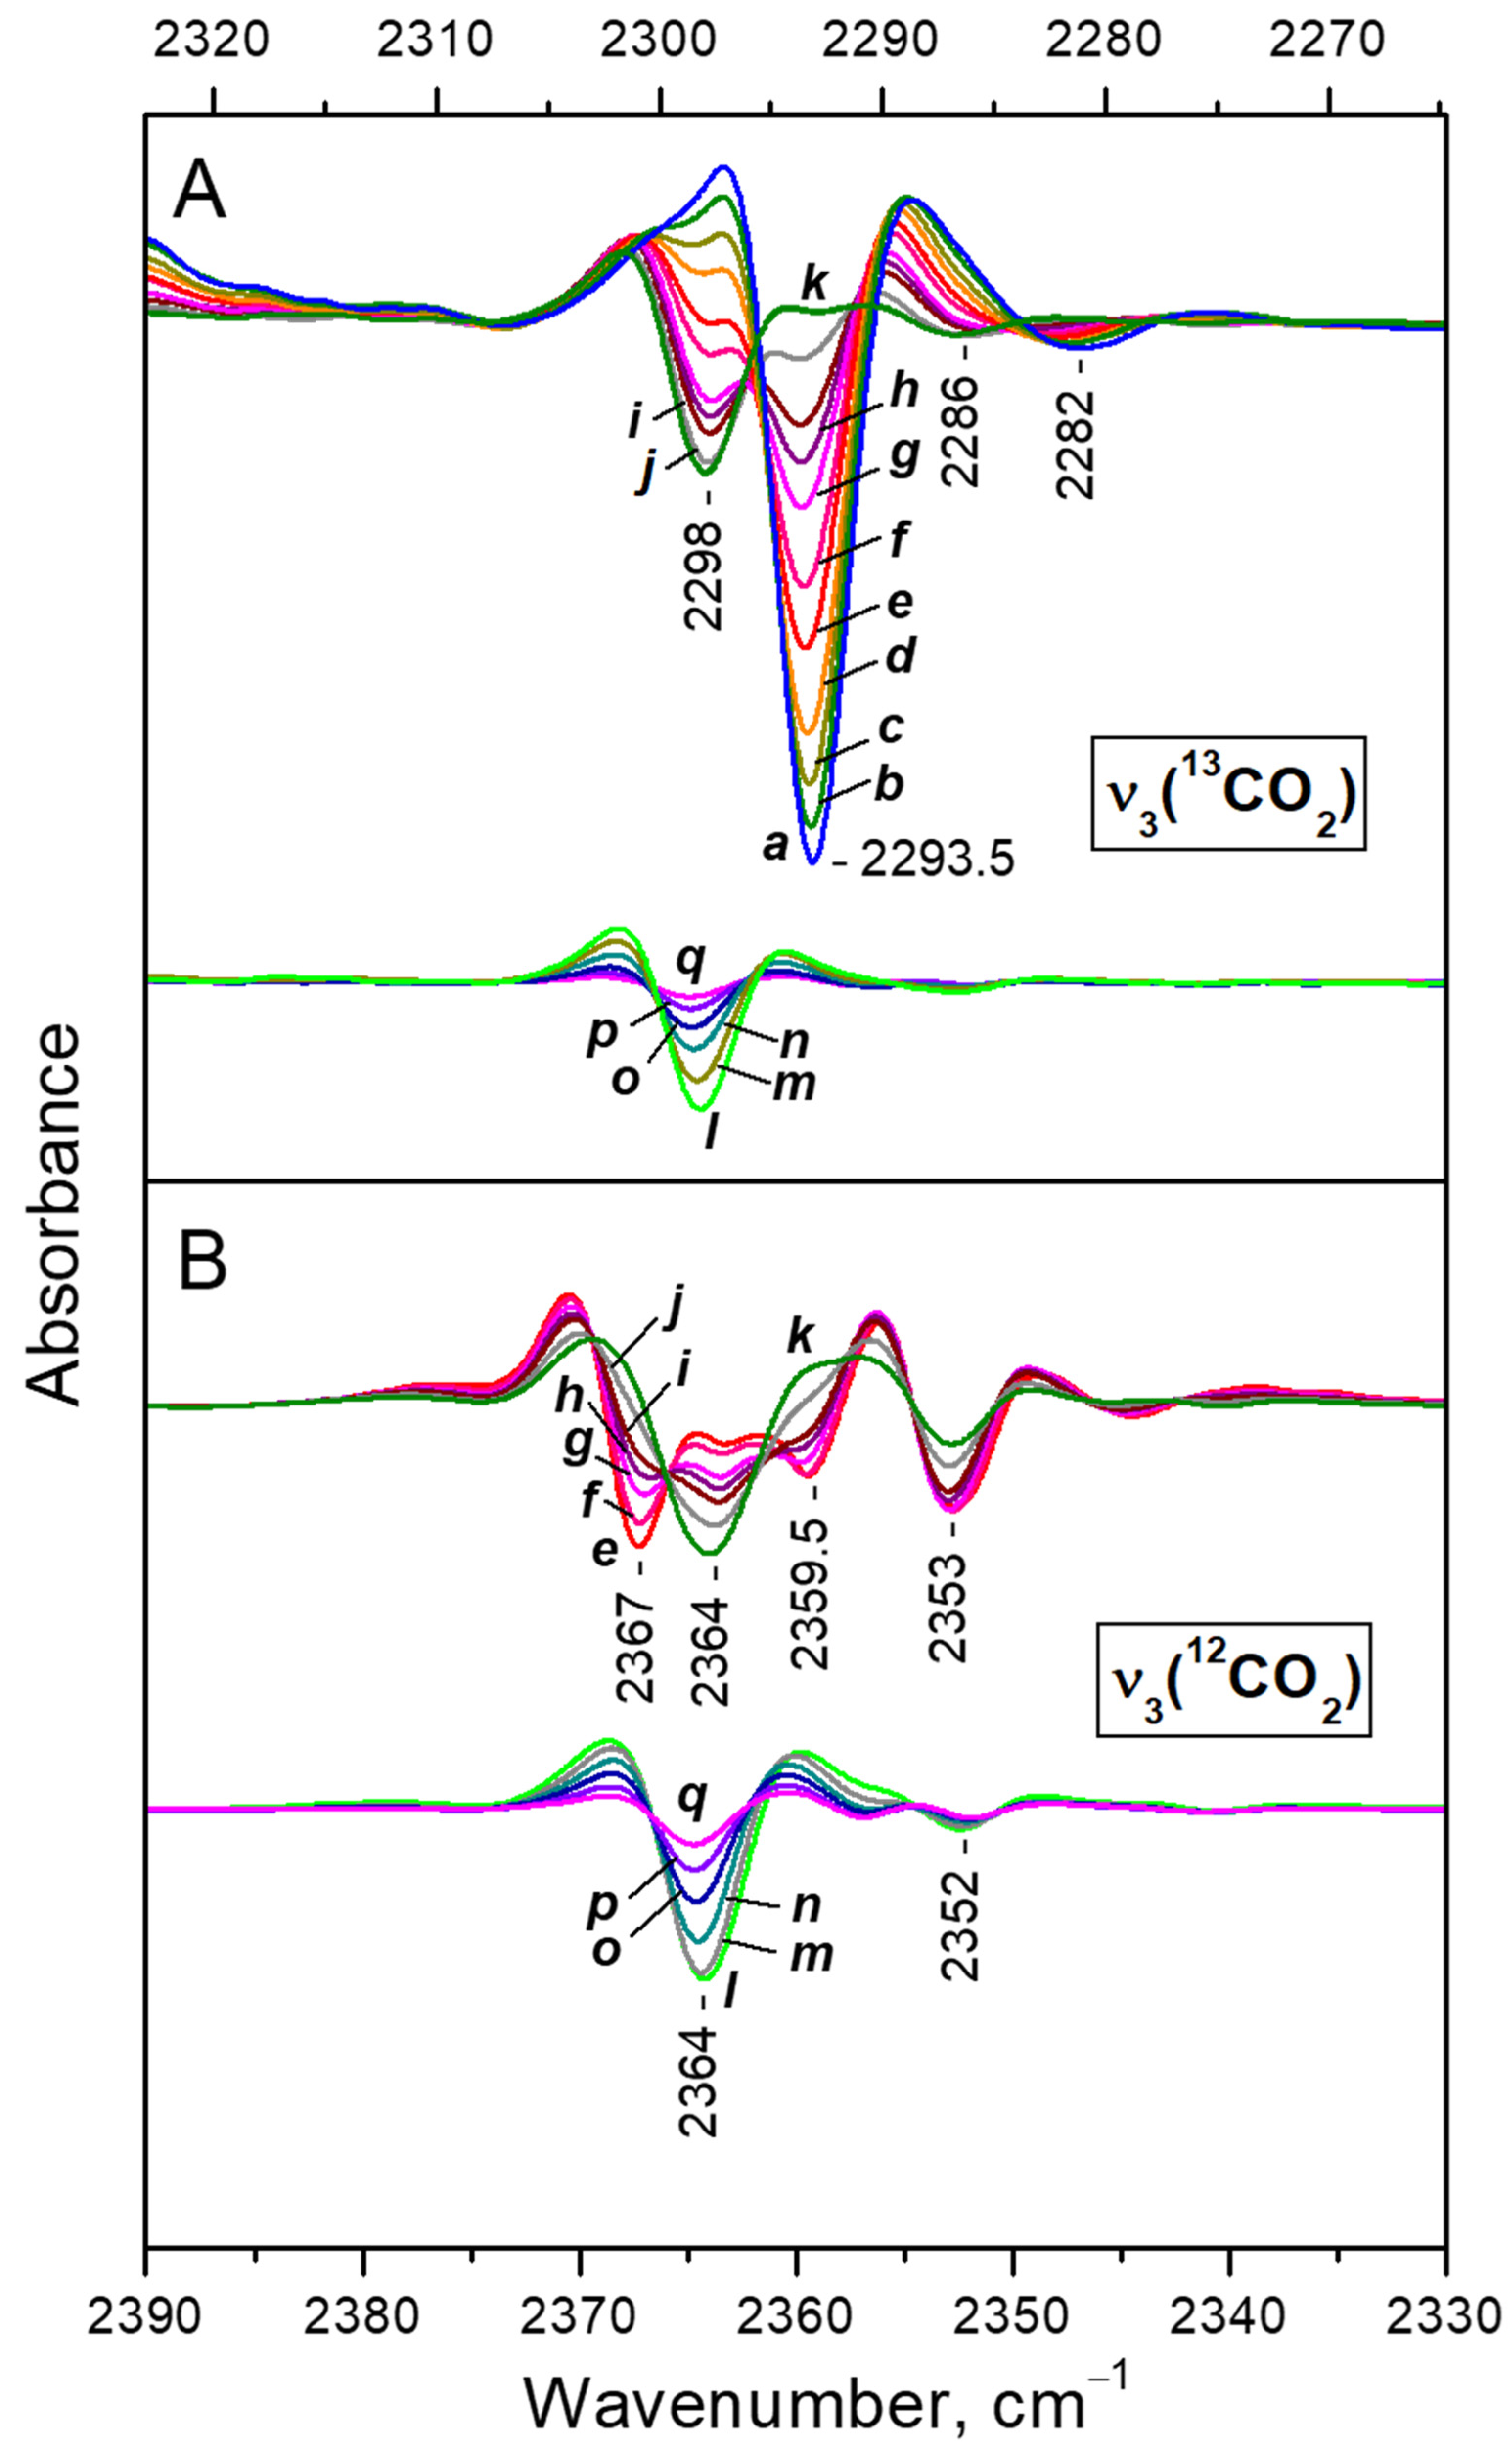
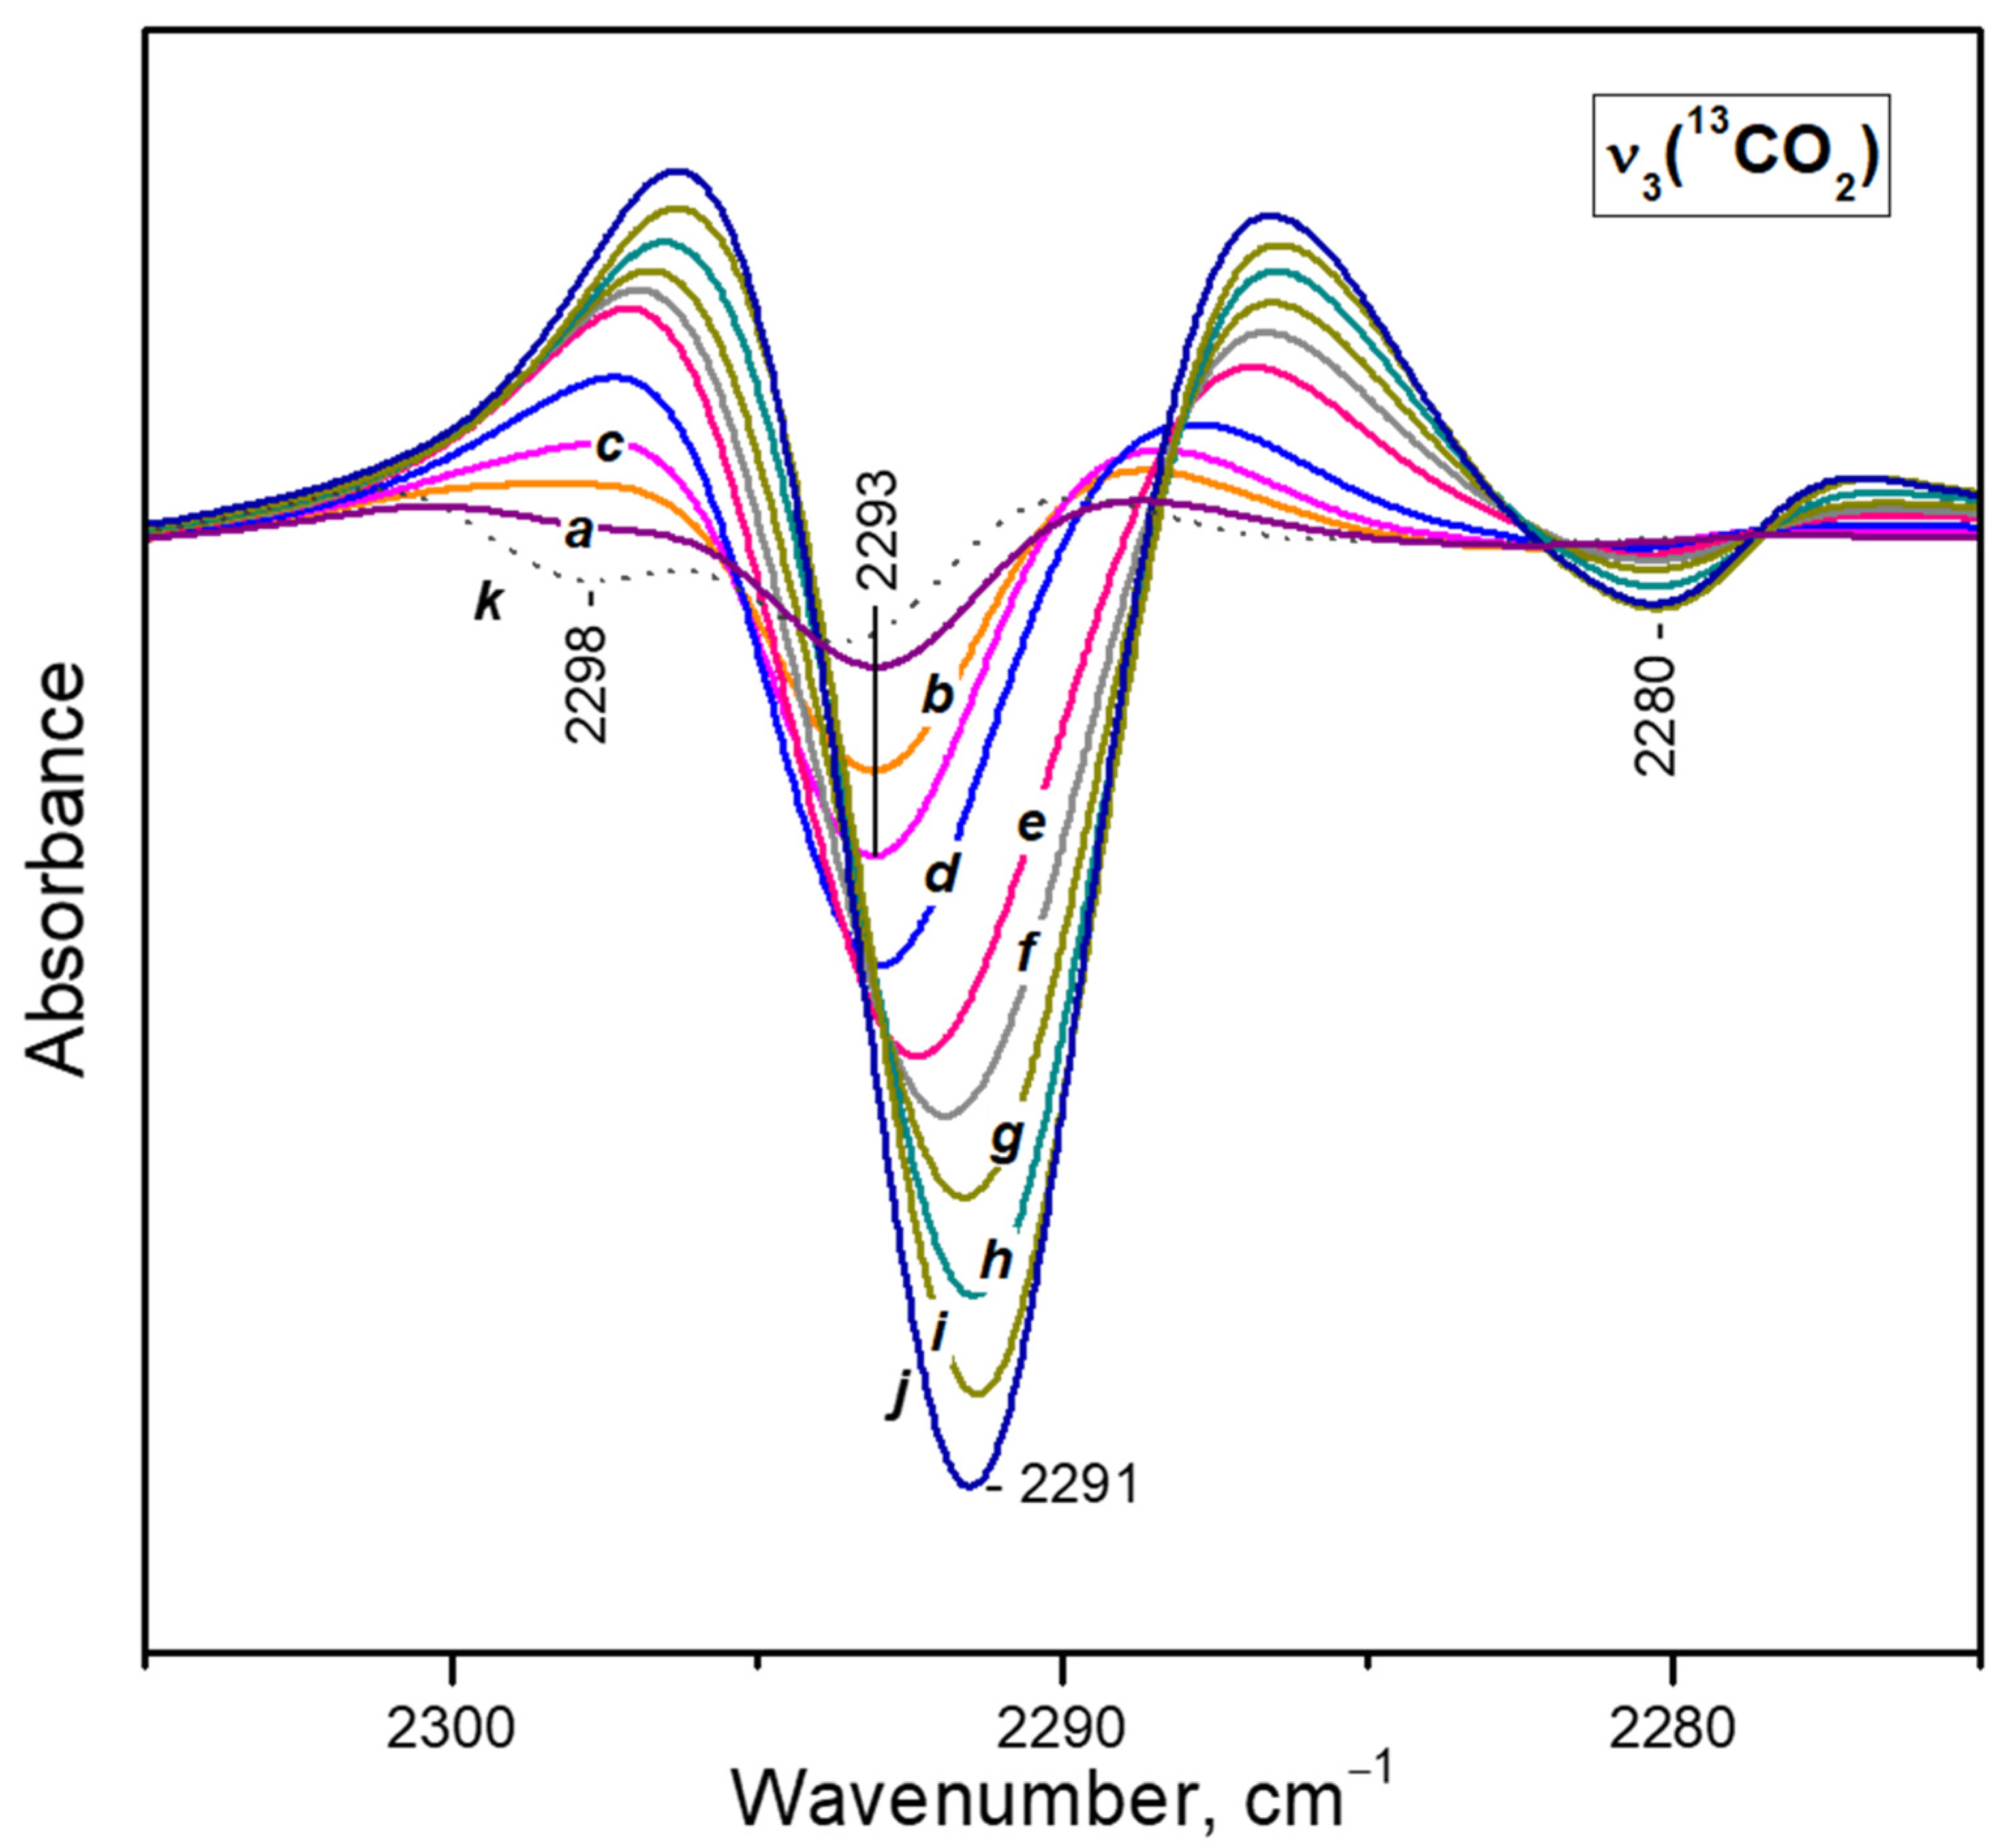
After reaching a maximum, the 2298 cm−1 band starts to decline and another band at 2193 cm−1 develops at its expense (Figure 4A, upper set of spectra). The latter is assigned to geminal species with one labelled ligand, namely Ca2+(12CO2)(13CO2) [23]. Thus, the adsorption-induced shift decreases because the two CO2 molecules adsorbed simultaneously at the same site compete and their interaction with the cation weakens. Note that the probability of formation of Ca2+(13CO2)2 species is almost zero. Weak bands below 2290 cm−1 also develop. These bands are less intense as compared with a sample having higher sodium content [23] and are associated with residual Na+ sites.
Consider now the ν3(12CO2) region (Figure 4B). Here again the two adsorption regimes are well distinguished. The band developing at low coverage is located at 2364 cm−1 and its intensity passes through a maximum. This band was already assigned to Ca2+···O=12C=O species and the position of the 12CO2 and 13CO2 bands are in good agreement with the expected isotopic shift [38]. In this case, however, there are two main bands developing at the expense of the band at 2364 cm−1 when equilibrium pressure increases: at 2367 and 2353 cm−1. This shows that the ν3 mode of the geminal Ca2+(12CO2)2 species is split into two components (in-phase and out-of-phase modes) due to vibrational interaction between the two CO2 molecules co-adsorbed on one site [23]. The Ca2+(12CO2)(13CO2) mixed ligand species are expected to manifest a band around 2360 cm−1. Indeed, such a band was detected at 2359.5 cm−1. However, its intensity is higher than expected and we shall discuss this band in more detail below.
The changes of the other CO2 bands with the equilibrium pressure are presented in the supporting information (Figure S1 and the corresponding text).

3.2.2. VTIR Experiments

To check for the possibility of coordination of a third CO2 molecule to the same Ca2+ site, we have performed VTIR experiments (Figure 5). They started at ambient temperature and under 2 mbar equilibrium pressure. Then the temperature was gradually decreased. At these experimental conditions it was not possible to follow the ν3(12CO2) band because of its very high intensity. The most intense band in the ν3(13CO2) region was that of diligand complexes (2294 cm−1), but the band of monoligand species (ca. 2298 cm−1) was of comparable intensity (Figure 5, spectrum a).
Decrease of temperature in the presence of CO2 initially leads to a fast disappearance of the 2298 cm−1 band and development of the band at 2294 cm−1 (Figure 5, spectra b–d). Further temperature lowering results in erosion of the band at 2294 cm−1 and development, at its expense, of a new band at 2292 cm−1. The latter is assigned to triligand Ca2+(12CO2)2(13CO2) species, i.e., conversion of di- to triligand complexes has occurred.

3.2.3. Adsorption Isotherms

The CO2 adsorption isotherm on the activated CaNaY sample is presented in Figure 6, curve a. The CO2 loading at 277 K and 350 mbar equilibrium pressure is 7.6 wt. %. The slope of the curve indicates that at these conditions the sample is far from saturation. It is also seen that a significant adsorption occurs even at very low pressures (see the inset in Figure 6).

3.2.4. XRD Patterns

The diffraction pattern of the CaNaY sample in the presence of 500 mbar CO2 at 298 K is shown on Figure 2 (pattern b). When comparing it with the pattern of the dehydrated activated sample (pattern a), one can note variation in intensities of the peaks located at ca. 10.25, 11.95, 18.77 and 20.44° . In addition, the shift of the peaks in the CO2—CaNaY pattern suggests an enlargement of the unit cell from 24.61 to 24.90 Å. At this stage attempts to establish the location of CO2, positioning its molecules inside the CaNaY framework using Rietveld refinement, were unsuccessful.

3.3. Adsorption of H2O on CaNaX

Although there are many studies on hydrated and dehydrated Ca-faujasites, some details on water adsorption are still unclear. For the purpose of this study, we are interested in the interaction of water with the accessible Ca2+ sites. It may be safely concluded that each of these sites has the capacity to coordinate up to three water molecules. Indeed, it has been established that three H2O-like molecules such as H2S [39] and NH3 [40] can be coordinated to one Ca2+ site in SII position in dehydrated CaY zeolite. Moreover, it has been established that each Ca2+ site in the SII position is coordinated to three framework oxygen atoms, having thus three coordinative vacancies allowing the acceptance of up to three guest molecules [39,40]. This is also consistent with the finding in this work that three CO2 molecules can be attached to one Ca2+ site and with earlier reports on the simultaneous coordination of three CO and N2 molecules [21,22]. However, the stability of the different Ca2+(H2O)x (x = 1–3) species is still unknown. To obtain more information about the hydration and dehydration processes, we studied the adsorption of water and its desorption on our CaNaY sample.

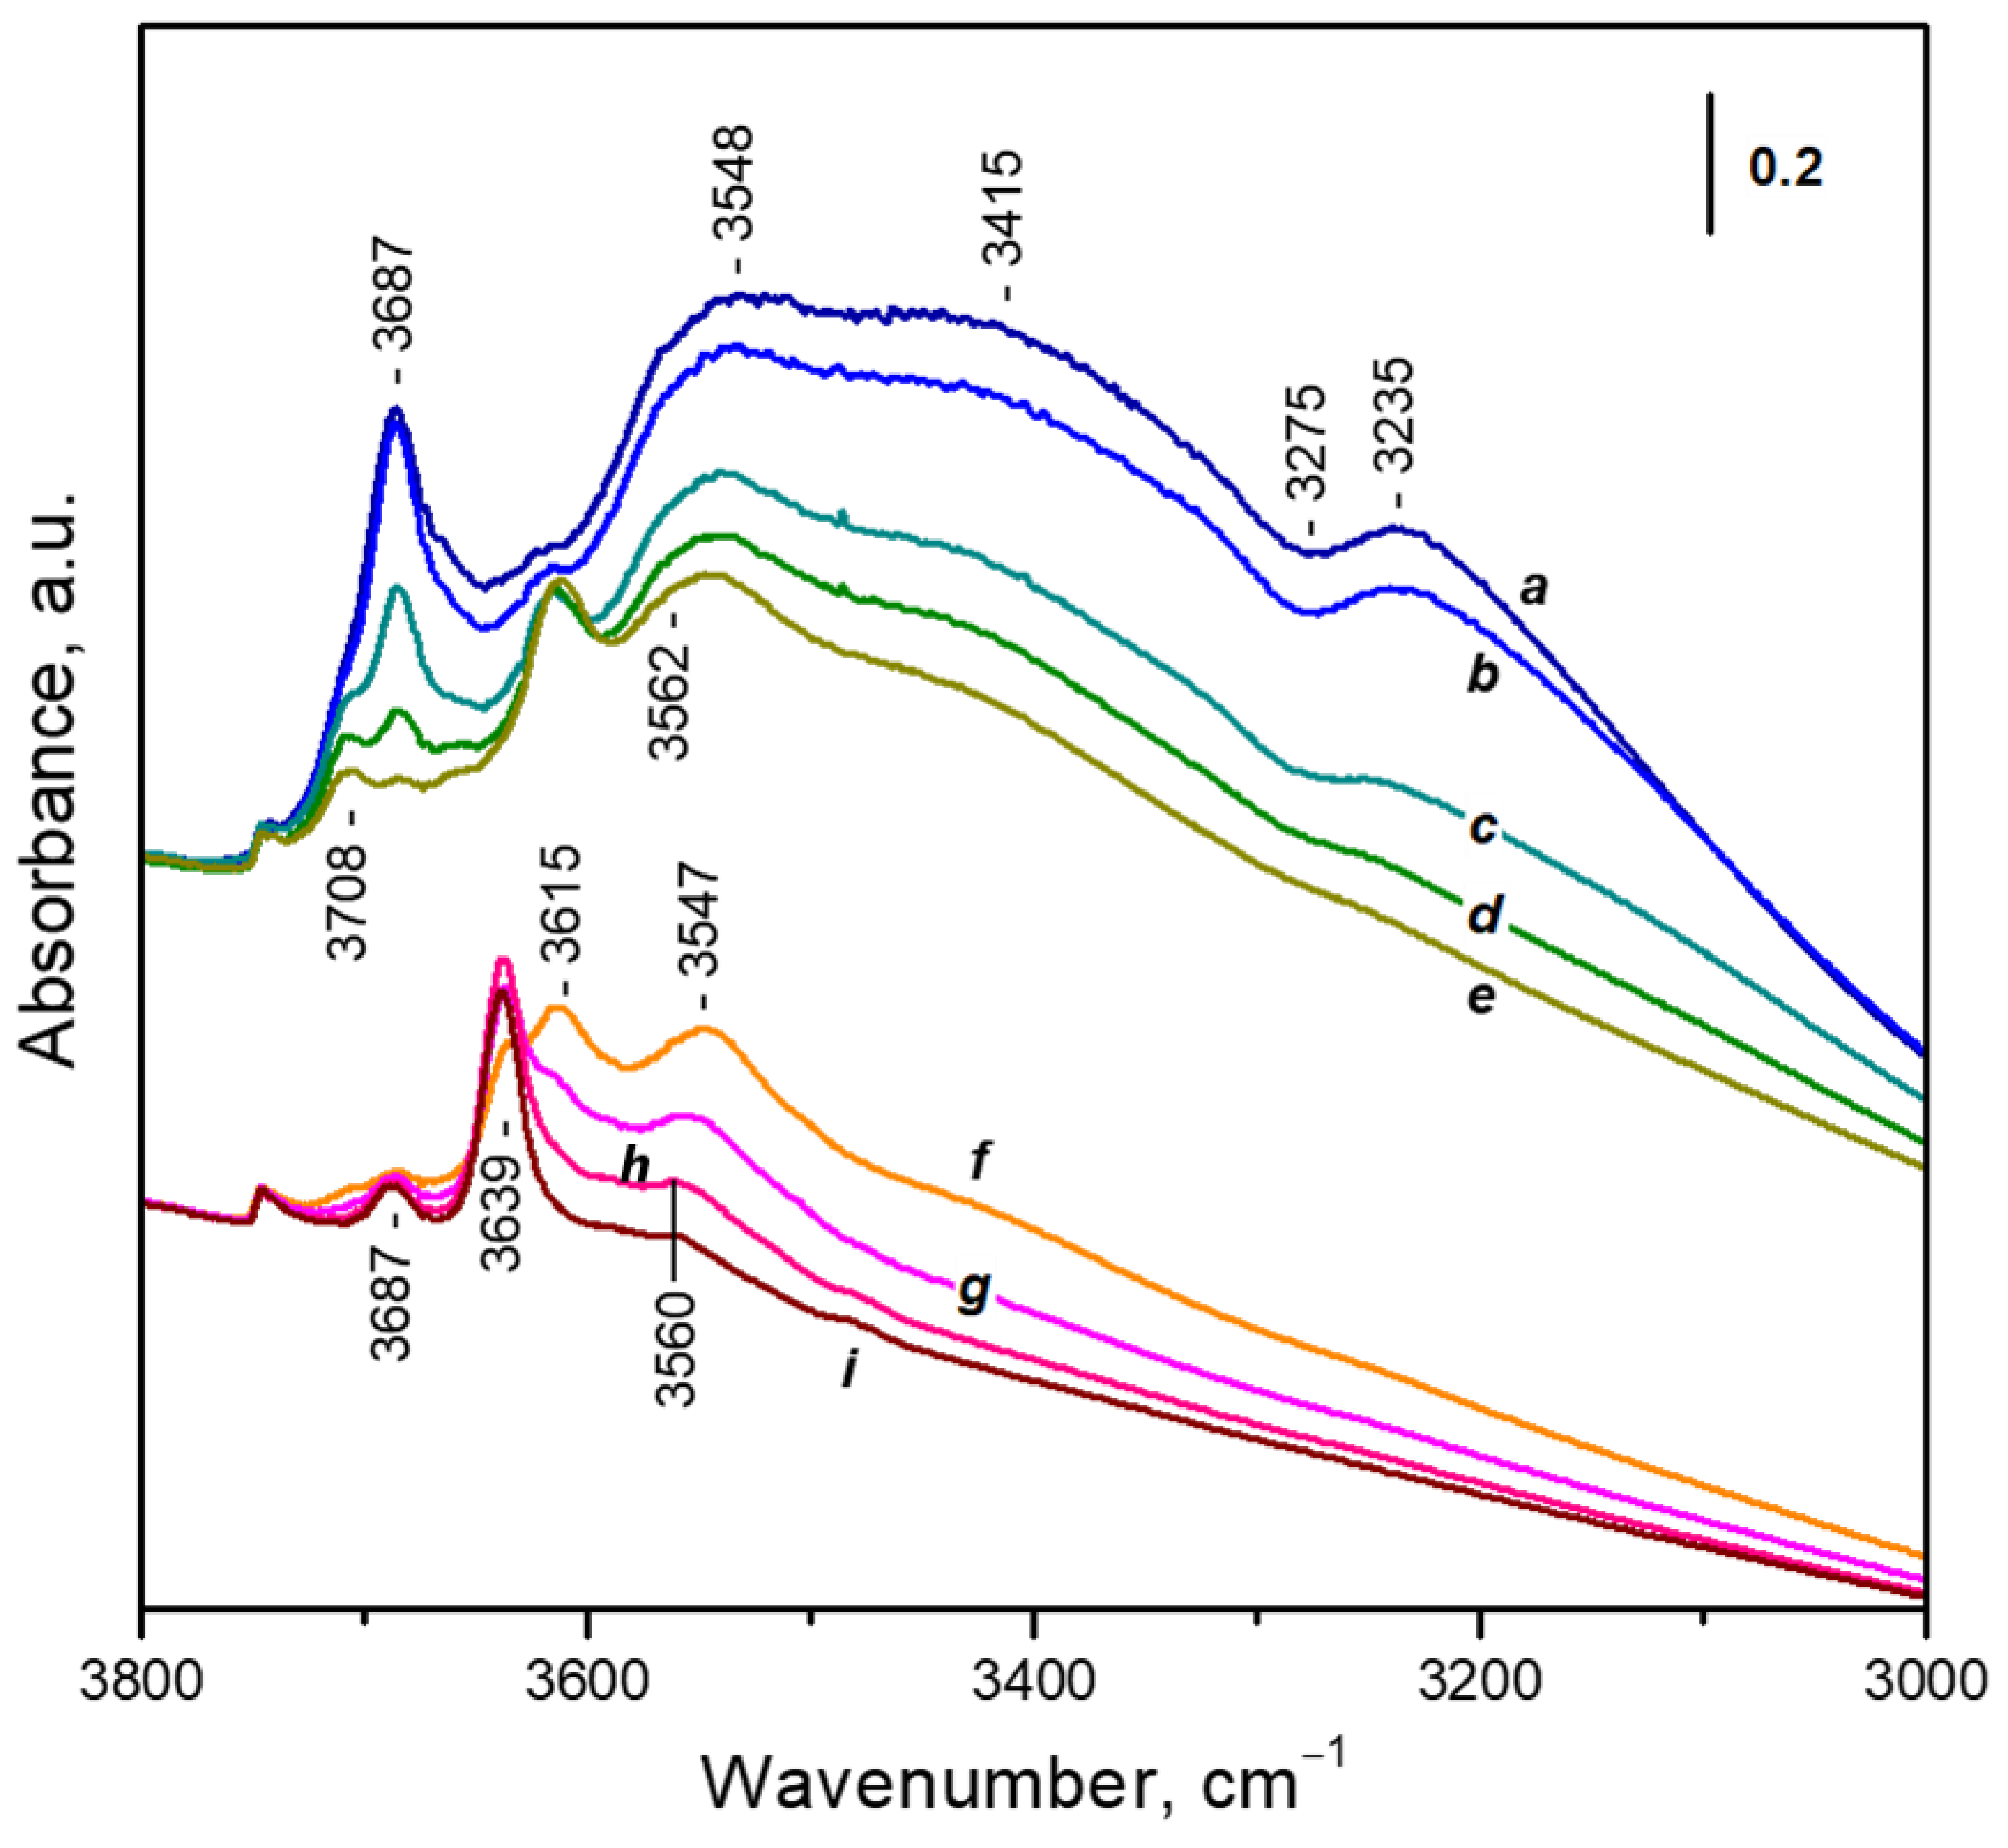
3.3.1. Adsorption of Water Followed by FTIR

The IR spectra of water adsorbed on zeolites are very complex and still there is no easy guide for their assignment. The IR spectrum of water adsorbed under equilibrium pressure of ca. 0.02 mbar is characterized by a complex δ(H2O) band around 1636 cm−1 and a more complex signal in the ν(OH) region (Figure 7, spectrum a). This signal is superimposition of the spectra of different surface species, including:
  • ν(OH) modes of the acidic hydroxyl groups originally absorbing at 3639 cm−1 but red shifted as a result of interaction with H2O molecules. These are responsible for a broad band between 3600 and 3000 cm−1 with a typical negative feature at 3275 cm−1 due to Fermi resonance [32,41].
  • Non-specifically adsorbed water with two ν(OH) bands, at 3687 cm−1 and around 3560 cm−1. This adsorption form also contributes to the broad absorbance between 3600 and 3000 cm−1 because of the formation of H-bonds [32].
  • Water adsorbed on hydroxyl groups; gives rise to a band at 3708 cm−1 together with an ill-defined lower frequency band [42].
  • A small band at 3746 cm−1 due to silanol groups [32].
  • Unresolved bands due to water adsorbed on cationic sites. These bands will be discussed below.
Figure 7. FTIR spectra of water adsorbed on CaNaY. Equilibrium H2O pressure of ca. 0.02 mbar (a) after 40 min evacuation at ambient temperature (b) and after 5 min evacuations at 348 K (c), 373 K (d), 423 K (e), 443 K (f), 473 K (g), 523 K (h) and 573 K (i).
Nanomaterials 13 02278 g007
Short evacuations at temperatures up to 423 K (Figure 7, spectra b–e) lead to almost full removal of the non-specifically adsorbed water, monitored by bands at 3687 and 3560 cm−1 and the broad feature at lower wavenumbers.
Subsequent evacuation at 443 K (Figure 7, spectrum f) results in almost full restoration of the band at 3639 cm−1 due to zeolite acidic hydroxyls, i.e., the respective OH–(H2O) adducts have been destroyed. Since Ca2+ ions are stronger acids than the OH groups [43], we can infer that after evacuation at this temperature only water adsorbed on cationic sites (mainly Ca2+ cations in SII positions) remains on the surface.
Analysis of the spectra shows that the most stable band in the ν(OH) region is at 3560 cm−1, followed by a band at 3615 cm−1. We tentatively attribute these bands to complexes with one and two H2O molecules, respectively. Most probably the Ca2+(H2O)3 complexes lose one water molecule at lower temperatures.
Finally, we note that successive adsorption of small water doses on the sample leads to a slightly different picture. In this case bands due to H2O on OH groups and non-specifically adsorbed H2O are detected even after adsorption of the first doses (spectra not shown). This is due to the so-called “wall effect”, i.e., each dose of water first saturates all reached sites.

3.3.2. Thermogravimetric Analysis

The registered DTA of the CaNaY sample (Figure 8, curve a) shows a well pronounced endothermic effect starting at 300 K and finishing at ~500 K, with a maximum around 380 K. This effect is accompanied by ~22% mass loss (up to 500 K) of the sample, as registered by the TGA. The mass losses are attributed to the desorption of water from CaNaY. The TGA reveals that even after 500 K the CaNaY sample continues to lose weight, and at 900 K the mass loss is ~25%. Since the IR results have shown that the sample is not fully dehydrated after evacuation at 500 K, we may associate the mass loss above this temperature with destruction of Ca2+-(H2O) species. Indeed, the DTA curve after 500 K discloses a large but shallow endothermic effect, with a maximum at approximately ~560 K. In agreement with the FTIR results, we attribute the main peak to desorption of non-specifically sorbed water, water attached to zeolite acidic hydroxyls and destruction of Ca(H2O)2,3 species to Ca2+(H2O).

3.4. Co-Adsorption of CO2 and H2O

3.4.1. Dosing Water on Sample with Pre-Adsorbed CO2 at Ambient Temperature

The next experiments were designed to establish by FTIR how water affects the adsorption of CO2. To this end we successively introduced small doses of water vapor to the CO2—CaNaY system with initial equilibrium CO2 pressure of 2.5 mbar. Note that the observed wall effect during water adsorption, although hindering quantification, does not affect the general conclusions because water definitely adsorbs on Ca2+ sites, as indicated by the IR spectra in the ν(OH) region.
The IR spectrum recorded before introduction of water was dominated by bands characterizing diligand Ca2+(CO2)2 species: 2367 and 2353 cm−1 in the ν3(12CO2) region and a band at 2293 cm−1 in the ν3(13CO2) region (see second derivatives presented in Figure 9, curve a). In addition, weaker bands due to Ca2+(CO2) adducts were also visible: ν3(12CO2) at 2364 cm−1 and ν3(13CO2) at 2298 cm−1.
Consider first the ν3(12CO2) region (Figure 9A). Successive dosing of water vapor into the system led to fast disappearance of the band due to linear complexes (2364 cm−1) and gradual decrease in intensity of the bands due to diligand species (2367 and 2353 cm−1). In parallel with this, a band at 2258 cm−1 developed. This band is at lower frequency than the band due to Ca2+(CO2) species, indicating lower electrophilicity of the adsorption site. In addition, there is no other band in the region changing in concert with it, which indicates the band characterizes monoligand species. Therefore, we assign it to mixed-ligand Ca2+(H2O)(CO2) adducts. Indeed, the band at 2258 cm−1 is at lower frequencies as compared to the Ca2+(CO2) band, which means that the CO2 molecule is less polarized. This is due to the fact that when a water molecule is coordinated to the Ca2+ site, its electrophilicity decreases. To the best of our knowledge, this is the first observation of mixed aqua-CO2 complexes produced by adsorption. A similar phenomenon was observed after CO and H2O coadsorption on Cu+ sites in Cu-ZSM-5, i.e., decrease in the C-O stretching frequency when a H2O molecule is inserted into the Cu+-CO complex [44].
After passing through a maximum, the intensity of the band at 2358 cm−1 starts to decrease and its maximum is slightly red shifted (Figure 9A, lowest set of spectra). Another band at 2348 cm−1 develops. Its position is close to the position of bands attributed to complexes with residual Na+ sites. However, the band is more intense and can thus be attributed to Ca2+(H2O)2(CO2) species. Additional arguments in favour of this assignment are provided in the next section.
Consider now in more detail the spectra in the ν3(13CO2) region. At first sight they seem surprising: the addition of water leads to a decrease in intensity of the bands due to mono- (2298 cm−1) and diligand (2294 cm−1) species. However, the latter band is slightly red shifted, to 2193 cm−1, with the increase of water coverage. Considering the isotopic shift factor, the ν3(13CO2) analogue of the Ca2+(H2O)(12CO2) band at 2358 cm−1 is expected at 2292.5 cm−1. Therefore, we attribute the band at 2293 cm−1 to Ca2+(H2O)(13CO2) adducts. This explains why the band dominates in the region when a large amount of water was adsorbed on the sample. Because of the very low intensity of the ν3(13CO2) bands at the end of the experiment, it was not possible to detect Ca2+(H2O)2(13CO2) species.

3.4.2. VTIR Experiments

In order further to explore the coordination chemistry of calcium in the Ca2+(H2O) complexes, we performed VTIR experiments. Water was preadsorbed on the sample and then evacuated for 40 min at 443 K. After this treatment the most pronounced water bands in the ν(OH) region were at ca. 3560 cm−1 suggesting a large fraction of the Ca2+ sites are hydrated. Subsequent CO2 adsorption (2 mbar) produced mainly a band at 2293 cm−1 in the ν3(13CO2) region (Figure 10, spectrum a). For comparison, at these conditions a mixture of mono- and diligand species was observed with a water-free sample (Figure 10, spectrum k). Therefore, we infer that we started the experiments with a sample having mainly Ca2+(H2O)(CO2) complexes, whereas the fraction of water-free Ca2+ sites is small.
Lowering temperature leads first to an increase of the 2293 cm−1 band in intensity, indicating a progressive occupation of the Ca2+(H2O) sites by CO2 molecules. Around 200 K (Figure 10, spectrum e) the band is converted into another band located at 2291 cm−1. This band is attributed to Ca2+(H2O)(12CO2)(13CO2) adducts [23]. The corresponding Ca2+(H2O)(12CO2)2 species cannot be directly detected because of the very high intensities of the bands. The results are consistent with the previously made conclusions on the existence of three coordinative vacancies at each accessible Ca2+ site in our sample.
Additional VTIR experiments were performed with samples containing larger amounts of preadsorbed water. After evacuation at 673 K, two or three doses of water (each of 10 mg per g CaY) were adsorbed on the sample, after which it was evacuated for 30 min at 373 K to remove any weakly adsorbed species. From Figure 11 it can be seen that an increase in the amount of preadsorbed water leads to a slight decrease in the integral intensity of the band at 2291 cm−1, characterizing Ca2+(H2O)(12CO2)(13CO2) complexes. The band at 2280 cm−1, associated with CO2 on residual Na+ sites, almost disappears. This is due to the occupation of Na+ cations (less electrophilic than Ca2+) by H2O molecules. In addition, a 13CO2 band at 2283 cm−1 develops. This band corresponds to the 12CO band at 2348 cm−1 already attributed to Ca2+(H2O)2(12CO2) species. Indeed, the formation of these species should be favored by the presence of a larger amount of preadsorbed water.
Thus, it appears that the Ca2+ cations occupying SII positions in CaX zeolite, being coordinated to only three framework oxygen atoms, tend to reach a coordination number of six. Consequently, they can coordinate one, two or three molecules of CO and/or H2O, including formation of the three possible combinations with different ligands, i.e., Ca2+(H2O)(CO2), Ca2+(H2O)(CO2)2 and Ca2+(H2O)2(CO2).

3.4.3. Adsorption Isotherms

In Figure 6 the CO2 adsorption isotherm on a sample activated at 443 K is compared with the isotherm obtained with a 673 K activated (dehydrated) sample. It was already discussed that after activation at 443 K a large fraction of the accessible Ca2+ sites are occupied by one water molecule. The results demonstrate that the adsorption capacity of the 443 K sample is lower (by 13% at 350 mbar equilibrium pressure) as compared to the dehydrated sample. This effect is more pronounced at low pressures (ca. 25% at 0.2 mbar, see the inset in Figure 6), which indicates a decrease of the initial adsorption enthalpy. This is due to the lower stability of the Ca2+(H2O)(CO2) complexes as compared to Ca2+(CO2).

4. Conclusions

Adsorption of CO2 at ambient temperature leads to the sequential formation of Ca2+(CO2), Ca2+(CO2)2 and Ca2+(CO2)3 complexes. The Ca2+(CO2) and Ca2+(CO2)2 species are formed at very low equilibrium CO2 pressures, and the fraction of geminal species increases with the coverage. At a pressure of ca. 65 mbar, Ca2+(CO2)3 species start to form. At 163 K and under ca. 2 mbar CO2 practically all Ca2+ sites coordinate three CO2 molecules.
In the co-presence of CO2 and water and at ambient temperature, Ca2+(H2O)(CO2) mixed ligand complexes are produced. They are in equilibrium with Ca2+(CO2), Ca2+(CO2)2 and Ca2+(H2O)n species, which depend on the partial pressures of CO2 and water vapor. At low temperature Ca2+(H2O)(CO2)2 and Ca2+(H2O)2(CO2) complexes are also produced.
The results of this study show that although it has a negative effect on CO2 adsorption uptake, water in moderate amounts does not block the CO2 adsorption sites on CaNaY zeolites.

Supplementary Materials

The following supporting information can be downloaded at: https://www.mdpi.com/article/10.3390/nano13162278/s1, Table S1: Chemical composition of the sample; Figure S1: Second derivatives of the FTIR spectra registered after adsorption of CO2 at ambient temperature on CaNaY (ν1 and 2ν2 regions); Explanation text to Figure S1.

Author Contributions

Conceptualization, K.I.H.; methodology, K.I.H.; formal analysis, N.L.D. and B.L.S.; investigation, N.L.D., B.L.S. and L.D.D.; writing—original draft preparation, K.I.H.; writing—review and editing, K.I.H.; visualization, N.L.D., B.L.S. and L.D.D.; project administration, K.I.H.; funding acquisition, K.I.H. All authors have read and agreed to the published version of the manuscript.

Funding

The research was financially supported by the Bulgarian Science Fund, program “BИXPEH—2021”, project number KП-06-ДB-1.

Data Availability Statement

The data presented in this study are available in the article and the supplementary material.

Conflicts of Interest

The authors declare no conflict of interest.

References

  1. Al-Ghussain, L. Global warming: Review on driving forces and mitigation. Environ. Prog. Sustain. Energy 2019, 38, 13–21. [Google Scholar] [CrossRef] [Green Version]
  2. Wilberforce, T.; Olabi, A.G.; Sayed, E.T.; Elsaid, K.; Abdelkareem, M.A. Progress in carbon capture technologies. Sci. Total Environ. 2021, 761, 143203. [Google Scholar] [CrossRef] [PubMed]
  3. Osman, A.I.; Hefny, M.; Abdel Maksoud, M.I.A.; Elgarahy, A.M.; Rooney, D.W. Recent advances in carbon capture storage and utilisation technologies: A review. Environ. Chem. Lett. 2021, 19, 797–849. [Google Scholar] [CrossRef]
  4. Montanari, T.; Finocchio, E.; Salvatore, E.; Garuti, G.; Giordano, A.; Pistarino, C.; Busca, G. CO2 separation and landfill biogas upgrading: A comparison of 4A and 13X zeolite adsorbents. Energy 2011, 36, 314–319. [Google Scholar] [CrossRef]
  5. Dindi, A.; Quang, D.V.; Vega, L.F.; Nashef, E.; Abu-Zahra, M.R.M. Applications of fly ash for CO2 capture, utilization, and storage. J. CO2 Util. 2019, 29, 82–102. [Google Scholar] [CrossRef]
  6. Zhang, Z.; Xiao, Y.; Wang, B.; Sun, Q.; Liu, H. Waste is a misplayed resource: Synthesis of zeolites from fly ash for CO2 capture. Energy Procedia 2017, 114, 2537–2544. [Google Scholar] [CrossRef]
  7. Soe, J.T.; Kim, S.-S.; Lee, Y.-R.; Ahn, J.-W.; Ahn, W.-S. CO2 capture and Ca2+ exchange using zeolite A and 13X prepared from power plant fly ash. Bull. Korean Chem. Soc. 2016, 37, 490–493. [Google Scholar] [CrossRef]
  8. Zgureva, D. Carbon dioxide adsorption studies on fly ash zeolites. Coal Combust. Gasificat. Prod. 2016, 8, 54–59. [Google Scholar] [CrossRef]
  9. Boycheva, S.; Zgureva, D.; Lazarova, H.; Popova, M. Comparative studies of carbon capture onto coal fly ash zeolites Na-X and Na-Ca-X. Chemosphere 2021, 271, 129505. [Google Scholar] [CrossRef]
  10. Boycheva, S.; Chakarova, K.; Mihaylov, M.; Hadjiivanov, K.; Popova, M. Effect of calcium on enhanced carbon capture potential of coal fly ash zeolites. Part II: A study on the adsorption mechanisms. Environ. Sci. Process. Impacts 2022, 24, 1934–1944. [Google Scholar] [CrossRef]
  11. Han, L.; Wang, X.; Wu, B.; Zhu, S.; Wang, J.; Zhang, Y. In-situ synthesis of zeolite X in foam geopolymer as a CO2 adsorbent. J. Clean. Prod. 2022, 372, 133591. [Google Scholar] [CrossRef]
  12. Bonelli, B.; Civalleri, B.; Fubini, B.; Ugliengo, P.; Otero Areán, C.; Garrone, E. Experimental and quantum chemical studies on the adsorption of carbon dioxide on alkali-metal-exchanged ZSM-5 zeolites. J. Phys. Chem. B 2000, 104, 10978–10988. [Google Scholar] [CrossRef]
  13. Yang, K.; Yang, G.; Wu, J. Quantitatively understanding the insights into CO2 adsorption on faujasite from the heterogeneity and occupancy sequence of adsorption sites. J. Phys. Chem. C 2021, 125, 15676–15686. [Google Scholar] [CrossRef]
  14. Chakarova, K.; Mihaylov, M.; Hadjiivanov, K. Can two CO2 molecules be simultaneously bound to one Na+ site in NaY zeolite? A detailed FTIR investigation. Microporous Mesoporous Mater. 2022, 345, 112270. [Google Scholar] [CrossRef]
  15. Hadjiivanov, K.; Knözinger, H. FTIR study of the low-temperature adsorption and co-adsorption of CO and N2 on NaY zeolite: Evidence of simultaneous coordination of two molecules to one Na+ site. Chem. Phys. Lett. 1999, 303, 513–520. [Google Scholar] [CrossRef]
  16. Bonelli, B.; Onida, B.; Fubini, B.; Otero Areán, C.; Garrone, E. Vibrational and thermodynamic study of the adsorption of carbon dioxide on the zeolite Na-ZSM-5. Langmuir 2000, 16, 4976–4983. [Google Scholar] [CrossRef]
  17. Thang, H.V.; Grajciar, L.; Nachtigall, P.; Bludsky, O.; Otero Areán, C.; Frydová, E.; Bulánek, R. Adsorption of CO2 in FAU zeolites: Effect of zeolite composition. Catal. Today 2014, 227, 50–56. [Google Scholar] [CrossRef]
  18. Hadjiivanov, K.; Ivanova, E.; Kantcheva, M.; Cifitikli, E.; Klissurski, D.; Dimitrov, L.; Knözinger, H. FTIR study of low-temperature co adsorption on Mn-ZSM-5 and MnY zeolites. Effect of the zeolite matrix on the formation of Mn2+(CO)2 geminal species. Catal. Commun. 2002, 3, 313–319. [Google Scholar] [CrossRef] [Green Version]
  19. Bae, M.N.; Song, M.K.; Kim, Y.; Seff, K. Crystal structure of Mn46Si100Al92O384.89H2S, a hydrogen sulfide sorption complex of fully dehydrated Mn2+-exchanged zeolite X. Microporous Mesoporous Mater. 2003, 63, 21–31. [Google Scholar] [CrossRef]
  20. Available online: https://en.wikipedia.org/wiki/Ionic_radius (accessed on 11 July 2023).
  21. Hadjiivanov, K.; Knözinger, H.; Ivanova, E.; Dimitrov, L. FTIR Study of low-temperature CO and 15N2 adsorption on a CaNaY zeolite: Formation of site-specified Ca2+(CO)3 and Ca2+(15N2)3 complexes. Phys. Chem. Chem. Phys. 2001, 3, 2531–2536. [Google Scholar] [CrossRef]
  22. Hadjiivanov, K.; Knözinger, H. Formation of Ca2+(CO)3 complexes during low-temperature CO adsorption on CaNaY zeolite. J. Phys. Chem. B 2001, 105, 4531–4534. [Google Scholar] [CrossRef]
  23. Drenchev, N.L.; Ivanova, E.Z.; Mihaylov, M.Y.; Aleksandrov, H.A.; Vayssilov, G.N.; Hadjiivanov, K.I. One Ca2+ Site in CaNaY Zeolite Can Attach Three CO2 Molecules. J. Phys. Chem. Lett. 2023, 14, 1564–1569. [Google Scholar] [CrossRef] [PubMed]
  24. Yu, C.-H.; Huang, C.-H.; Tan, C.S. A review of CO2 capture by absorption and adsorption. Aerosol Air Qual. Res. 2012, 12, 745–769. [Google Scholar] [CrossRef] [Green Version]
  25. Drenchev, N.L.; Chakarova, K.K.; Lagunov, O.V.; Mihaylov, M.Y.; Ivanova, E.Z.; Strauss, I.; Hadjiivanov, K.I. In situ FTIR spectroscopy as a tool for investigation of gas/solid interaction: Water-enhanced CO2 adsorption in UiO-66 metal-organic framework. J. Vis. Exp. 2020, 156, e60285. [Google Scholar] [CrossRef]
  26. Xu, X.; Song, C.; Miller, B.G.; Scaroni, A.W. Influence of moisture on CO2 separation from gas mixture by a nanoporous adsorbent based on polyethylenimine-modified molecular sieve MCM-41. Ind. Eng. Chem. Res. 2005, 44, 8113–8119. [Google Scholar] [CrossRef]
  27. Guo, H.; Yan, S.; Zhao, Y.; Ma, X.; Wang, S. Influence of water vapor on cyclic CO2 capture performance in both carbonation and decarbonation stages for Ca-Al mixed oxide. Chem. Eng. J. 2019, 359, 542–551. [Google Scholar] [CrossRef]
  28. Panayotov, D.; Zdravkova, V.; Lagunov, O.; Andonova, S.; Spassova, I.; Nihtianova, D.; Atanasova, G.; Drenchev, N.; Ivanova, E.; Mihaylov, M.; et al. Capturing CO2 by ceria and ceria–zirconia nanomaterials of different origin. Phys. Chem. Chem. Phys. 2023, 25, 17154–17175. [Google Scholar] [CrossRef]
  29. Karimi, M.; Rodrigues, A.E.; Silva, J.A.C. Biomass as a source of adsorbents for CO2 capture. In Advances in Bioenergy and Microfluidic Applications; Rahimpour, M.R., Kamali, R., Makarem, M.A., Manshadi, M.K.D., Eds.; Elsevier: Amsterdam, The Netherlands, 2021; pp. 255–274. [Google Scholar] [CrossRef]
  30. Kolle, J.M.; Fayaz, M.; Sayari, A. Understanding the effect of water on CO2 adsorption. Chem. Rev. 2021, 121, 7280–7345. [Google Scholar] [CrossRef]
  31. Legodi, M.A.; De Waal, D.; Potgieter, J.H.; Potgieter, S.S. Rapid determination of CaCO3 in mixtures utilising FT-IR spectroscopy. Miner. Eng. 2001, 14, 1107–1111. [Google Scholar] [CrossRef]
  32. Hadjiivanov, K. Identification and characterization of surface hydroxyl groups by infrared spectroscopy. Adv. Catal. 2014, 57, 99–318. [Google Scholar] [CrossRef]
  33. Lim, W.T.; Seo, S.M.; Kim, G.H.; Lee, H.S.; Seff, K. Six single-crystal structures showing the dehydration, deamination, dealumination, and decomposition of NH4+-exchanged zeolite Y (FAU) with increasing evacuation temperature. Identification of a Lewis acid site. J. Phys. Chem. C 2007, 111, 18294–18306. [Google Scholar] [CrossRef]
  34. Novikov, R.G.; Konopnitskii, R.; Tsyganenko, A.A. Distortions in IR spectra related to registration conditions: II. The influence of scattering. Opt. Spectrosc. 2018, 124, 655–659. [Google Scholar] [CrossRef]
  35. Gallei, E.; Stumpf, G. Studies of the adsorption of carbon dioxide and the coadsorption of carbon dioxide and water on CaY- and NiY-zeolites. J. Colloid Interface Sci. 1976, 55, 415–420. [Google Scholar] [CrossRef]
  36. Davarpanah, E.; Armandi, M.; Hernandez, S.; Fino, D.; Arletti, R.; Bensaid, S.; Piumetti, M. CO2 capture on natural zeolite clinoptilolite: Effect of temperature and role of the adsorption sites. J. Environ. Manag. 2020, 275, 111229. [Google Scholar] [CrossRef]
  37. Montanari, T.; Busca, G. On the mechanism of adsorption and separation of CO2 on LTA zeolites: An IR investigation. Vibr. Spectrosc. 2008, 46, 45–51. [Google Scholar] [CrossRef]
  38. Hadjiivanov, K.; Mihaylov, M.; Panayotov, D.; Ivanova, E.; Chakarova, K. Isotopes in the FTIR investigations of solid surfaces. Spectrosc. Prop. Inorg. Organomet. Compd. 2014, 45, 43–78. [Google Scholar] [CrossRef]
  39. Jang, S.L.; Jeong, M.S.; Kim, Y.; Jan, Y.; Seff, K. Crystal structure of a hydrogen sulfide sorption complex of fully Ca2+-exchanged zeolite X. Microporous Mesoporous Mater. 1999, 23, 33–44. [Google Scholar] [CrossRef]
  40. Jang, S.L.; Jeong, M.S.; Kim, Y.; Song, S.H.; Seff, K. Crystal structure of an ammonia sorption complex of dehydrated fully Ca2+-exchanged zeolite X. Microporous Mesoporous Mater. 1999, 28, 173–183. [Google Scholar] [CrossRef]
  41. Paze, C.; Bordiga, S.; Lamberti, C.; Salvalaggio, M.; Zecchina, A.; Bellussi, G. Acidic properties of H–β zeolite as probed by bases with proton affinity in the 118–204 kcal mol−1 range: a FTIR investigation. J. Phys. Chem. B 1997, 101, 4740–4751. [Google Scholar] [CrossRef]
  42. Wakabayashi, F.; Kondo, J.N.; Domen, K.; Hirose, C. FT-IR study of H218O adsorption on H-ZSM-5: Direct evidence for the hydrogen-bonded adsorption of water. J. Phys. Chem. 1996, 100, 1442–1444. [Google Scholar] [CrossRef]
  43. Hadjiivanov, K.; Vayssilov, G. Characterization of oxide surfaces and zeolites by carbon monoxide as an IR probe molecule. Adv. Catal. 2002, 47, 307–511. [Google Scholar] [CrossRef]
  44. Hadjiivanov, K.; Kantcheva, M.; Klissurski, D. IR study of CO adsorption on Cu-ZSM-5 and CuO/SiO2 Catalysts: σ- and π-components of the Cu+-CO bond. J. Chem. Soc. Faraday Trans. 1996, 92, 4595–4600. [Google Scholar] [CrossRef]
Figure 1. FTIR spectrum of the activated CaNaY sample.
Nanomaterials 13 02278 g001
Figure 2. Powder diffractograms for CaNaY. Dehydrated sample (a) and in the presence of 500 mbar of CO2 (b).
Nanomaterials 13 02278 g002
Figure 3. FTIR spectra of CO2 adsorbed on CaNaY zeolite at ambient temperature. Equilibrium CO2 pressure of 4 (a), 3 (b), 2 (c), 1.5 (d), 1 (e) and 0.5 mbar (f); and development of the spectra during evacuation (g–o). The spectra are background and gas-phase corrected.
Nanomaterials 13 02278 g003
Figure 4. Second derivatives of the FTIR spectra of CO2 adsorbed at ambient temperature on CaNaY. Equilibrium CO2 pressure of 15 (a), 11 (b), 8 (c), 6 (d), 4 (e), 3 (f), 2 (g), 1.5 (h), 1 (i) and 0.5 mbar (j); and development of the spectra during evacuation (k–q). Panels (A,B) show the ν3(13CO2) and ν3(12CO2) regions, respectively. All spectra are background and gas-phase corrected.
Nanomaterials 13 02278 g004
Figure 5. Second derivatives of the FTIR spectra of CO2 (initial equilibrium pressure of 2 mbar) adsorbed on CaNaY. Sample temperature of 293 K (a), 273 K (b), 263 K (c), 253 K (d), 243 K (e), 233 K (f), 223 K (g), 213 K (h), 203 K (i), 193 K (j), 183 K (k), 173 K (l) and 163 K (m). All spectra are background and gas-phase corrected.
Nanomaterials 13 02278 g005
Figure 6. Adsorption isotherms of CO2 on CaNaY at 277 K. Sample activated at 673 K (a) and at 443 K (b).
Nanomaterials 13 02278 g006
Figure 8. TGA (a) and DTA (b) profiles of the CaNaY sample.
Nanomaterials 13 02278 g008
Figure 9. Second derivatives of the FTIR spectra of CO2 adsorbed at ambient temperature and equilibrium pressure of 2.5 mbar on the CaNaY sample (a) and after successive introduction of small doses of water vapor into the system (b–j). Panels (A,B) show the ν3(12CO2) and ν3(13CO2) regions, respectively. All spectra are background and gas-phase corrected.
Nanomaterials 13 02278 g009
Figure 10. Second derivatives of the FTIR spectra of the 13CO2 bands arising from the natural 13C abundance (initial CO2 equilibrium pressure of 2 mbar) adsorbed at different temperatures on water pre-covered CaNaY (for details see text). Sample temperature of 293 K (a), 263 K (b), 253 K (c), 228 K (d), 198 K (e), 188 K (f), 180 K (g), 168 K (h), 163 K (i) and 147 K (j). Spectrum (k) is given for comparison and is registered at 293 K under 2 mbar equilibrium CO2 pressure with a water-free sample. All spectra are background and gas-phase corrected.
Nanomaterials 13 02278 g010
Figure 11. Second derivatives of the FTIR spectra of CO2 (initial equilibrium pressure of 2 mbar) adsorbed at different temperatures on water pre-covered CaNaY. Sample temperature of 178 K (a,c) and 168 K (b,d). Spectra (a) and (b) are registered with a sample with one additional dose of preadsorbed H2O and spectra (c) and (d), with two doses (for details see text). All spectra are background and gas-phase corrected.
Nanomaterials 13 02278 g011
Disclaimer/Publisher’s Note: The statements, opinions and data contained in all publications are solely those of the individual author(s) and contributor(s) and not of MDPI and/or the editor(s). MDPI and/or the editor(s) disclaim responsibility for any injury to people or property resulting from any ideas, methods, instructions or products referred to in the content.

