Article

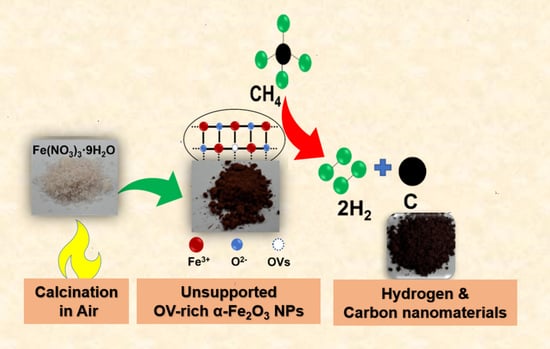
Scalable Synthesis of Oxygen Vacancy-Rich Unsupported Iron Oxide for Efficient Thermocatalytic Conversion of Methane to Hydrogen and Carbon Nanomaterials

by
Abdulrahman I. Alharthi
1,*,
Talal F. Qahtan
2,
Maged N. Shaddad
1,
Mshari A. Alotaibi
1,
Satam Alotibi
2 and
Amani M. Alansi
3
1
Chemistry Department, College of Science and Humanities in Al-Kharj, Prince Sattam Bin Abdulaziz University, P.O. Box 83, Al-Kharj 11942, Saudi Arabia
2
Physics Department, College of Science and Humanities in Al-Kharj, Prince Sattam Bin Abdulaziz University, P.O. Box 83, Al-Kharj 11942, Saudi Arabia
3
Chemistry Department, King Saud University, Riyadh 12372, Saudi Arabia
*
Author to whom correspondence should be addressed.
Nanomaterials 2023, 13(17), 2461; https://doi.org/10.3390/nano13172461
Submission received: 30 June 2023 / Revised: 6 August 2023 / Accepted: 18 August 2023 / Published: 31 August 2023
(This article belongs to the Special Issue Catalysis of Porous Nanomaterials)

Abstract

:
Thermocatalytic methane decomposition (TCMD) involving metal oxides is a more environmentally friendly and cost-effective strategy for scalable hydrogen fuel production compared to traditional methane steam reforming (MSR), as it requires less energy and produces fewer CO/CO2 emissions. However, the unsupported metal oxide catalysts (such as α-Fe2O3) that would be suited for this purpose exhibit poor performance in TCMD. To overcome this issue, a novel strategy was developed as a part of this work, whereby oxygen vacancies (OVs) were introduced into unsupported α-Fe2O3 nanoparticles (NPs). Systematic characterization of the obtained materials through analytical techniques demonstrated that mesoporous nanostructured unsupported α-Fe2O3 with abundant oxygen vacancies (OV-rich α-Fe2O3 NPs) could be obtained by direct thermal decomposition of ferric nitrate at different calcination temperatures (500, 700, 900, and 1100 °C) under ambient conditions. The thermocatalytic activity of the resulting OV-rich α-Fe2O3 NPs was assessed by evaluating the methane conversion, hydrogen formation rate, and amount of carbon deposited. The TCMD results revealed that 900 °C was the most optimal calcination temperature, as it led to the highest methane conversion (22.5%) and hydrogen formation rate (47.0 × 10⁻⁵ mol H2 g−1 min−1) after 480 min. This outstanding thermocatalytic performance of OV-rich α-Fe2O3 NPs is attributed to the presence of abundant OVs on their surfaces, thus providing effective active sites for methane decomposition. Moreover, the proposed strategy can be cost-effectively scaled up for industrial applications, whereby unsupported metal oxide NPs can be employed for energy-efficient thermocatalytic CH4 decomposition into hydrogen fuel and carbon nanomaterials.

Graphical Abstract

1. Introduction

Owing to the growing demand for the abandonment of fossil fuels and the adoption of clean energy sources, academic research into applications involving hydrogen has increased considerably in recent years. The available evidence indicates that electricity can be efficiently obtained from hydrogen-based sources without any environmental pollution [1,2,3,4]. However, at present, hydrogen is typically attained through methane steam reforming (MSR) and partial natural gas oxidation, resulting in considerable CO2 emissions [5,6,7]. Thus, greener methane decomposition strategies are urgently required, as methane is superior to all other hydrocarbons in terms of the hydrogen/carbon ratio. Moreover, it is more abundant in nature than other fossil fuels and can be decomposed into H2 and C via a simple conversion process [8,9,10].
To overcome the aforementioned challenges inherent in currently used techniques, thermocatalytic methane decomposition (TCMD) based on metal oxide catalysts can be adopted, as it is cleaner and more cost-effective [8,11,12]. As it requires less energy and its CO/CO2 emission rate is lower than in MSR, it can be economically scaled up for practical industrial applications, including biomethane exploitation for carbon generation and storage [13,14]. In current TCMD processes, Ni-, Fe-, and Co-based catalysts are usually employed, along with Al2O3 and MgO or other metal oxides, which serve as supporting materials. Although Ni and Co particles are characterized by high activity in the 500−700 °C temperature range and their use results in a high graphitic carbon growth rate [5,6,12], Ni- and Co-based catalysts have some notable drawbacks, including high cost and toxicity. Moreover, at high temperatures—which are necessary for methane conversion at sufficiently high rates and for producing highly stable graphitic carbon—they undergo rapid deactivation [3]. In this respect, Fe-based catalysts are superior alternatives, as they maintain sufficiently high activity levels at temperatures up to 950 °C [15,16,17].
Therefore, Fe-based catalysts could be used for TCMD to produce H2 and carbon materials while benefiting from their non-toxic nature, wide availability, and high activity [18,19]. In particular, hematite (α-Fe2O3) can be utilized for this purpose, as it is the most thermodynamically stable iron oxide under ambient conditions and is relatively inexpensive, readily available, and environmentally safe. However, to facilitate the separation and recovery of catalysts and carbon products, magnetic unsupported solid metal catalysts are usually used; however, unsupported α-Fe2O3 catalysts currently have poor methane decomposition performance. To overcome this issue, various strategies have been proposed, including morphological control [20,21], element doping [22], heterojunction construction [22,23], and surface modification [24,25]. In this context, surface defects such as oxygen vacancies have emerged as a particularly promising approach, given that defect engineering (e.g., by creating oxygen vacancies in metal oxides) is widely used to tune catalyst performance [26,27]. Extant research shows that OVs can be employed to modulate the geometric configuration, electronic structure, and physicochemical properties of metal oxides. Moreover, oxygen-defective materials have been shown to serve as effective initiators for the adsorption of molecules in a wide range of surface reactions [28,29].
In practical applications, methane decomposition catalysts for hydrogen production are generally synthesized and/or prepared through impregnation, co-precipitation, and sol-gel processes. However, when a two-step preparation is conducted, catalyst morphology cannot be adequately controlled, and its structure changes with the addition of metals, thus affecting the particle distribution and size. Therefore, in this work, a novel method for the development of unsupported α-Fe2O3 nanoparticles (NPs) for thermocatalytic methane decomposition without the use of any supporting agents is proposed. Specifically, oxygen vacancies are introduced into unsupported α-Fe2O3 NPs, making them suitable for TCMD. The catalyst is prepared via the calcination method at temperatures (500, 700, 900, and 1100 °C) under ambient conditions. During the calcination process, OVs are created on the surface of the unsupported α-Fe2O3 NPs. Thus, this one-step, highly efficient, and controllable method is highly cost-effective and scalable. In the sections that follow, we report on the preparation, characterization, and catalytic performance of mesoporous nanostructured unsupported α-Fe2O3 with abundant oxygen vacancies (OV-rich α-Fe2O3 NPs), which were used for efficient thermocatalytic methane conversion to hydrogen and carbon nanomaterials.

2. Experimental

2.1. Preparation of Unsupported OV-Rich α-Fe2O3 NPs

OV-rich α-Fe2O3 NPs were prepared via thermal decomposition of ferric nitrate nonahydrate Fe(NO3)3.9H2O (which served as a metal precursor) at different temperatures. In the typical procedure, 5 g of Fe(NO3)3.9H2O (Purchased from LOBA CHEMIE PVT.LTD., Mumbai, India, purity of 98%) was calcinated at 500, 700, 900, and 1100 °C in ambient air for 5 h (5 h) to obtain samples denoted as FeN-500 °C, FeN-700 °C, FeN-900 °C, and FeN-1100 °C, respectively as indicated in Figure 1. Next, unsupported OV-rich α-Fe2O3 NPs were obtained by cooling the as-prepared samples to room temperature.

2.2. Characterization Techniques

For crystalline phase identification, the obtained fresh OV-rich α-Fe2O3 NPs and spent samples collected after use for TCMD were studied via X-ray diffraction (XRD) analysis over the 2θ = 10−70° scanning range, using the X-ray diffractometer (Rigaku International, Tokyo, Japan), Cu Kα radiation (λ = 1.5406 A). The surface morphology of the obtained fresh OV-rich α-Fe2O3 NPs and spent samples were observed using a scanning electron microscope (FESEM, QUANTA 250 FEI; Hillsboro, OR, USA), while the textural properties of the fresh samples, including surface area, pore volume, and pore radius, were measured using N2 physisorption isotherms using a Quantachrome Autosorb IQ model ASIQA3V600000–6 instrument. X-ray photoelectron spectroscopy (XPS) was further employed to investigate the near-surface chemical composition and oxidation states of the studied materials. A Thermo K Alpha spectrometer operating at 1486.6 eV with a 400 μm spot size and charge correction was utilized for this purpose. As an internal standard, all binding energy estimates were calibrated to the C 1s energy (284.5 eV). In addition, thermogravimetric analyses (TGA) were carried out in ambient air using a Netzsch proteus 70 instrument at 10 °C/min increments within the 25–1000 °C temperature range. Collected TGA data demonstrated typical mass loss with regard to temperature, and their corresponding first derivative thermogravimetric (DTG) graphs provided information on mass loss rate versus temperature.

2.3. Thermocatalytic Activity Experiments

The activity of unsupported nanostructured OV-rich α-Fe2O3 NPs was investigated in a quartz tubular fixed-bed reactor with a 1.5 cm internal diameter and 50 cm total length. For this purpose, 0.5 g of the previously prepared fresh catalyst sample was placed in the center of the tube between the ceramic fiber plugs preheated to 800 °C. Next, a 3:1 mixture of CH4 and N2 feed gas (supplied by AHG at 99.99% purity) was introduced into the reactor at a 20 mL/min flow rate, which was controlled by a mass gas flowmeter (MKS PR4000B). During data analysis, the nitrogen present in the mixture was used as the internal standard. The OV-rich α-Fe2O3 NPs were not subjected to any pretreatment because methane is considered a reductant. Reaction products were examined using online Gas Chromatography, on an Agilent GC Model 7890B equipped with 19043 Restek Micro packed GC Columns (Shin carbon ST 80/100 2 M, 0.53 mm), while a thermal conductivity detector was utilized to analyze the output gas and determine the hydrogen, nitrogen, and unreacted methane content.

3. Results and Discussion

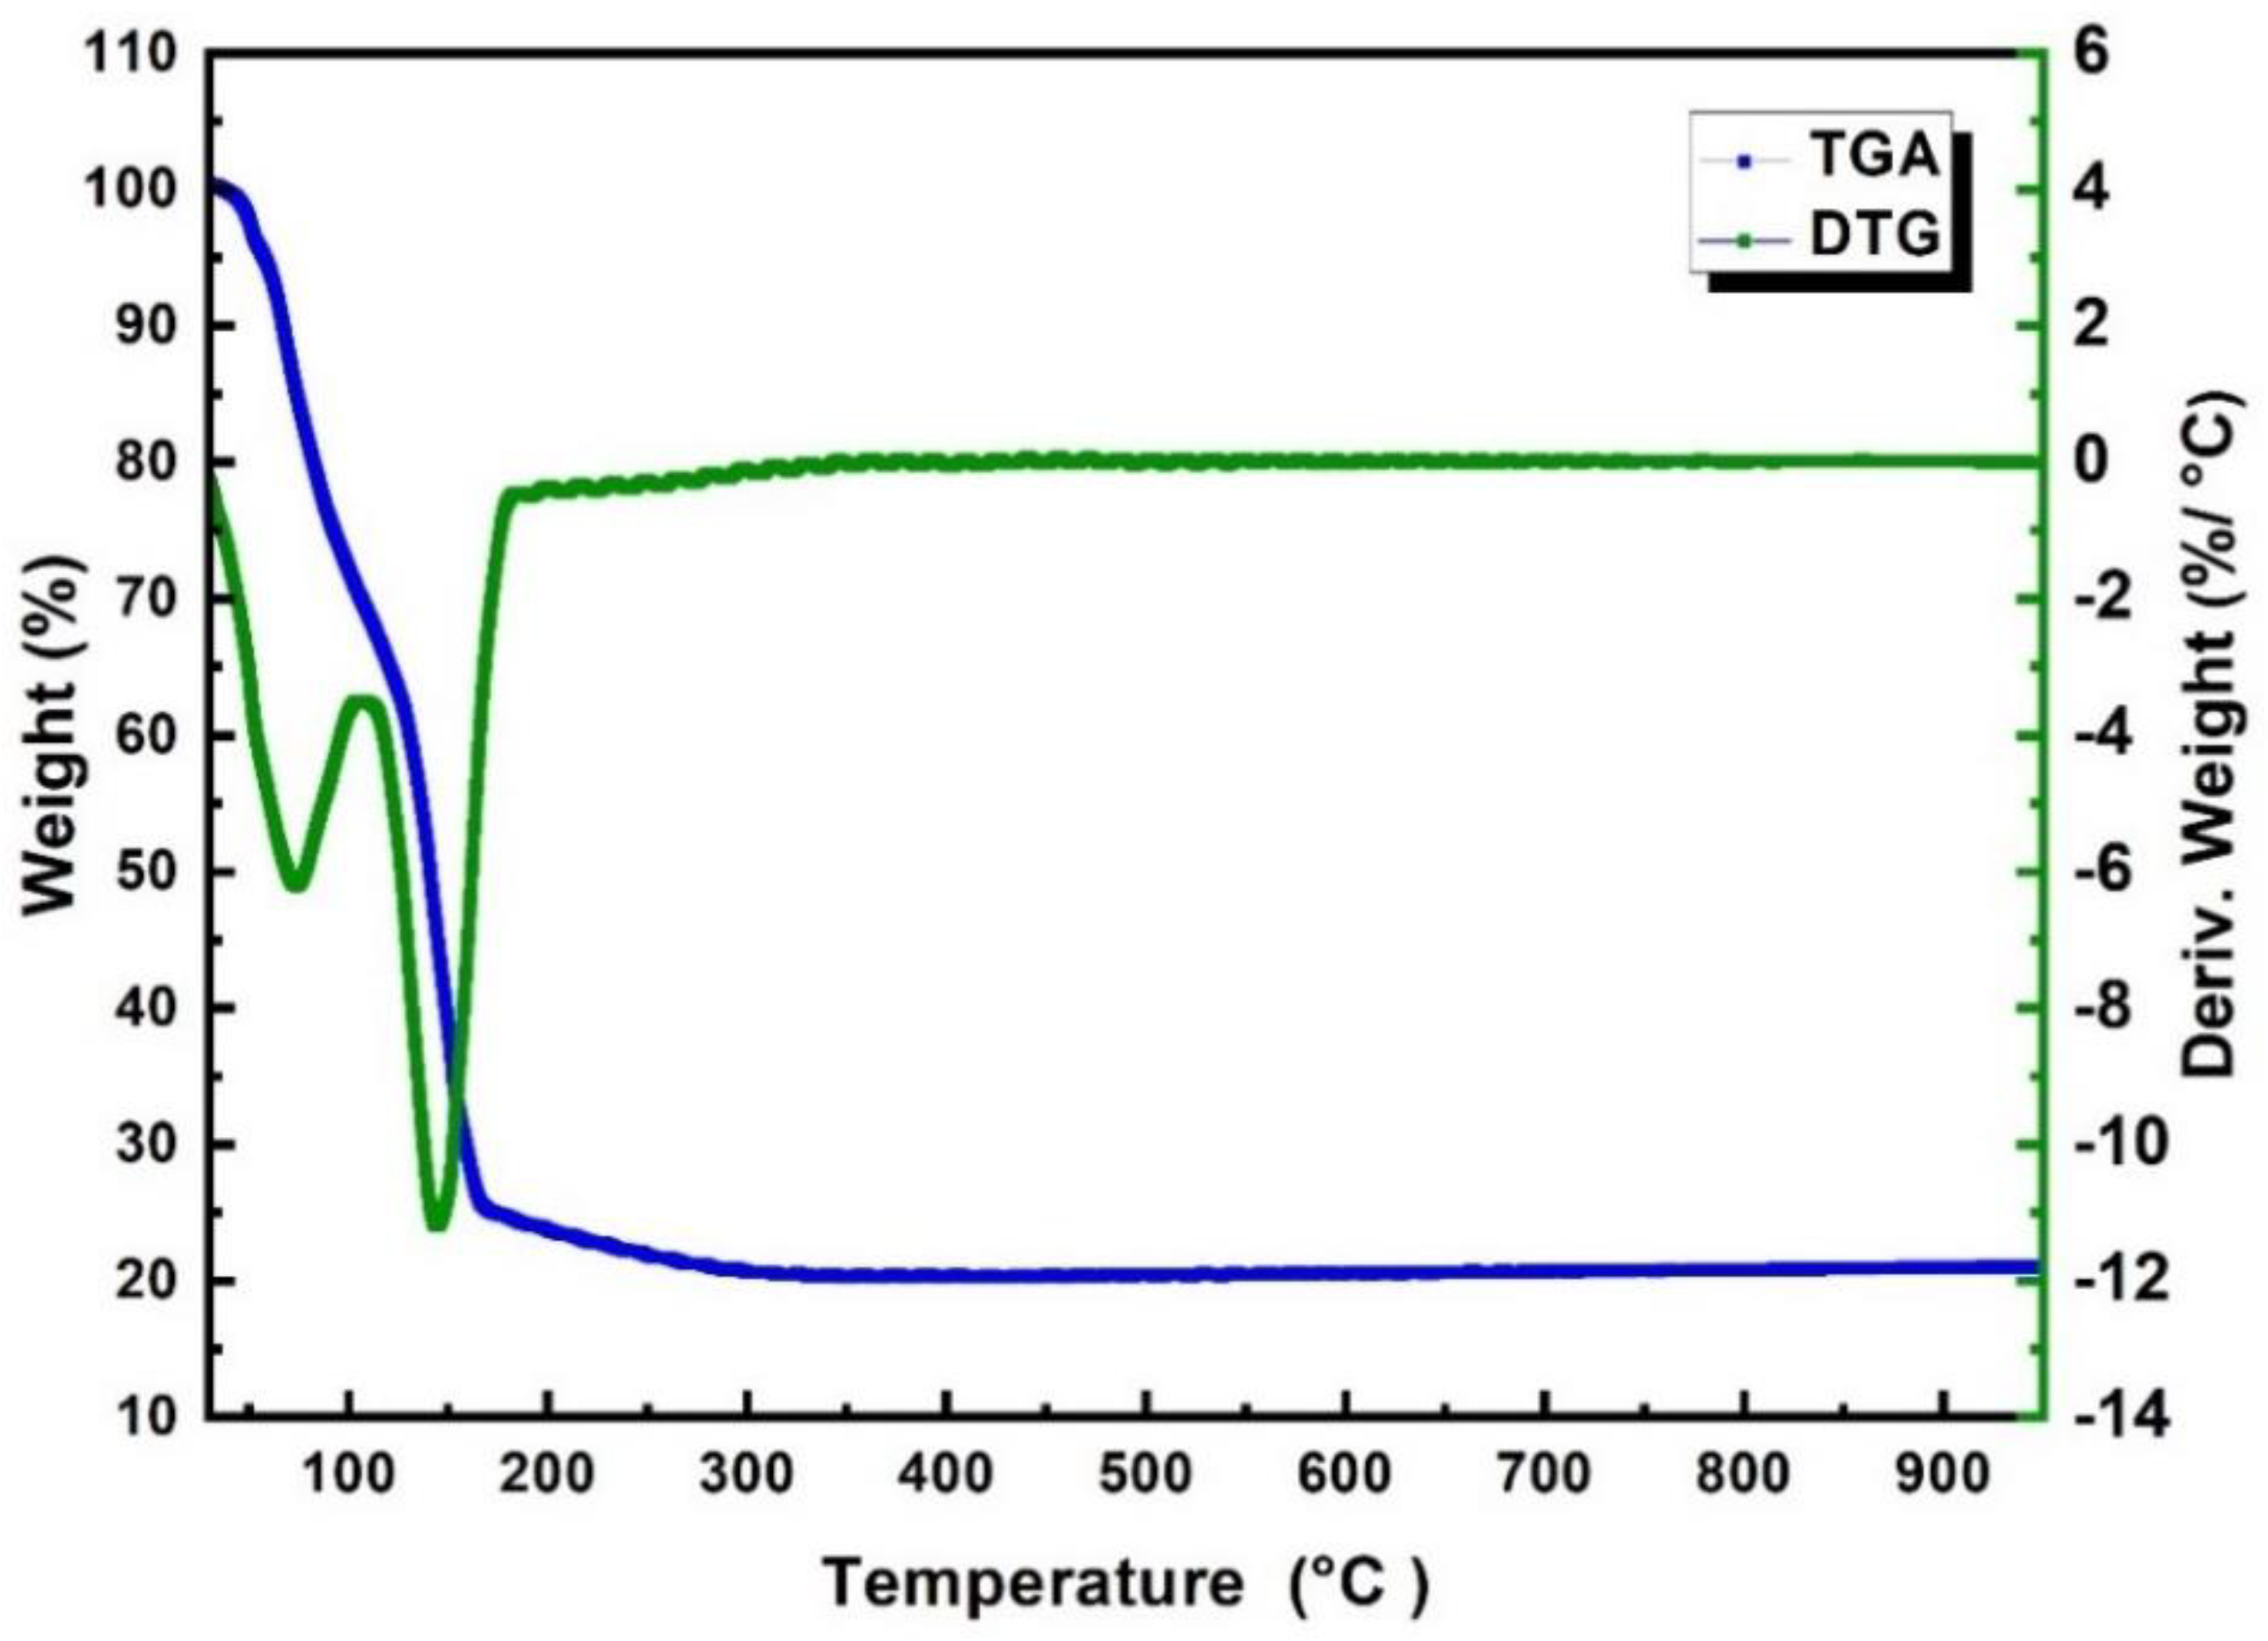
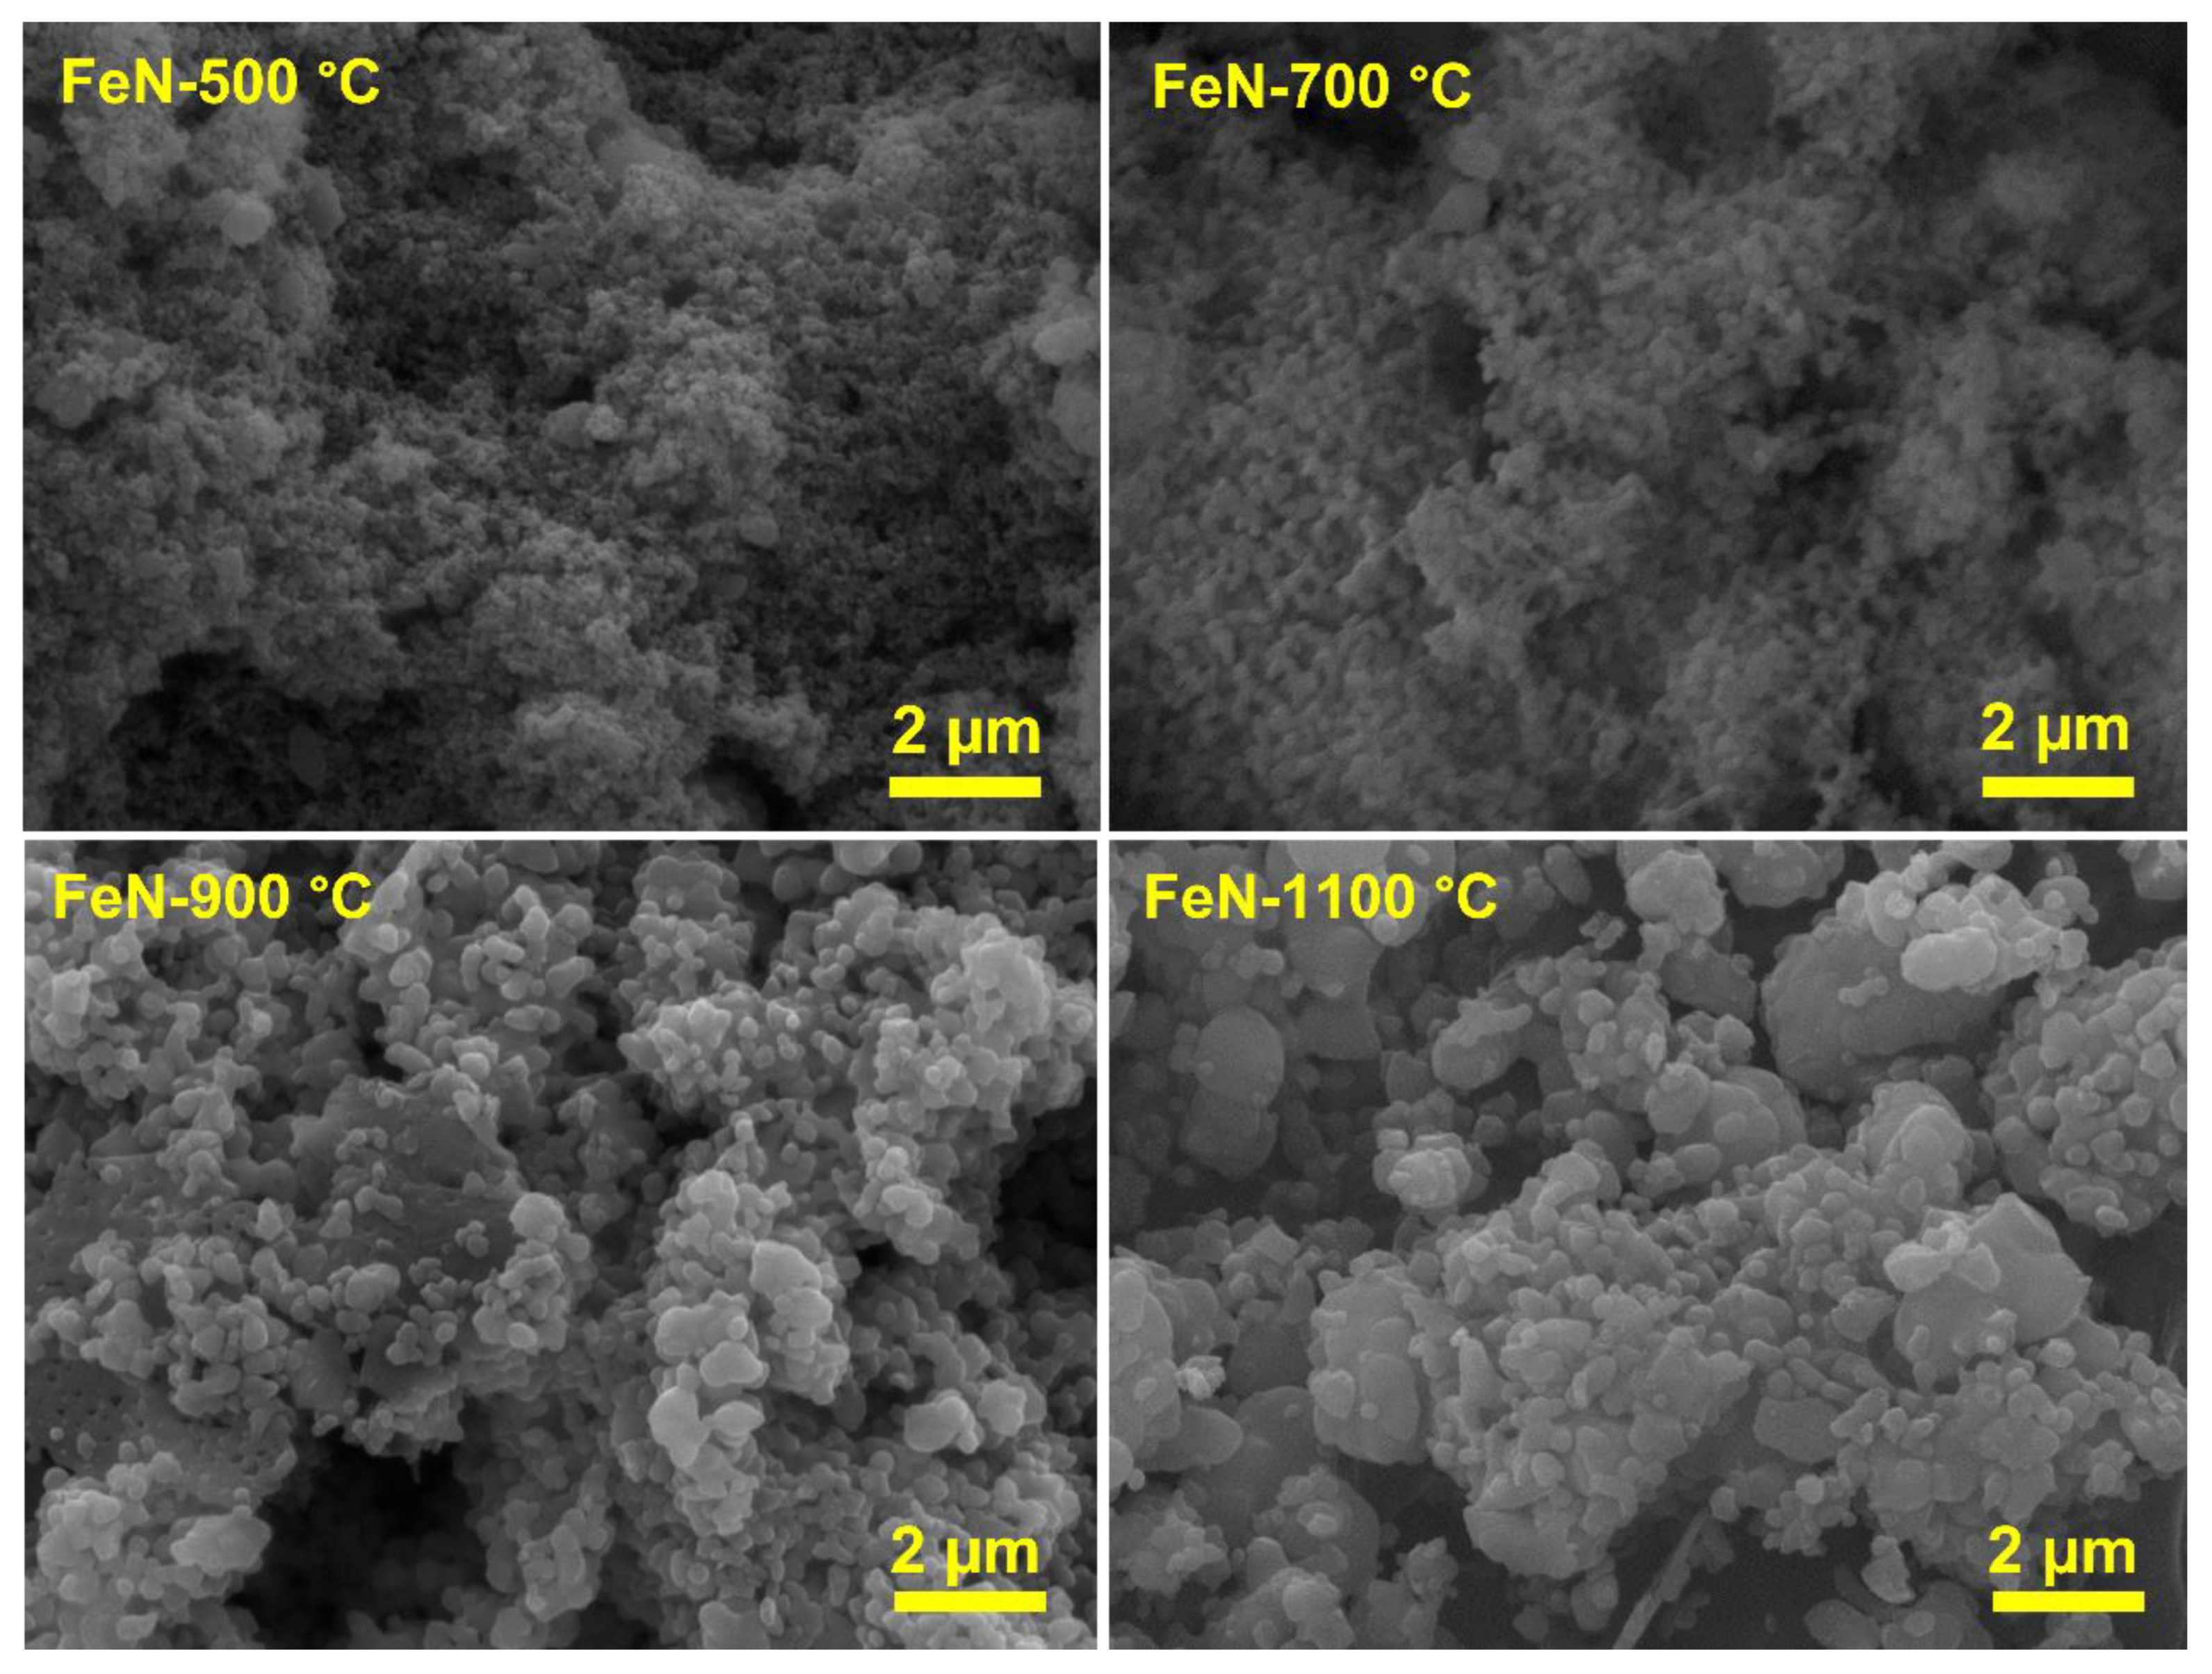
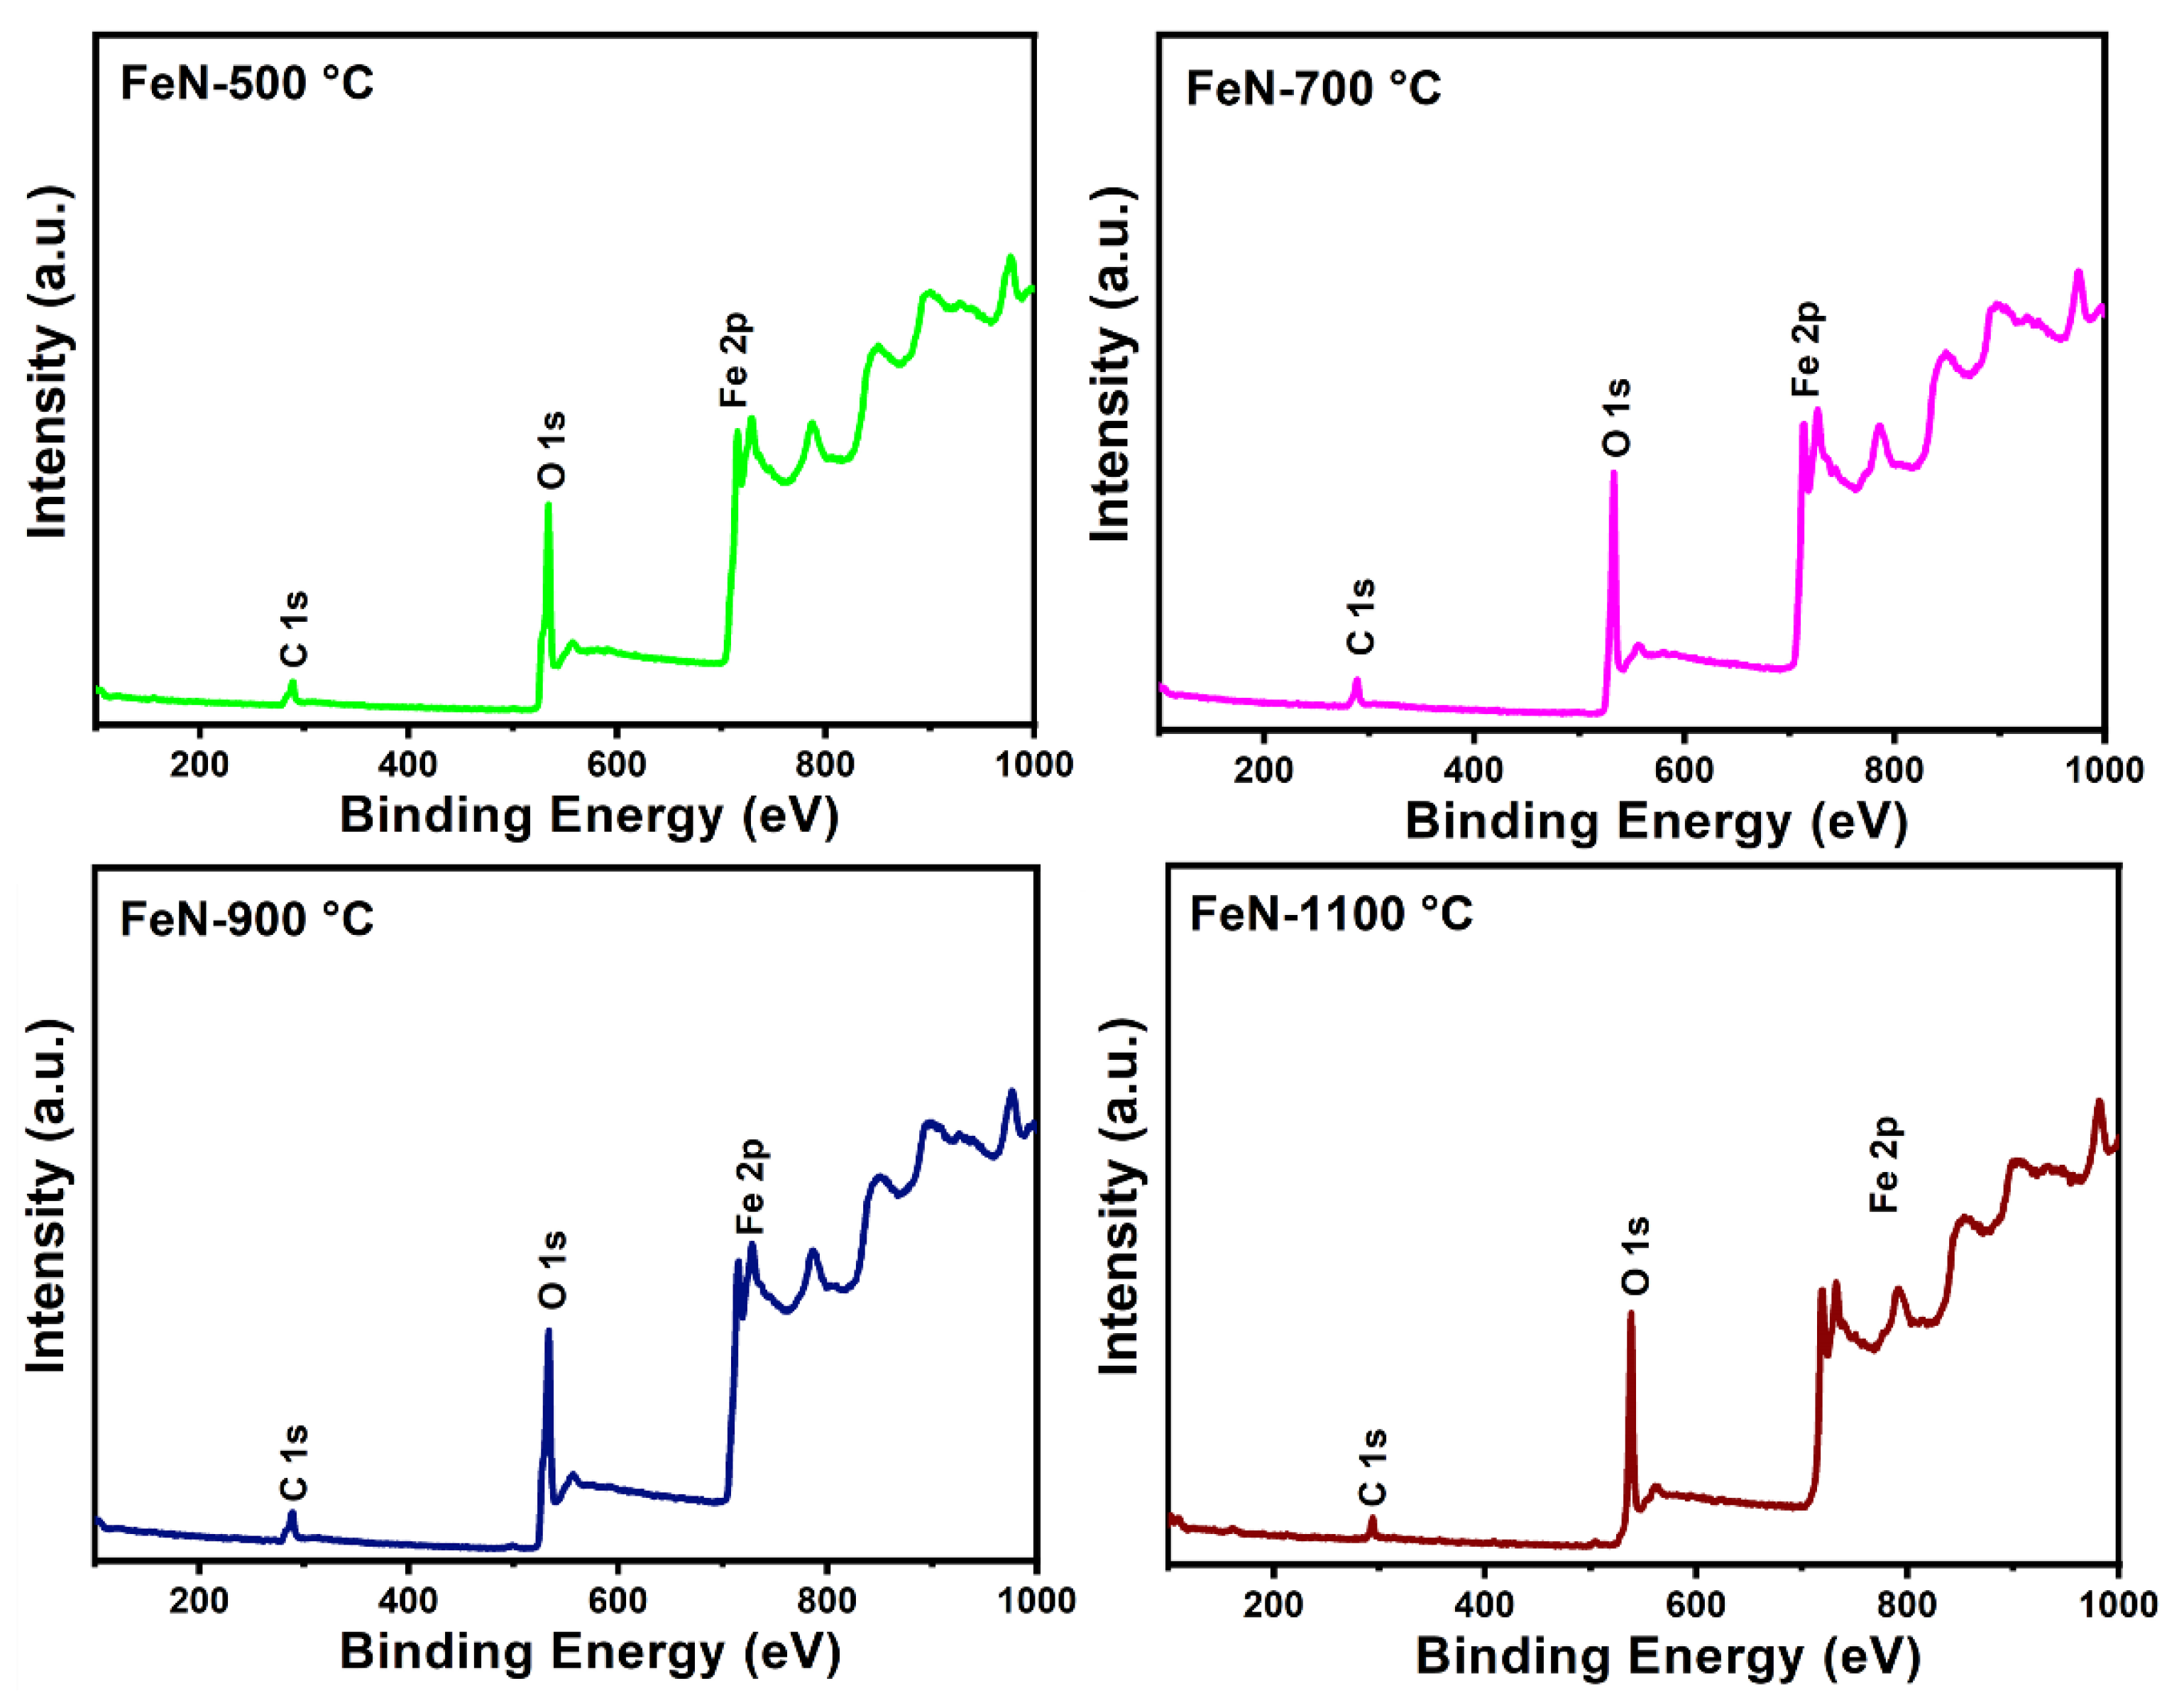
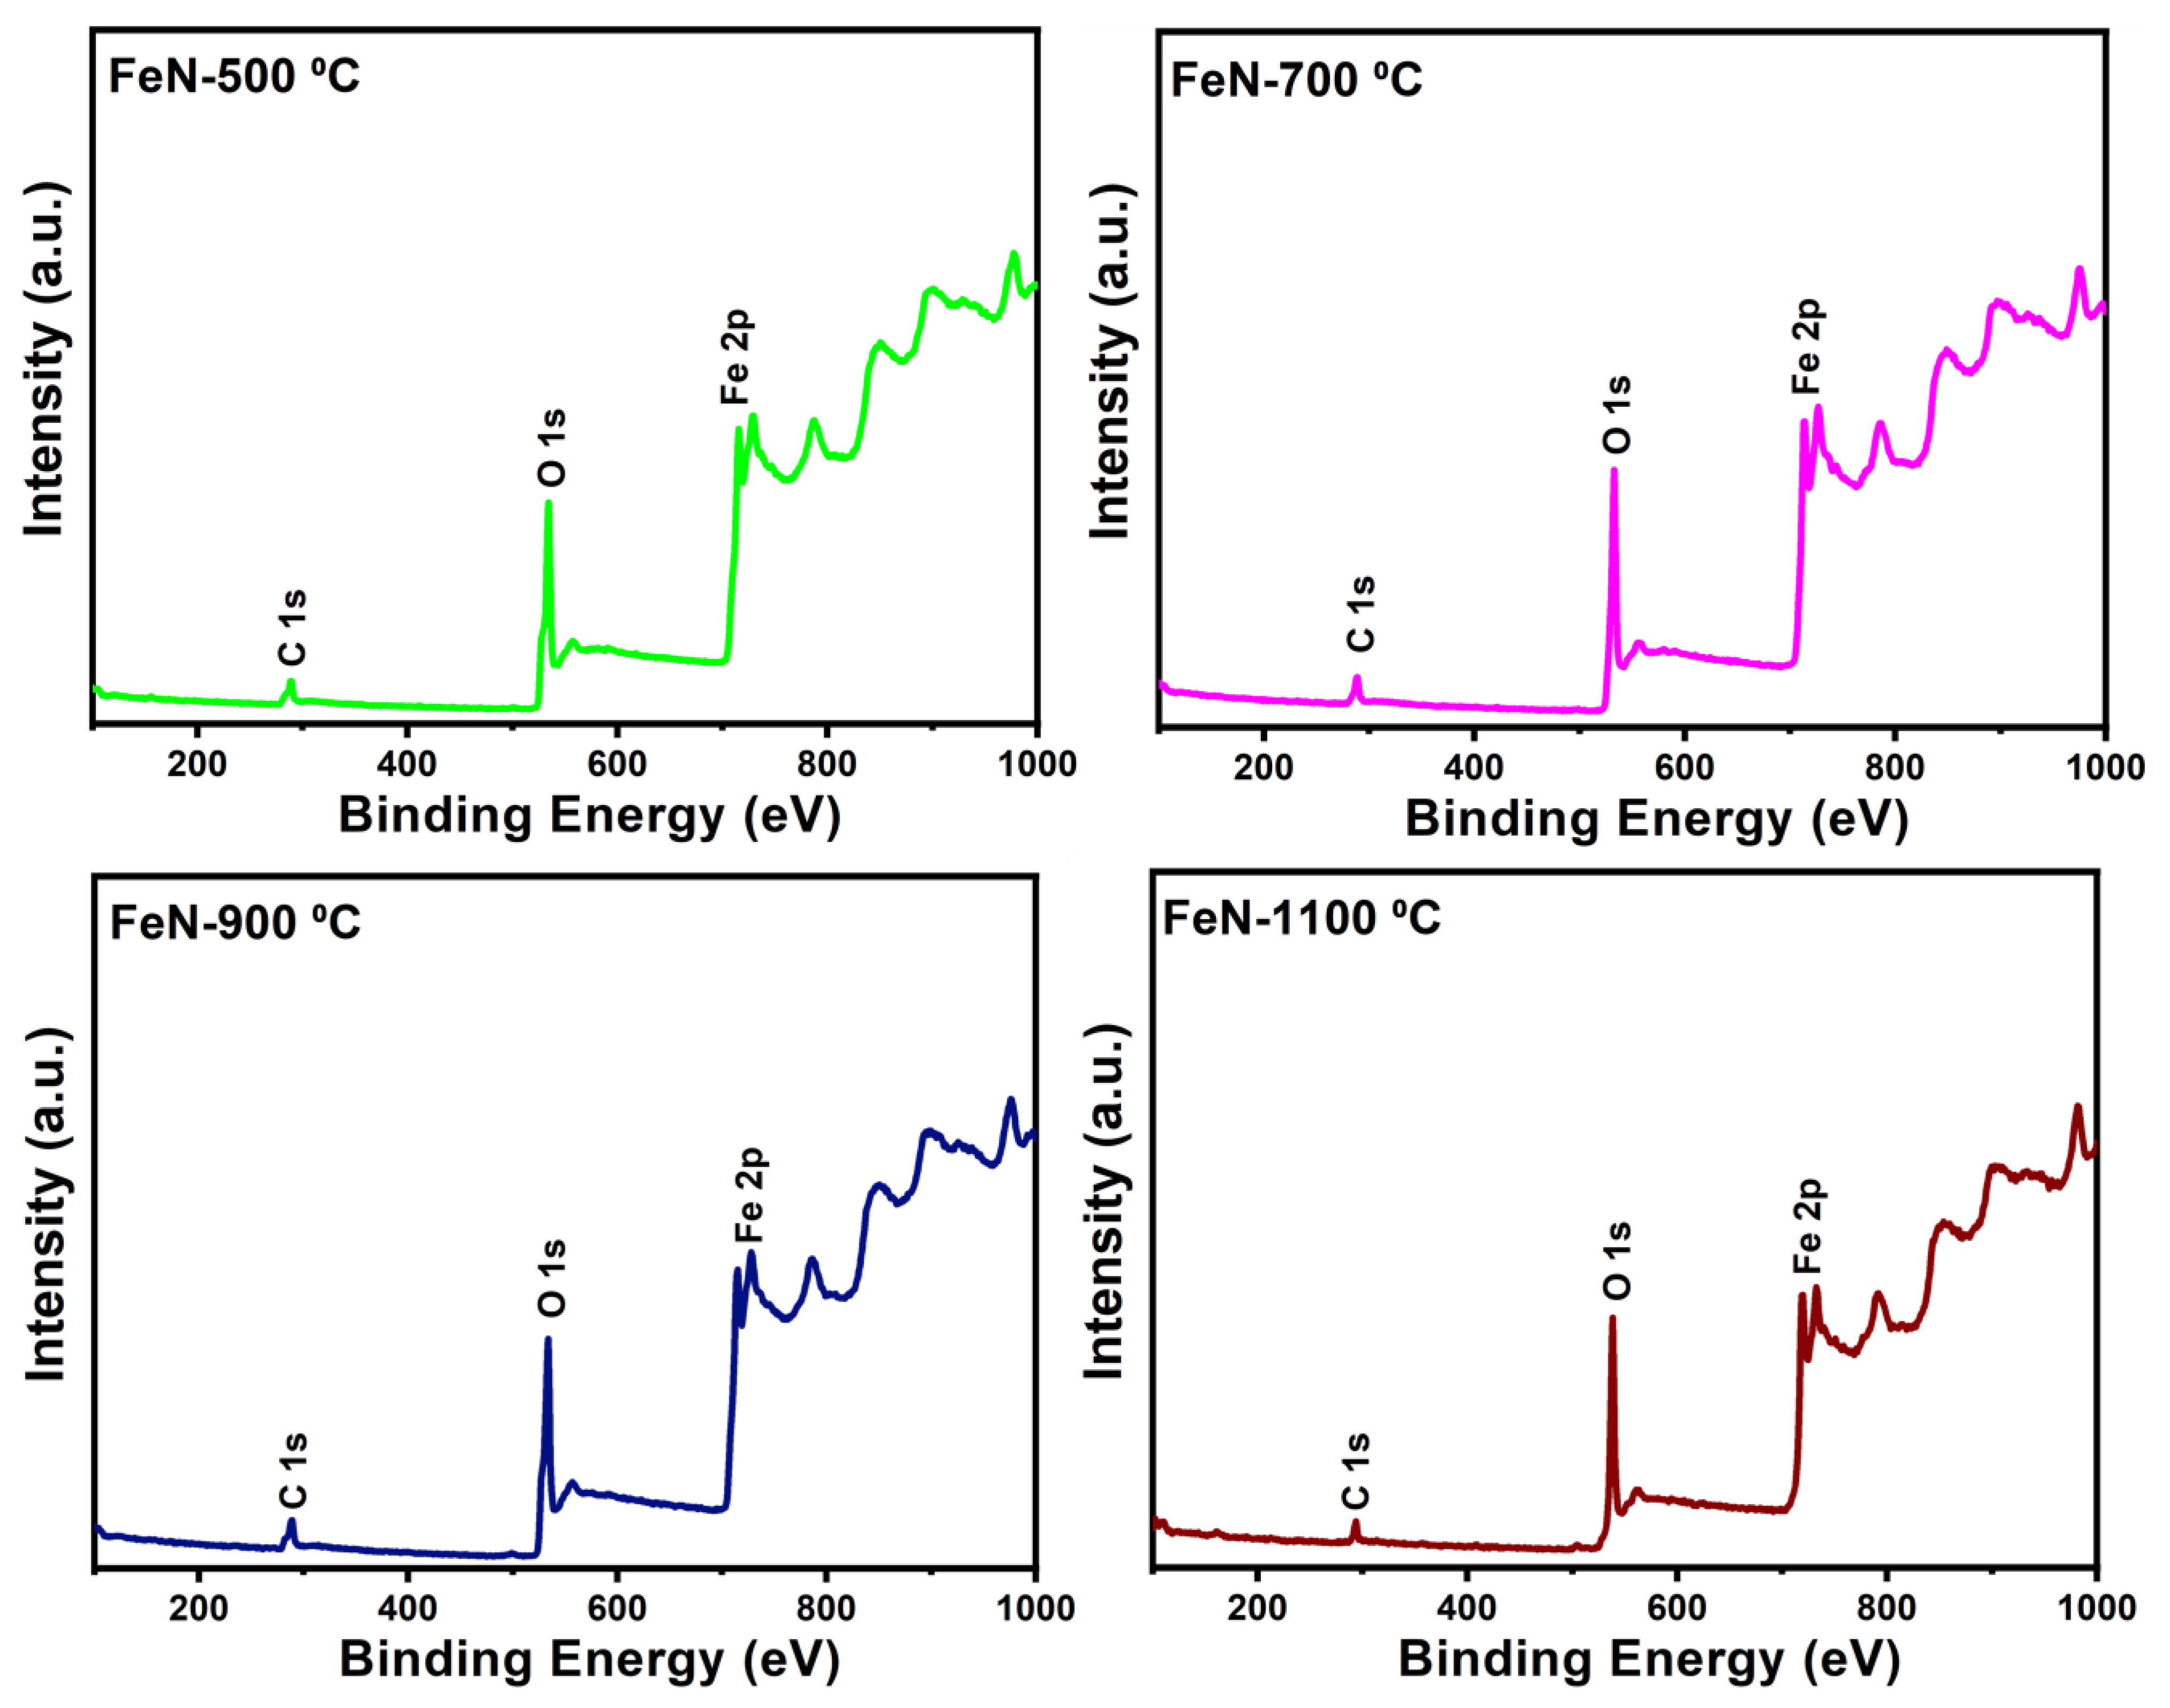
3.1. Characterization of Fresh Samples

The synthesis of OV-rich α-Fe2O3 NPs through the calcination of pure ferric nitrate nonahydrate (Fe(NO3)3·9H2O) at different temperatures (500, 700, 900, and 1100 °C) under ambient conditions is an important aspect of this study, as it allows for the tailoring of the properties of the resulting NPs to optimize their catalytic performance in thermocatalytic methane decomposition.
Interestingly, we observed that the mass of the obtained OV-rich α-Fe2O3 NPs remained constant at different calcination temperatures, as demonstrated in the inset of Figure 1. This finding suggests that the yield of the calcination process is independent of the calcination temperature.
This observation is crucial for the scalability of the synthesis process, as it indicates that the amount of OV-rich α-Fe2O3 NPs that can be obtained is not limited by the calcination temperature. Therefore, this synthesis method can be easily scaled up to produce large quantities of OV-rich α-Fe2O3 NPs for industrial applications, such as energy-efficient thermocatalytic methane decomposition into hydrogen fuel and carbon nanomaterials.
Figure 2 depicts the TGA-DTG curves of pure Fe(NO3)3·9H2O under ambient conditions, demonstrating two distinct mass loss regions. These regions indicate that the decomposition of Fe(NO3)3·9H2O salt into Fe2O3 occurs in two main steps. The first step occurring between 75 and 150 °C could be attributed to the removal of the crystalline water bound to the salt and the decomposition of the nitrates within the salt, which corresponds to the formation of ferric oxyhydroxide (FeOOH). The second step, occurring between 150 and 300 °C, indicates the formation of Fe2O3 [30].
Furthermore, a slight decrease observed before the temperature of 75 °C could potentially be attributed to the loss of adsorbed water weight. The loss of weight corresponding to the removal of adsorbed water from the precursor salt typically begins between 45 and 70 °C, which agrees with our results in Figure 2. It is worth noting that the TGA-DTG analysis reveals that calcination temperatures of around 500 °C and above are effective in removing the nitrate and hydrate groups associated with the ferrous metal. This observation is consistent with the negligible change in the weight of the resulting Fe2O3 when increasing the calcination temperature from 500 °C to 1100 °C at ambient conditions, as shown in Figure 1.
XRD was employed to examine the crystalline structure and determine the phase purity of the obtained OV-rich α-Fe2O3 NPs at different calcination temperatures, and the obtained diffraction patterns are shown in Figure 3.
The diffraction peaks that can be observed in the XRD patterns are centered at the 2θ = 24.3°, 33.4°, 35.8°, 41.1°, 49.7°, 54.5°, 57.9°, 62.4° and 64.4°, and thus correspond to the (012), (104), (110), (113), (024), (116), (018), (214), and (300) diffraction planes of hematite α-Fe2O3 (PDF Number 33-0664) [31]. The absence of any secondary phases confirms that Fe(NO3)3.9H2O has completely decomposed to the α-Fe2O3 hematite phase. Figure 3 demonstrates an increase in the intensity of the diffraction peaks upon increasing the calcination temperature to 700 °C, providing the highest degree of crystallinity for the obtained hematite, α-Fe2O3. The calcination process at 900 and 1100 °C results in a slight decrease in crystallinity of the formed hematite phase, which is attributed to the sintering of the nanoparticles at these temperatures, which may lead to the formation of defects [32].
Scanning electron microscopy (SEM) was employed to examine the morphological features of the obtained OV-rich α-Fe2O3 NPs at different calcination temperatures, and the results are depicted in Figure 4. From Figure 4, it can be seen that the particle size changes gradually with increasing calcination temperatures from 500 to 1100 °C. Although the particle size increases slightly at 700 °C, it remains small and randomly interconnected on a cotton-like surface. The effect of the calcination temperature between 900 and 1100 °C is clearer, as the particles are formed from quasi-spherical shapes and undefined shapes with different sizes, and their sizes increased with the increase in calcination temperatures from 900 to 1100 °C. It is known that when the calcination temperature rises, the particle size becomes larger due to particle growth and/or agglomeration [12].
The textural properties of the OV-rich α-Fe2O3 NPs were measured utilizing N2 adsorption-desorption isotherms and Brunauer-Emmett-Teller (BET)/Barrett-Joyner-Halenda (BJH) analysis, and the findings are presented in Table 1 and Figure 5. As can be seen from the data reported in Table 1, calcination temperature significantly affected the BET surface parameters of the studied materials, whereby the BET surface area declined from 16.70 to 3.90 m2/g as the calcination temperature increased from 500 to 1100 °C.
This trend could be attributed to particle agglomeration associated with elevated temperatures. Figure 5a displays the N2 adsorption−desorption isotherms of the obtained OV-rich α-Fe2O3 NPs at different calcination temperatures and shows that they are of type IV with H3 hysteresis loop, which is typical of mesoporous hematite α-Fe2O3 [33]. Furthermore, as the hysteresis loop areas decline with increasing calcination temperature, this finding further confirms that calcination may induce the collapse of some porous materials [34]. Usually, H3-type hysteresis is produced by solids with aggregate or agglomerate particles of non-uniform size and/or shape [35]. The isotherms depicted in Figure 5b reveal the mesoporous nature of OV-rich α-Fe2O3 NPs based on the pore size distribution, which remained in the 19−22 nm range.
Thus, from the SEM images (Figure 4), it is concluded that the particle size increased with the increase in the calcination temperature due to the sintering and/or agglomeration of the particles. This observation is consistent with the results of the surface area analysis (Table 1), as it decreased with the increase in calcination temperature.
The chemical composition and elemental states of the obtained OV-rich α-Fe2O3 NPs at different calcination temperatures were probed by X-ray photoelectron spectroscopy (XPS), and the findings are shown in Figure 6. The XPS survey spectra of the examined OV-rich α-Fe2O3 NPs depicted in Figure 6 confirm that Fe, O, and C are the only constituents, whereby the presence of carbon is mainly attributed to its absorption from the atmosphere before XPS measurements. On the other hand, the oxygen peaks indicate successful α-Fe2O3 formation. The O 1s spectra of the OV-rich α-Fe2O3 NPs samples presented in Figure 7 confirm the presence of four chemical states of the surface oxygen species. The main peak located at around 529.5 eV can be ascribed to the lattice oxygen of α-Fe2O3 (Fe3+–O, labeled as O2), while the signal at the 531.8 eV binding energy corresponds to the hydroxyl group (–OH, labeled O3). Interestingly, the peak resulting from the hydroxyl group shifts towards lower energy for the sample that was calcined at 900 °C, which indicates these samples are oxygen-deficient. Thus, the peak O3 at around 531.1 in the FeN-900 °C sample is attributed to the low-coordinated oxygen species adsorbed onto the oxygen vacancies, likely arising from the formation of oxygen vacancies on the NP’s surface. On the other hand, the peaks that appear in the 533–536 eV energy range (labeled as O4) may be related to the surface-adsorbed H2O molecules and carbonate species [27,29,36]. Finally, the peak (O1) that appeared at 527.6 eV in FeN-500 °C, FeN-700 °C, and FeN-900 °C samples is attributed to the fact that some of the Fe3+ on the surface can be changed to a low oxidation state such as Fe2+ which is usually associated with the formation of OVs. The OVs are expected to play an important role in the adsorption process, as these vacancy sites can act as initiators for the adsorption of molecules in many surface reactions (i.e., many species such as H2O and CO2 will adsorb on the OVs from ambient air).
As defect states (such as OVs) are known to appear on the surface of metal oxides at high temperatures, it is clear from Figure 7 that the number of defects increases with increasing temperature from FeN-500 °C-FeN-900 °C. Moreover, the O2 peak ascribed to the lattice oxygen in the FeN-900 °C sample is shifted to lower bending energy compared to the other samples, which implies the oxygen vacancies are present in high concentration in this sample.
Figure 8 illustrates the Fe 2p3/2 XPS spectra of the OV-rich α-Fe2O3 NPs obtained in this study. The spectra exhibit five peaks, with two peaks located at 707.6 and 709.7 eV attributed to Fe2+ and the peaks at 712.6 and ~715.4 eV corresponding to the oxidation state of Fe3+. Additionally, a peak at ~720.6 eV can be assigned to the satellite peak, as suggested by previous studies [29,37,38]. The Fe2+/Fe3+ ratio was calculated to be 0.20, 0.29, 0.36, and 0.22 for samples FeN-500 °C, FeN-700 °C, FeN-900 °C, and FeN-1100 °C, respectively, indicating the formation of OVs.
Notably, an additional small peak appeared at 706.2 eV in the FeN-900 °C sample, which is attributed to Fe0, suggesting that some Fe3+ was reduced into Fe0, a phenomenon commonly associated with the formation of OVs. The absence of this peak in other samples suggests that the FeN-900 °C sample may contain a higher concentration of OVs. OVs may accelerate the iron oxide reduction process and lead to the formation of more active sites, thereby enhancing catalytic activity.

3.2. Thermocatalytic Activity of the Obtained OV-Rich α-Fe2O3 NPs

The obtained OV-rich α-Fe2O3 NPs at different calcination temperatures were used as catalysts for the TCMD reaction. Their thermocatalytic activities were investigated at a fixed operating temperature of 800 °C and a gas flow rate of (20 mL/min). It should be noted that these materials did not undergo pre-reduction treatment before the reaction. Figure 9a,b show the methane conversion percentage (%) and hydrogen formation rate as a function of time on stream (TOS). From Figure 9a,b, it is clear that the prepared OV-rich α-Fe2O3 NPs at 1100 °C showed the lowest activity, where the highest methane conversions achieved were 9.20%, whereas the highest hydrogen formation rate was 20.80 × 10⁻⁵ mol H2 g−1 min−1. In contrast, the prepared OV-rich α-Fe2O3 NPs at 500, 700, and 900 °C displayed higher activity, which can be observed in the initial phase of the reaction, where the maximum methane conversions reached 37.8, 26.1, and 35.2%, respectively, while the maximum hydrogen formation rate was 74.0 × 10⁻⁵, 40.3 × 10⁻⁵ and 68.2 × 10⁻⁵ mol H2 g−1 min−1. It appears that these samples have a partially reducible component that forms active sites, which was followed by a rapid carbon deposit on them, subsequently suppressing their performance. Moreover, after 200 min of TOS, it is noted that the samples of OV-rich α-Fe2O3 NPs showed different activity as there was a gradual increase in their activity, and the order of performance was as follows: the prepared OV-rich α-Fe2O3 NPs at 900 °C > OV-rich α-Fe2O3 NPs at 700 °C > OV-rich α-Fe2O3 NPs at 500 °C > OV-rich α-Fe2O3 NPs at 1100 °C, and the maximum methane conversions achieved were 22.5, 20.6, 18.6, and 9.3%, respectively, whereas the maximum hydrogen formation rate was 47.0 × 10⁻⁵, 44.0 × 10⁻⁵, 40.7 × 10⁻⁵ and 20.83 mol H2 g−1 min−1, respectively.
Although these materials have the same phase of α-Fe2O3, the reaction was carried out under the same conditions, and the amount of catalyst and its iron content were constant, there is a variation in their activities. It appears that the surface area did not play a role in the activity of these materials, as increasing the calcination temperature led to an increase in the particle size and thus a decrease in the surface area, as seen in SEM images in Figure 4, and a sharp decrease in its surface area as shown in Table 1.
In an attempt to find the reasons for these disparate activities, it would appear to be due to the presence of defects in the iron oxide composition that arose from the effect of calcination temperatures. The results of XPS analysis (Figure 7 and Figure 8) showed that there are OVs on the α-Fe2O3 NPs surface, which may have played a significant role in the activity of these materials. It is noteworthy that the FeN-500 °C sample at the beginning of the reaction showed a high methane conversion percentage and hydrogen formation rate compared to the FeN-900 °C sample. However, the high activity of FeN-900 °C at the end of the TCMD reaction may be due to the presence of a high concentration of OVs on its surface, as observed in the XPS results in Figure 7 and Figure 8. The OVs on the α-Fe2O3 NPs surface play an important role in accelerating the iron oxide reduction process compared to those that contain fewer vacancies, which lead to the formation of more active sites during the TCMD, which act as effective active sites for the adsorption of methane. On the other hand, the low catalytic activity of the FeN-1100 °C catalysts can be attributed to the low concentration of the OVs, as is clear from the XPS results of these catalysts, which made them difficult to reduce during the reaction run period as these catalysts were not subjected to a prior reduction process [39].
It is worth mentioning that the activity of the prepared unsupported α-Fe2O3 catalysts by our scalable and cost-effective strategy is comparable with previously reported Fe-based catalysts for TCMD, as presented in Table 2, where WHSV is weight hourly space velocity.

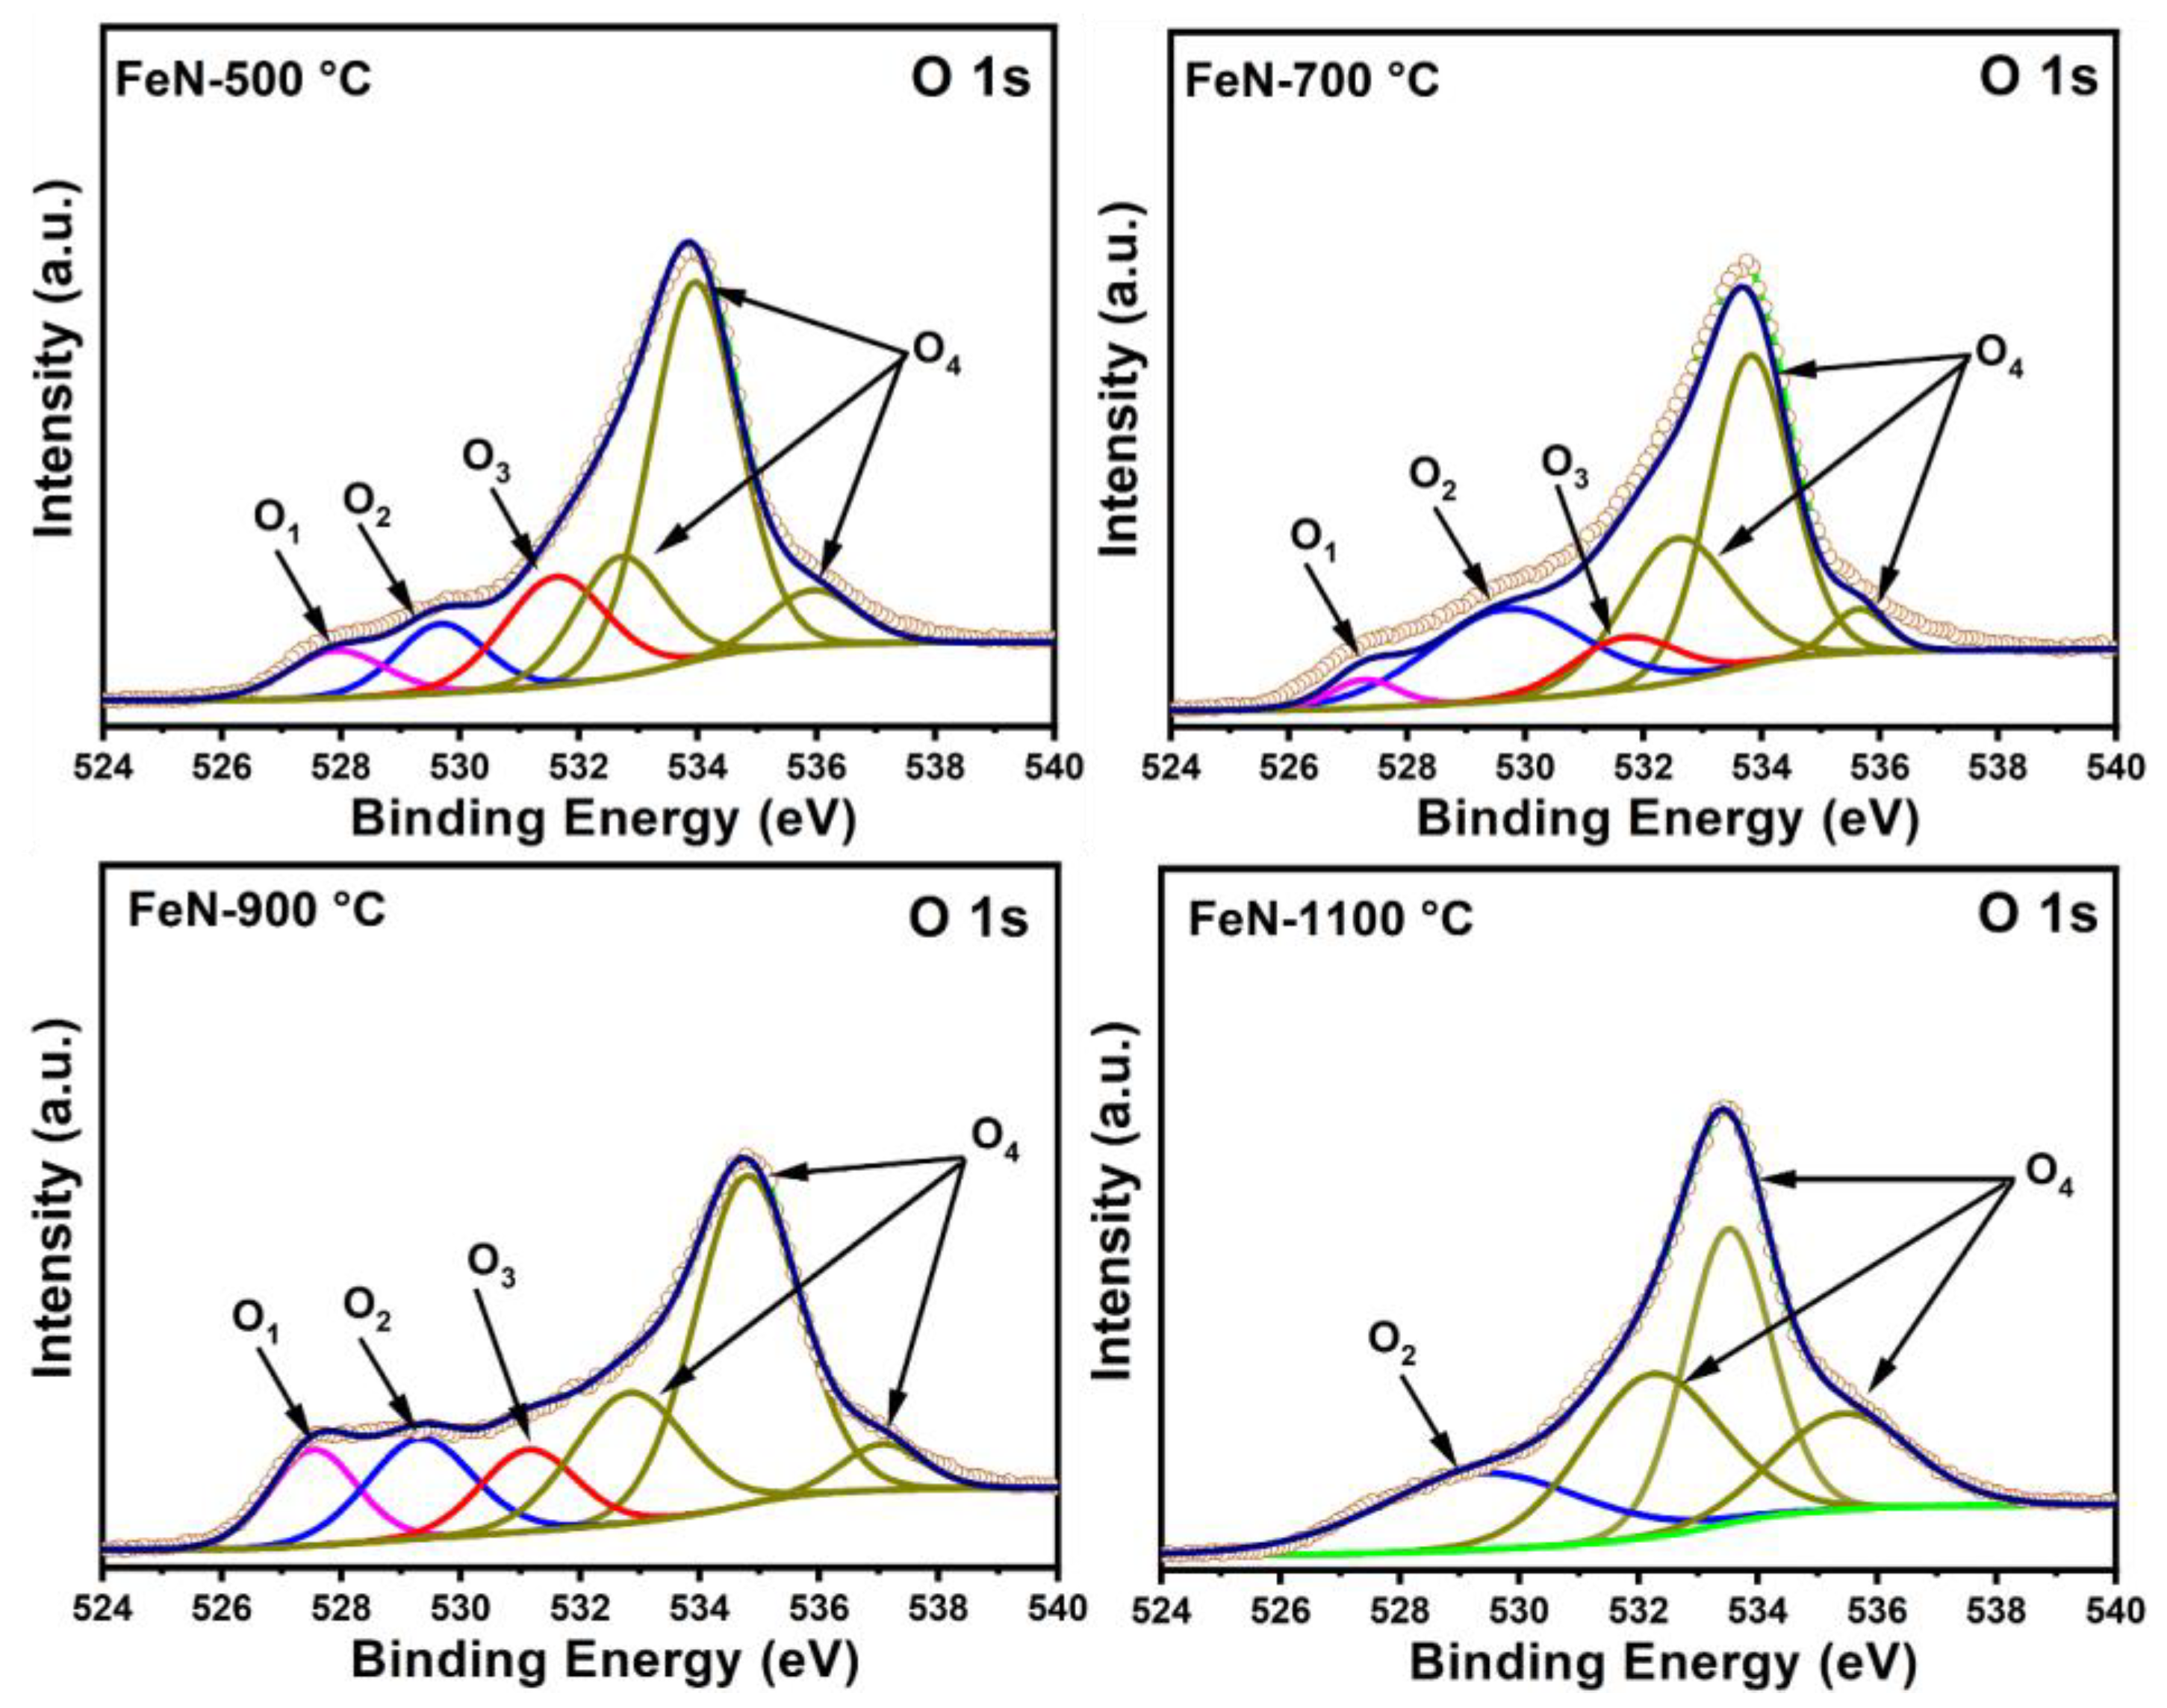
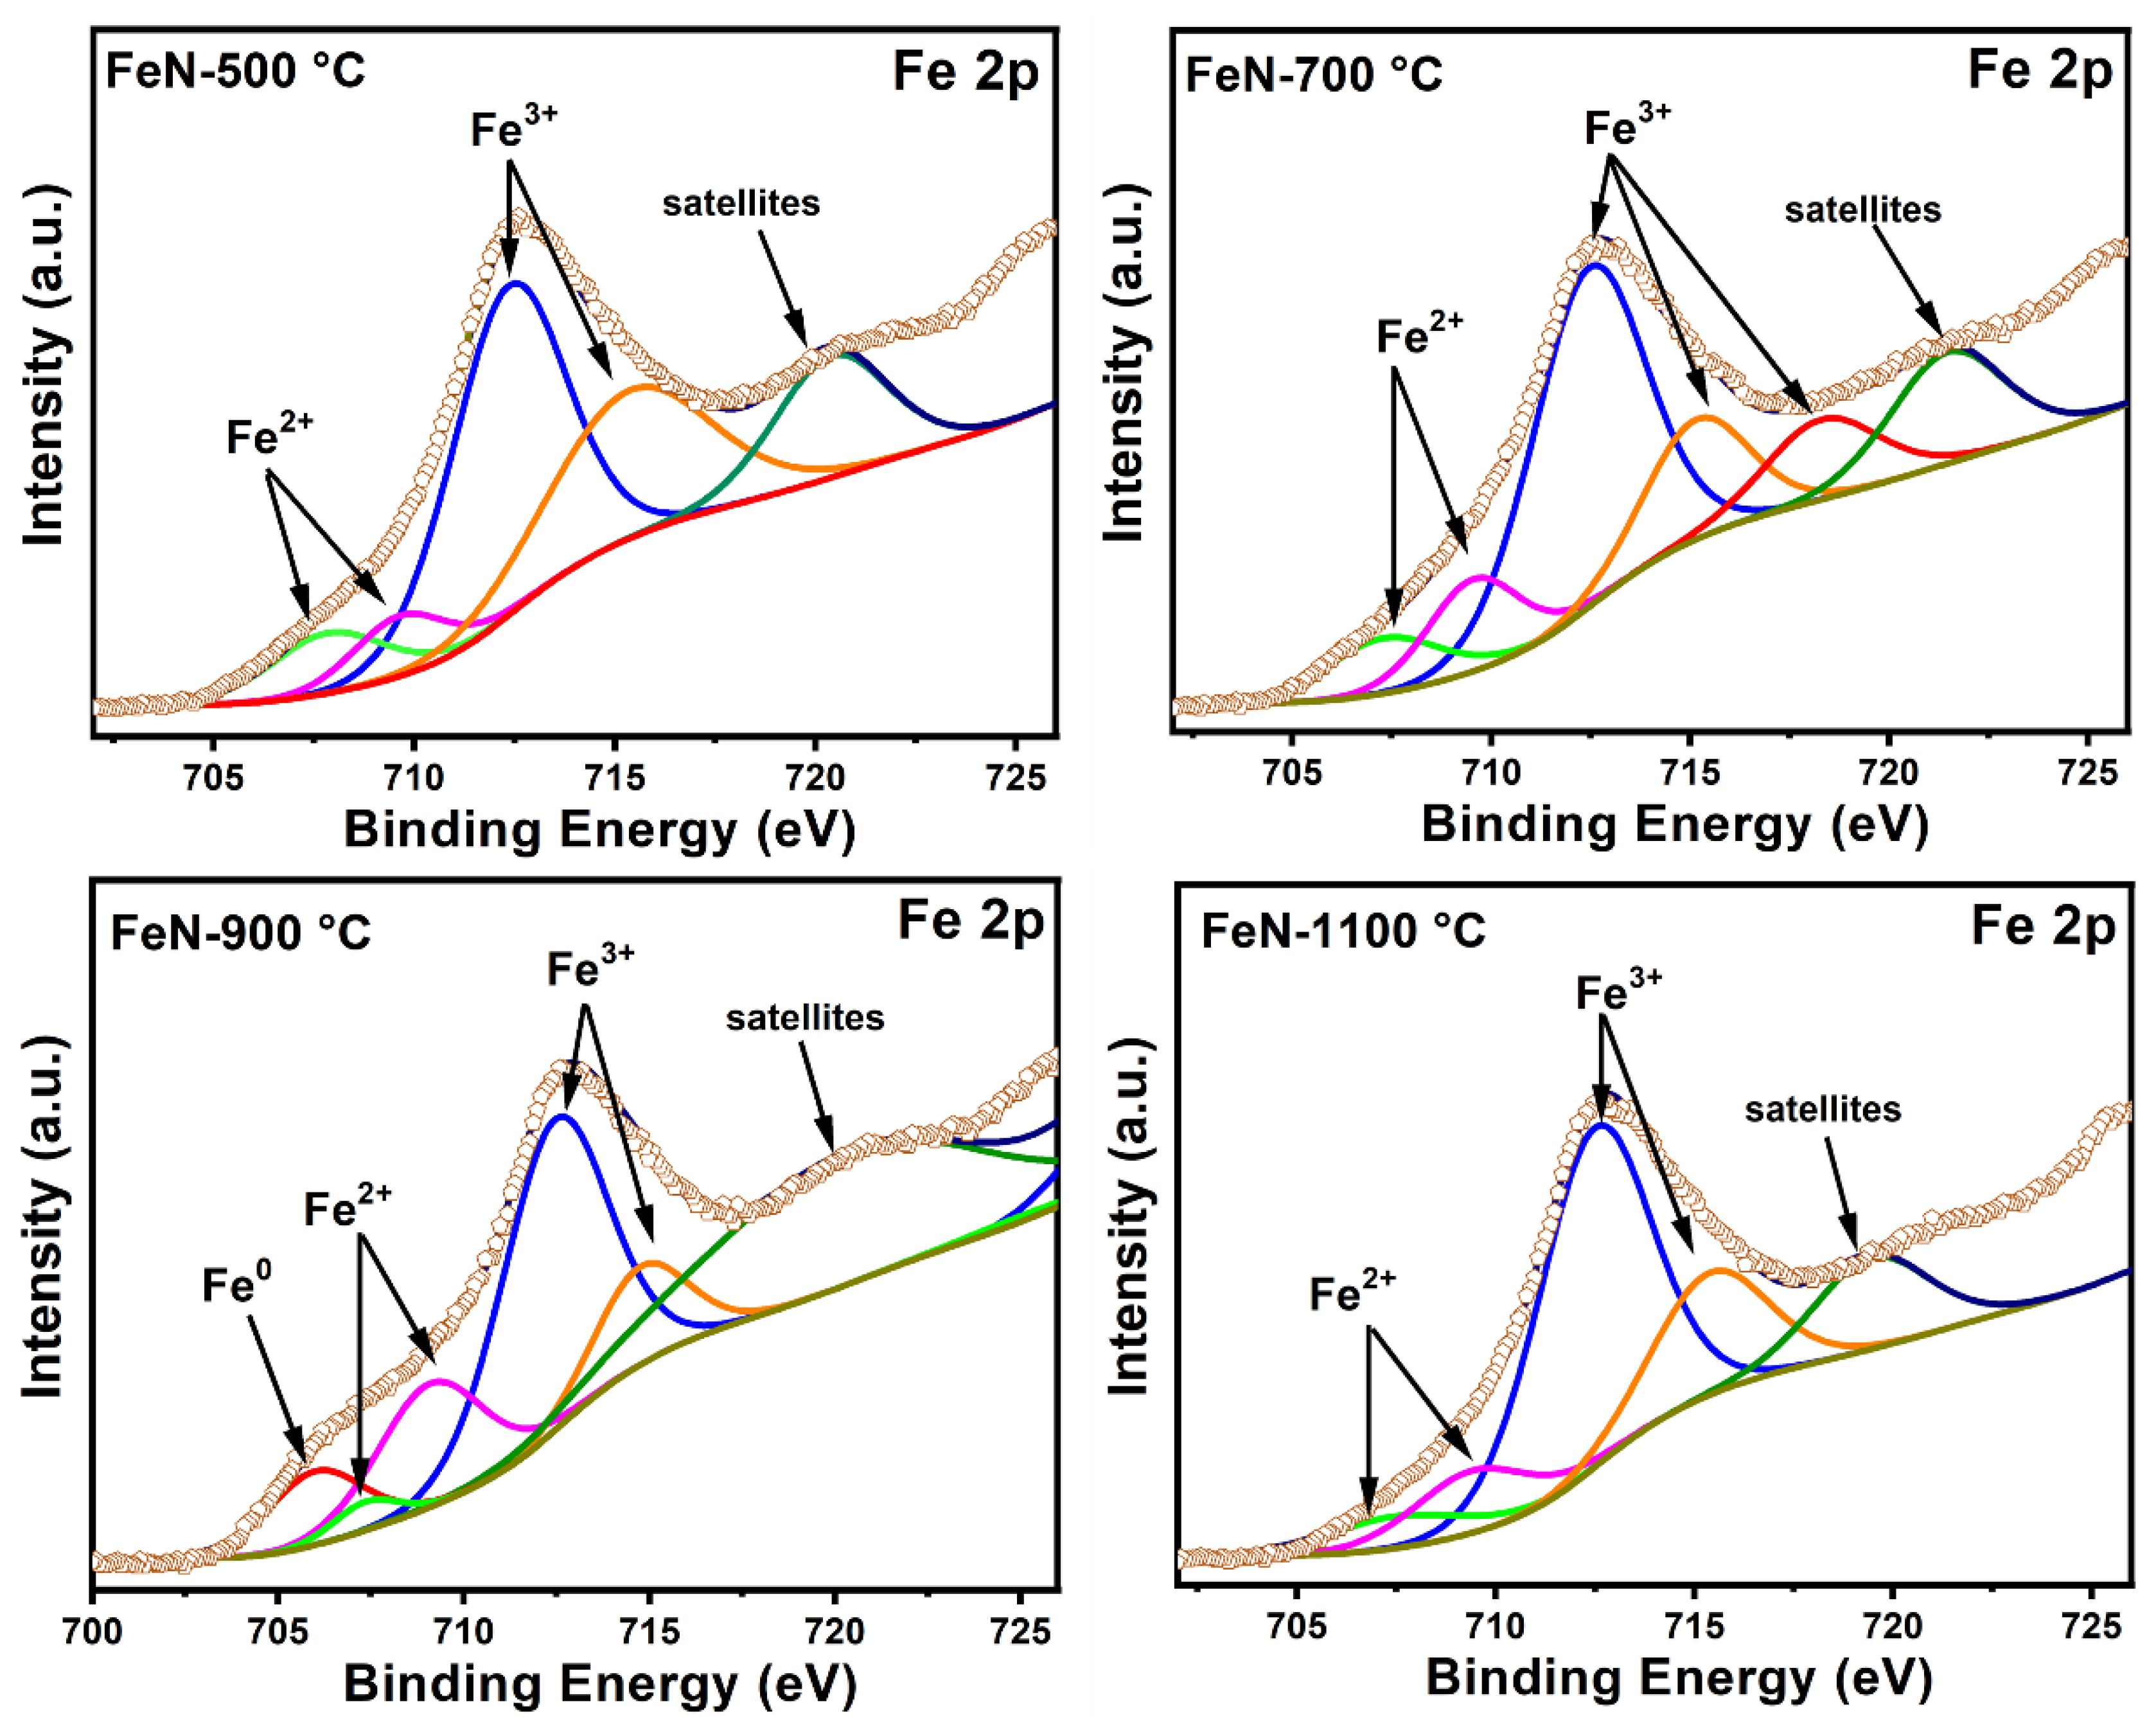
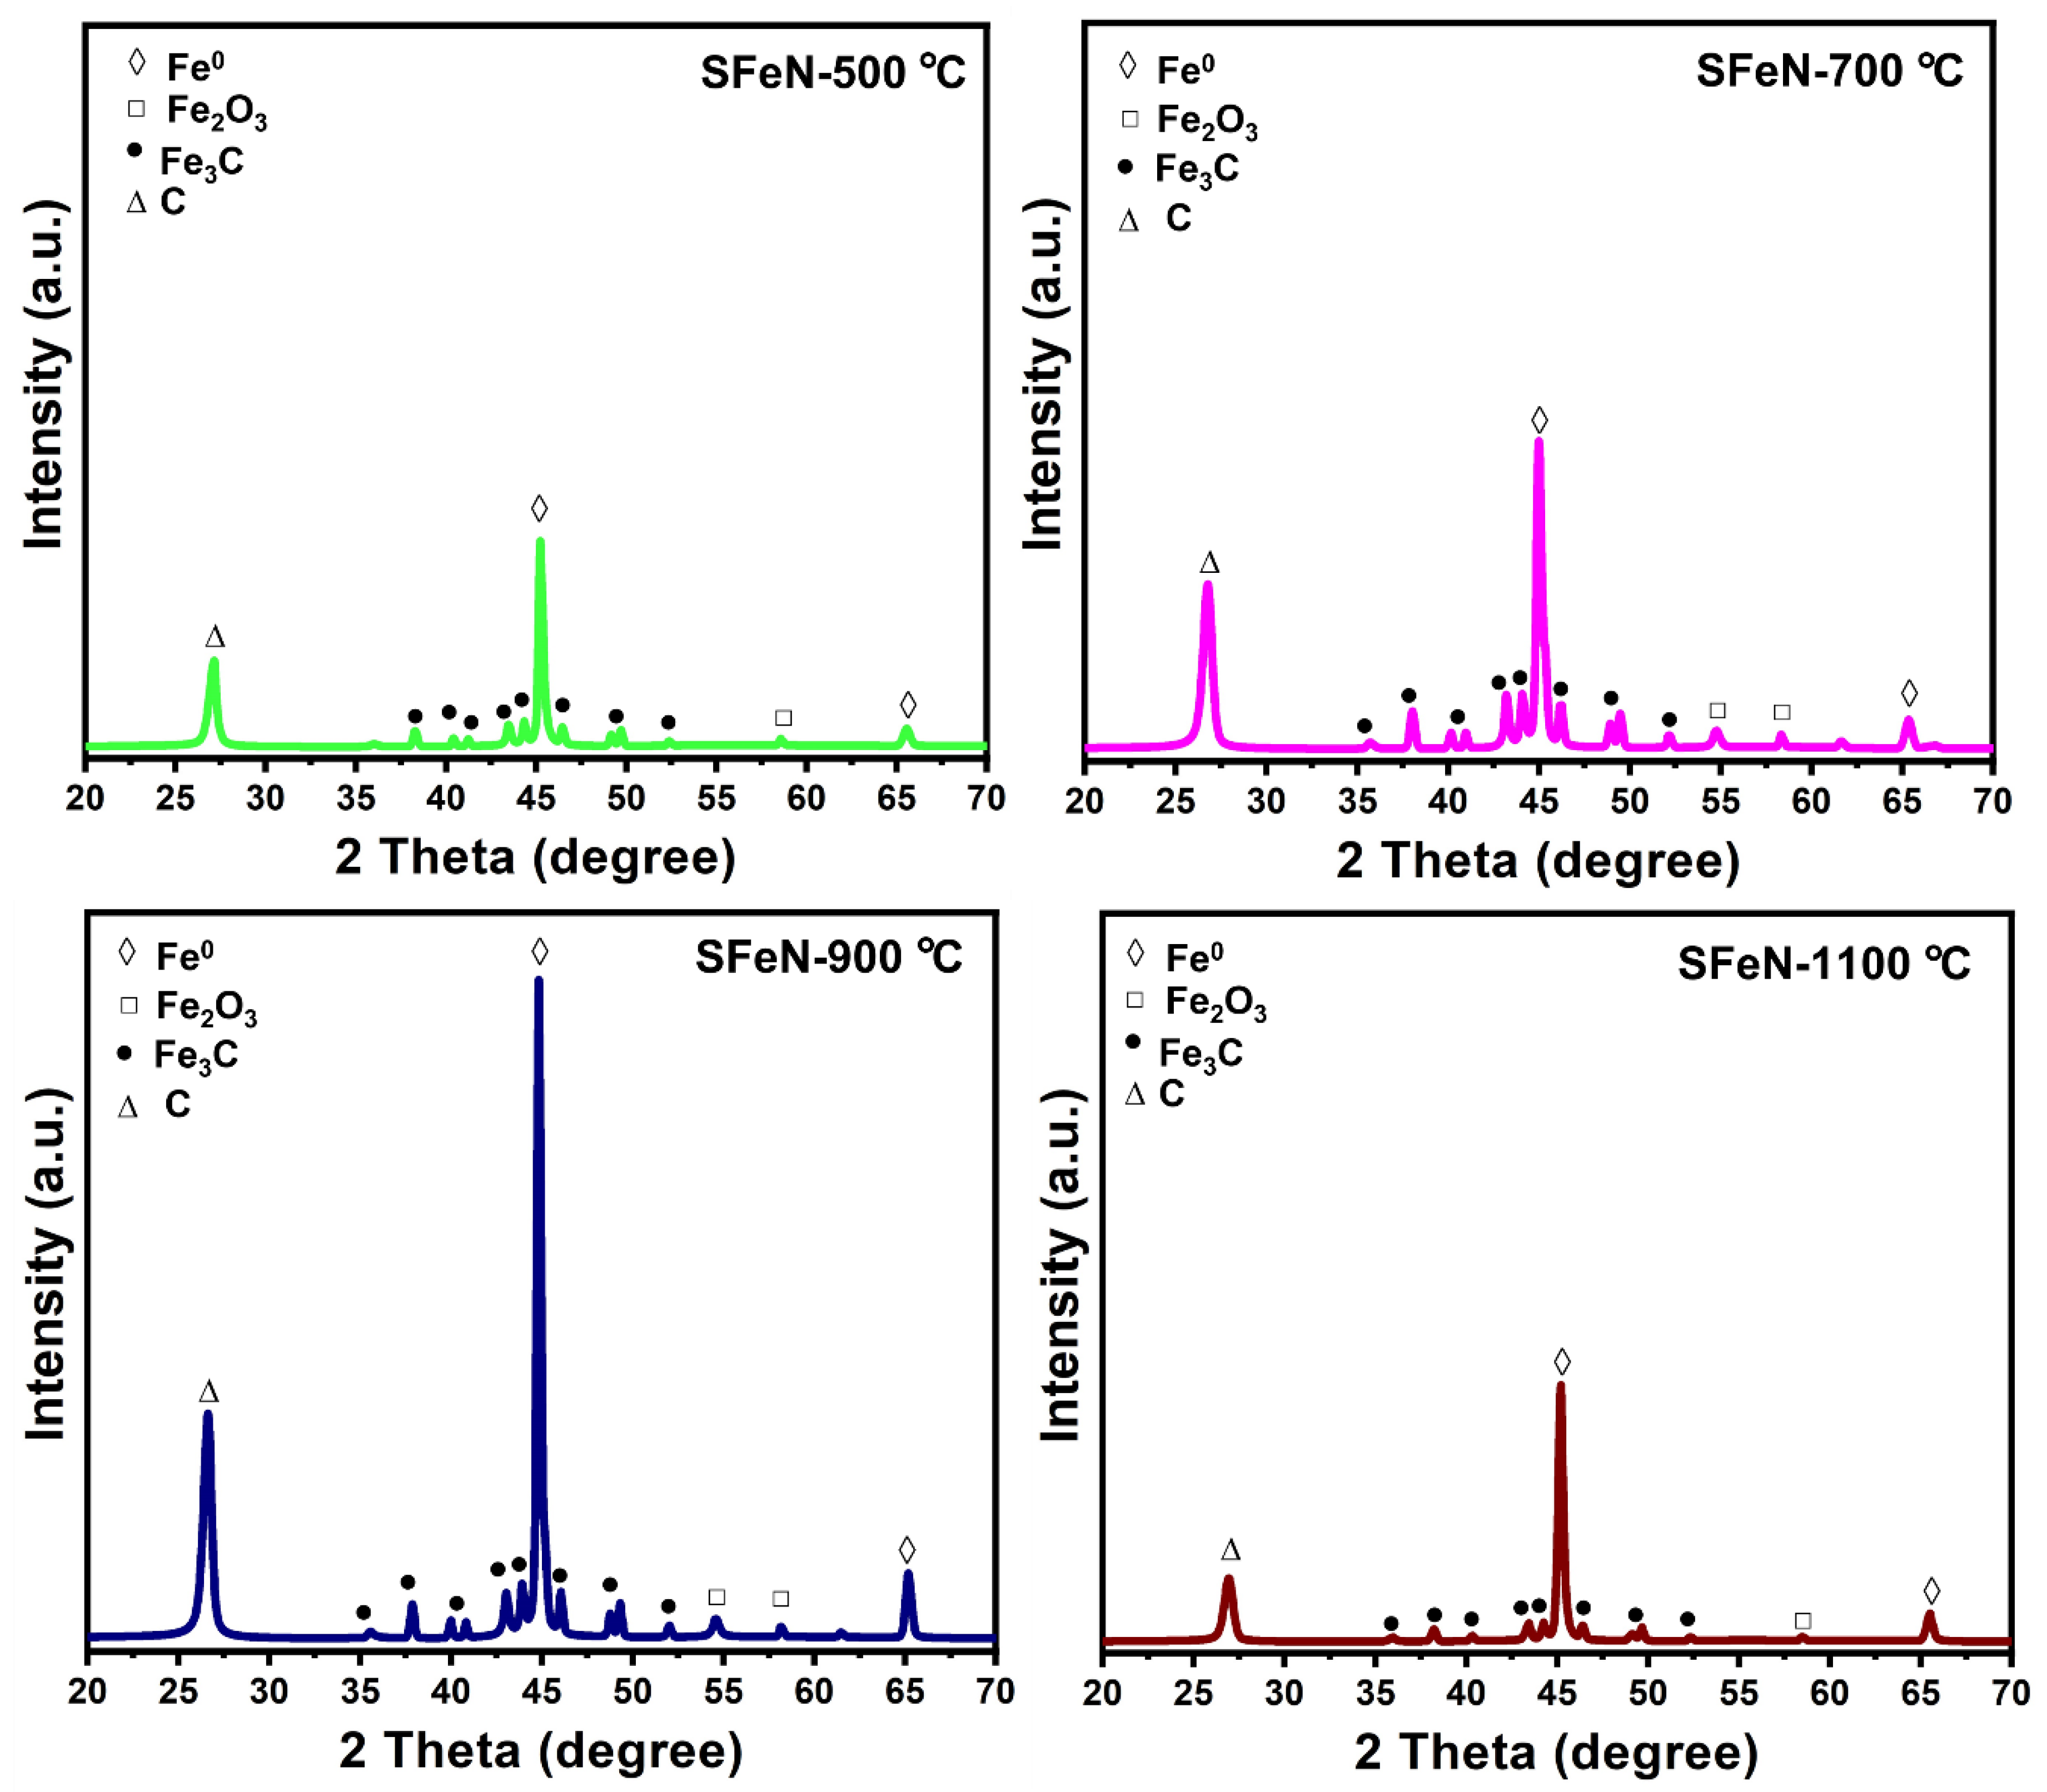
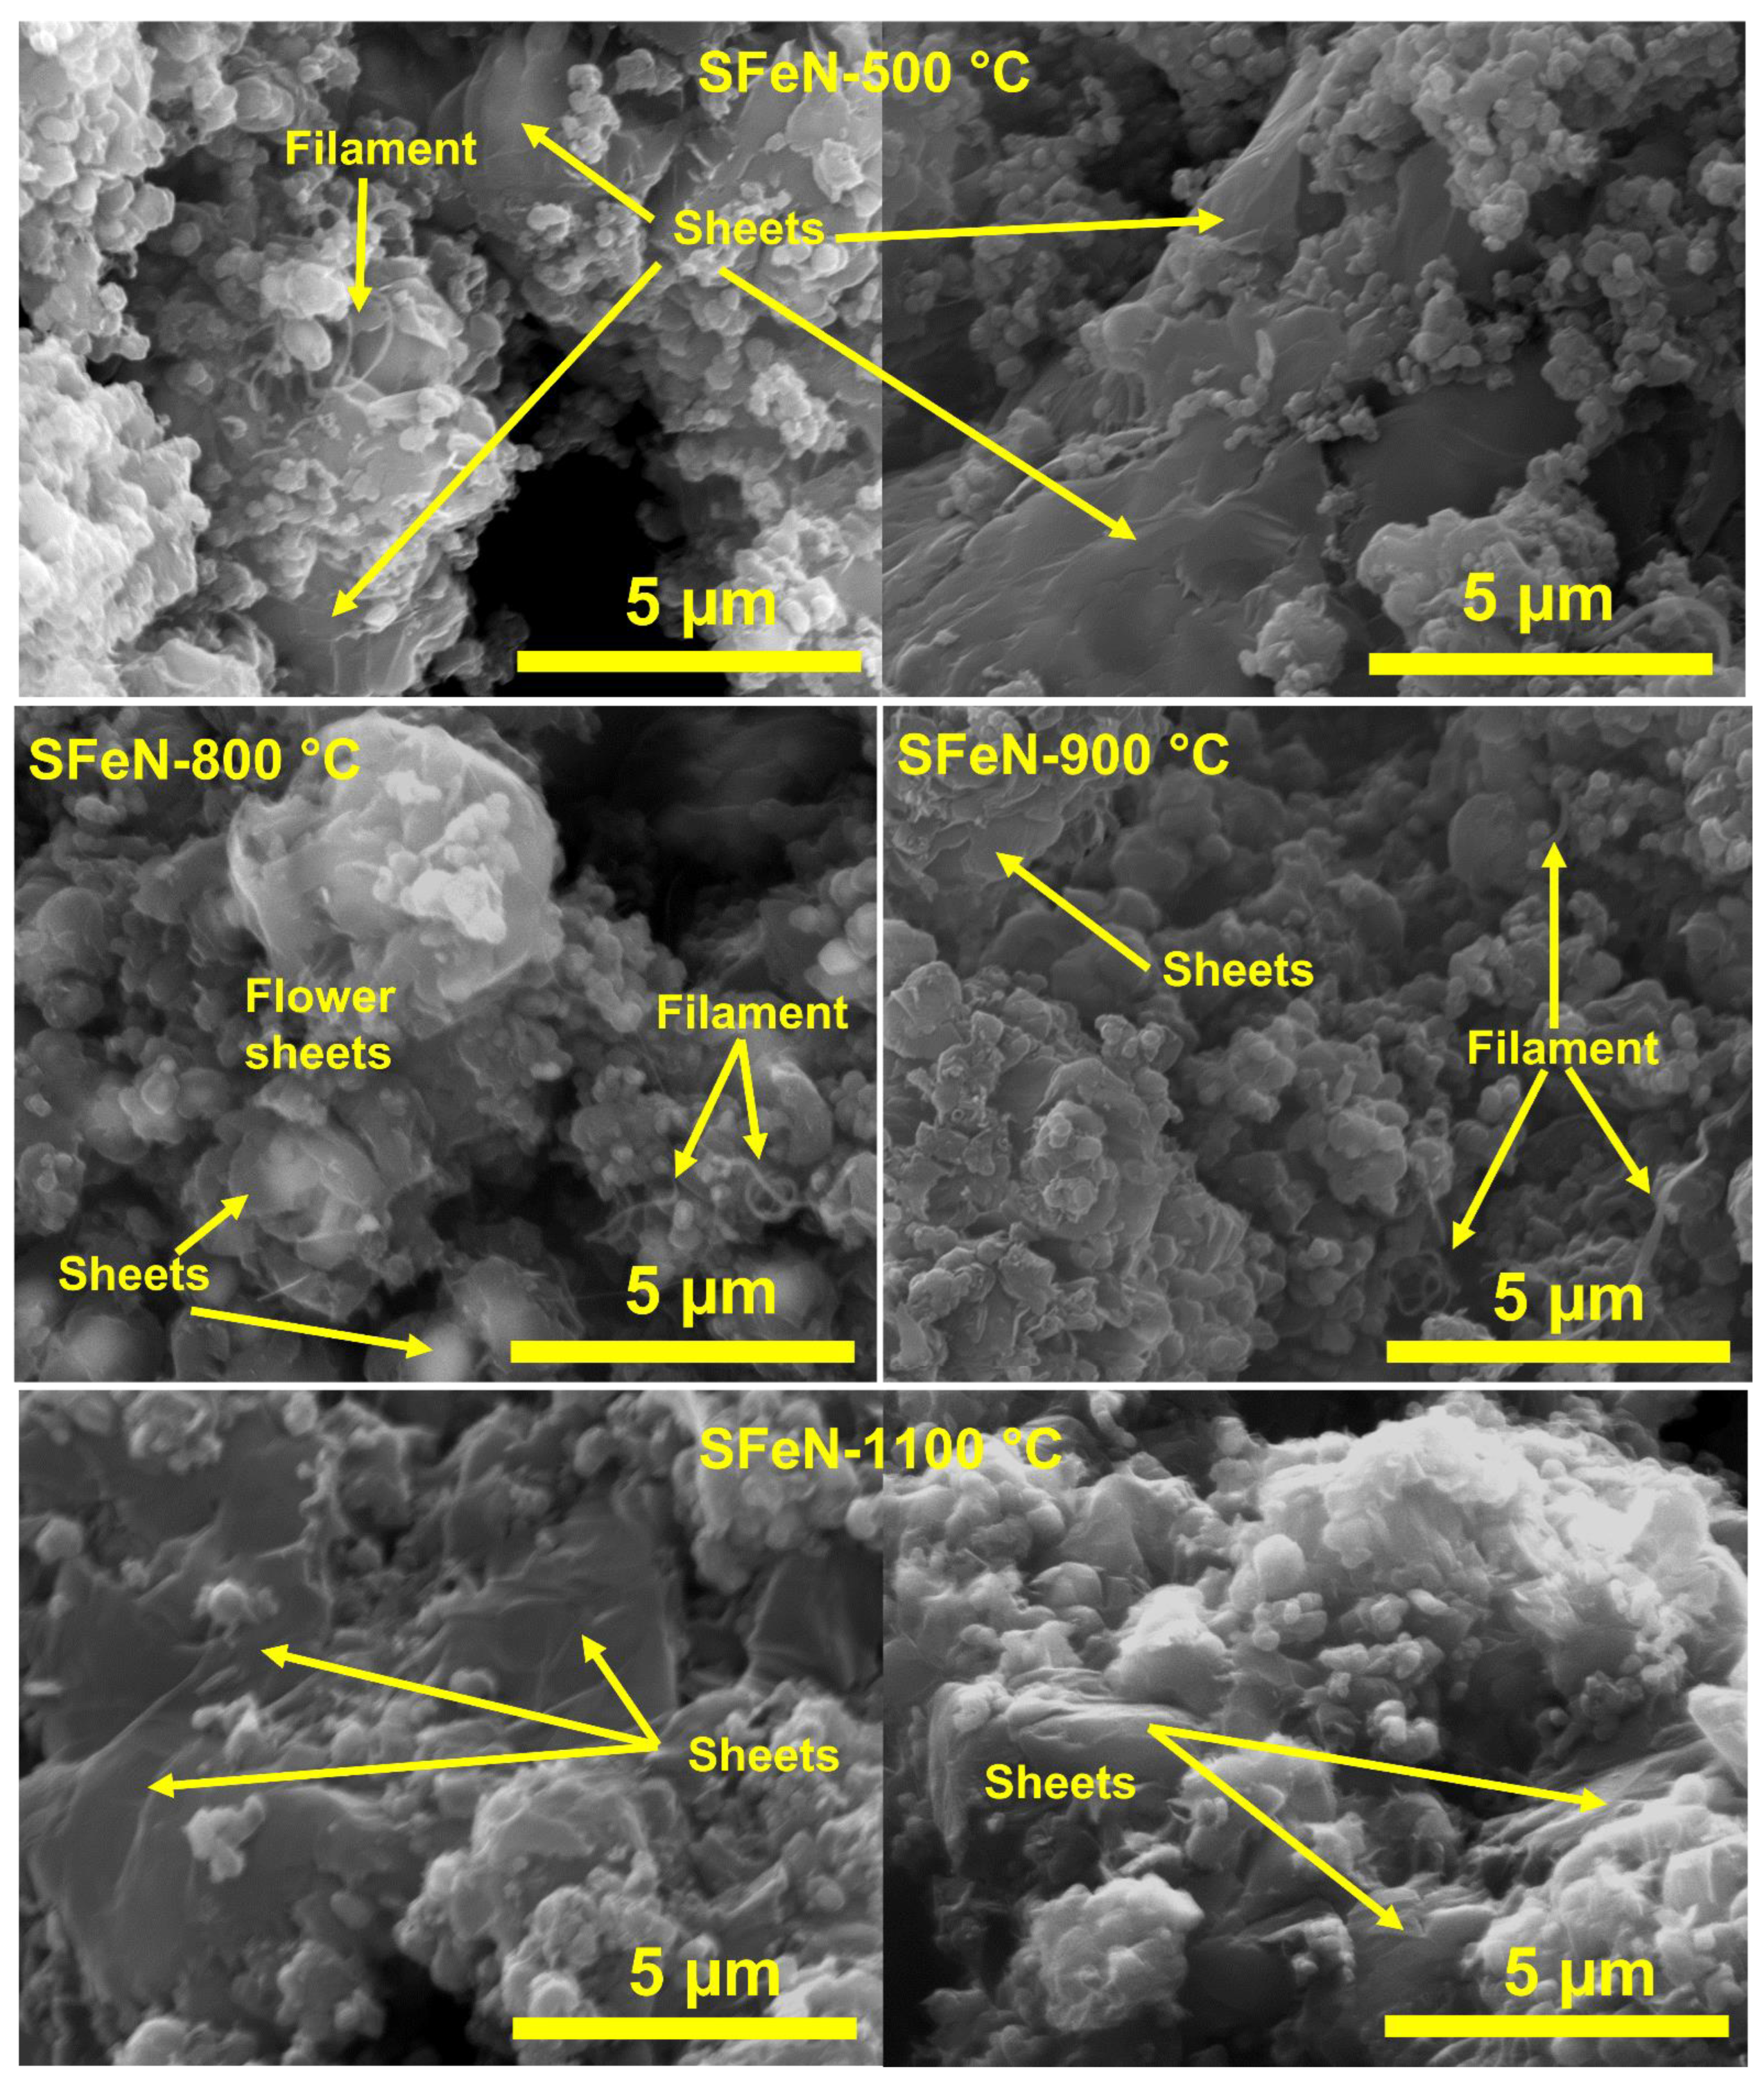
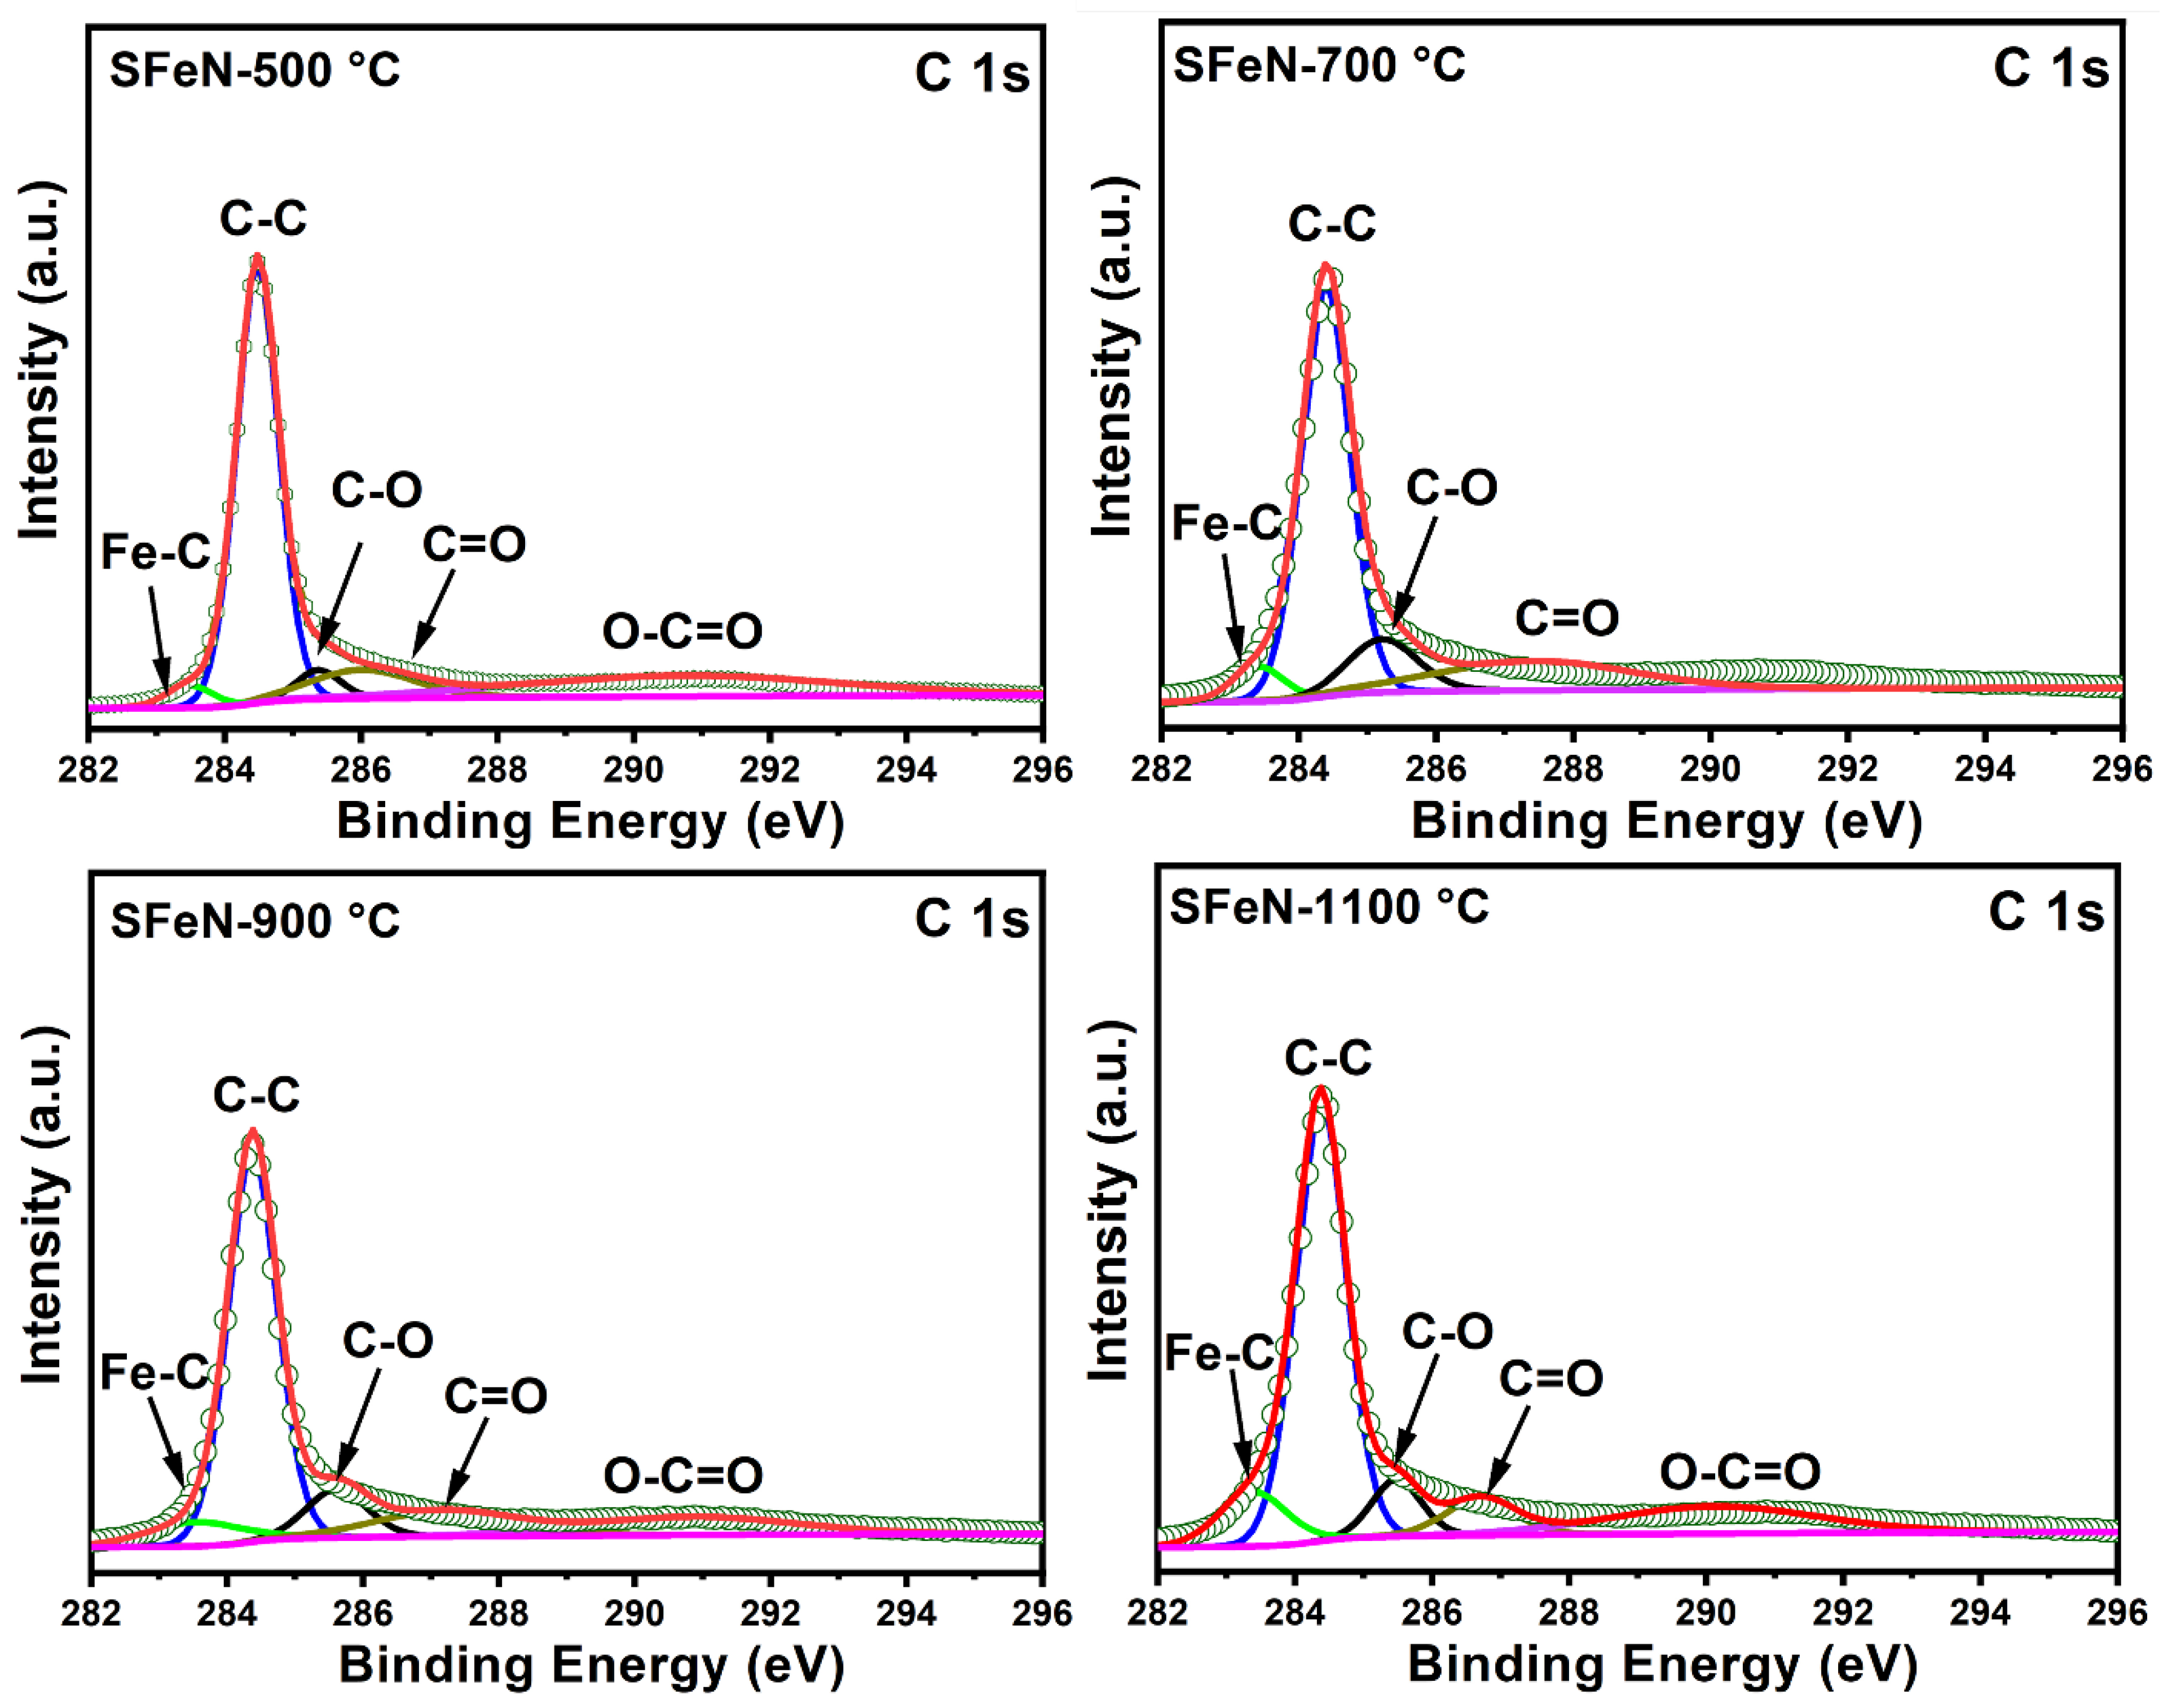
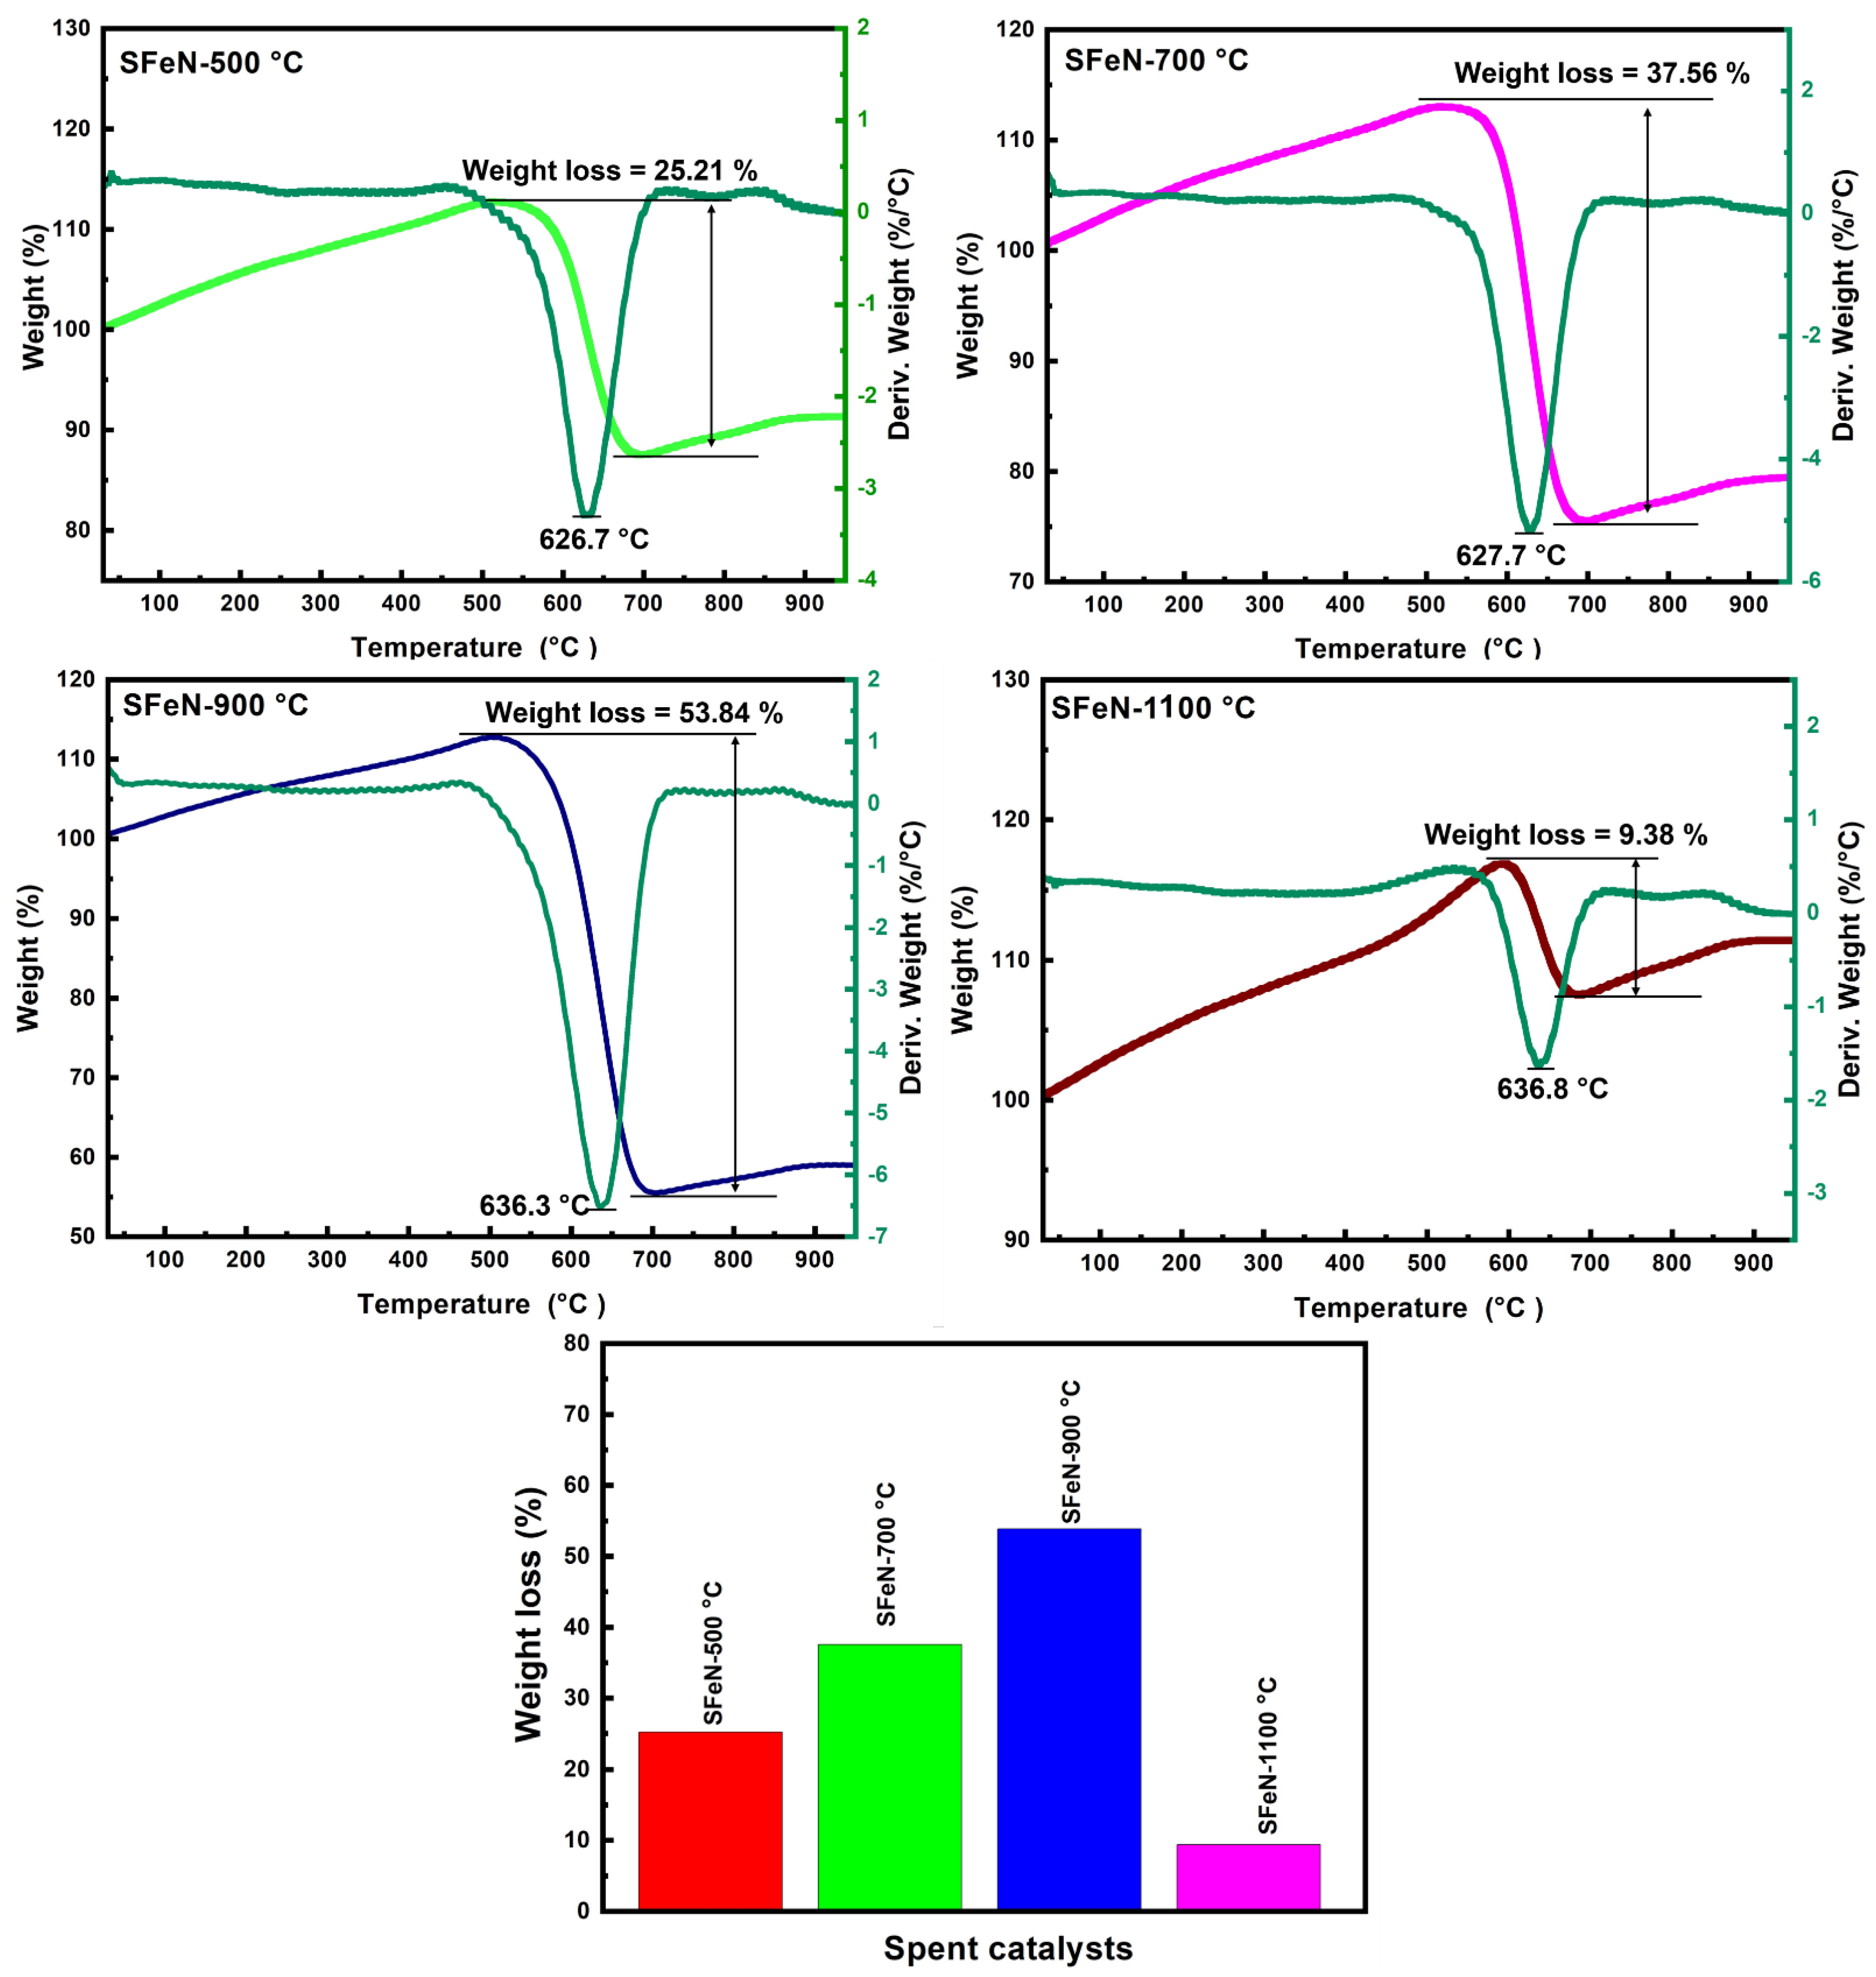
3.3. Characterization of Spent Catalysts after the TCMD

Figure 10 shows the XRD patterns produced by spent catalysts obtained after methane decomposition over OV-rich α-Fe2O3 catalysts at 800 °C, revealing that the previously observed XRD peaks in Figure 3 have disappeared and OV-rich α-Fe2O3 catalysts have almost lost their original structure. It is worth noting that the spent catalysts are denoted as SFeN-500 °C, SFeN-700 °C, SFeN-900 °C, and SFeN-1100 °C. From Figure 10, it can be seen that the phase of OV-rich α-Fe2O3 catalysts has changed to Fe0, Fe3C, Fe2O3, and graphite. Two clear peaks can be seen at 2θ = 26° and 2θ = 45° suggesting the formation of graphite carbon and metallic iron, respectively.
Furthermore, the presence of iron carbide (Fe3C, albeit in small amounts) is confirmed by the peak situated in the 2θ = 38–50° range, and it was suggested that Fe3C species have a catalytic activity for methane decomposition [44,45]. In addition, the appearance of very small peaks of Fe2O3 phases indicates that the catalysts were not completely reduced due to the carbon deposited on iron, explaining the continuous TCMD up to 480 min as observed in Figure 9 [46]. Generally, it can be suggested that the existence of metallic Fe and Fe3C phases in the catalyst component plays a role in the activity of the catalyst [46]. Interestingly, the diffraction peaks in the SFeN-900 °C catalyst showed higher intensity compared to other spent catalysts, suggesting its improved crystallinity degree.
The morphological characteristics of the deposited nanocarbon in spent catalysts were examined by performing SEM analyses, and the images are shown in Figure 11. The SEM images of all the spent catalysts, as a result of TCMD, demonstrated different morphologies of deposited nanocarbon. A negligible amount of carbon nanofilaments in the catalysts was produced, along with multilayered graphene or graphite nanosheets encapsulating the catalyst. It was reported that the scarcity of the appearance of filamentous carbon in the catalysts is attributed to the fact that unsupported metal oxide catalysts are unable to form filamentous carbon during the TCMD. This is due to the catalyst particles undergoing rapid accumulation with each other and forming large particles as a result of harsh reaction conditions [47]. While the appearance of many graphene sheets may be attributed to the high diffusion coefficient of carbon atoms through metallic Fe at 800 °C, which may lower the formation of metal-encapsulated carbon nano-chunks and further expedite the formation of graphene sheets [44], furthermore, it has been observed that irregularly shaped carbon nano-chunks have appeared in abundance in the SFeN-700 °C and SFeN-900 °C samples.
The XPS spectra of the spent catalysts shown in Figure 12 and Figure 13 indicate that all spent catalysts are rich in carbon. Moreover, a weak O 1s peak can be seen in the survey spectrum shown in Figure 12 while the Fe 2p peak is absent, suggesting that the α-Fe2O3 reduction, as well as carbon deposition, highlights the successful TCMD, which confirms XRD and SEM findings.
The high-resolution C 1s XPS spectra of the spent catalysts shown in Figure 13 can be deconvoluted into five peaks located at 283.3 eV, 284.4 eV, 285.2–286.0 eV, 286.8–288.0 eV, and ~291 eV, which can be indexed to carbide carbon (Fe–C), graphitic carbon (C–C, C–H), C–O bonds, C=O bonds, and O–C=O bonds, respectively, demonstrating the existence of the graphitic carbon [35,48]. Because Fe has a much higher atomic sensitivity factor compared to C and O, the absence of Fe peaks indicates that α-Fe2O3 was uniformly coated by thin carbon sheets. Furthermore, the presence of Fe-C agrees with the XRD results of spent catalysts and implies the formation of Fe3C, which has catalytic activity for methane decomposition.
Figure 14 illustrates the plot of the TGA-DTG curves for the spent catalysts after TCMD. It depicts the weight loss of the spent catalysts when exposed to high temperatures in the presence of air.
Irrespective of the spent catalyst type, there is an initial increase in weight up to 500 °C, which may be related to the oxidation of the metallic iron. As temperatures increase beyond 500 to 700 °C, the weight loss in spent catalysts is remarkably different due to the oxidation of carbon nanomaterials.
It is observed from the TGA curves that the weight loss takes place in the range of 500–700 °C due to the combustion of graphitic carbon [43], which increases from SFeN-500 to SFeN-900 °C spent catalysts, as indicated in Figure 14. The difference in weight loss among the spent catalysts reflects the catalytic activity of the fresh catalysts; low catalytic activity shows less weight loss, and vice versa. These results agree with the methane conversion and hydrogen formation rate results, which indicated that the OV-rich α-Fe2O3 NPs prepared at 900 °C have the highest methane conversion (22.5%) and hydrogen formation rate (47.0 × 10⁻⁵ mol H2 g−1 min−1) after 480 min. Thus, the OV-rich α-Fe2O3 NPs prepared at 900 °C are the most active sample for methane decomposition, and this is due to their possession of abundant oxygen vacancies, which serve as effective active sites for adsorption methane.

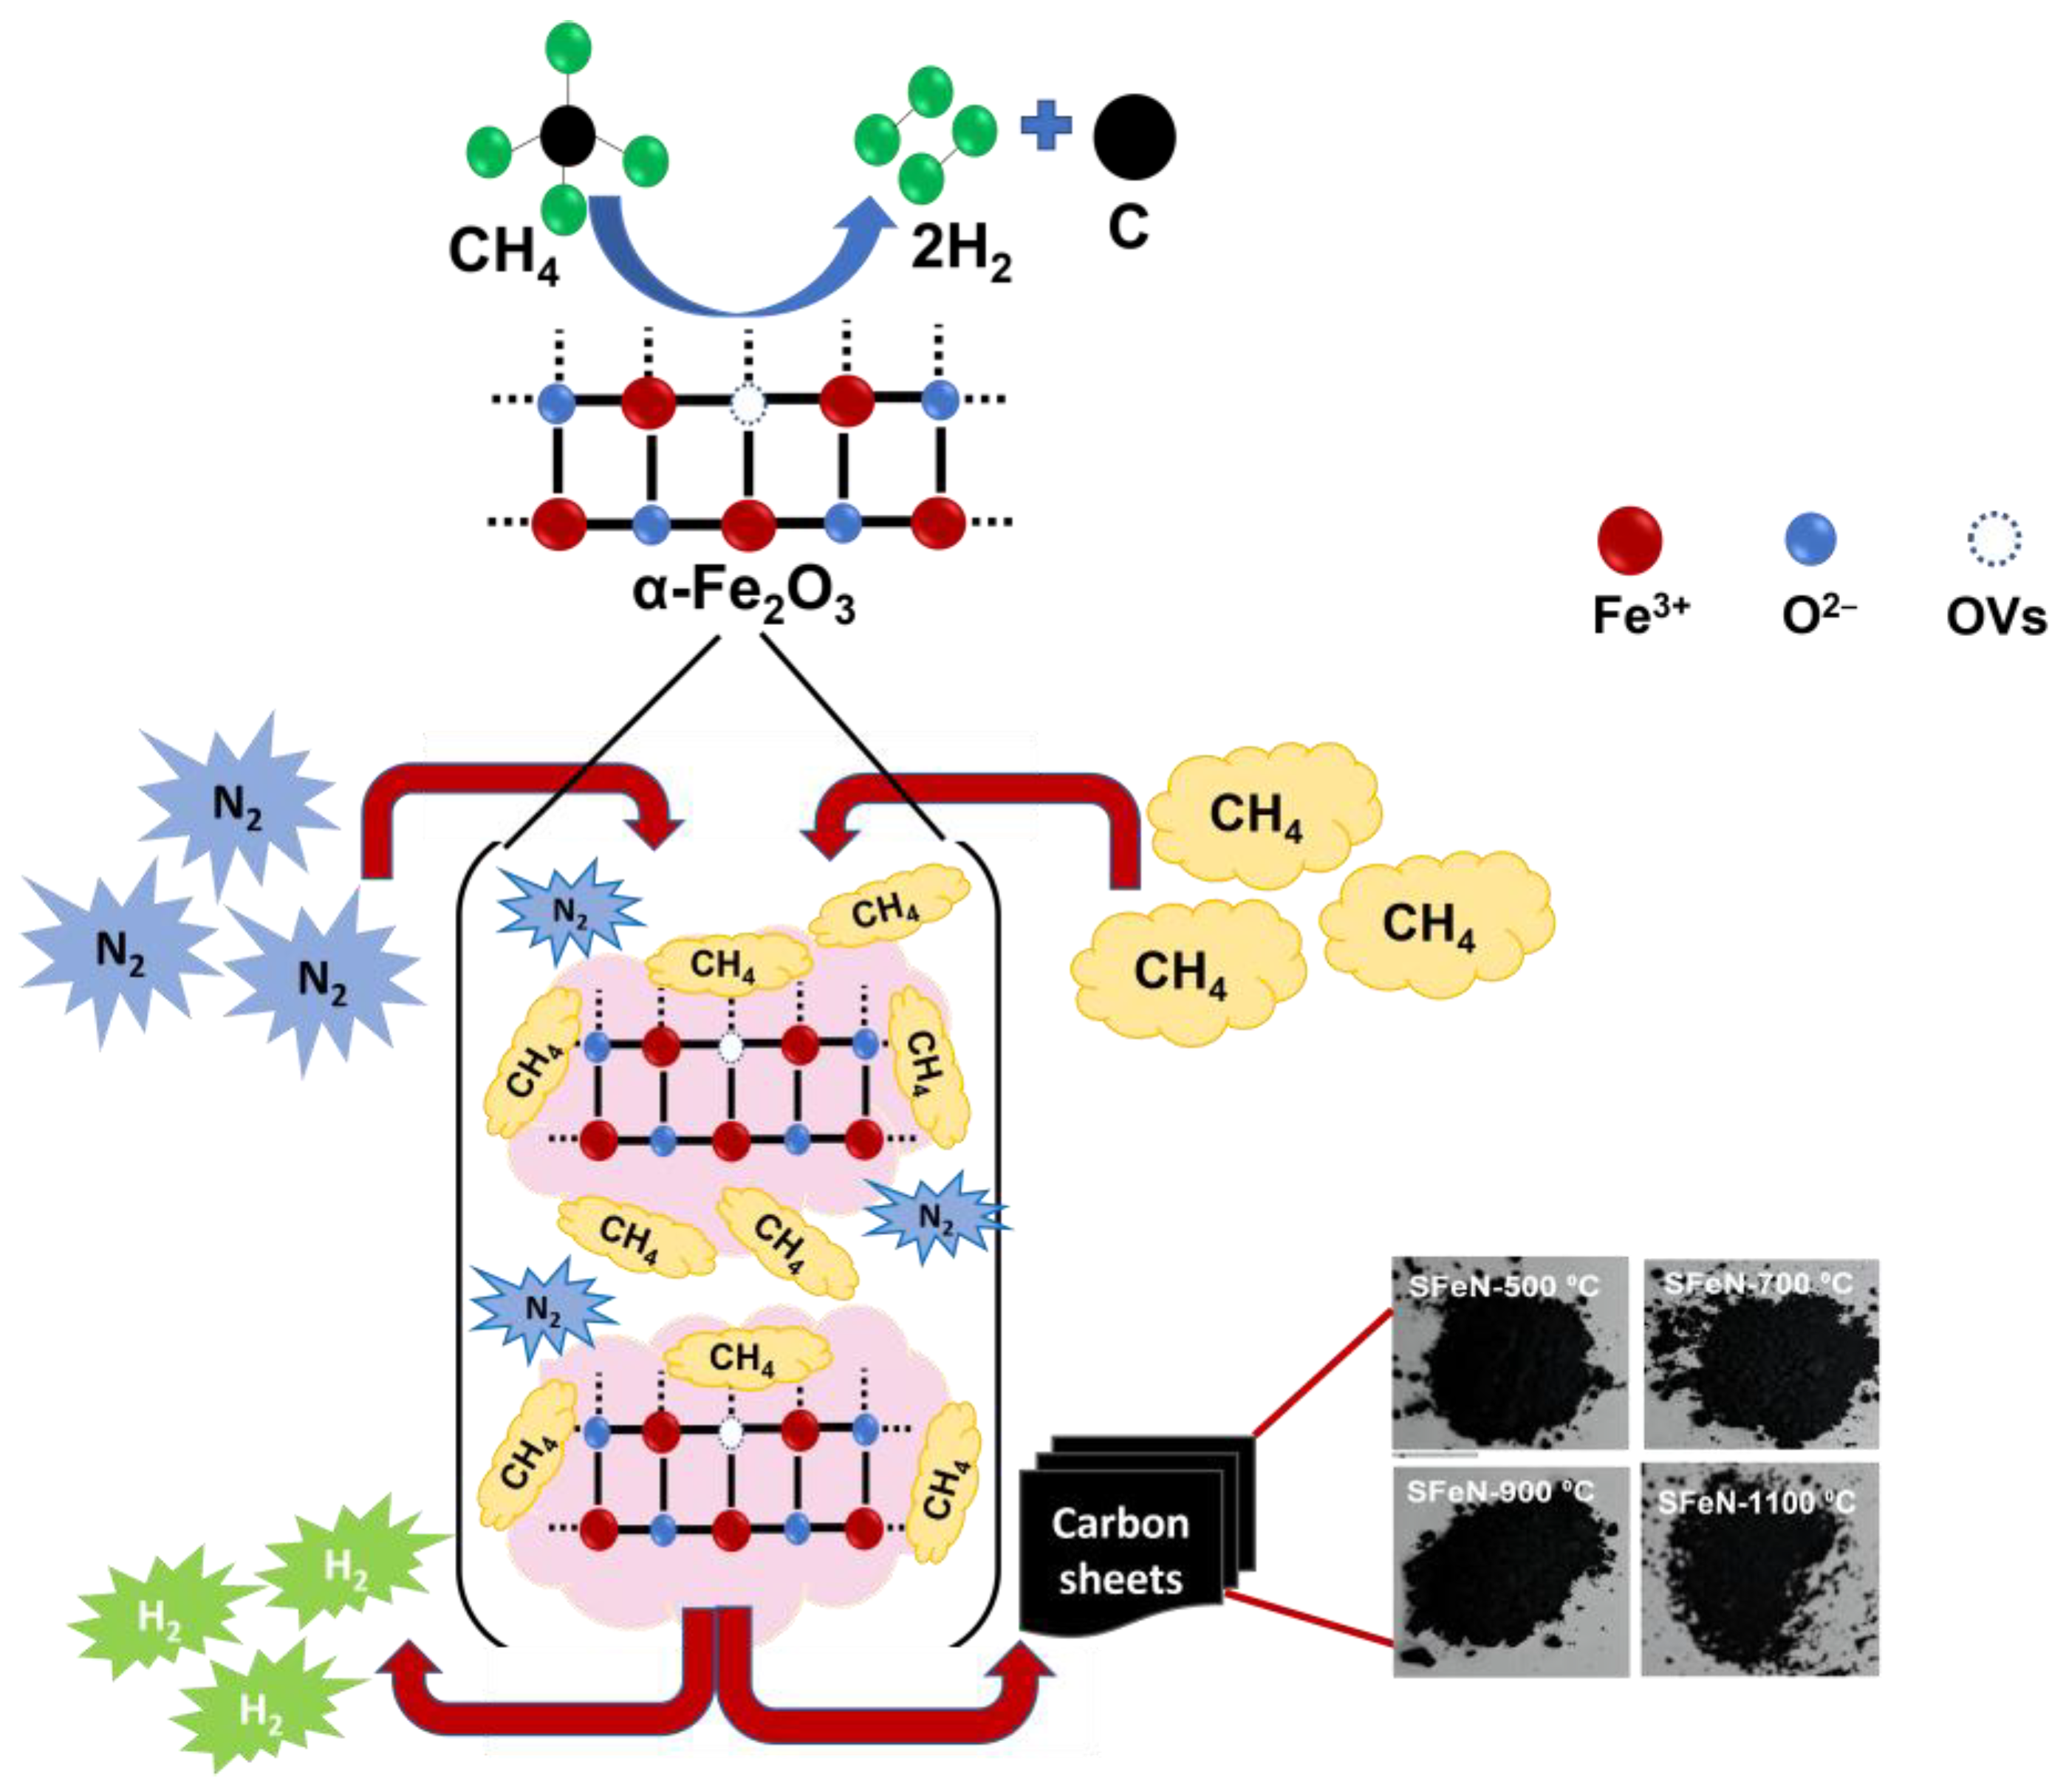
3.4. Proposed Reaction Mechanism

Available evidence from previous studies indicates that the surface features of catalysts are the main drivers of catalytic methane decomposition. The XPS analysis performed as a part of this work revealed that the obtained OV-rich α-Fe2O3 NPs at calcination temperatures such as 900 °C possess abundant oxygen vacancies, which would, in turn, increase the number of stable and active sites for the adsorption of methane. It has also been established that the introduction of OVs into the bulk α-Fe2O3 material can weaken the Fe–O bond strength and improve the lattice oxygen mobility, thus catalyzing the reduction of iron oxide to form the active phase for methane decomposition. Therefore, it is reasonable to assume that methane adsorbs on the surface-active sites of the catalyst and reacts with the reducible species, e.g., free Fe2O3 clusters (adjacent Fe3+), surface oxygen species, and defects such as OVs, at the 800 °C reaction temperature. As a result, the C–H bonds on the catalyst surface would be gradually decomposed to generate H2 and nanocarbon materials. Thus, FeN-900 °C, which contains abundant oxygen vacancies, could play an important role in the enhancement of catalytic activity in the thermocatalytic decomposition of methane into hydrogen and nanocarbon materials. A schematic diagram depicting the proposed reaction mechanism of the OV-rich α-Fe2O3 NPs that are used for the thermocatalytic decomposition of methane is illustrated in Figure 15.
Furthermore, based on the results reported in extant studies [9,18,19], the reduction of α-Fe2O3 catalyst by CH4 occurs in three steps, namely Fe2O3 → Fe3O4 → FeO → Fe0. Once Fe0 is formed, it decomposes CH4, which results in the formation of Fe3C, a crucial step in the TCMD process for the formation of nanocarbon materials. The XRD, SEM, and XPS findings obtained in the current investigation indicate that the reduction of the OV-rich α-Fe2O3 catalysts follows the global mechanism (Fe2O3 → Fe0), whereby Fe3C is formed as a result of the reaction of Fe0 with the produced carbon from CH4 decomposition. Therefore, it is clear that Fe0 is an active phase for initializing the TCMD reaction at high temperatures (e.g., 800 °C), which suggests that the OV-rich α-Fe2O3 catalysts possess an effective catalytic nature for TCMD for hydrogen and nanocarbon production.

4. Conclusions

In this study, a scalable and cost-effective one-step approach was developed for obtaining efficient unsupported OV-rich α-Fe2O3 NPs with abundant oxygen vacancies on the surface via the thermal decomposition of ferric nitrate at different temperatures (500, 700, 900, and 1100 °C). The obtained OV-rich α-Fe2O3 NPs at different calcination temperatures were employed as catalysts for the thermocatalytic decomposition of methane to produce H2 and nanocarbon. Further investigations confirmed that the introduction of OVs on the as-prepared OV-rich α-Fe2O3 NPs affected the characteristics and thermocatalytic performance of these catalysts. Based on the XPS analysis, the OVs on the OV-rich α-Fe2O3 surface were responsible for the increase in the number of active sites, thus aiding methane absorption. The morphological characterization results revealed that the most commonly obtained spent catalysts were nanosheets, which were the predominant carbon form deposited on the spent catalysts. According to the XRD results, the TCMD reduction follows the Fe2O3 → Fe0 global mechanism. By evaluating the thermocatalytic activity of the obtained OV-rich α-Fe2O3 NPs in terms of TCMD for hydrogen production and nanocarbon formation, it was determined that 900 °C calcination temperature is optimal for producing highly efficient OV-rich α-Fe2O3 NPs, which showed the highest methane conversion (22.5%) and hydrogen production rate (47.0 × 10⁻⁵ mol H2 g−1 min−1) after 480 min. Such outstanding thermocatalytic performance of OV-rich α-Fe2O3 NPs is attributed to the presence of abundant OVs on their surfaces, which serve as effective methane adsorption sites.

Author Contributions

Conceptualization, A.I.A. and T.F.Q.; methodology, A.I.A., T.F.Q. and M.A.A.; software, A.M.A.; validation, T.F.Q., S.A. and A.M.A.; formal analysis, S.A.; investigation, Shaddad, M.N.S.; resources, A.I.A.; data curation, A.I.A. and T.F.Q.; writing—original draft preparation, A.I.A., T.F.Q. and A.M.A.; writing—review and editing, M.A.A.; visualization, T.F.Q., Shaddad, M.N.S. and S.A.; supervision, M.A.A.; project administration, A.I.A. and T.F.Q.; funding acquisition, A.I.A. and M.A.A. All authors have read and agreed to the published version of the manuscript.

Funding

The authors extend their appreciation to the Deputyship for Research& Innovation, Ministry of Education in Saudi Arabia for funding this research work through the project number (2022/01/22126).

Data Availability Statement

The data presented in this study are available on request from the corresponding author.

Conflicts of Interest

The authors declare no conflict of interest.

References

  1. Alharthi, A.I. Pd Supported on ZSM-5 with different ratios of Si/Al as catalysts for direct catalytic decomposition of methane. J. Taibah Univ. Sci. 2021, 15, 567–573. [Google Scholar] [CrossRef]
  2. Pudukudy, M.; Yaakob, Z.; Takriff, M.S. Methane decomposition into COx free hydrogen and multiwalled carbon nanotubes over ceria, zirconia and lanthana supported nickel catalysts prepared via a facile solid state citrate fusion method. Energy Convers. Manag. 2016, 126, 302–315. [Google Scholar] [CrossRef]
  3. Wang, G.; Jin, Y.; Liu, G.; Li, Y. Production of Hydrogen and Nanocarbon from Catalytic Decomposition of Methane over a Ni–Fe/Al2O3 Catalyst. Energy Fuels 2013, 27, 4448–4456. [Google Scholar] [CrossRef]
  4. Alharthi, A.I.; Abdel, E.; Hargreaves, J.S.J.; Alotaibi, M.A.; Din, I.U.; Al-Shalwi, M.N. Influence of Zn and Ni dopants on the physicochemical and activity patterns of CoFe2O4 derived catalysts for hydrogen production by catalytic cracking of methane. J. Alloys Compd. 2023, 938, 168437. [Google Scholar] [CrossRef]
  5. Alharthi, A.I.; Abdel-Fattah, E.; Alotaibi, M.A.; Al-Shalwi, M.N. Facile modification of cobalt ferrite by SiO2 and H-ZSM-5 support for hydrogen and filamentous carbon production from methane decomposition. Int. J. Energy Res. 2022, 46, 17497–17510. [Google Scholar] [CrossRef]
  6. Tsyganok, A.I.; Tsunoda, T.; Hamakawa, S.; Suzuki, K.; Takehira, K.; Hayakawa, T. Dry reforming of methane over catalysts derived from nickel-containing Mg–Al layered double hydroxides. J. Catal. 2003, 213, 191–203. [Google Scholar] [CrossRef]
  7. Izquierdo, U.; Barrio, V.L.; Cambra, J.F.; Requies, J.; Güemez, M.B.; Arias, P.L.; Kolb, G.; Zapf, R.; Gutiérrez, A.M.; Arraibi, J.R. Hydrogen production from methane and natural gas steam reforming in conventional and microreactor reaction systems. Int. J. Hydrog. Energy 2012, 37, 7026–7033. [Google Scholar] [CrossRef]
  8. Abbas, H.F.; Daud, W.M.A.W. Hydrogen production by methane decomposition: A review. Int. J. Hydrog. Energy 2010, 35, 1160–1190. [Google Scholar] [CrossRef]
  9. Li, Y.; Li, D.; Wang, G. Methane decomposition to COx-free hydrogen and nano-carbon material on group 8–10 base metal catalysts: A review. Catal. Today 2011, 162, 1–48. [Google Scholar] [CrossRef]
  10. Pudukudy, M.; Yaakob, Z.; Takriff, M.S. Methane decomposition over Pd promoted Ni/MgAl2O4 catalysts for the production of COx free hydrogen and multiwalled carbon nanotubes. Appl. Surf. Sci. 2015, 356, 1320–1326. [Google Scholar] [CrossRef]
  11. Awadallah, A.E.; Aboul-Enein, A.A.; Aboul-Gheit, A.K. Effect of progressive Co loading on commercial Co–Mo/Al2O3 catalyst for natural gas decomposition to COx-free hydrogen production and carbon nanotubes. Energy Convers. Manag. 2014, 77, 143–151. [Google Scholar] [CrossRef]
  12. Alharthi, A.I. Nickel-iron catalyst for decomposition of methane to hydrogen and filamentous carbon: Effect of calcination and reaction temperatures. Alex. Eng. J. 2023, 67, 129–141. [Google Scholar] [CrossRef]
  13. Moghaddam, E.A.; Ahlgren, S.; Nordberg, Å. Assessment of Novel Routes of Biomethane Utilization in a Life Cycle Perspective. Front. Bioeng. Biotechnol. 2016, 4, 89. [Google Scholar] [CrossRef]
  14. Koornneef, J.; van Breevoort, P.; Noothout, P.; Hendriks, C.; Luning, u.; Camps, A. Global Potential for Biomethane Production with Carbon Capture, Transport and Storage up to 2050. Energy Procedia 2013, 37, 6043–6052. [Google Scholar] [CrossRef]
  15. Zhou, L.; Enakonda, L.R.; Harb, M.; Saih, Y.; Aguilar-Tapia, A.; Ould-Chikh, S.; Hazemann, J.; Li, J.; Wei, N.; Gary, D.; et al. Fe catalysts for methane decomposition to produce hydrogen and carbon nano materials. Appl. Catal. B: Environ. 2017, 208, 44–59. [Google Scholar] [CrossRef]
  16. Enakonda, L.R.; Zhou, L.; Saih, Y.; Ould-Chikh, S.; Lopatin, S.; Gary, D.; Del-Gallo, P.; Basset, J.-M. Methane-induced Activation Mechanism of Fused Ferric Oxide–Alumina Catalysts during Methane Decomposition. ChemSusChem 2016, 9, 1911–1915. [Google Scholar] [CrossRef]
  17. Torres, D.; de Llobet, S.; Pinilla, J.L.; Lázaro, M.J.; Suelves, I.; Moliner, R. Hydrogen production by catalytic decomposition of methane using a Fe-based catalyst in a fluidized bed reactor. J. Nat. Gas Chem. 2012, 21, 367–373. [Google Scholar] [CrossRef]
  18. Adánez, J.; de Diego, L.F.; García-Labiano, F.; Gayán, P.; Abad, A.; Palacios, J.M. Selection of Oxygen Carriers for Chemical-Looping Combustion. Energy Fuels 2004, 18, 371–377. [Google Scholar] [CrossRef]
  19. Mattisson, T.; Lyngfelt, A.; Cho, P. The use of iron oxide as an oxygen carrier in chemical-looping combustion of methane with inherent separation of CO2. Fuel 2001, 80, 1953–1962. [Google Scholar] [CrossRef]
  20. Liu, Q.; Cui, Z.-M.; Ma, Z.; Bian, S.-W.; Song, W.-G.; Wan, L.-J. Morphology control of Fe2O3 nanocrystals and their application in catalysis. Nanotechnology 2007, 18, 385605. [Google Scholar] [CrossRef]
  21. Zhang, R.; Liu, D.; Yang, P. Morphology control of α-Fe2O3 towards super electrochemistry performance. RSC Adv. 2019, 9, 21947–21955. [Google Scholar] [CrossRef]
  22. Gao, Y.; Zhang, N.; Wang, C.; Zhao, F.; Yu, Y. Construction of Fe2O3@CuO Heterojunction Nanotubes for Enhanced Oxygen Evolution Reaction. ACS Appl. Energy Mater. 2020, 3, 666–674. [Google Scholar] [CrossRef]
  23. Lei, R.; Wei, J.; He, W.; Ao, X.; Song, J.; Wang, C.; Zhang, Q.; Xie, H.; Li, J.; Ni, J. Construction of an α-Fe2O3/Bi2O3 p–n heterojunction with exceptional visible-light photocatalytic performance for dye removal. New J. Chem. 2023. advance article. [Google Scholar] [CrossRef]
  24. Palimi, M.J.; Rostami, M.; Mahdavian, M.; Ramezanzadeh, B. Surface modification of Fe2O3 nanoparticles with 3-aminopropyltrimethoxysilane (APTMS): An attempt to investigate surface treatment on surface chemistry and mechanical properties of polyurethane/Fe2O3 nanocomposites. Appl. Surf. Sci. 2014, 320, 60–72. [Google Scholar] [CrossRef]
  25. Liu, F.; Shan, W.; Lian, Z.; Liu, J.; He, H. The smart surface modification of Fe2O3 by WOx for significantly promoting the selective catalytic reduction of NOx with NH3. Appl. Catal. B: Environ. 2018, 230, 165–176. [Google Scholar] [CrossRef]
  26. Xiong, T.; Zhang, Y.; Lee, W.S.V.; Xue, J. Defect Engineering in Manganese-Based Oxides for Aqueous Rechargeable Zinc-Ion Batteries: A Review. Adv. Energy Mater. 2020, 10, 2001769. [Google Scholar] [CrossRef]
  27. Qin, Q.; Liu, T.; Zhang, J.; Wei, R.; You, S.; Xu, Y. Facile synthesis of oxygen vacancies enriched α-Fe2O3 for peroxymonosulfate activation: A non-radical process for sulfamethoxazole degradation. J. Hazard. Mater. 2021, 419, 126447. [Google Scholar] [CrossRef] [PubMed]
  28. Cheng, Z.; Qin, L.; Guo, M.; Fan, J.A.; Xu, D.; Fan, L.-S. Methane adsorption and dissociation on iron oxide oxygen carriers: The role of oxygen vacancies. Phys. Chem. Chem. Phys. 2016, 18, 16423–16435. [Google Scholar] [CrossRef] [PubMed]
  29. Liang, X.; Wang, L.; Wen, T.; Liu, H.; Zhang, J.; Liu, Z.; Zhu, C.; Long, C. Mesoporous poorly crystalline α-Fe2O3 with abundant oxygen vacancies and acid sites for ozone decomposition. Sci. Total Environ. 2022, 804, 150161. [Google Scholar] [CrossRef] [PubMed]
  30. Shaheen, W.M. Thermal behaviour of pure and binary Fe(NO3)3·9H2O and (NH4)6Mo7O24·4H2O systems. Mater. Sci. Eng. A 2007, 445–446, 113–121. [Google Scholar] [CrossRef]
  31. Geng, S.; Han, Z.; Hu, Y.; Cui, Y.; Yue, J.; Yu, J.; Xu, G. Methane Decomposition Kinetics over Fe2O3 Catalyst in Micro Fluidized Bed Reaction Analyzer. Ind. Eng. Chem. Res. 2018, 57, 8413–8423. [Google Scholar] [CrossRef]
  32. Sangeetha, A.; Seeli, S.J.; Bhuvana, K.P.; Kader, M.A.; Nayak, S.K. Correlation between calcination temperature and optical parameter of zinc oxide (ZnO) nanoparticles. J. Sol. Gel. Sci. Technol. 2019, 91, 261–272. [Google Scholar] [CrossRef]
  33. Park, C.; Jung, J.; Lee, C.W.; Cho, J. Synthesis of Mesoporous α-Fe2O3 Nanoparticles by Non-ionic Soft Template and Their Applications to Heavy Oil Upgrading. Sci. Rep. 2016, 6, 39136. [Google Scholar] [CrossRef]
  34. Hassan, S.M.; Ahmed, A.I.; Mannaa, M.A. Preparation and characterization of SnO2 doped TiO2 nanoparticles: Effect of phase changes on the photocatalytic and catalytic activity. J. Sci. Adv. Mater. Devices 2019, 4, 400–412. [Google Scholar] [CrossRef]
  35. Alharthi, A.; Blackley, R.A.; Flowers, T.H.; Hargreaves, J.S.J.; Pulford, I.D.; Wigzell, J.; Zhou, W. Iron ochre—A pre-catalyst for the cracking of methane. J. Chem. Technol. Biotechnol. 2014, 89, 1317–1323. [Google Scholar] [CrossRef] [PubMed]
  36. Motozuka, S.; Tagaya, M.; Ikoma, T.; Morinaga, M.; Yoshioka, T.; Tanaka, J. Efficient Methane Conversion to Hydrogen by the Force-Activated Oxides on Iron Particle Surfaces. J. Phys. Chem. C 2013, 117, 16104–16118. [Google Scholar] [CrossRef]
  37. Li, L.; Ma, P.; Hussain, S.; Jia, L.; Lin, D.; Yin, X.; Lin, Y.; Cheng, Z.; Wang, L. FeS2/carbon hybrids on carbon cloth: A highly efficient and stable counter electrode for dye-sensitized solar cells. Sustain. Energy Fuels 2019, 3, 1749–1756. [Google Scholar] [CrossRef]
  38. Liu, D.; Wu, C.; Yan, M.; Wang, J. Correlating the microstructure, growth mechanism and magnetic properties of FeSiAl soft magnetic composites fabricated via HNO3 oxidation. Acta Mater. 2018, 146, 294–303. [Google Scholar] [CrossRef]
  39. Sushil, S.; Alabdulrahman, A.M.; Balakrishnan, M.; Batra, V.S.; Blackley, R.A.; Clapp, J.; Hargreaves, J.S.J.; Monaghan, A.; Pulford, I.D.; Rico, J.L.; et al. Carbon deposition and phase transformations in red mud on exposure to methane. J. Hazard. Mater. 2010, 180, 409–418. [Google Scholar] [CrossRef]
  40. Pudukudy, M.; Yaakob, Z.; Jia, Q.; Takriff, M.S. Catalytic decomposition of methane over rare earth metal (Ce and La) oxides supported iron catalysts. Appl. Surf. Sci. 2019, 467–468, 236–248. [Google Scholar] [CrossRef]
  41. Awadallah, A.E.; Abdel-Mottaleb, M.S.; Aboul-Enein, A.A.; Yonis, M.M.; Aboul-Gheit, A.K. Catalytic Decomposition of Natural Gas to CO/CO2-Free Hydrogen Production and Carbon Nanomaterials Using MgO-Supported Monometallic Iron Family Catalysts. Chem. Eng. Commun. 2015, 202, 163–174. [Google Scholar] [CrossRef]
  42. Torres, D.; Pinilla, J.L.; Lázaro, M.J.; Moliner, R.; Suelves, I. Hydrogen and multiwall carbon nanotubes production by catalytic decomposition of methane: Thermogravimetric analysis and scaling-up of Fe–Mo catalysts. Int. J. Hydrog. Energy 2014, 39, 3698–3709. [Google Scholar] [CrossRef]
  43. Silva, J.A.; Santos, J.B.O.; Torres, D.; Pinilla, J.L.; Suelves, I. Natural Fe-based catalysts for the production of hydrogen and carbon nanomaterials via methane decomposition. Int. J. Hydrog. Energy 2021, 46, 35137–35148. [Google Scholar] [CrossRef]
  44. Pudukudy, M.; Kadier, A.; Yaakob, Z.; Takriff, M.S. Non-oxidative thermocatalytic decomposition of methane into COx free hydrogen and nanocarbon over unsupported porous NiO and Fe2O3 catalysts. Int. J. Hydrog. Energy 2016, 41, 18509–18521. [Google Scholar] [CrossRef]
  45. Yan, P.; Zhang, K.; Peng, Y. Study of Fe2O3-Al2O3 catalyst reduction parameters and conditions for catalytic methane decomposition. Chem. Eng. Sci. 2022, 250, 117410. [Google Scholar] [CrossRef]
  46. Muradov, N.Z. CO2-Free Production of Hydrogen by Catalytic Pyrolysis of Hydrocarbon Fuel. Energy Fuels 1998, 12, 41–48. [Google Scholar] [CrossRef]
  47. Alharthi, A.I.; Alotaibi, M.A.; Din, I.U.; Abdel-Fattah, E.; Bakht, M.A.; Al-Fatesh, A.S.; Alanazi, A.A. Mg and Cu incorporated CoFe2O4 catalyst: Characterization and methane cracking performance for hydrogen and nano-carbon production. Ceram. Int. 2021, 47, 27201–27209. [Google Scholar] [CrossRef]
  48. Tian, Z.; Wang, C.; Yue, J.; Zhang, X.; Ma, L. Effect of a potassium promoter on the Fischer–Tropsch synthesis of light olefins over iron carbide catalysts encapsulated in graphene-like carbon. Catal. Sci. Technol. 2019, 9, 2728–2741. [Google Scholar] [CrossRef]
Figure 1. The preparation method of the obtained OV-rich α-Fe2O3 NPs at different calcination temperatures for 5 h at ambient conditions.
Nanomaterials 13 02461 g001
Figure 2. TGA/DTG curves for the Fe(NO3)3·9H2O in the presence of air.
Nanomaterials 13 02461 g002
Figure 3. XRD patterns of the obtained OV-rich α-Fe2O3 NPs at different calcination temperatures for 5 h at ambient conditions.
Nanomaterials 13 02461 g003
Figure 4. SEM images of the obtained OV-rich α-Fe2O3 NPs at different calcination temperatures for 5 h at ambient conditions as indicated.
Nanomaterials 13 02461 g004
Figure 5. (a) Nitrogen adsorption/desorption isotherms and (b) BJH pore size distribution of the obtained OV-rich α-Fe2O3 NPs at different calcination temperatures for 5 h at ambient conditions.
Nanomaterials 13 02461 g005
Figure 6. Survey XPS spectra of the obtained OV-rich α-Fe2O3 NPs at different calcination temperatures for 5 h at ambient conditions.
Nanomaterials 13 02461 g006
Figure 7. The high-resolution XPS spectra of O 1s for the obtained OV-rich α-Fe2O3 NPs at different calcination temperatures for 5 h at ambient conditions.
Nanomaterials 13 02461 g007
Figure 8. The high-resolution XPS spectra of Fe2p for the obtained OV-rich α-Fe2O3 NPs at different calcination temperatures for 5 h at ambient conditions.
Nanomaterials 13 02461 g008
Figure 9. (a) Methane conversion percentage (%) and (b) Hydrogen formation rate as a function of time on stream (min) at 800 °C, 20 mL/min feed gas flow rate, and 0.5 g catalyst mass of the obtained OV-rich α-Fe2O3 NPs at different calcination temperatures for 5 h at ambient conditions. WHSV = 2.4 [L(gcat.h)].
Nanomaterials 13 02461 g009
Figure 10. XRD patterns of spent catalysts obtained after TCMD.
Nanomaterials 13 02461 g010
Figure 11. Scanning electron microscope images of spent catalysts obtained after TCMD.
Nanomaterials 13 02461 g011
Figure 12. Survey XPS spectra of the spent catalysts obtained after TCMD.
Nanomaterials 13 02461 g012
Figure 13. The high-resolution XPS spectra of C1s for the spent catalysts obtained after TCMD.
Nanomaterials 13 02461 g013
Figure 14. Typical TGA/DTA curves, as well as the loss of weight on the TGA curves of spent catalysts obtained after TCMD.
Nanomaterials 13 02461 g014
Figure 15. A schematic diagram depicting the proposed reaction mechanism of TCMD by the unsupported OV-rich α-Fe2O3 NPs.
Nanomaterials 13 02461 g015
Table 1. Textural properties of the obtained OV-rich α-Fe2O3 NPs at different calcination temperatures for 5 h at ambient conditions.
CatalystSurface Area
(m2/g)
Pore Volume
(cm3/g)
Pore Radius
(nm)
FeN-500 °C16.70.3419.1
FeN-700 °C7.80.2317.0
FeN-900 °C5.50.0415.3
FeN-1100 °C3.90.0421.6
Table 2. Literature review on Fe-based catalysts for TCMD.
Used CatalystsPreparation MethodWHSV
[L/(gcat∙h)]
TCMD ConditionInitial CH4 ConversionReaction Time (Min)Final CH4 ConversionRef.
Fe–Al, 40% FeFusion7.5CH4, 750 °C66%12019%[16]
Fe–Ce, 27% FeCo-precipitation4.5CH4, 800 °C35%36049%[40]
Fe–La, 27% FeCo-precipitation4.5CH4, 800 °C24%36033%[40]
Fe-Mg, 50% FeChemical impregnation1.5CH4, 700 °C5%60027%[41]
Fe-Mo-Al, 62% FeFusion1.5CH4, 750 °C75%18070%[42]
Tierga ore, 52.6% FeNone2CH4, 800 °C30%18032%[43]
Ilmenite ore, 33.3% FeNone2CH4, 800 °C8%18010%[43]
Unsupported α-Fe2O3Calcination2.4CH4, 800 °C35.248022.5%This work
Disclaimer/Publisher’s Note: The statements, opinions and data contained in all publications are solely those of the individual author(s) and contributor(s) and not of MDPI and/or the editor(s). MDPI and/or the editor(s) disclaim responsibility for any injury to people or property resulting from any ideas, methods, instructions or products referred to in the content.

