Article

Constructing the Sulfur-Doped CdO@In2O3 Nanofibers Ternary Heterojunction for Efficient Photocatalytic Hydrogen Production

1
National Experimental Teaching Demonstration Center for Chemistry, College of Chemistry and Chemical Engineering, Jishou University, Jishou 416000, China
2
MOE Key Laboratory of Bioinorganic and Synthetic Chemistry, Lehn Institute of Functional Materials, School of Chemistry, Sun Yat-sen University, Guangzhou 510006, China
*
Authors to whom correspondence should be addressed.
These authors contributed equally to this work.
Nanomaterials 2023, 13(3), 401; https://doi.org/10.3390/nano13030401
Submission received: 17 December 2022 / Revised: 10 January 2023 / Accepted: 12 January 2023 / Published: 18 January 2023

Abstract

:
An S-doped CdO@In2O3 nanofiber was successfully designed by in-situ electrospinning along and subsequent calcination treatment. Under artificial sunlight illumination, the S/CdO@In2O3-25 displayed a superior photocatalytic hydrogen evolution rate of 4564.58 μmol·g−1·h−1, with approximately 22.0 and 1261.0-fold of those shown by the S/CdO and S/In2O3 samples, respectively. The experimental and theoretical analyses illustrate that the unique one-dimensional (1D) nanofiber morphology and rich oxygen vacancies optimized the electronic structure of the nanofibers and adsorption/desorption behaviors of reaction intermediates, contributing to the realization of the remarkable solar-to-H2 conversion efficiencies. Moreover, the staggered band structure and intimate contact heterointerfaces facilitate the formation of a type-II double charge-transfer pathway, promoting the spatial separation of photoexcited charge carriers. These results could inform the design of other advanced catalyst materials for photocatalytic reactions.

1. Introduction

The consumption of non-renewable energy has aggravated energy shortages and environmental pollution, largely hindering the progress of human civilization. It has been reported that the sustainable and renewable energy sources are key to relieving these issues [1,2]. Among these renewable energy sources, hydrogen has been considered an important energy carrier because of its pollution-free and high energy density characteristics; moreover, it is also expected to act as the most promising alternative fuel in the future [3,4]. Compared with other hydrogen generation technologies, photocatalytic water splitting induced by catalysts to generate hydrogen in large quantities has been considered as one of the most promising strategies to overcome the global energy crisis [5]. Therefore, the solar-to-hydrogen technique has attracted considerable attention. Currently, in order to attain preferable hydrogen evolution activity, the development of efficient and eco-friendly hydrogen photocatalyst materials, which is a challenging task, is necessary [6]. In recent decades, various oxide semiconductor materials for photocatalysis such as In2O3 [7], ZnO [8], TiO2 [9], CdO [10], and CdS [11], have been widely explored. As a typical semiconductor, low-cost CdO is an n-II-VI material with outstanding electrical conductivity and a direct band gap [12,13]. It has been widely used in solar cells [14], transparent electrodes [15], electrochemical capacitors, gas sensors, and as a photocatalyst [16]. In addition, In2O3 is an important n-type semiconductor widely utilized in optoelectronic devices and photocatalysis because of its suitable band alignment, good photothermal stability, low toxicity, and unique optical/electronic properties [17,18]. Unfortunately, these single photocatalyst materials suffer from rapid recombination of charge carriers and low light utilization rates, which severely hinders their further application [19]. It is well known that the performance of photocatalysts can be improved by morphological adjustment [20], functional interface engineering [21], and heterojunction construction [22], which can greatly overcome the above shortcomings [23,24]. Thus, various advanced heterostructure photocatalysts such as CdTe-Bi2S3 [25], MoS2@CoMoS4 [26], Bi2S3@CoO [27], BiOI/Ag/PANI [28], α-Fe2O3/CeO2 [29], ZnO/ACN/MnO2 [30], α-Fe2O3/g-C3N4 [31], and Bi2WO6/TiO2 [32] have been extensively developed.
In addition to the above-improved strategies, the doping of non-metallic atoms (such as N, C, and S), which could result in the formation of abundant vacancies that could serve as potential charge capture centers that promote the spatial separation of carriers, has also been effective [33,34]. Among the reported micro/nanomorphologies, one-dimensional (1D) nanomaterials exhibit attractive application merits [35]. In particular, nanofibers have the sizeable 1D morphology, highly aligned nanoparticles and a large pore structure, which could provide rich charge-transfer channels for effective photocatalytic reactions. Electrospinning has been proposed to construct various 1D nanofibers materials for photocatalytic hydrogen evolution and dye degradation [36,37,38,39,40].
In this paper, we report the synthesis of an ingenious S-doped CdO@In2O3 hybrid nanofiber via in-situ electrospinning and facile calcination. As the S-doped CdO@In2O3 nanofiber was used as a photocatalyst, clean water was effectively reduced to H2 within a single integrated system under the simulated sunlight irradiation. The superior photocatalytic hydrogen evolution activity in the S-doped CdO@In2O3 hybrid can be attributed to its improved sunlight absorption ability, suppressed photo-induced carrier recombination, and accelerated charge separation properties. As an encouraging result, the optimized hydrogen evolution rate of the as-obtained hybrid can reach 4564.58 μmol·g−1·h−1, which exceeds that of the individual ones. To the best of our knowledge, this is the first study to report the synthesis of an S-doped CdO@In2O3 ternary heterojunction for efficient H2 evolution under simulated sunlight irradiation. The results herein are expected to be of interest to researchers.

2. Materials and Methods

2.1. Materials and Reagents

Polyvinylpyrrolidone (PVP), N, N-dimethylformamide (DMF), and absolute ethanol (C2H5OH) were purchased from Beijing Huahengwei Technology Ltd (Beijing, China). Indium nitrate 4.5 hydrate (In(NO3)3·4.5H2O), cadmium nitrate tetrahydrate (Cd(NO3)2·4H2O), and sulfourea were purchased from SINOPHARM (Beijing, China). All chemical reagents were of analytical grade and did not require further purification.

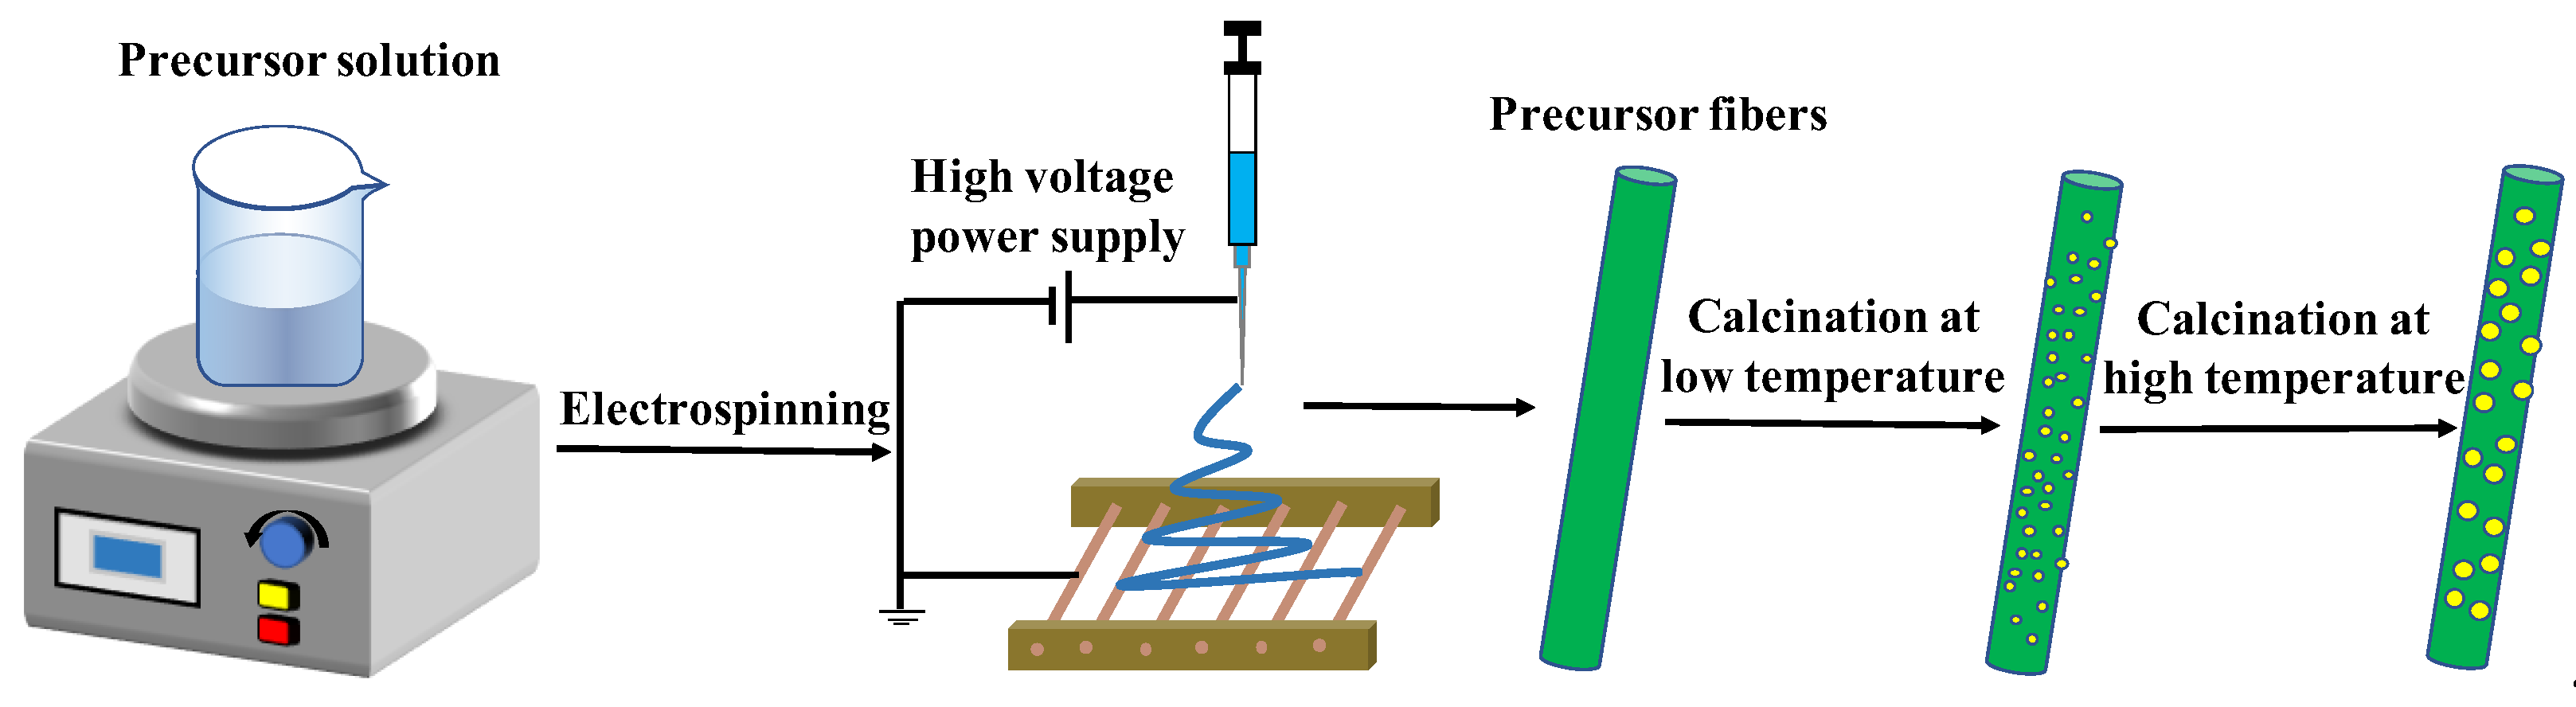
2.2. Preparation of Samples

The electrospinning process is illustrated in Figure 1. Specifically, a certain amount of In(NO3)3·4.5H2O, Cd(NO3)2·4H2O and sulfourea with different dosages were dissolved in 2 mL DMF containing 0.8 g PVP and 8 mL ethanol. After stirring for 12 h, a mixed gel containing sulfourea, In(NO3)3·4.5H2O, Cd(NO3)2·4H2O, and PVP was obtained. The prepared precursor sol was then poured into the injector using metal needles. The actual distance between the tip of the needle and Al foil was approximately 17 cm. When a positive voltage of 1.5 kV and a negative pressure were applied, the jet was stretched by an electrostatic force to produce hybrid nanofibers. The as-prepared product was then dried in an oven for 12 h and calcined in a muffle furnace at 480 °C for 4 h. The as-obtained samples were denoted as S/CdO@In2O3, where the S/CdO@In2O3 samples with molar ratios of 0.15, 0.25, or 0.35 of In2O3 and CdO were denoted as S/CI-15, S/CI-25, and S/CI-35, respectively. For comparison, pure In2O3, CdO, CdO@In2O3-25 (CI-25), S/CdO (S/C), and S/In2O3 (S/I) were also synthesized using the same procedure.

2.3. Characterization of the Materials

X-ray photoelectron spectroscopy (XPS) (ESCALAB Xi+, Thermo Fisher Scientific, Waltham, MA, USA) was used to estimate the elemental surface chemical states. Specifically, the vacuum degree of the analysis chamber is 8 × l0−10 Pa. The excitation source is Al Kα X-ray (hv = 1486.6 eV) with the working voltage of 12.5 kV and the filament current of 16 mA. The results are the signal accumulation of 10 cycles test. The pass energy of the survey spectrum and narrow spectrum is 100 and 30 eV, respectively, with the step size of 0.1 eV and the dwell time of 40–50 ms. The light spot diameter is about 650 μm. All the XPS spectra were calibrated by the 284.8 eV of C1s. Powder X-ray diffraction (XRD) patterns were measured in the 2θ region of 5–80° using a SmartLab SE (Rigaku, Tokyo, Japan) diffractometer with a copper target as the radiation source. Photoluminescence (PL) emission spectra were measured using a F-7000 fluorescence spectrometer (Hitachi, Tokyo, Japan). Fourier transform infrared (FT-IR) spectroscopy was performed using a IS10 (Nicolet, WI, USA) spectrometer. The morphological characteristics of the samples were observed using a Sigma 300 field-emission scanning electron microscope (FE-SEM) (Zeiss, Oberkochen, Germany) (FE-SEM). Transmission electron microscopy (TEM)/high resolution transmission electron microscopy (HR-TEM) was performed using an a Tecnai F20 microscope (FEI, Portland, OR, USA). The solid ultraviolet-visible (UV-vis) diffuse reflectance (UV-vis DRS) spectra were determined using a UV-2600 spectrometer (Shimadzu, Tokyo, Japan). Raman spectroscopy was performed on a Raman spectrometer (Renishaw, London, UK).

2.4. The Preparation of Catalyst Films and Photoelectrochemical Measurements

A three-electrode configuration with a quartz battery was used to evaluate the photoelectrochemical properties of the samples. A 0.1 mol/L Na2SO4 solution was used as the electrolyte, and the prepared catalyst films, platinum wire, and saturated calomel electrode were used as the working, counter, and reference electrodes, respectively. An electrochemical workstation (CHI650E) (Chenhua, Shanghai, China) was used. Specifically, the FTO glass was cleaned ultrasonically in acetone half a hour, rinsed with distilled water and ethanol, and dried at 60 °C. And 10.0 mg catalysts were dispersed in l mL absolute ethanol with 15 μL Nafion solution, and then ultrasound treated for 10 min. The suspension was evenly loading onto the FTO, glass, and then dried at 60 °C under vacuum conditions. The transient photocurrent response test was performed using a 400 W xenon lamp, and the stable time was 20 s for signal acquisition. The electrochemical impedance spectroscopy (EIS) (Chenhua, Shanghai, China) test frequency range was 100 KHz–0.01 Hz, and the initial voltage was measured for the open circuit voltage acquisition signal. The Mott–Schottky curves were tested at 500 and 1500 Hz with the measured open-circuit voltage at the setting center −(0.5–1) V as the starting voltage, +(0.5–1) V as the termination voltage, and 0.01 V as the amplitude.

2.5. Photocatalytic Performance Measurement

Photocatalytic hydrogen production as performed in a cylindrically irradiated quartz vessel. Visible light (λ > 400 nm, 300 W Xe, CEL-HXF300) (Zhongjiao Jinyuan Technology Ltd, Beijing, China) was the light source for photocatalytic reactions. The light source was placed at a distance of 12 cm on the surface of the reaction solution, and all UV light with a wavelength less than 400 nm was removed using a 400 nm cutoff filter. The as-synthesized catalyst powder (0.05 g) was dispersed in a 50 mL solution containing 0.2 M Na2S and 0.5 M Na2SO3, and 800 μL of potassium chloroplatinate was added as a cocatalyst. Before the reaction, the system was bubbled with nitrogen for 20 min to eliminate the air inside the system and ensure that the entire system was under anaerobic conditions. Using high purity nitrogen as the carrier gas, the photocatalytic H2 generation performance was determined by TCD gas chromatography (GC-7920) (Zhongjiao Jinyuan Technology Ltd, Beijing, China). Blank experiments were performed without a catalyst or light.

2.6. Theoretical Calculation

DFT calculations were performed in the Vienna ab initio simulation package (VASP). A spin-polarized GGA PBE functional [41], all-electron plane-wave basis sets with an energy cutoff of 520 eV, and a projector augmented wave (PAW) method were adopted [42,43]. A (3 × 3 × 1) Monkhorst–Pack mesh was used for the Brillouin-zone integrations to be sampled. The conjugate gradient algorithm was used in the optimization. The convergence threshold was set 1 × 10⁻⁵ eV in total energy and 0.02 eV/Å in force on each atom. In the simulations, the non-periodic boundary condition is employed, and the molecular model of a orthorhombic In2O3 (1 × 1 × 1) and hexagonal CdO (2 × 2 × 1) were established by using Materials Studio. The orthorhombic In2O3 and hexagonal CdO composite material were formed by using Materials Studio. To find the thermal stable morphology and achieve a conformation with minimum potential energy, energy minimization was performed, and these minimum energy conformations were used as the initial status in the following electronic structure simulations [44] and Materials Studio software was used for visualization and plotting. The adsorption energy change (ΔEabs) was determined as follows:
ΔEabs = Etotal − Eslab − Emol
where Etotal is the total energy for the adsorption state, Eslab is the energy of pure surface, and Emol is the energy of adsorption molecule.
The free energy change (ΔG) for adsorptions was determined as follows:
ΔG = Etotal − Eslab − Emol +ΔEZPE − TΔS
where Etotal is the total energy for the adsorption state, Eslab is the energy of pure surface, Emol is the energy of adsorption molecule, ΔEZPE is the zero-point energy change, and ΔS is the entropy change. As the vibrational entropy of H* in the adsorbed state is small, the entropy of adsorption of 1/2 H2 is SH ≈ −0.5S0H2, where S0H2 is the entropy of H2 in the gas phase at the standard conditions. Therefore, the overall corrections were taken as in ΔGH* = Etotal − Eslab − EH2/2 + 0.24 eV, where EH2 is the energy of H2 in the gas phase.

3. Results and Discussion

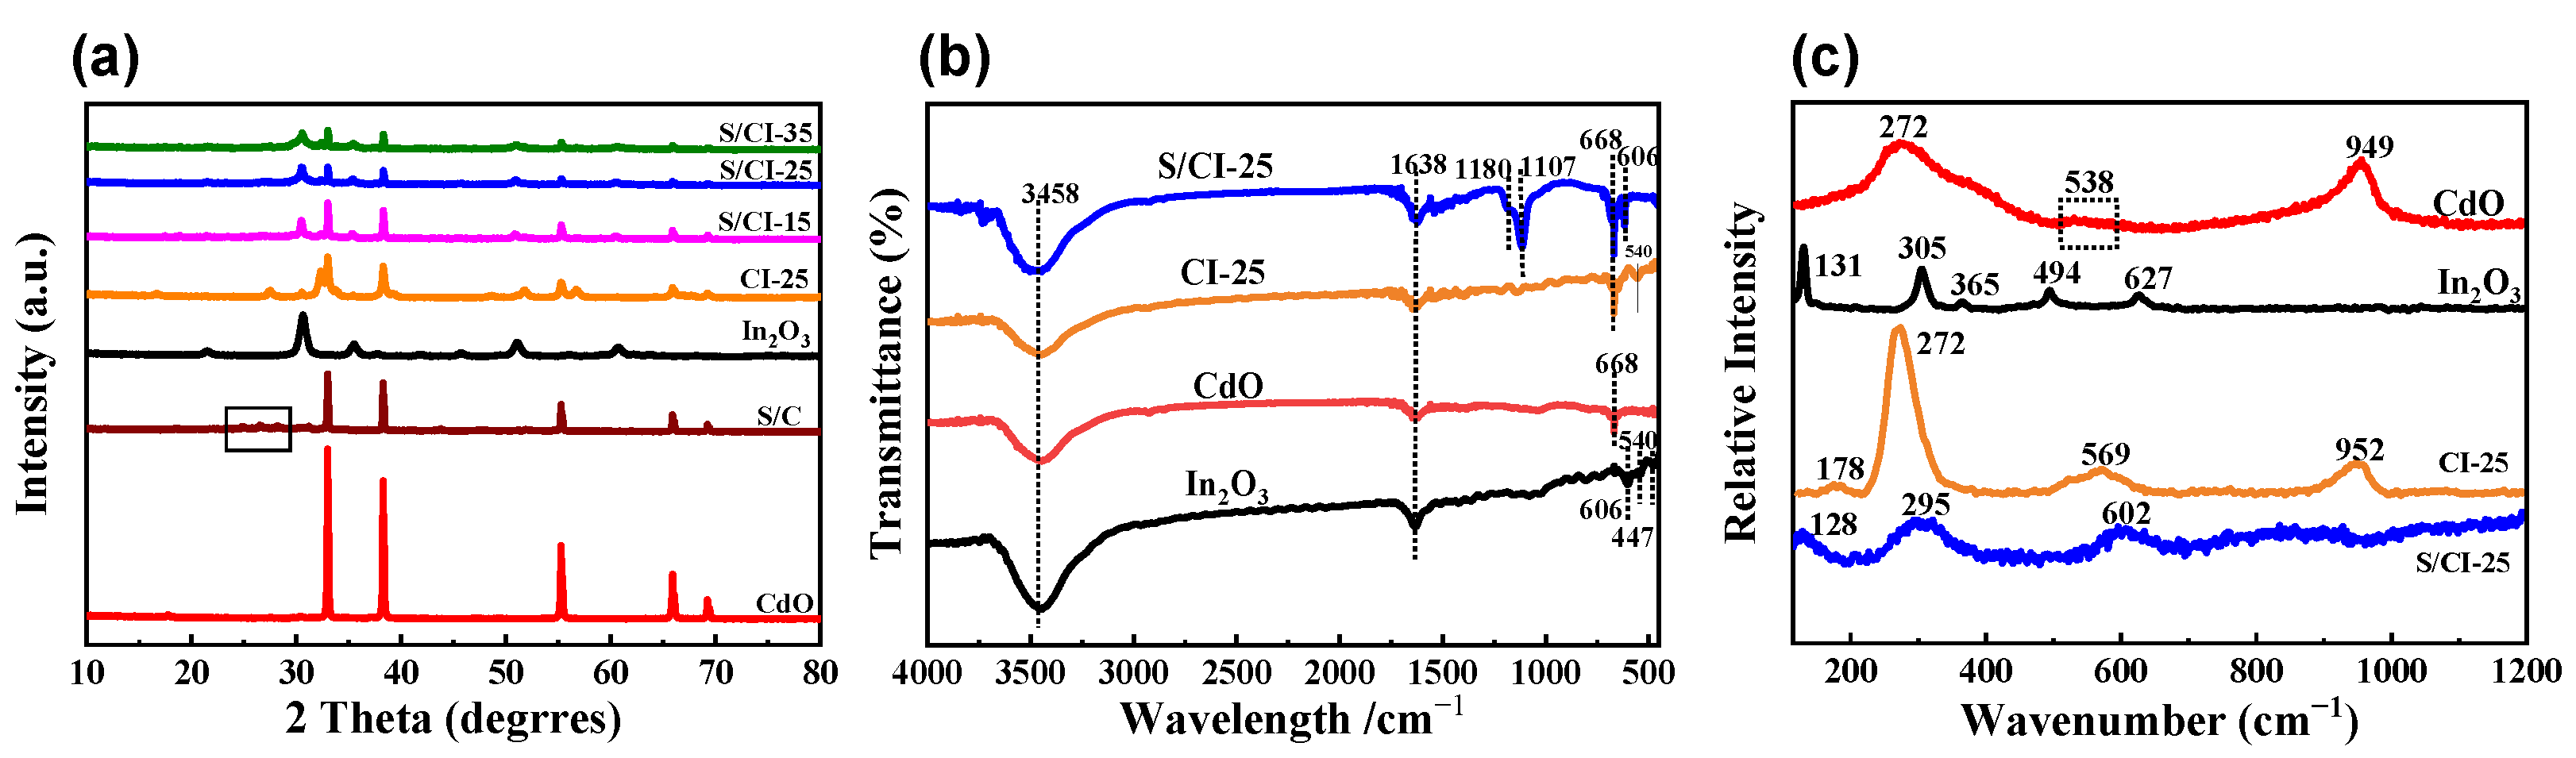
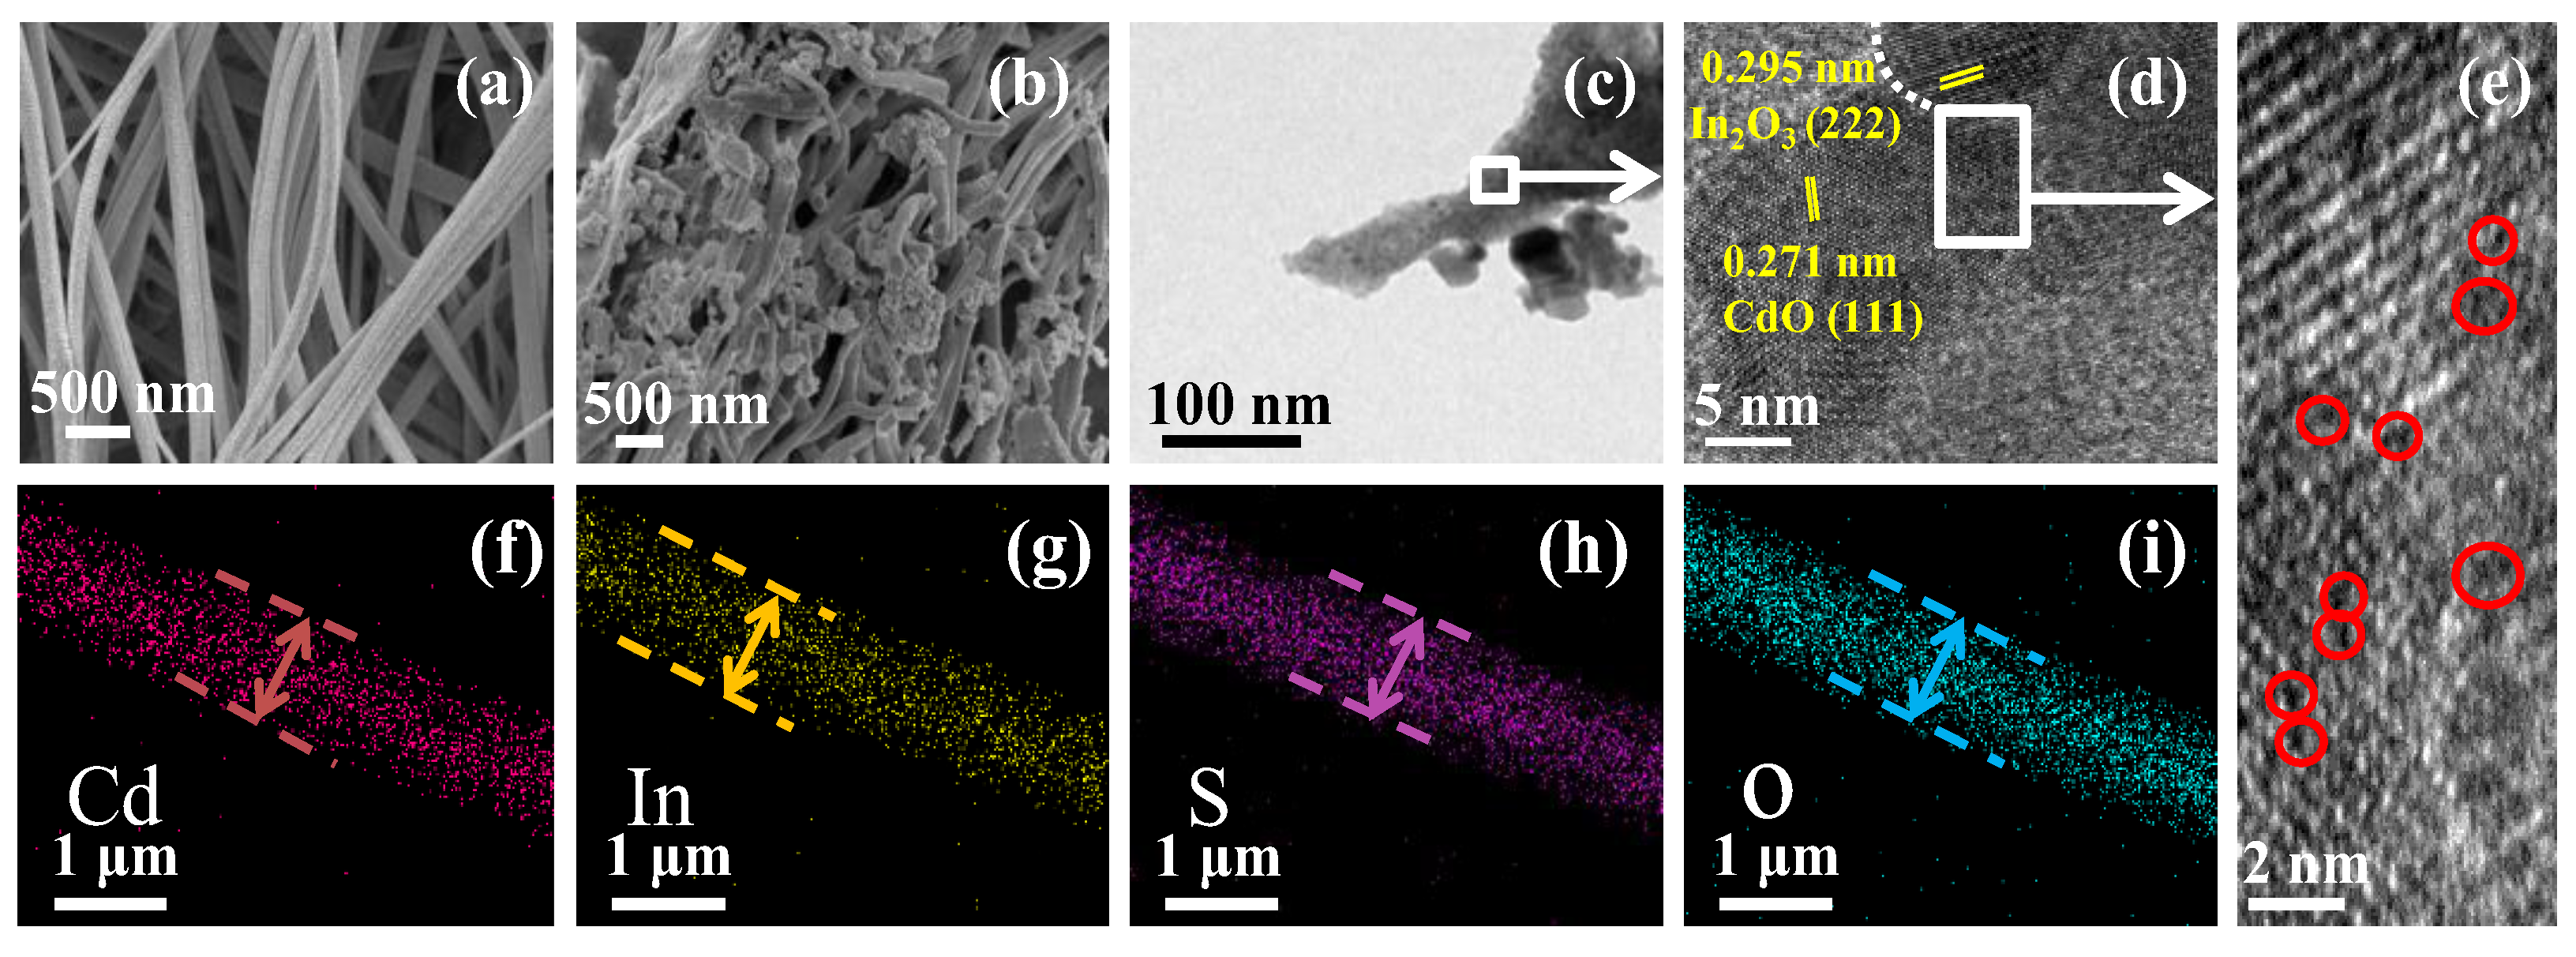
3.1. Structures and Morphologies Characterization of S/CdO@In2O3 Nanofibers

The phase structures of the synthesized catalysts were studied using XRD, as shown in Figure 2a. The characteristic diffraction peaks of bare In2O3 at 21.5°, 30.6°, 35.5°, 51.0° and 60.7°ewere consistent with the standard card (JCPDS No. 71-2194) [45]. In contrast, the diffraction peaks of the CdO samples were located at 33.0°, 38.3°, 55.3°, 65.9° and 69.2°, and were indexed to the cubic phase (JCPDS No. 05-0640). The diffraction results show the peak of pure CdO is much sharper than that of individual In2O3, indicating that CdO has much better crystallinity. It can be observed that the prepared composites contain the characteristic diffraction peaks of both In2O3 and CdO species. This implies that the as-constructed hybrid catalyst contains metal oxides of In2O3 and CdO. After electrospinning with sulfourea, no variations were observed in the crystalline structure of CdO@In2O3, which may be attributed to its low S content. Infrared and Raman characterizations were carried out to study the chemical bonds and structural properties of the catalysts. Figure 2b represents the FTIR spectra of the samples. A strong band was observed at 3458 cm−1, corresponding to the O-H group stretching vibration of CdO. The strong and sharp IR peaks at 668 and 1638 cm−1 may be caused by C-O stretching vibration. For In2O3, the peaks at 447, 540, and 606 cm−1 correspond to the vibration of the In-O bond, whereas the peaks at 1638 cm−1 belong to the adsorbed H2O molecule. The peak at 1107 cm−1 can be attributed to the tensile vibration of the S species, indicating the successful doping of sulfur atoms into the CdO@In2O3 composite. The peak at about 1180 cm−1 should be attributed to the Cd-S bond vibration in the S/In2O3-CdO. Raman analysis (Figure 2c) reveals multiple characteristic peaks for In2O3 at 131, 305, 365, 494, and 627 cm−1. The peak at 131 cm−1 corresponds to the In-O vibration of the InO6 structural unit, and the peak at 305 cm−1 corresponds to the bending vibration of InO6 octahedron structural units. The peak at 365 cm−1 corresponds to the tensile vibration of In-O-In, and the peaks at 494 and 627 cm−1 correspond to the tensile vibration of the same octahedral InO6. Compared to the single materials, the peaks of CdO@In2O3 at 131 and 627 cm−1 appear to be blue-shifted, possibly because of the effect of oxygen vacancies on the vibration frequency. For CdO, the broad and strong peaks at 272 cm−1 are a combination of transverse phonons and optical phonons caused by the lattice perturbation of the CdO film. The peak observed at 569 cm−1, for the indium-doped CdO, may be related to the band crossing between the transverse optical mode and longitudinal optical mode of the vibration of the metal oxide (Cd-O) bond in the CdO film [46]. The peak observed at 949 cm−1 is also bound by the longitudinal optical band. According to the selection rule, it can be concluded that all characteristic peaks result from the second-order Raman scattering of the CdO species. The S/CdO@In2O3-25 composite exhibits a slight red shift at 272 cm−1 owing to lattice distortion. The pyrolysis of sulfur leads to increased hypoxia and lattice distortion in CdO-In2O3. The Raman spectra of the CdO@In2O3 composites are similar to that of CdO, possibly because of the low content of In2O3 or the coating of CdO on the In2O3 surface. The additional weak band at 602 cm−1 is caused by localized defects comprising oxygen vacancies in the hybrid. Sulfur doping induces more oxygen defects and lattice distortion in CdO@In2O3. These results indicate the successful preparation of S/CdO@In2O3 ternary heterojunctions.
Moreover, the morphology of the samples was analyzed using SEM and TEM. As shown in Figure 3a, the surface of the S/CdO@In2O3-25 precursor nanofibers is smooth with a relatively uniform diameter (about 660 nm). After calcination, the fiber surface became rough, and its diameter showed a downward trend with a porous structure owing to the decomposition of the raw materials (Figure S1). Furthermore, S/CdO@In2O3-25 maintained a fibrous morphology with nanosphere-attached surfaces, as shown in Figure 3b. Further TEM observations reveal that the morphology of S/CdO@In2O3-25 after calcination consists of a shorter fiber length and coarser surface (Figure 3c). Figure 3d shows that the lattice fringes of In2O3 and CdO are 0.295 and 0.271 nm, respectively [40]. The oxygen vacancies are shown in Figure 3e, where some red dotted circles represent the vacancy sites. Further elemental mapping analysis and EDS spectra suggest that the In, Cd, S, and O elements are evenly distributed on the entire S/CdO@In2O3-25 nanofibers, as shown in Figure 3f–i and Figure S2. The multiple components are closely combined, favoring the formation of ternary heterojunctions with close-contact interfaces.
Furthermore, the electronic interaction and elemental chemical states of the as-prepared samples were examined using XPS. As shown in Figure S3, In, Cd, O, S elements are found in the composites, as expected, and no other impurities are detected, which agrees well with the EDS analysis results. This indicates that S/CdO@In2O3-25 hybrid nanofibers were successfully synthesized by in situ electrospinning. From the In 3d spectrum (Figure 4a), it is found that the binding energies (BEs) of pure In2O3 are 444.01 and 451.56 eV, which correspond to In 3d5/2 and In 3d3/2, respectively [47]. After coupling with CdO, the BEs become 444.12 and 451.67 eV. These two peaks also exist in the fine S/CdO@In2O3-25 spectra, with binding energies of 444.19 and 451.71 eV. Both exhibit a positive shift relative to that of In2O3 alone. The positive shift for the In 3d species may be caused by the strong interaction among the S, In, and Cd elements, which ameliorates the interfacial charge-transfer behaviors. In Figure 4b, the Cd 3d spectrum of pure CdO exhibits two asymmetric peaks at 403.91 and 410.60 eV, which may belong to the spin-orbit splitting of Cd 3d5/2 and Cd 3d3/2, respectively [48], indicating that the chemical states of Cd in the nanocomposite are +2 [49]. After binding with In2O3, the BEs become 405.09 and 411.78 eV. The BEs in S/CdO@In2O3-25, in which positive shifts might give rise to lattice distortion, are 405.66 and 412.42 eV. Figure 4c shows that the O 1s of bare CdO has two asymmetric peaks at 528.34 and 531.49 eV, and the main oxygen peak at 531.49 eV confirms that the O2- oxidation state exists in CdO [13]. The small oxygen peak at 528.34 eV is attributed to chemically adsorbed oxygen. Moreover, the O 1s spectrum of bare In2O3 also has two asymmetric peaks located at 529.58 and 531.46 eV. The lower-energy peak at 529.58 eV is attributed to the lattice oxygen of In2O3, and the higher-energy peak at 531.46 eV is caused by oxygen defects [50,51]. After the combination of CdO and In2O3, the two peaks for O 1s exhibit a positive shift and are located at 529.69 and 531.73 eV. When the samples are doped with sulfur, the positive shifts of the peaks increase and the two corresponding peaks are located at 530.53 and 532.83 eV. This indicates that S doping can increase oxygen vacancies, which may be conducive to the rapid separation of the photoinduced charge carriers. Furthermore, the S 2p spectrum (Figure 4d) can be divided into two peaks at 162.42 and 169.05 eV. These peaks are part of the spin orbits of S 2p3/2 and S 2p1/2 of S2- [52,53], which have complementary oxygen atoms in the lattice of CdO and In2O3, thereby confirming the presence of oxygen vacancies. The BEs region between 166 and 172 eV can be ascribed to the oxidized sulfur species, and the peak located at 169.05 eV implies the formation of the expected metal (M)-O-S bond in CdO@In2O3 [53]. The above XPS results further confirm the successful synthesis of the ternary S/CdO@In2O3 hybrid heterojunction.

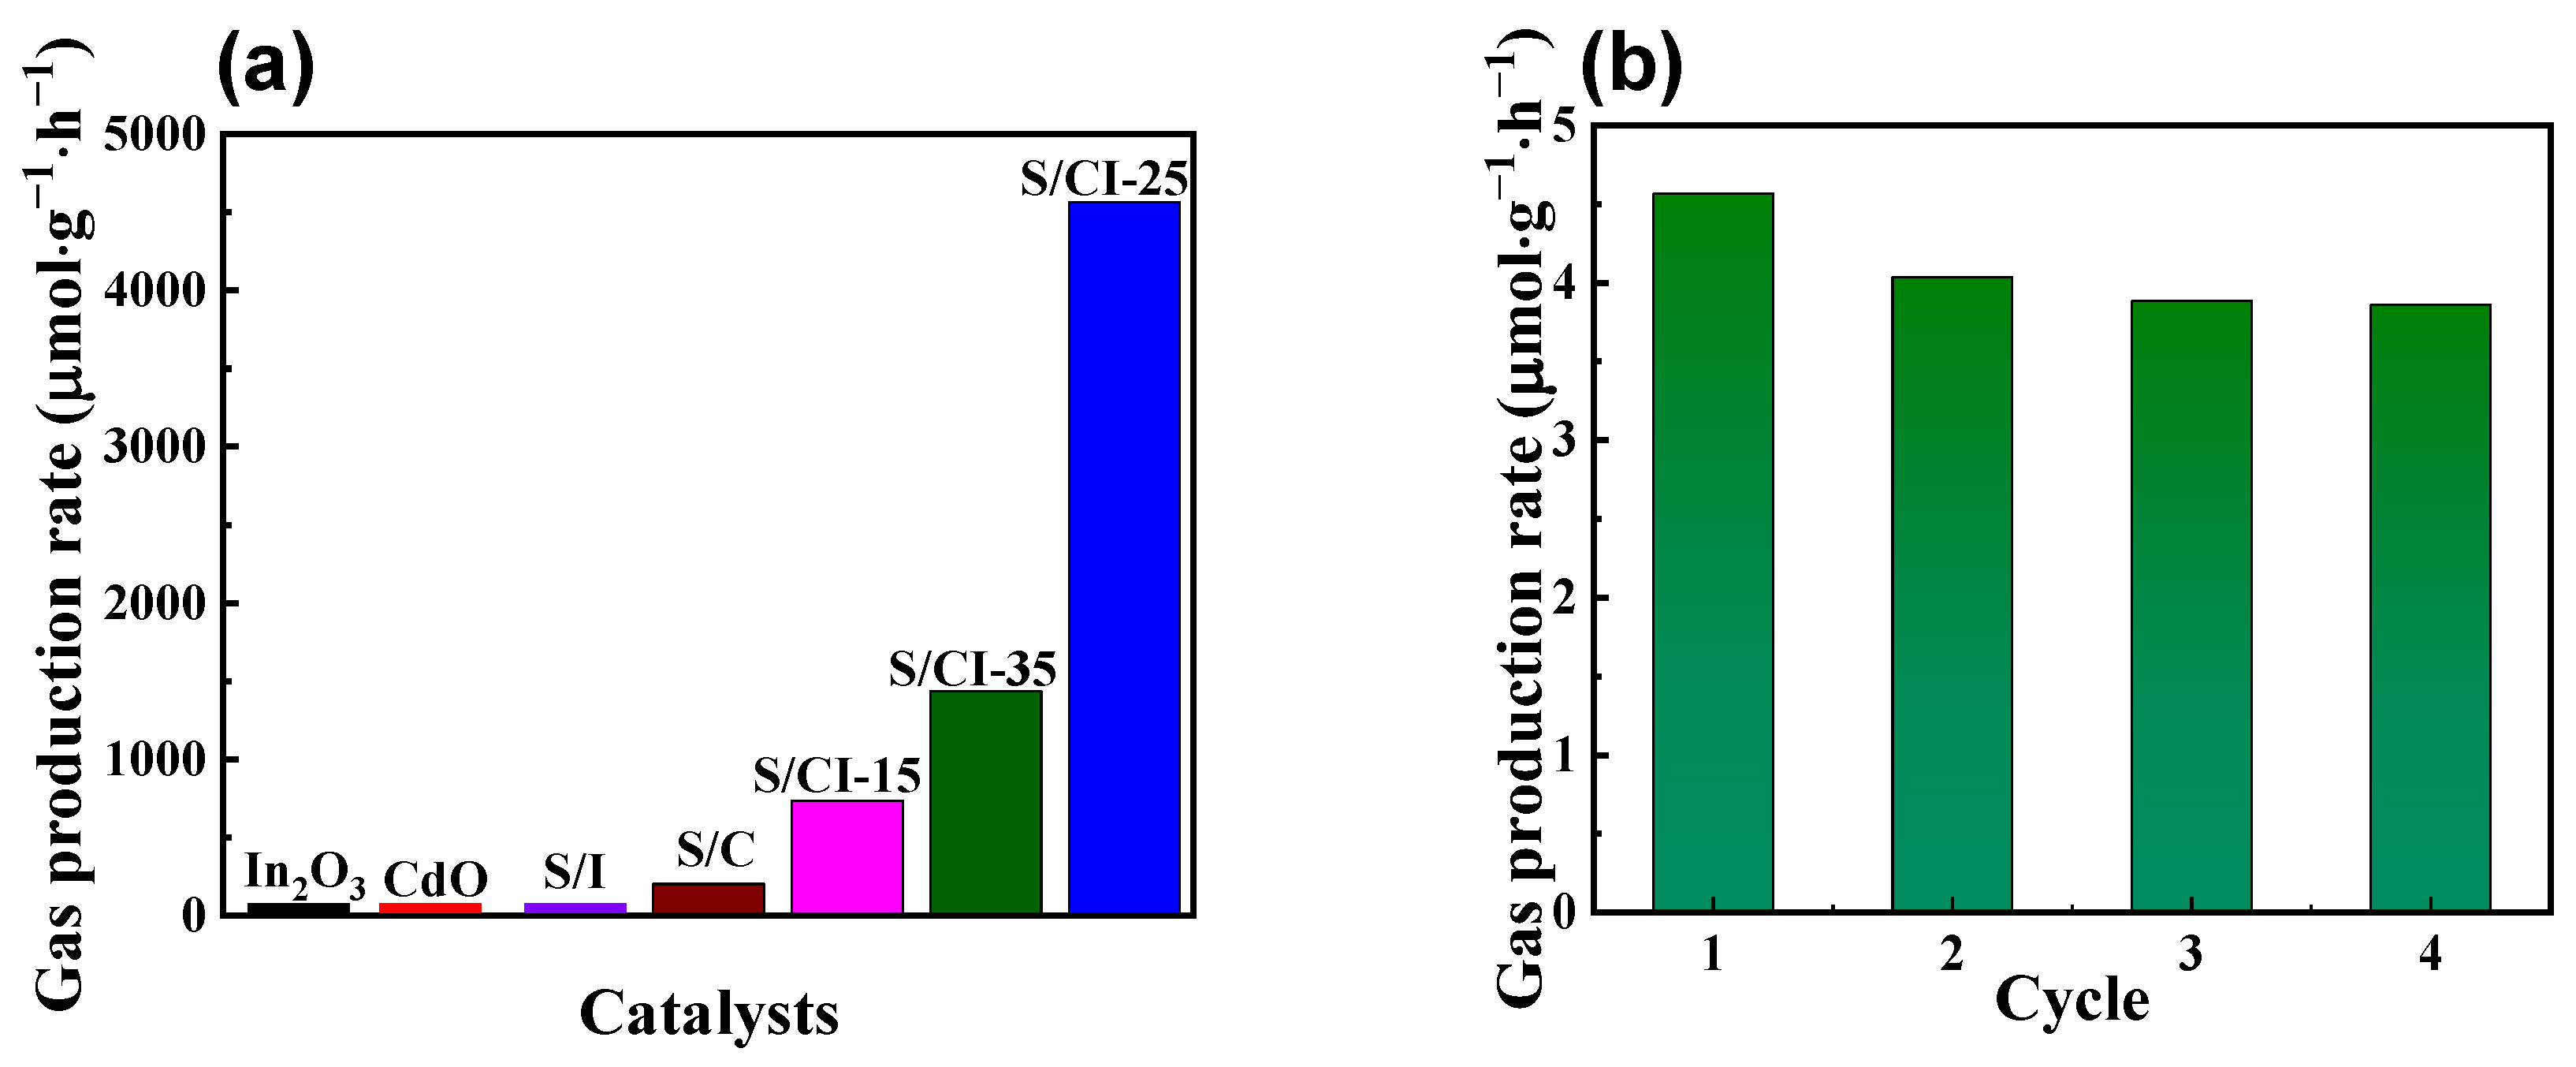
3.2. Photocatalytic Performance and Mechanism of Hydrogen Evolution Analysis

The photocatalytic performance of the as-prepared catalysts was evaluated under visible light illumination, whereas the corresponding control experiments were performed without light or the catalyst. For the control experiments, no products were formed, indicating that the light source and photocatalyst were important components for effective photocatalytic H2 evolution. Furthermore, it was found that the parental In2O3, CdO, and CdO@In2O3-25 did not produce H2 gas, as displayed in Figure 5a. The samples doped with sulfur, the S/In2O3 and S/CdO samples, exhibited photocatalytic H2 generation activities with H2 yield rates of 3.6 and 203.4 μmol g−1 h−1, respectively. As expected, the S/CdO@In2O3-25 catalyst exhibited the best hydrogen production performance with the highest H2 production rate of 4564.5 μmol g−1 h−1 and an ultrahigh H2 yield of 9129.1 μmol·g−1 after a 2 h reaction, as summarized in Figure 5a and Figure S4a. This activity might be attributed to the rich surface oxygen vacancy defects caused by doping S into the hybrid, and forming a type-II heterojunction, which is conducive to the rapid separation/transfer of photo-induced charge carriers. As a result, the H2 evolution rate of S/CdO@In2O3 was higher than that of the S/CdO and S/In2O3 catalysts. Consequently, the as-synthesized hybrid heterojunction was essential for driving the efficient H2 evolution of S/CdO@In2O3. With an increase in the molar ratio of In2O3 to CdO, the H2 evolution rate of the S/CdO@In2O3 hybrid increased (Figure 5a), with a maximum value of 4564.5 μmol g−1 h−1 H2 obtained with S/CdO@In2O3-25. When the In2O3/CdO molar ratios exceeded 0.25, the H2 yield rate decreased, which might have been because the stacking of In2O3 accumulation influenced light absorption. This accumulation may lead to the collapse of the material structure. In addition, the H2 evolution efficiency of S/CdO@In2O3 with various molar ratios of In2O3/CdO is in good agreement with the PL emission peak strength. After four consecutive recycling reactions, the catalytic activity of S/CdO@In2O3-25 did not decrease and nearly 85% of the initial activity could be remained (Figure 5b). This strongly implies that the hybrid catalyst exhibited favorable photocatalytic stability, as further evidenced by the FTIR spectra (Figure S4b). The relationship between the reaction time and generated H2 amount for the S/CdO@In2O3-25 was also determined, as shown in Figure S5. When the irradiation is 2 h, the hybrid had the best hydrogen evolution activity with the yield rate of 4564.5 μmol·g−1·h−1.
UV-Vis diffuse reflectance spectra were also analyzed to determine the origin of the photocatalytic activity of the sulphur-doped hybrid catalysts. As shown in Figure 6a, the absorption values of CdO and In2O3 are approximately 500 and 450 nm, respectively. These values are in good agreement with the values reported in previous studies [54,55]. Compared with the contradistinctive materials, the S/CdO@In2O3-25 composite exhibits a certain red shift. The improved visible light absorption properties may be related to the existence of oxygen vacancies and partial partially valence states. In other words, sulfur doping can effectively optimize the band gap because the hybridization of the O 2p and S 2p orbitals produces additional intermediate electronic states. The band gap was calculated using the Tauc curves, as shown in Figure 6b [56,57]. It can be concluded that the band gap energies (Eg) of S/CdO, S/In2O3 and S/CdO@In2O3-25 were 2.39, 2.54 and 2.22 eV, respectively. Further, photoluminescence (PL) spectroscopy was employed to study the separation of the photoexcited charge carriers. As depicted in Figure 6c, the steady-state PL spectra exhibit a wide peak at approximately 435 nm, resulting from the intrinsic energy band PL and surface oxygen defects. From the as-obtained PL results, it can be clearly seen that the original In2O3 exhibits the strongest PL intensity with a peak at 470 nm, owing to its significant charge recombination. For the CdO@In2O3 hybrid materials, the emission yield of In2O3 decreases significantly, which could be attributed to the strong interaction between In2O3 and CdO that contributed to the more efficient charge separation. By contrast, the S/CdO@In2O3-25 shows the lowest intensity, which strongly indicates that the introduction of S can effectively inhibit charge recombination, consistent with the previous photocatalytic performance. Furthermore, the transient photocurrent responses were determined to analyze the photoexcited charge carrier transfer properties of the materials. As shown in Figure 6d, the S/CdO@In2O3-25 catalyst possesses the highest photocurrent response compared to the other catalyst materials (Table S1), which illustrates that the charge-separation properties in the S/CdO@In2O3-25 hybrid can be largely promoted. In addition, the S/CdO@In2O3-25 hybrid catalyst has the smallest semicircle compared to the other synthesized catalysts (Figure 6e), indicating that its charge transfer resistance is extremely low, which favors the separation and transfer of photo-induced charge carriers.
The absorption and desorption properties of the H* atom on the photocatalyst play a key role in the H2 evolution reaction. Density functional theory calculations were used to investigate this property in the as-prepared samples. As shown in Figure 6f, the calculated adsorption energies of the H* atom for S/CdO and S/In2O3 are 0.44 and −0.43 eV, respectively. In contrast, for S/CdO@In2O3-25, the adsorption energy of the H* atom is the smallest (−0.29 eV), which might be caused by the rich surface oxygen defects and abundant H* adsorbed on the S/CdO@In2O3-25 surface, as displayed in Figure 6g and Figure S5. The diminished adsorption energy of S/CdO@In2O3-25 is favorable for driving effective H2 evolution. Furthermore, the Mott–Schottky plot (Figure 7a–c) was applied to study the band structure properties of samples. The positive slopes of the tangent curves indicate that both of them were n-type semiconductors. Compared to the 0.21V vs. NHE (CdO) and −0.65 V vs. NHE (In2O3) (Figure S6), the flat band potentials of S/CdO and S/In2O3 reduce with −0.51 and −0.70 eV, respectively, which can be attributed to the introduction of sulphur with rich electrons. Thus, it can be inferred that the VB positions of S/CdO and S/In2O3 are 1.78 and 1.74 eV, respectively. According to the band gap energies tested in UV-DRS, the CB potential energies of the samples calculated by the formula Eg = EVB − ECB are −0.61 and −0.80 eV, respectively. According to the same method, the Fermi levels, bandgap energy, and band structure of CdO and In2O3 are listed in Table S2. Based on the above results, a type-II charge transfer mechanism is proposed (Figure 7c). Under simulated light irradiation, S/CdO and S/In2O3 produced excited electron-hole pairs. The generated electrons in S/In2O3 move to the CB of S/CdO, whereas the formed holes migrate to the VB of S/In2O3, leading to the accumulation of electrons in the CB of S/CdO and h+ in the VB of S/In2O3. In this case, photoreduction of H2O to H2 can be achieved using the appropriate redox potentials of S/CdO. Moreover, the adsorption or desorption behavior (|ΔGH*| → 0) of the S/CdO@In2O3 hybrid also facilitates the migration of photogenerated carriers, further promoting the separation of photoinduced electron-hole pairs.

4. Conclusions

Overall, a S/CdO@In2O3 hybrid with a ternary heterojunction was successfully synthesized for effective solar-driven H2 evolution. The experimental results illustrated that the S/CdO@In2O3-25 hybrid exhibited a remarkable H2 production rate of 4564.5 μmol g−1 h−1 under artificial sunlight irradiation, and this H2 yield rate was approximately 22.0 and 1261.0 times greater than those of the parental S/CdO and S/In2O3, respectively, surpassing that of many reported photocatalyst materials. Moreover, the as-designed S/CdO@In2O3 hybrid nanofibers and abundant oxygen defects could optimize the electronic structure and activation energies of the catalysts. Furthermore, a double charge-transfer mechanism based on the type-II charge-transfer mechanism was proposed to elucidate the prominent photocatalytic H2 generation activity. This study employed this in situ electrospinning approach to construct 1D S-doped CdO@In2O3 nanofibers for photocatalytic hydrogen evolution. These results of this study can be helpful in the development of efficient solar-to-fuel conversion materials.

Supplementary Materials

The following supporting information can be downloaded at https://www.mdpi.com/article/10.3390/nano13030401/s1. Figure S1: The TG-DTA; Figure S2: EDS spectrum; Figure S3: XPS survey spectra; Figure S4: The relationship between time and H2 production; Figure S5: Geometrical structure; Figure S6: Mott–Schottky plots; Table S1: Energy band structure parameters. References [53,58,59,60,61,62,63,64,65,66,67] are cited in the Supplementary Materials.

Author Contributions

Experimental, Formal analysis, Data curation, Methodology, Writing—original draft, H.Z.; Investigation, data analysis, data interpretation, Writing—original draft, Supervision, Z.Z.; Data curation, Validation, M.Y.; Conceptualization, Resources, Formal analysis, Funding acquisition, Writing—review and editing, Y.L.; Writing—review and editing, Resources, X.L.; Validation, Funding acquisition, M.L.; Resources, S.T.; Writing—review and editing, Resources, Supervision, Funding acquisition, Y.T.; Writing—review and editing, Resources, Supervision, Formal analysis, D.-B.K., H.Z. and Z.Z. contributed equally to this work. All authors have read and agreed to the published version of the manuscript.

Funding

This work is financially supported by the National Natural Science Foundation of China (21763010, 52072146, 22005117, 22005351), the Youth Project of Natural Science Foundation of Hunan Province (2022JJ40338), the Scientific Research Youth Project by Education Department of Hunan Province (22B0556), the Project Fund of Jishou University (Jdy20002), the Guangdong Basic and Applied Basic Research Foundation (2019A1515110513), the Key Laboratory of Mineral Cleaner Production, and the Exploit of Green Functional Materials in Hunan Province. The sponsors had no role in study design; in the collection, analysis, and interpretation of data; in the writing of the report; and in the decision to submit the article for publication.

Institutional Review Board Statement

Not applicable.

Informed Consent Statement

Not applicable.

Data Availability Statement

The data supporting the findings of this study are available within the article and its Supplementary Materials.

Conflicts of Interest

The authors declare no conflict of interest.

References

  1. Chen, R.T.; Ren, Z.F.; Liang, Y.; Zhang, G.H.; Dittrich, T.; Liu, R.Z.; Liu, Y.; Zhao, Y.; Pang, S.; An, H.Y.; et al. Spatiotemporal imaging of charge transfer in photocatalyst particles. Nature 2022, 610, 296–301. [Google Scholar] [CrossRef]
  2. Di, J.; Xiong, J.; Li, H.; Liu, Z. Ultrathin 2D Photocatalysts: Electronic-Structure Tailoring, Hybridization, and Applications. Adv. Mater. 2018, 30, 1704548. [Google Scholar] [CrossRef]
  3. Cai, C.; Teng, Y.; Wu, J.-H.; Li, J.-Y.; Chen, H.-Y.; Chen, J.-H.; Kuang, D.-B. In Situ Photosynthesis of an MAPbI3/CoP Hybrid Heterojunction for Efficient Photocatalytic Hydrogen Evolution. Adv. Funct. Mater. 2020, 30, 2001478. [Google Scholar] [CrossRef]
  4. Teng, Y.; Gao, J.-X.; Li, J.-Y.; Chen, H.-Y.; Wang, X.-D.; Kuang, D.-B. Engineering multinary heterointerfaces in two-dimensional cobalt molybdenum phosphide hybrid nanosheets for efficient electrocatalytic water splitting. Sustain. Energy Fuels 2021, 5, 3458–3466. [Google Scholar] [CrossRef]
  5. Ganguly, P.; Harb, M.; Cao, Z.; Cavallo, L.G.; Breen, A.; Dervin, S.; Dionysiou, D.D.; Pillai, S.C. 2D Nanomaterials for Photocatalytic Hydrogen Production. ACS Energy Lett. 2019, 4, 1687–1709. [Google Scholar] [CrossRef] [Green Version]
  6. Jiang, Y.; Liao, J.-F.; Chen, H.-Y.; Zhang, H.-H.; Li, J.-Y.; Wang, X.-D.; Kuang, D.-B. All-Solid-State Z-Scheme α-Fe2O3/Amine-RGO/CsPbBr3 Hybrids for Visible-Light-Driven Photocatalytic CO2 Reduction. Chem 2020, 6, 766–780. [Google Scholar] [CrossRef]
  7. Qin, Y.; Li, H.; Lu, J.; Ding, Y.; Ma, C.; Liu, X.; Meng, M.; Yan, Y. Fabrication of Bi2WO6/In2O3 photocatalysts with efficient photocatalytic performance for the degradation of organic pollutants: Insight into the role of oxygen vacancy and heterojunction. Adv. Powder Technol. 2020, 31, 2890–2900. [Google Scholar] [CrossRef]
  8. Liu, Y.; Zhang, Q.; Xu, M.; Yuan, H.; Chen, Y.; Zhang, J.; Luo, K.; Zhang, J.; You, B. Novel and efficient synthesis of Ag-ZnO nanoparticles for the sunlight-induced photocatalytic degradation. Appl. Surf. Sci. 2019, 476, 632–640. [Google Scholar] [CrossRef]
  9. Meng, A.Y.; Zhang, L.Y.; Cheng, B.; Yu, J.G. Dual Cocatalysts in TiO2 Photocatalysis. Adv. Mater. 2019, 31, 1807660. [Google Scholar] [CrossRef]
  10. Munawar, T.; Yasmeen, S.; Hussain, F.; Mahmood, K.; Hussain, A.; Asghar, M.; Iqbal, F. Synthesis of novel heterostructured ZnO-CdO-CuO nanocomposite: Characterization and enhanced sunlight driven photocatalytic activity. Mater. Chem. Phys. 2020, 249, 122983. [Google Scholar] [CrossRef]
  11. Kipkorir, A.; DuBose, J.; Cho, J.; Kamat, P.V. CsPbBr3-CdS heterostructure: Stabilizing perovskite nanocrystals for photocatalysis. Chem. Sci. 2021, 12, 14815–14825. [Google Scholar] [CrossRef]
  12. Nagakawa, H.; Nagata, M. Photoreforming of Organic Waste into Hydrogen Using a Thermally Radiative CdOx/CdS/SiC Photocatalyst. ACS Appl. Mater. Interfaces 2021, 13, 47511–47519. [Google Scholar] [CrossRef]
  13. Hattali, O.A.A.; Marzouqi, F.A.; Mamari, S.A.; Kuvarega, A.T.; Selvaraj, R. CdO nanoplates for photocatalytic degradation of Levofloxacin and Nizatidine under natural solar light irradiation. Inorg. Chem. Comm. 2022, 146, 110071. [Google Scholar] [CrossRef]
  14. Upadhyay, G.K.; Kumar, V.; Purohit, L.P. Optimized CdO:TiO2 nanocomposites for heterojunction solar cell applications. J. Alloy. Compd. 2021, 856, 157453. [Google Scholar] [CrossRef]
  15. Mohanraj, K.; Balasubramanian, D.; Chandrasekaran, J. Synthesis and characterization of ruthenium-doped CdO nanoparticle and its n-RuCdO/p-Si junction diode application. J. Alloy. Compd. 2019, 779, 762–775. [Google Scholar] [CrossRef]
  16. Zhou, G.S.; Cheng, Y.; Yu, Z.H.; Liu, X.L.; Chen, D.H.; Wang, J.Q.; Hang, Y.; Xu, Y.R.; Li, C.X.; Lu, Z.Y. Regulation of coordination and doping environment via target molecular transformation for boosting selective photocatalytic ability. Chem. Commun. 2022, 58, 10036–10039. [Google Scholar] [CrossRef]
  17. Yan, T.J.; Li, N.; Wang, L.L.; Ran, W.G.; Duchesne, P.N.; Wan, L.L.; Nguyen, N.T.; Wang, L.; Xia, M.K.; Ozin, G.A. Bismuth atom tailoring of indium oxide surface frustrated Lewis pairs boosts heterogeneous CO2 photocatalytic hydrogenation. Nat. Commun. 2020, 11, 6095. [Google Scholar] [CrossRef]
  18. Meng, M.; Wang, L.W.; Li, C.Y.; Xu, K.; Chen, Y.Y.; Li, J.T.; Gan, Z.X.; Yuan, H.L.; Liu, L.Z.; Li, J. Boosting charge separation on epitaxial In2O3 octahedron-nanowire crystal facet-based homojunctions for robust photoelectrochemical water splitting. Appl. Catal. B 2023, 321, 122071. [Google Scholar] [CrossRef]
  19. Reshak, A.H. Quantum dots in photocatalytic applications: Efficiently enhancing visible light photocatalytic activity by integrating CdO quantum dots as sensitizers. Phys. Chem. Chem. Phys. 2017, 19, 24915–24927. [Google Scholar] [CrossRef]
  20. Wang, S.; Guan, B.Y.; Lu, Y.; Lou, X.W.D. Formation of Hierarchical In2S3-CdIn2S3 Heterostructured Nanotubes for Efficient and Stable Visible Light CO2 Reduction. J. Am. Chem. Soc. 2017, 139, 17305–17308. [Google Scholar] [CrossRef]
  21. Xiao, Z.H.; Xiao, J.; Sun, Q.; Wang, Y.F.; Pan, L.; Shi, C.X.; Zhang, X.W.; Zou, J.-J. Interface Engineering of Conjugated Polymer-Based Composites for Photocatalysis. Chem. Eur. J. 2022, 28, e202202593. [Google Scholar] [CrossRef] [PubMed]
  22. Wang, X.-D.; Huang, Y.-H.; Liao, J.-F.; Jiang, Y.; Zhou, L.; Zhang, X.-Y.; Chen, H.-Y.; Kuang, D.-B. In Situ Construction of a Cs2SnI6 Perovskite Nanocrystal/SnS2 Nanosheet Heterojunction with Boosted Interfacial Charge Transfer. J. Am. Chem. Soc. 2019, 141, 13434–13441. [Google Scholar] [CrossRef] [PubMed]
  23. Hu, Z.; Li, K.; Wu, X.; Wang, N.; Li, X.; Li, Q.; Li, L.; Lv, K. Dramatic promotion of visible-light photoreactivity of TiO2 hollow microspheres towards NO oxidation by introduction of oxygen vacancy. Appl. Catal. B 2019, 256, 117860. [Google Scholar] [CrossRef]
  24. Xu, Y.-F.; Yang, M.-Z.; Chen, B.-X.; Wang, X.-D.; Chen, H.-Y.; Kuang, D.-B.; Su, C.-Y. A CsPbBr3 Perovskite Quantum Dot/Graphene Oxide Composite for Photocatalytic CO2 Reduction. J. Am. Chem. Soc. 2017, 139, 5660–5663. [Google Scholar] [CrossRef] [PubMed]
  25. Liu, Q.; Huan, J.; Hao, N.; Qian, J.; Mao, H.; Wang, K. Engineering of Heterojunction-Mediated Biointerface for Photoelectrochemical Aptasensing: Case of Direct Z-Scheme CdTe-Bi2S3 Heterojunction with Improved Visible-Light-Driven Photoelectrical Conversion Efficiency. ACS Appl. Mater. Inter. 2017, 9, 18369–18376. [Google Scholar] [CrossRef] [PubMed]
  26. Zhang, A.; Yang, L.; Zhang, L. Z-Scheme 2D/3D hierarchical MoS2@CoMoS4 flower-shaped arrays with enhanced full spectrum light photoelectrocatalytic activity for H2O2/p-aminophenol production and contaminant degradation. J. Mater. Chem. A 2020, 8, 25890–25903. [Google Scholar] [CrossRef]
  27. Yang, L.; Hu, Y.; Zhang, L. Architecting Z-scheme Bi2S3@CoO with 3D chrysanthemums-like architecture for both photoeletro-oxidization and-reduction performance under visible light. Chem. Eng. J. 2019, 378, 122092. [Google Scholar] [CrossRef]
  28. Su, Y.; Yu, X.; Fu, X.; Zhu, Q.; Liu, L.; Zhu, Y.; Zhang, Y. Embedding Ag nanoparticles to construct BiOI/Ag/PANI with enhanced photoelectrocatalytic activity: A demonstration of the switch from type-II to Z-scheme. Electrochim. Acta 2020, 344, 136144. [Google Scholar] [CrossRef]
  29. He, S.; Yan, C.; Chen, X.Z.; Wang, Z.; Ouyang, T.; Guo, M.-L.; Liu, Z.Q. Construction of core-shell heterojunction regulating α-Fe2O3 layer on CeO2 nanotube arrays enables highly efficient Z-scheme photoelectrocatalysis. Appl. Catal. B 2020, 276, 119138. [Google Scholar] [CrossRef]
  30. He, S.; Xiao, K.; Chen, X.Z.; Li, T.; Ouyang, T.; Wang, Z.; Guo, M.L.; Liu, Z.Q. Enhanced photoelectrocatalytic activity of direct Z-scheme porous amorphous carbon nitride/manganese dioxide nanorod arrays. J. Colloid Interf. Sci. 2019, 557, 644–654. [Google Scholar] [CrossRef]
  31. She, X.; Wu, J.; Xu, H.; Zhong, J.; Wang, Y.; Song, Y.; Nie, K.; Liu, Y.; Yang, Y.; Rodrigues, M.-T.F.; et al. High Efficiency Photocatalytic Water Splitting Using 2D α-Fe2O3/g-C3N4 Z-Scheme Catalysts. Adv. Energy Mater. 2017, 7, 1700025. [Google Scholar] [CrossRef]
  32. Yuan, L.; Lu, K.-Q.; Zhang, F.; Fu, X.; Xu, Y.-J. Unveiling the interplay between light-driven CO2 photocatalytic reduction and carbonaceous residues decomposition: A case study of Bi2WO6-TiO2 binanosheets. Appl. Catal. B 2018, 237, 424–431. [Google Scholar] [CrossRef]
  33. Wang, Y.-Y.; Chen, Y.-X.; Barakat, T.; Zeng, Y.-J.; Liu, J.; Siffert, S.; Su, B.-L. Recent advances in non-metal doped titania for solar-driven photocatalytic/photoelectrochemical water-splitting. J. Energy Chem. 2022, 66, 529–559. [Google Scholar] [CrossRef]
  34. Wang, W.; Zeng, Z.; Zeng, G.; Zhang, C.; Xiao, R.; Zhou, C.; Xiong, W.; Yang, Y.; Lei, L.; Liu, Y.; et al. Sulfur doped carbon quantum dots loaded hollow tubular g-C3N4 as novel photocatalyst for destruction of Escherichia coli and tetracycline degradation under visible light. Chem. Eng. J. 2019, 378, 122132. [Google Scholar] [CrossRef]
  35. Shen, Q.Y.; Xu, T.Y.; Zhuang, G.-l.; Zhuang, Y.; Sun, L.M.; Han, X.G.; Wang, X.J.; Zhan., W.W. Spatially Separated Photoinduced Charge Carriers for the Enhanced Photocatalysis Over the One-Dimensional Yolk-Shell In2Se3@N-C Nanoreactor. ACS Catal. 2021, 11, 12931–12939. [Google Scholar] [CrossRef]
  36. Odhiambo, V.O.; Ongarbayeva, A.; Kéri, O.; Simon, L.; Szilágyi, I.M. Synthesis of TiO2/WO3 Composite Nanofibers by a Water-Based Electrospinning Process and Their Application in Photocatalysis. Nanomaterials 2020, 10, 882. [Google Scholar] [CrossRef]
  37. Shepa, I.; Mudra, E.; Dusza, J. Electrospinning through the prism of time. Mater. Today Chem. 2021, 21, 100543. [Google Scholar] [CrossRef]
  38. Lu, Q.; Liu, S.; Ren, M.; Song, L.; Zhao, G. Preparation and characterization of hollow In2O3/Co3O4 heterostructured microribbons by electrospinning process. J. Sol-Gel Sci. Technol. 2011, 61, 169–174. [Google Scholar] [CrossRef]
  39. Zhao, F.; Lu, Q.; Liu, S. Preparation and characterization of In2O3/ZnO heterostructured microbelts by sol-gel combined with electrospinning method. J. Sol-Gel Sci. Technol. 2013, 69, 357–363. [Google Scholar] [CrossRef]
  40. Maafa, I.M.; Al-Enizi, A.M.; Abutaleb, A.; Zouli, N.I.; Ubaidullah, M.; Shaikh, S.F.; Al-Abdrabalnabi, M.A.; Yousef, A. One-pot preparation of CdO/ZnO core/shell nanofibers: An efficient photocatalyst. Alex. Eng. J. 2021, 60, 1819–1826. [Google Scholar] [CrossRef]
  41. Perdew, J.P.; Burke, K.; Ernzerhof, M. Generalized Gradient Approximation Made Simple. Phys. Rev. Lett. 1996, 77, 3865–3868. [Google Scholar] [CrossRef] [PubMed] [Green Version]
  42. Kresse, G.; Joubert, D. From Ultrasoft Pseudopotentials to the Projector Augmented-Wave Method. Phys. Rev. B 1999, 59, 1758–1775. [Google Scholar] [CrossRef]
  43. Blöchl, P.E. Projector Augmented-Wave Method. Phys. Rev. B 1994, 50, 17953–17979. [Google Scholar] [CrossRef] [PubMed] [Green Version]
  44. Momma, K.; Izumi, F. VESTA 3 for three-dimensional visualization of crystal, volumetric and morphology data. J. Appl. Crystallogr. 2011, 44, 1272–1276. [Google Scholar] [CrossRef]
  45. Yang, L.; Hong, Y.; Liu, E.; Zhang, X.; Wang, L.; Lin, X.; Shi, J. Significant enhancement of photocatalytic H2 production simultaneous with dye degradation over Ni2P modified In2O3 nanocomposites. Sep. Purif. Technol. 2021, 263, 118366. [Google Scholar] [CrossRef]
  46. Velusamy, P.; Babu, R.R.; Ramamurthi, K.; Elangovan, E.; Viegas, J.; Dahlem, M.S.; Arivanandhan, M. Characterization of spray pyrolytically deposited high mobility praseodymium doped CdO thin films. Ceram. Int. 2016, 42, 12675–12685. [Google Scholar] [CrossRef]
  47. Shen, Q.; Sun, L.; Zhuang, Y.; Zhan, W.; Wang, X.; Han, X. Hollow Dodecahedral Structure of In2O3-In2S3 Heterojunction Encapsulated by N-Doped C as an Excellent Visible-Light-Active Photocatalyst for Organic Transformation. Inorg. Chem. 2020, 59, 17650–17658. [Google Scholar] [CrossRef]
  48. Sreekanth, T.V.M.; Dillip, G.R.; Lee, Y.R. Picrasma quassioides mediated cerium oxide nanostructures and their post-annealing treatment on the microstructural, morphological and enhanced catalytic performance. Ceram. Int. 2016, 42, 6610–6618. [Google Scholar] [CrossRef]
  49. Balamurugan, S.; Balu, A.R.; Narasimman, V.; Selvan, G.; Usharani, K.; Srivind, J.; Suganya, M.; Manjula, N.; Rajashree, C.; Nagarethinam, V.S. Multi metal oxide CdO-Al2O3-NiO nanocomposite-synthesis, photocatalytic and magnetic properties. Mater. Res. Express 2018, 6, 015022. [Google Scholar] [CrossRef]
  50. Akashi, R.; Naya, S.-I.; Negishi, R.; Tada, H. Two-Step Excitation-Driven Au-TiO2-CuO Three-Component Plasmonic Photocatalyst: Selective Aerobic Oxidation of Cyclohexylamine to Cyclohexanone. J. Phys. Chem. C 2016, 120, 27989–27995. [Google Scholar] [CrossRef]
  51. Kuang, P.Y.; Zheng, X.J.; Lin, J.; Huang, X.B.; Li, N.; Li, X.; Liu, Z.Q. Facile Construction of Dual p-n Junctions in CdS/Cu2O/ZnO Photoanode with Enhanced Charge Carrier Separation and Transfer Ability. ACS Omega 2017, 2, 852–863. [Google Scholar] [CrossRef] [PubMed]
  52. Lei, Y.G.; Ng, K.H.; Zhu, Y.C.; Zhang, Y.Z.; Li, Z.X.; Xu, S.; Huang, J.Y.; Hu, J.; Chen, Z.; Cai, W.L.; et al. Mo-activated VC as effective cocatalyst for an enhanced photocatalytic hydrogen evolution activity of CdS. Chem. Eng. J. 2023, 452, 139325. [Google Scholar] [CrossRef]
  53. Ren, J.-T.; Yuan, K.; Wu, K.; Zhou, L.; Zhang, Y.-W. A robust CdS/In2O3 hierarchical heterostructure derived from a metal-organic framework for efficient visible-light photocatalytic hydrogen production. Inorg. Chem. Front. 2019, 6, 366–375. [Google Scholar] [CrossRef]
  54. Margan, P.; Haghighi, M. Sono-coprecipitation synthesis and physicochemical characterization of CdO-ZnO nanophotocatalyst for removal of acid orange 7 from wastewater. Ultrason. Sonochem. 2018, 40, 323–332. [Google Scholar] [CrossRef]
  55. Du, Q.; Ma, J.; Shao, X.; Wang, W.; Tian, G. Core-shell structured TiO2@In2O3 for highly active visible-light photocatalysis. Chem. Phys. Lett. 2019, 714, 208–212. [Google Scholar] [CrossRef]
  56. McManamon, C.; O’Connell, J.; Delaney, P.; Rasappa, S.; Holmes, J.D.; Morris, M.A. A facile route to synthesis of S-doped TiO2 nanoparticles for photocatalytic activity. J. Mol. Catal. A Chem. 2015, 406, 51–57. [Google Scholar] [CrossRef]
  57. Ahamad, T.; Naushad, M.; Alshehri, S.M. Analysis of degradation pathways and intermediates products for ciprofloxacin using a highly porous photocatalyst. Chem. Eng. J. 2021, 417, 127969. [Google Scholar] [CrossRef]
  58. Ma, D.; Shi, J.W.; Zou, Y.; Fan, Z.; Shi, J.; Cheng, L.; Sun, D.; Wang, Z.; Niu, C. Multiple carrier-transfer pathways in a flower-like In2S3/CdIn2S4/In2O3 ternary heterostructure for enhanced photocatalytic hydrogen production. Nanoscale 2018, 10, 7860–7870. [Google Scholar] [CrossRef]
  59. Navarro, R.; Delvalle, F.; Fierro, J. Photocatalytic hydrogen evolution from CdS-ZnO-CdO systems under visible light irradiation: Effect of thermal treatment and presence of Pt and Ru cocatalysts. Int. J. Hydrog. Energy 2008, 33, 4265–4273. [Google Scholar] [CrossRef]
  60. Ma, D.; Shi, J.-W.; Sun, D.; Zou, Y.; Cheng, L.; He, C.; Wang, Z.; Niu, C. Au Nanoparticle and CdS Quantum Dot Codecoration of In2O3 Nanosheets for Improved H2 Evolution Resulting from Efficient Light Harvesting and Charge Transfer. ACS Sustain.Chem. Eng. 2018, 7, 547–557. [Google Scholar] [CrossRef]
  61. Munusamy, T.D.; Chin, S.Y.; Tarek, M.; Khan, M.M.R. Sustainable hydrogen production by CdO/exfoliated g-C3N4 via photoreforming of formaldehyde containing wastewater. Int. J. Hydrog. Energy 2021, 46, 30988–30999. [Google Scholar] [CrossRef]
  62. Han, L.; Jing, F.; Zhang, J.; Luo, X.-Z.; Zhong, Y.-L.; Wang, K.; Zang, S.-H.; Teng, D.-H.; Liu, Y.; Chen, J.; et al. Environment friendly and remarkably efficient photocatalytic hydrogen evolution based on metal organic framework derived hexagonal/cubic In2O3 phase-junction. Appl. Catal. B-Environ. 2021, 282, 119602. [Google Scholar] [CrossRef]
  63. Cao, S.-W.; Liu, X.-F.; Yuan, Y.-P.; Zhang, Z.-Y.; Liao, Y.-S.; Fang, J.; Loo, S.C.J.; Sum, T.C.; Xue, C. Solar-to-fuels conversion over In2O3/g-C3N4 hybrid photocatalysts. Appl. Catal. B-Environ. 2014, 147, 940–946. [Google Scholar] [CrossRef]
  64. Yang, J.; Wu, X.; Mei, Z.; Zhou, S.; Su, Y.; Wang, G. CVD Assisted Synthesis of Macro/Mesoporous TiO2/g-C3N4 S-Scheme Heterojunction for Enhanced Photocatalytic Hydrogen. Evol. Adv. Sustain. Syst. 2022, 6, 220005. [Google Scholar]
  65. Zhu, H.; Yang, X.; Zhang, M.; Li, Q.; Yang, J. Construction of 2D/2D TiO2/g-C3N4 nanosheet heterostructures with improved photocatalytic activity. Mater. Res. Bull. 2020, 125, 110765. [Google Scholar] [CrossRef]
  66. Gong, R.; Yang, L.; Qiu, S.; Chen, W.-T.; Wang, Q.; Xie, J.; Waterhouse, G.I.N.; Xu, J. A Nitrogen-Rich Covalent Triazine Framework as a Photocatalyst for Hydrogen Production. Adv. Polym. Tech. 2020, 2020, 7819049. [Google Scholar] [CrossRef]
  67. Xiao, M.; Jiao, Y.; Luo, B.; Wang, S.; Chen, P.; Lyu, M.; Du, A.; Wang, L. Understanding the roles of carbon in carbon/g-C3N4 based photocatalysts for H2 evolution. Nano Res. 2021. [Google Scholar] [CrossRef]
Figure 1. The scheme diagram of electrospinning process of S/CdO@In2O3 hybrid nanofibers during the calcinations process.
Nanomaterials 13 00401 g001
Figure 2. (a) XRD patterns, (b) FTIR spectra, and (c) Raman spectra of synthesized samples.
Nanomaterials 13 00401 g002
Figure 3. SEM images of S/CdO@In2O3-25 nanofibers (a) before calcination and (b) after calcination, (ce) the corresponding TEM and HRTEM images and (fi) EDS elemental mappings.
Nanomaterials 13 00401 g003
Figure 4. The XPS spectra of (a) Cd 3d, (b) In 3d, (c) O 1s, and (d) S 2p in the obtained samples.
Nanomaterials 13 00401 g004
Figure 5. (a) H2 evolution rates of the as-synthesized photocatalysts and (b) recycling tests of photocatalytic H2 evolution rates over S/CdO@In2O3-25.
Nanomaterials 13 00401 g005
Figure 6. (a) UV/Vis diffuse reflectance spectra of samples, (b) the corresponding Tauc plots, (c) PL spectra, (d) transient photocurrent responses, (e) EIS spectra, (f) H2 adsorption energies determined by the DFT calculations of the as-prepared samples, and (g) their optimized H* atom adsorbed geometrical structures.
Nanomaterials 13 00401 g006
Figure 7. Mott–Schottky plots of (a) S/CdO, (b) S/In2O3, (c) XPS energy band structure, and possible charge transfer and photocatalytic mechanisms of the as-prepared S/CdO@In2O3-25 hybrid.
Nanomaterials 13 00401 g007
Disclaimer/Publisher’s Note: The statements, opinions and data contained in all publications are solely those of the individual author(s) and contributor(s) and not of MDPI and/or the editor(s). MDPI and/or the editor(s) disclaim responsibility for any injury to people or property resulting from any ideas, methods, instructions or products referred to in the content.

