Article

Optimization of Ciprofloxacin Adsorption on Clinoptilolite-Based Adsorbents Using Response Surface Methodology

1
Faculty of Technology and Metallurgy, University of Belgrade, Karnegijeva 4, 11120 Belgrade, Serbia
2
Faculty of Mechanical Engineering and Naval Architecture, University of Zagreb, Ivana Lučića 5, 10000 Zagreb, Croatia
3
Faculty of Chemical Engineering and Technology, University of Zagreb, Marulićev Trg 19, 10000 Zagreb, Croatia
4
Ruđer Bošković Institute, Bijenička Cesta 54, 10000 Zagreb, Croatia
*
Authors to whom correspondence should be addressed.
Nanomaterials 2023, 13(4), 740; https://doi.org/10.3390/nano13040740
Submission received: 27 January 2023 / Revised: 11 February 2023 / Accepted: 13 February 2023 / Published: 15 February 2023

Abstract

:
The adsorption of the antibiotic ciprofloxacin (CIP) from water solution by natural zeolite–clinoptilolite (CLI), magnetic clinoptilolite (MAG-CLI), and graphene oxide coated magnetic clinoptilolite (GO-MAG-CLI) was investigated. The novel approach of an environmentally friendly and cost-effective microwave-assisted method was applied for the magnetic composite synthesis. Detailed characterization of the prepared composites was achieved. In order to investigate the effect of the initial CIP concentration, pH, temperature, contact time, and type of adsorbent on the adsorption efficiency of CIP, and to obtain the optimal conditions for CIP removal, the response surface methodology central composite factorial design (RSM-CCF) was applied. The results obtained by the RSM-CCF showed that among the studied adsorbents, GO-MAG-CLI had the highest adsorption capacity for CIP, achieved for the initial concentration of 48.47 mg dm−3 at a pH of 5 and 24.78 °C after 19.20 min of contact time. The adsorption kinetics studied for the initial CIP concentration range of 15–50 mg dm−3 followed Lagergren’s pseudo-second-order model, and the Langmuir isotherm was the most suitable one to describe the CIP adsorption onto GO-MAG-CLI.

1. Introduction

Since Flaming’s discovery in 1928, antibiotics have been widely used as a pharmaceutical agent in both human and veterinary medicine, but also as a growth promotor in livestock [1]. Although they have saved a million lives, the uncontrolled production and consumption of antibiotics is becoming one of the major environmental issues nowadays, with already noticeable consequences for human health. Only a small portion of consumed antibiotic substances are adsorbed in human or animal bodies, with most of the substances being discharged unmetabolized into natural waters through untreated sewage and wastewater streams [2,3]. Elevated concentrations of antibiotics in the environment, in addition to a toxicological effect on non-target organisms, lead to the development of antibiotic-resistant bacteria, which is considered one of the biggest threats to global health today [4].
Ciprofloxacin (CIP) is one of the widely applied second-generation fluoroquinolone antibiotics. It has the most potent effect against Gram-negative bacilli bacteria but is also effective against some Gram-positive ones [5]. Due to the extensive use of fluoroquinolone antibiotics, the detected concentrations of CIP in surface waters range from ng to mg dm−3 [6]. The main characteristic of the CIP molecule is its zwitterionic nature, with two pKa values at 5.90 ± 0.15 and 8.89 ± 0.11 for the carboxyl and amine groups, respectively [7,8]. This strong pH dependence of the CIP molecule’s charge influences its removal from water media.
Among different methods that have been investigated and used in water treatment, adsorption has proved to be a promising one for the removal of antibiotics, since it is a relatively simple and inexpensive technique that is insensitive to the antibiotics’ toxicity [9]. A keen interest in the field of adsorption exists for improved and advanced low-cost adsorbents with large surface areas and high adsorption capacities. Therefore, various adsorbents have been investigated for the removal of CIP from water, such as metal oxide nanoparticles [10,11], carbon-based adsorbents [12,13], and naturally occurring minerals [14,15,16].
Natural zeolites stand out among the adsorbents due to their unique structural properties, thermal stability, and availability, which make them low-cost materials. Clinoptilolite (CLI) is the most abundant natural zeolite and is widely investigated in the field of water treatment [17]. The adsorption capacity of CLI for various types of pollutants can be ascribed not only to its unique structure but also to its tendency to be modified without significant structural changes. The modification of the CLI surface with different metal oxide nanoparticles could enhance its adsorption capacity for the specific types of pollutants by enlarging its active surface area [18,19,20]. In recent years, the synthesis and utilization of magnetic iron oxide nanoparticles such as magnetite (Fe3O4) and maghemite (γ-Fe2O3) in the removal of different inorganic and organic compounds from water media have been widely studied due to the nanoparticles’ nano-size, high surface area-to-volume ratio, and superparamagnetic properties [21,22,23]. The magnetic iron oxide nanoparticles themselves have been shown to be efficient in adsorbing CIP from water by forming a bridging-bidentate surface complex with iron oxide nanoparticles [6,11]. Thus, the coating of CLI with magnetic nanoparticles (MAG-CLI) proved to be effective in the removal of metal cations [24,25] as well as pharmaceutical compounds [26] from water solutions. The removal efficiency of the antibiotic cephalexin from water onto CLI is increased by 65% after CLI coating with Fe3O4 nanoparticles [27], while the coating of natural zeolite with γ-Fe2O3 nanoparticles leads to high adsorption potential for different pharmaceutical compounds, with a removal efficiency of more than 95% within 10 min of adsorption [26]. In addition to the large active surface area, low toxicity, and simple synthesis method, iron oxide nanoparticles (MAG) possess magnetic properties that can induce magnetism to CLI and facilitate its separation from the liquid phase after the adsorption by applying the external magnetic field [21,28]. This could overcome the common adsorption problem of adsorbent separation.
Another candidate for the improvement of CLI adsorption properties is graphene oxide (GO)—a single monomolecular layer of graphite with various oxygen-containing functionalities, such as epoxy, carboxyl, carbonyl, and hydroxyl groups [29]. The main characteristic of GO layers is the large specific surface area of around 2400 m2 g−1 [30], which enables GO to be used as an efficient adsorbent for different organic pollutants, such as dyes [31], aromatic compounds [32], and antibiotics [33]. The loading of GO onto CLI leads to their bonding via electrostatic and hydrophobic interactions and hydrogen bonds, which can enlarge CLI’s surface area by ten times [29]. According to Chen et al., pure GO exhibits high adsorption capacity for CIP for the initial concentration range of 1–20 mg dm−3, and the adsorption was mainly controlled by the electrostatic attractions and H-bonding interactions [34]. Furthermore, the synergistic effect of magnetic nanoparticles and GO proved to be efficient in CIP removal through electrostatic and ππ electron interactions [35].
To model the adsorption process and to determine the optimal parameters within given criteria, the statistical approach of the response surface methodology (RSM) is commonly used. The basic purpose of the RSM is to model the process and optimize the parameters by lowering the number of experiments that need to be performed. The RSM has the potential to determine the effects of multiple factors and their interactions on one or more responses using fewer tests, while also obtaining higher accuracy [10,36]. The most common design used in the RSM is the central composite design (CCD), which is an extended factorial design with the ability for quadratic model evaluation [37].
This study presents a novel route for preparing a novel composite consisting of magnetic nanoparticles and GO particles in a clinoptilolite matrix (GO-MAG-CLI). For the route, we employed a relatively simple and cost-effective method of microwave-assisted synthesis in combination with ultrasonication. The coating of both magnetic iron oxide nanoparticles and graphene oxide onto CLI should improve CLI’s adsorption capacity, as well as facilitating composite separation from the liquid phase. The adsorption performances of GO-MAG-CLI were compared with those of pristine CLI and magnetic CLI (MAG-CLI) for CIP removal from aqueous solutions. The optimum operating conditions for the adsorption process providing the maximum adsorption capacity for CIP were determined using the CCD based on the RSM. Additionally, the detailed characterization of the prepared composites was performed, and the kinetic and isotherm studies were carried out to investigate the CIP adsorption mechanism.

2. Materials and Methods

2.1. Materials

The clinoptilolite-rich zeolitic tuff obtained from the Serbian deposit Slanci was used as a starting material in this study. The quantitative powder X-ray diffraction (PXRD) analysis and Rietveld refinement calculations [38] were performed to confirm the mineral identity of the zeolitic tuff. The zeolitic tuff was stated to be of >80 wt.% purity on clinoptilolite (CLI) with quartz (<7.5 wt.%) and feldspar (<13 wt.%) as the major satellite phases. The cation exchange capacity (CEC) of the CLI, which was measured using a standard procedure [39], was 162.2 mmol M +/100 g.
Prior to the composites’ synthesis and adsorption experiments, the CLI sample was sieved, washed with deionized water to remove impurities, and then dried in an oven at 105 °C overnight to a constant mass. The particle size range of 0.063–0.125 mm was used in the experiments, since previous studies showed the best adsorptive performance in that particle size range [40,41].
For the MAG-CLI preparation, iron (III) chloride hexahydrate (FeCl3·6H2O, 99%, AnalaR NORMAPUR® ACS, VWR Chemicals, Darmstadt, Germany) and iron (II) sulfate heptahydrate (FeSO4·7H2O, 98%, Alfa Aesar, Kandel, Germany) were used. A commercial graphene oxide water dispersion (4 mg cm−3, Graphenea, San Sepastián, Spain) was used for the coating of MAG-CLI. The studied pharmaceutical compound ciprofloxacin (CIP, 98%, Acros Organics, Waltham, MA, USA) was used as received.
A stock solution of CIP (50 mg dm−3) was prepared by dissolving a required amount of CIP in deionized water, which was kept at a temperature of around 4 °C. The stock solution was diluted with deionized water to obtain the desired concentrations (15–50 mg dm−3) used in the adsorption experiments.
All used chemicals were of analytical grade, and all experiments were carried out under controlled conditions. The adsorption experiments were performed in a thermostated laboratory incubator–shaker, where the temperature was kept constant to within ±0.7 °C; the samples were weighed to a four-digit accuracy, and the solution concentrations were also determined to a four-digit accuracy. Deionized water was used in all experiments.

2.2. Microwave-Assisted Synthesis of Magnetic Nanoparticles (MAG)

The magnetic nanoparticles (MAG) were prepared according to the already reported literature procedure [42]. Aqueous solutions of two iron salts—FeCl3·6H2O (0.4 M) and FeSO4·7H2O (0.2 M)—in a molar ratio of 2:1 were mixed properly. Subsequently, the water solution of NaOH (2 M) was added to the iron salt solution, and the solution was microwave (MW)-irradiated (Microwave Reaction System SOLV, Multiwave PRO, Anton-Paar GmbH, Graz, Austria). The obtained black precipitate (MAG) was separated from the liquid phase, washed several times with deionized water, and dried until reaching a constant mass.

2.3. Microwave-Assisted Synthesis of Magnetic Clinoptilolite (MAG-CLI)

The magnetic clinoptilolite (MAG-CLI) was prepared following the slightly modified procedure described by Iskandar et al. [43]. Briefly, the aqueous solutions of FeCl3·6H2O (0.4 M) and FeSO4·7H2O (0.2 M) in the molar ratio of 1:2 were mixed properly with the CLI water suspension at room temperature. Subsequently, the aqueous solution of NaOH (2 M) was added dropwise to the prepared suspension until the pH reached 10. The formed black suspension was transferred to four Teflon vessels and MW-irradiated (Microwave Reaction System SOLV, Multiwave PRO, Anton-Paar GmbH, Graz, Austria) at 200 °C for 5 min under high stirring. The inner pressure and temperature were monitored during the synthesis process. The synthesized dark brown precipitate after the MW-assisted co-precipitation reaction was separated from the suspension by centrifugation and washed several times with deionized water until showing a negative reaction to the chloride ions. Finally, the obtained MAG-CLI was dried in the oven at 100 °C until reaching a constant mass. The sample was left to cool to room temperature before its further use.

2.4. Coating of MAG-CLI with Graphene Oxide (GO-MAG-CLI)

A graphene oxide (GO) water dispersion (3.6 cm3) and 11.4 cm3 of ethanol were mixed and ultrasonicated for 30 min for the expanded interlayer GO structure exfoliation [44]. Then, the MAG-CLI powder was added to the GO dispersion at a GO/MAG-CLI ratio (w/w) of 1:2. The suspension was subsequently ultrasonicated (Giorgio Bormac, DU-32) for 30 min (40 kHz, 120 W), stirred for 30 min several times, and then placed in an oven at 80 °C overnight.

2.5. Adsorbents’ Characterization

An analysis of the mineral phases present in the samples was performed using the powder X-ray diffraction method (PXRD). The PXRD patterns were obtained using a D8 Advance (Bruker, Billerica, MA, USA) X-ray diffractometer with CuKα radiation with an acceleration of 40 kV and a 25 mA current in the Bragg–Brentano focusing geometry. The analysis was conducted in step-scan mode with a 0.02° 2θ step, in the 2θ range of 5–65°, at 0.6 s per step. The quantitative analysis of the obtained PXRD diffractograms was performed using the Crystal Impact Match! software package.
To gain insight into the nanoparticles’ morphology, a thermal field-emission scanning electron microscope (FE-SEM) (JSM-7000F, Jeol Ltd., Tokyo, Japan) was used.
Room temperature Mössbauer spectra were recorded using a classic transmission spectrometer using a WissEl configuration (Wissenschaftliche Elektronik GmbH, Starnberg, Germany) with a 57Co-Rh gamma Mössbauer source. The recorded spectra were relatively calibrated to the α-Fe reference sample, and the obtained data were processed using the MossWinn 4.0 program.
Raman measurements were performed via confocal micro-Raman spectroscopy using a Horiba Jobin Yvone T64000 (Kyoto, Japan) equipped with a solid-state laser with a wavelength of 532.5 nm and a 50× magnification large working distance objective in the range of 300–3500 cm−1.
The BET surface area and porosity characteristics were determined from the nitrogen adsorption–desorption isotherms at –196 °C using an ASAP 2000 apparatus (Micromeritics Corporation, Norcross, GA, USA). Prior to the analysis, the samples were degassed at 150 °C for 10 h. The specific surface area was calculated using the Brunauer–Emmett–Teller (BET) method, while the total pore volume (Vtot) was determined from the desorption isotherm at p/p0 = 0.998. The pore size distribution of the sample was determined by the Barret–Joyner–Halenda (BJH) model from the data of the adsorption branch of the nitrogen isotherms.
X-ray photoelectron spectroscopy (XPS) measurements were carried out on the SPECS system under the UHV conditions, with the typical chamber pressure in the range of 10 to 7 Pa. The XPS instrument was equipped with the Phoibos MCD 100 electron analyzer and the monochromatized X-ray source of 1486.74 eV (Al line). The survey XPS spectra were recorded with a pass energy of 50 eV, while the pass energy of 20 eV was used for the photoemission measurements around the atomic core levels (O 1s, C 1s, Si 2p, Al 2p, Ca 2p, K 2p, Fe 2p). All spectra were calibrated according to the C 1s peak, placed at the binding energy of 285.0 eV.
The thermal behavior of the samples was analyzed using the simultaneous differential thermal analysis and thermos-gravimetric analysis (DTA/TGA) apparatus Netzsch STA 409C (Selb, Germany). The samples were heated from room temperature to 800 °C at a heating rate of 10 °C min−1 in synthetic air with a flow rate of 30 cm3 min−1, while corundum was used as a reference.
The zeta potentials were measured using a Zetasizer Ultra (Malvern Panalytical, Malvern, UK). In short, 0.1 g of sample was suspended in 100 cm3 of deionized water and ultrasonicated for 20 min. The pH of the suspension was then adjusted in the range of 2 to 12 using HCl or NaOH (0.1 mol dm−3). Before each measurement, the suspensions were ultrasonically treated for 30 s. The suspensions’ pH values were adjusted using a Mettler Toledo (Columbus, OH, USA) digital pH meter.
The magnetic properties were measured using a LakeShore 8607 Series VSM (vibrating sample magnetometer; Lake Shore cryotronics, Westerville, OH, USA) at room temperature and with an applied magnetic field strength of 2 T.

2.6. CIP Adsorption Experiments

To study the CIP adsorption onto the CLI-based adsorbents, the batch method using 0.2 g of the adsorbent in 50 cm3 of CIP solution was used. The effect of the initial CIP concentration (15–50 mg dm−3), pH (5–9), temperature (10–25 °C), time (5–20 min), and adsorbent (CLI, MAG-CLI, GO-MAG-CLI) on the adsorption efficiency was investigated. The pH adjustment was performed using HCl or NaOH solutions (0.1 mol dm−3). The suspensions were shaken in a thermostatic orbital shaker–incubator (ES-20/80, Biosan, Riga, Latvia) at a rotation speed of 170 rpm for 5 to 60 min. The solid was separated from the suspension by vacuum filtration and then additionally filtered through a 0.22 μm nylon filter. The CIP concentration was measured in the filtrate using a standard procedure with a UV-Vis spectrometer (Spekol 2000, Analytic Jena, Jena, Germany) at 278 nm [45]. The amount of CIP adsorbed onto the adsorbent after time t (qt) was calculated using the following formula:
qt = (C0Ct)/m × V
where C0 (mg dm−3) is the initial CIP concentration, Ct (mg dm−3) is the CIP concentration after time t, V (dm3) is the volume of the CIP solution, and m (g) is the adsorbent mass.

2.7. Design of Experiment

The optimization of the CIP adsorption process onto CLI-based adsorbents was conducted using the Design Expert software (version 13). The purpose of the design and analysis of the experiment (DoE) is to obtain an empirical mathematical model, which will predict the outcome of a dependent variable apropos a group of independent variables. Furthermore, by applying the DoE, the significance of each independent variable and its combination with the outcome can be quantified.
The results of the adsorption experiments were obtained using a face-centered central composite design (CCF) with five independent variables (factors) varied across three levels (Table 1). The chosen response variable was the adsorbents’ capacity for CIP.
The number of experiments performed for the full factorial CCF design was calculated according to the equation N = 2k + 2k + nc, where k stands for the number of factors, 2k represents the number of factorial points, 2k is the axial points, while nc refers to the number of replicates at the center point.
A statistical analysis including an analysis of variance (ANOVA) and the prediction of regression coefficients, response surface, and contour plots was employed. The level of significance was 5%, which is a commonly used threshold to classify the statistical significance of the evaluated statistical properties of the model.

3. Results and Discussion

3.1. Characterization of Synthetized Adsorbents

To investigate the changes in CLI crystallinity after modifications, the PXRD analysis was performed (Figure 1). All diffractograms related to CLI-based composites displayed the peaks characteristic for the clinoptilolite lattice, which was identified by card no. 01-080-1557 from the PDF crystallographic base. The CLI crystal cell unit was found to be monoclinic with C2/m space groups. In the diffractogram of MAG-CLI, new peaks appeared indicating the presence of iron oxide particles (card no. 00-039-1346) with a cubic crystal cell unit [21,24]. Since Fe3O4 and γ-Fe2O3 have similar cubic spinel crystal structures and almost identical lattice parameters, it is difficult to distinguish them from one another based only on the PXRD peak positions. The quantitative analysis of the obtained XRD peaks of pure MAG and MAG-CLI was performed using the reference intensity ratio (RIR) method (Figures S1 and S2). The obtained results (Table 2) indicated that the synthesized magnetic particles contain a handful of various iron oxide phases. In the pure MAG particles, the content of Fe3O4 is only 10 wt.%, while γ-Fe2O3 presents the dominant phase in the sample. Additionally, as an iron oxide–hydroxide, goethite could be formed as a satellite phase in the MW-assisted co-precipitation of Fe3O4. It is weakly magnetic, so its presence in an MAG sample could affect the MAG’s magnetic properties [46]. On the other hand, the MW-assisted synthesis of magnetic CLI resulted in the precipitation of only γ-Fe2O3 on the CLI surface. Although the obtained result indicates the presence of γ-Fe2O3 in the MAG-CLI composite, it should be noted that there is a possibility of previous formation of Fe3O4, which then gradually converted to γ-Fe2O3 after exposure to air [23].
In the pattern of GO, a high-intensity diffraction peak was observed at 2θ = 11.50°, which is characteristic of GO layers [47].
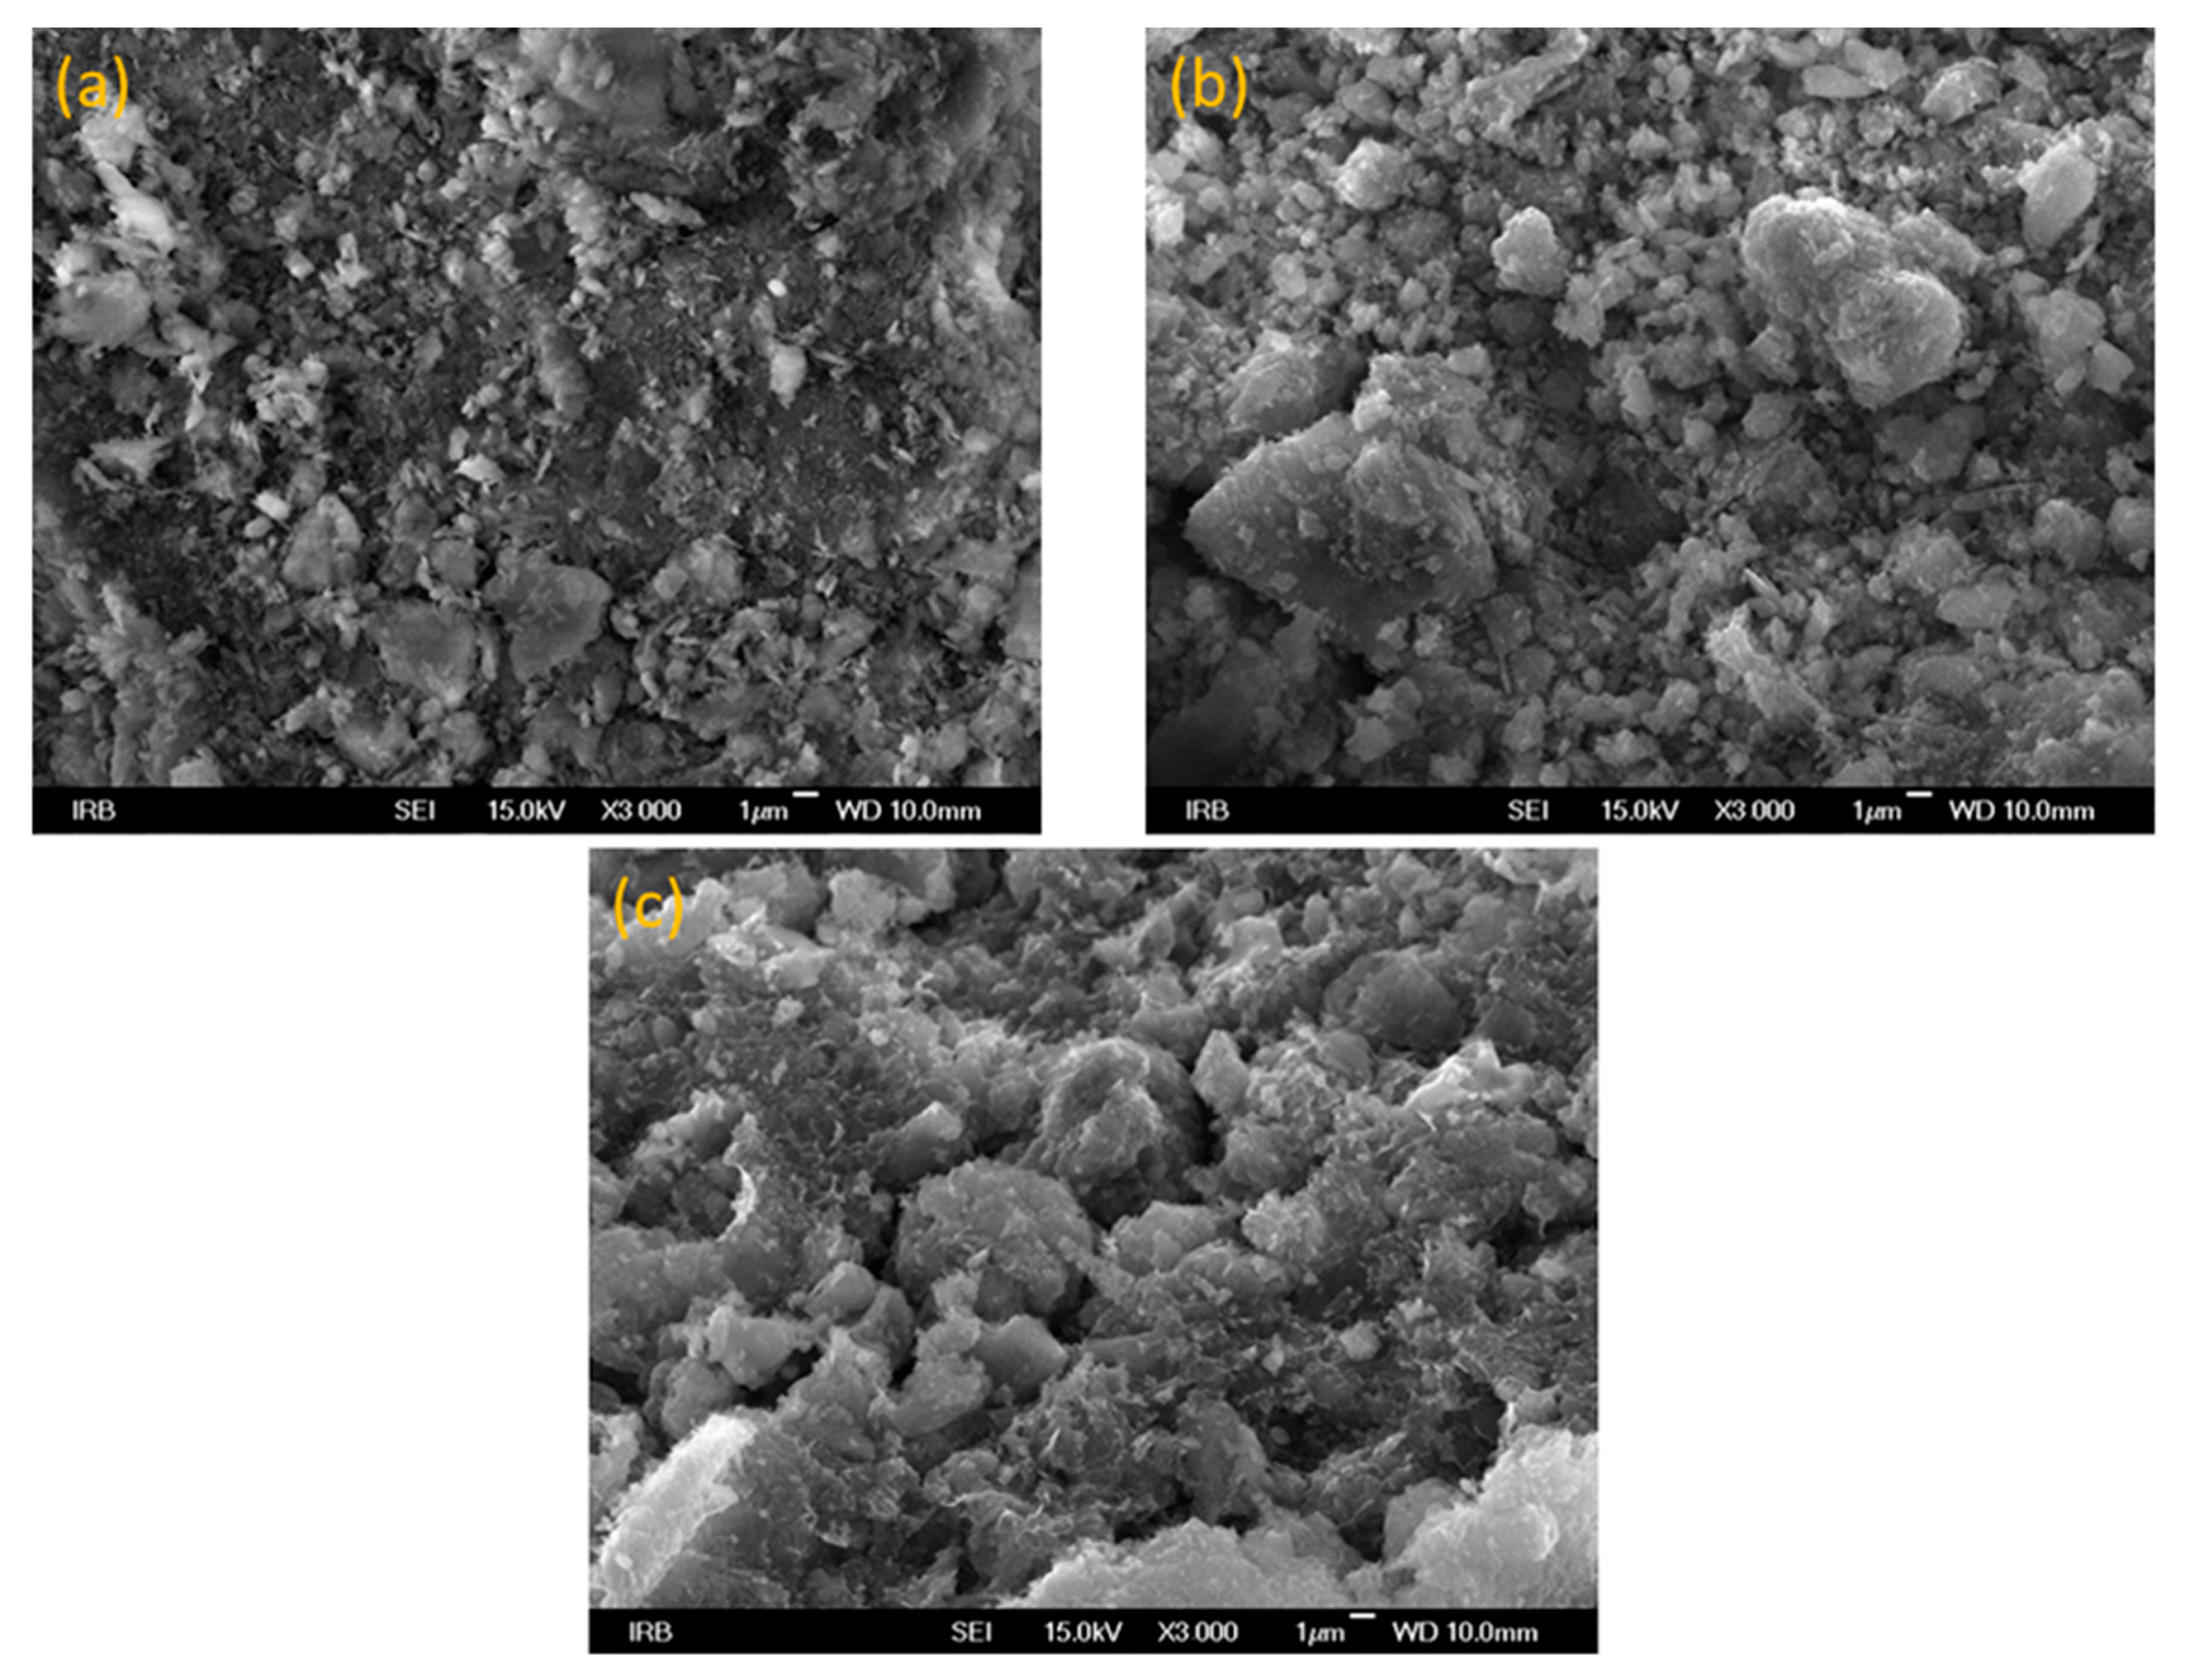
To investigate the surface morphologies of the prepared adsorbents and to determine the particle size, the FE-SEM analysis was performed. Figure 2 shows the SEM images of CLI (Figure 2a), MAG-CLI (Figure 2b), and GO-MAG-CLI (Figure 2c). As can be seen in Figure 2b, the formation of MAG particles (particle sizes estimated in the range of 20–40 nm) on the CLI surface did not affect the CLI structure. Additionally, the agglomeration of spherical magnetic nanoparticles due to their formation by co-precipitation on the CLI surface was observed. This behavior can be assigned to the high surface energy of the smaller-sized particles, which attract other particles to form particle agglomerates. The same finding was reported for the synthesis of Fe3O4-coated clinoptilolite using the standard co-precipitation method [19]. The addition of GO (Figure 2c) did not have a significant effect on the CLI’s surface morphology. The large GO sheets on GO-MAG-CLI were not evident due to the low GO loading.
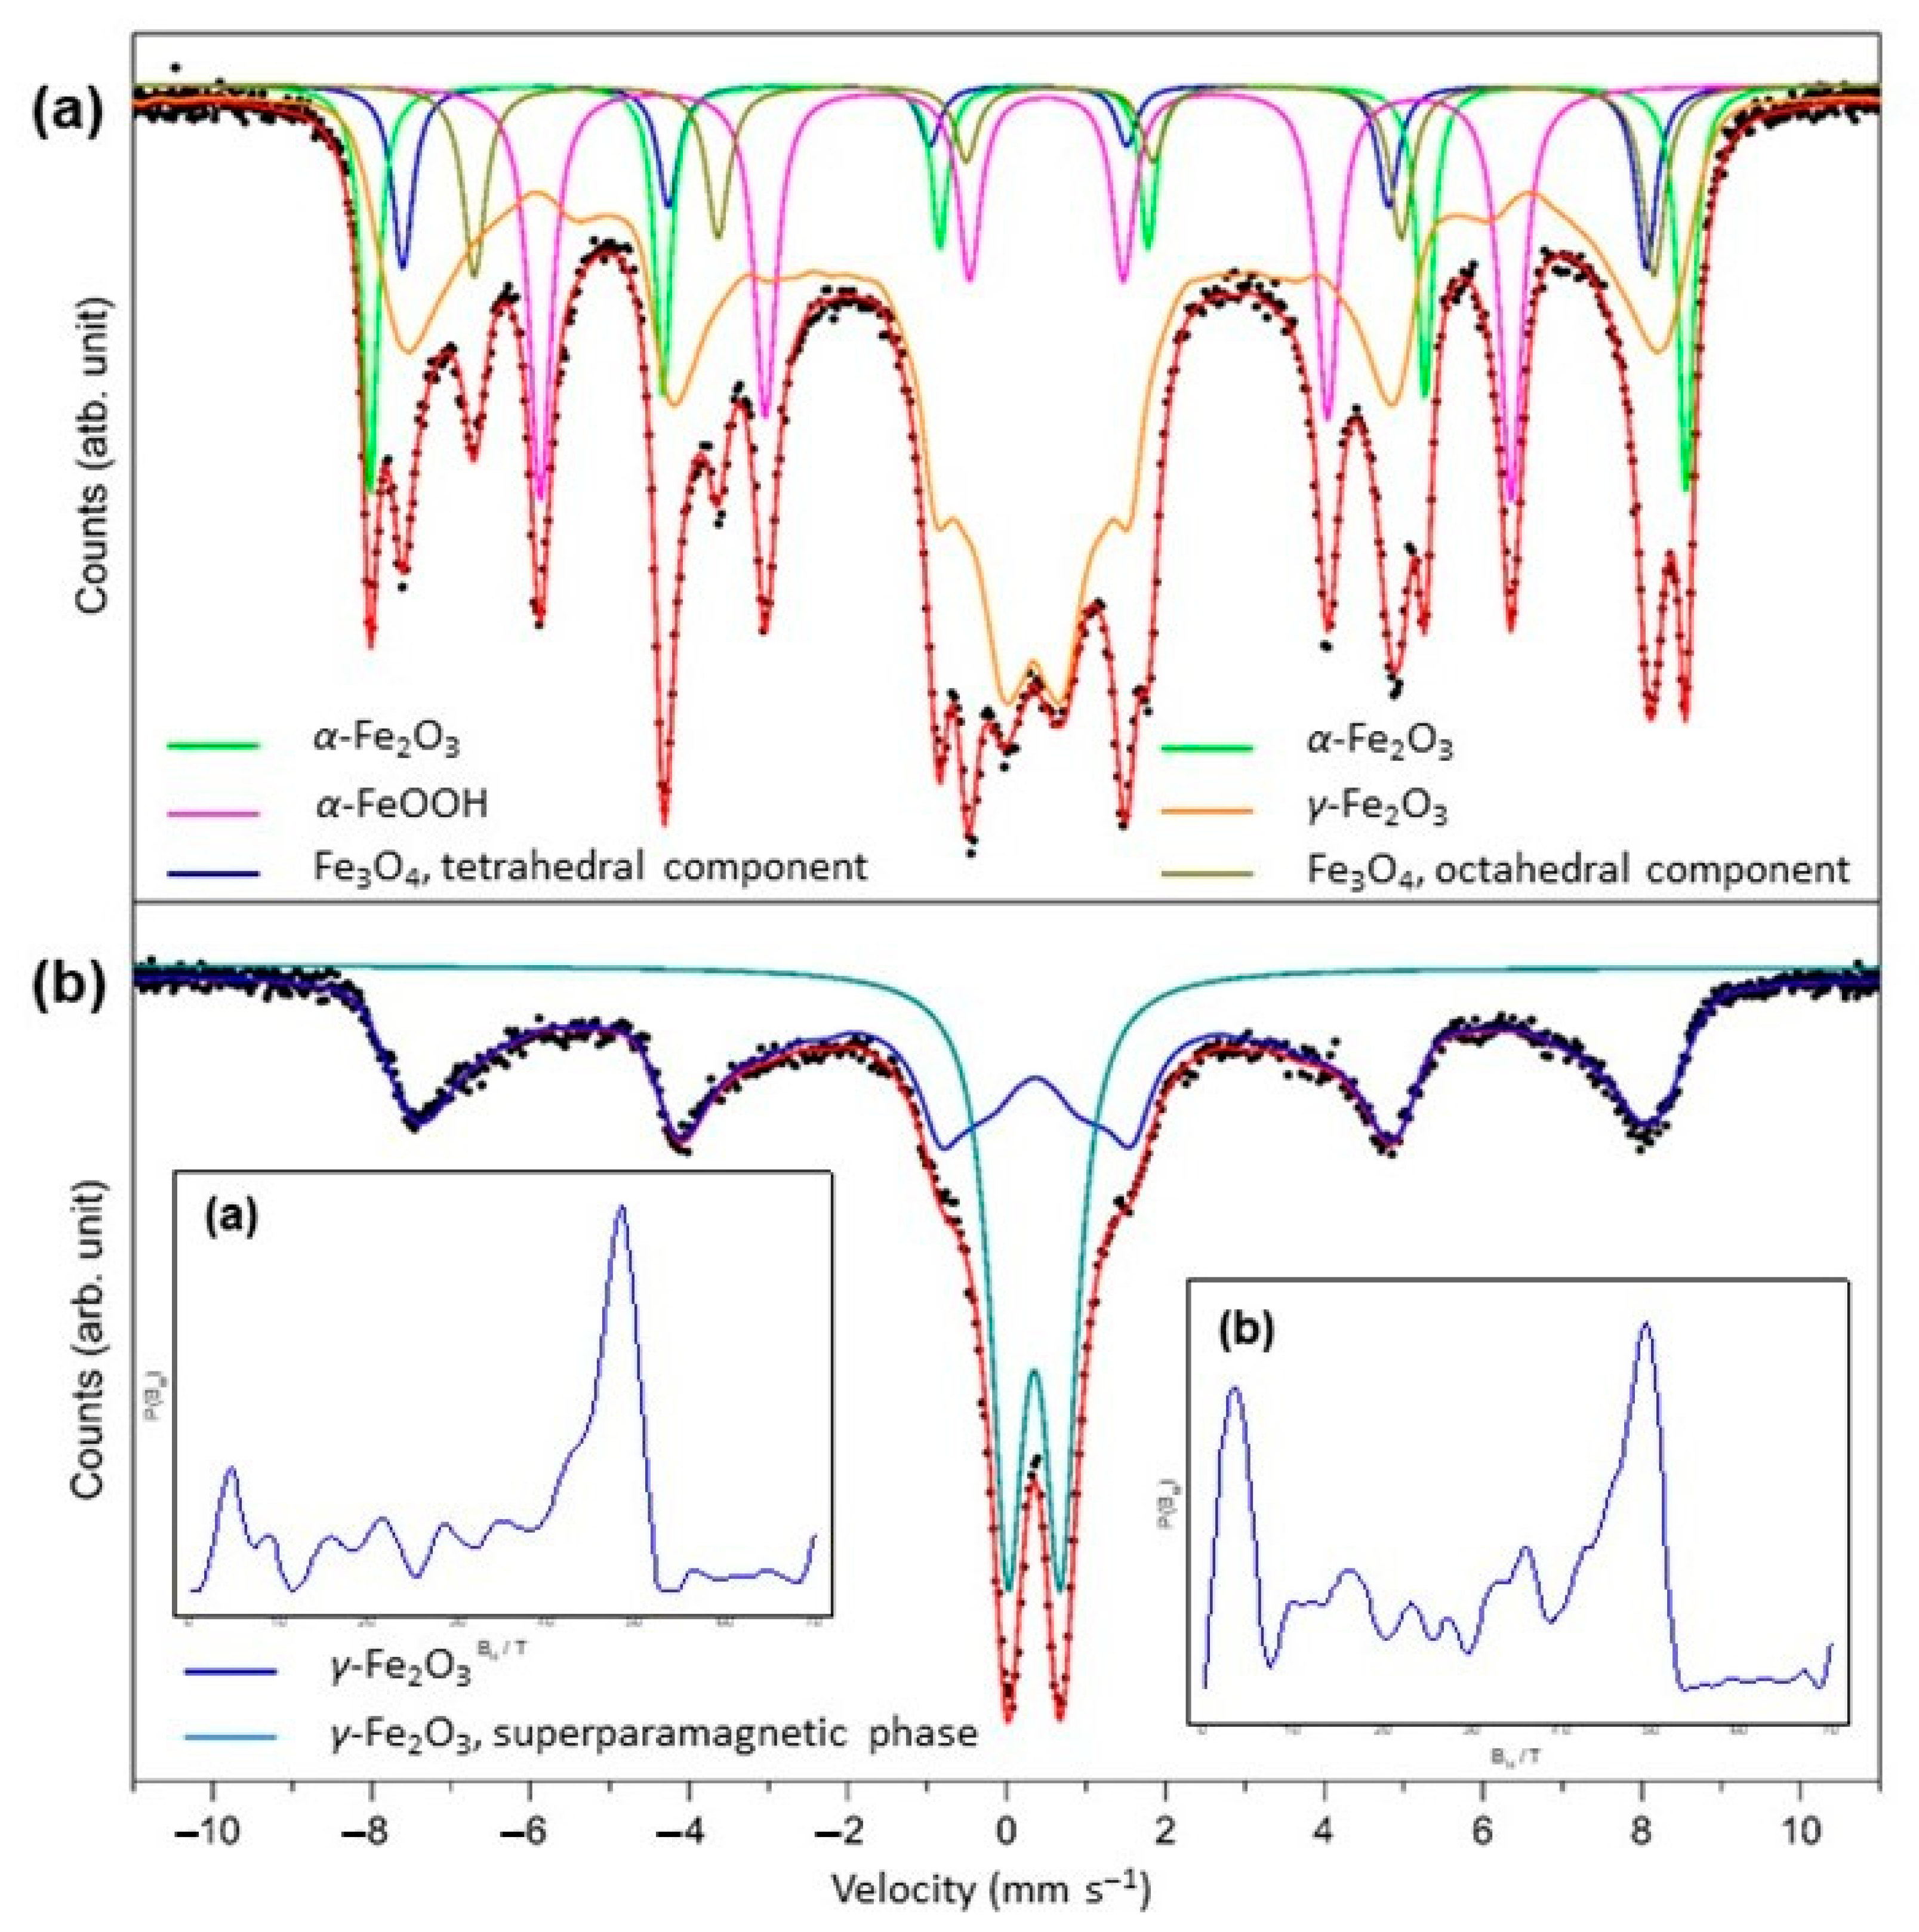
To evaluate the magnetic iron oxide phases in MAG and MAG-CLI samples, Mössbauer spectroscopy was performed. The 57Fe Mössbauer spectra of pure MAG and MAG-CLI samples are shown in Figure 3. The calculated Mössbauer parameters and phase identification results are summarized in Table 3 and Table 4.
The Mössbauer spectrum of magnetic iron oxide nanoparticles depends on the structural properties resulting from the synthesis method and the particle size. As was already determined by the PXRD analysis, the dominant iron oxide phase in MAG and MAG-CLI is γ-Fe2O3. The spectrum of MAG (Figure 3a) was fitted as a superposition of four sextets. The prominent central doublet in the spectrum of MAG nanoparticles is a consequence of the fast superparamagnetic relaxation of the smaller crystal domains of the γ-Fe2O3 phase in the sample. Furthermore, a broad sextet pattern described by the distribution of the hyperfine field, Bhf, can be attributed to the broad range of crystal domains sizes of the γ-Fe2O3 phase, above the superparamagnetic relaxation threshold [48].
The formation of γ-Fe2O3 usually accompanied the formation of Fe3O4 due to the slow magnetite oxidation by oxygen in the air [49], which results in the formation of the γ-Fe2O3 layer on the material’s surface. This impact becomes significant in nanoscale materials due to the large surface area, where it can be observed even in a single crystal. Moreover, the starting reaction mixture and the mechanism of the present MW-assisted synthesis allow the formation of a multiphase iron oxide material [50]. A sequence of several mechanisms can be explained by the fast nucleation in an aqueous system, the sudden formation of particles in the reaction mixture, as well as the very short synthesis time.
However, the coating of iron oxide nanoparticles on CLI resulted in the formation of only maghemite in two magnetic states. The primary nominal component of the MAG-CLI spectrum corresponds to a sextet, which indicates that these particles are larger than 20 nm and magnetic, while smaller particles in the superparamagnetic state below 10 nm correspond to a spectral doublet. According to the previous studies on the influence of ultrasound irradiation on the physicochemical properties of iron oxide particles [51,52], the applied sonication conditions should not affect the magnetic properties of iron oxide particles. Thus, it was assumed that the iron oxide phases present in MAG-CLI remained unchanged after the GO coating.
Raman spectroscopy based on band intensity and band surface measurements was applied for the GO detection in the prepared composite. The Raman spectra of the used commercial GO and GO-coated clinoptilolite (GO-CLI) are shown in Figure 4. The characteristic bands of the GO spectra at around 1350 cm−1 (band D) and 1600 cm−1 (band G) are the results of the sp3 structural disorder of the carbon atom and sp2 vibrations of the carbon atoms present in the hexagonal graphite structure, respectively [53]. These peaks, with an unchanged intensity, are also evident in the GO-CLI spectrum, which indicates the presence of GO in the CLI structure.
The specific surface area (SBET) and total pore volume (Vtot) of each adsorbent are summarized in Table 5. The SBET of CLI increased with its transformations. Compared to the pristine CLI, the addition of iron oxide doubled the CLI surface area due to the increase in a number of active sites available for adsorption. Similar results have already been obtained for a natural zeolite coating with magnetite nanoparticles [19,23]. On the other hand, the increase in the CLI-specific surface area after the GO coating was lower than after coating it with iron oxide, but in accordance with the literature data previously reported for the GO nanosheets grafted to natural CLI [54]. Furthermore, the synergetic effect of both iron oxide nanoparticles and GO led to an increase in CLI SBET three times. This increase could be ascribed to the large surface area of the coated materials (MAG~80 m2 g−1; GO~400 m2 g−1) [54,55]. The same trend was observed for the Vtot.
The N2 adsorption/desorption isotherms and pore size distribution (PSD) are given in Figure 5. Based on the IUPAC classification, all samples show type IV adsorption/desorption isotherms, which is typical for clinoptilolite’s structure with both micropores (as a result of the lattice’s structural features) and mesopores formed by the zeolite modification (Figure 5a). The presence of a type H3 hysteresis loop in the p/p0 range of 0.5–1 for all samples indicates that the zeolitic tuffs are rich in clinoptilolite and can be ascribed to multilayer adsorption and capillary condensation, either in mesopores of impurities (feldspar, quartz, etc.) or in the space between zeolite crystallites [56]. Moreover, the PSD of the samples differ mutually (Figure 5b). The differences can be explained by the formation of an additional secondary pore structure during the formation of the iron oxide nanoparticles and GO coating at the clinoptilolite surface [57].
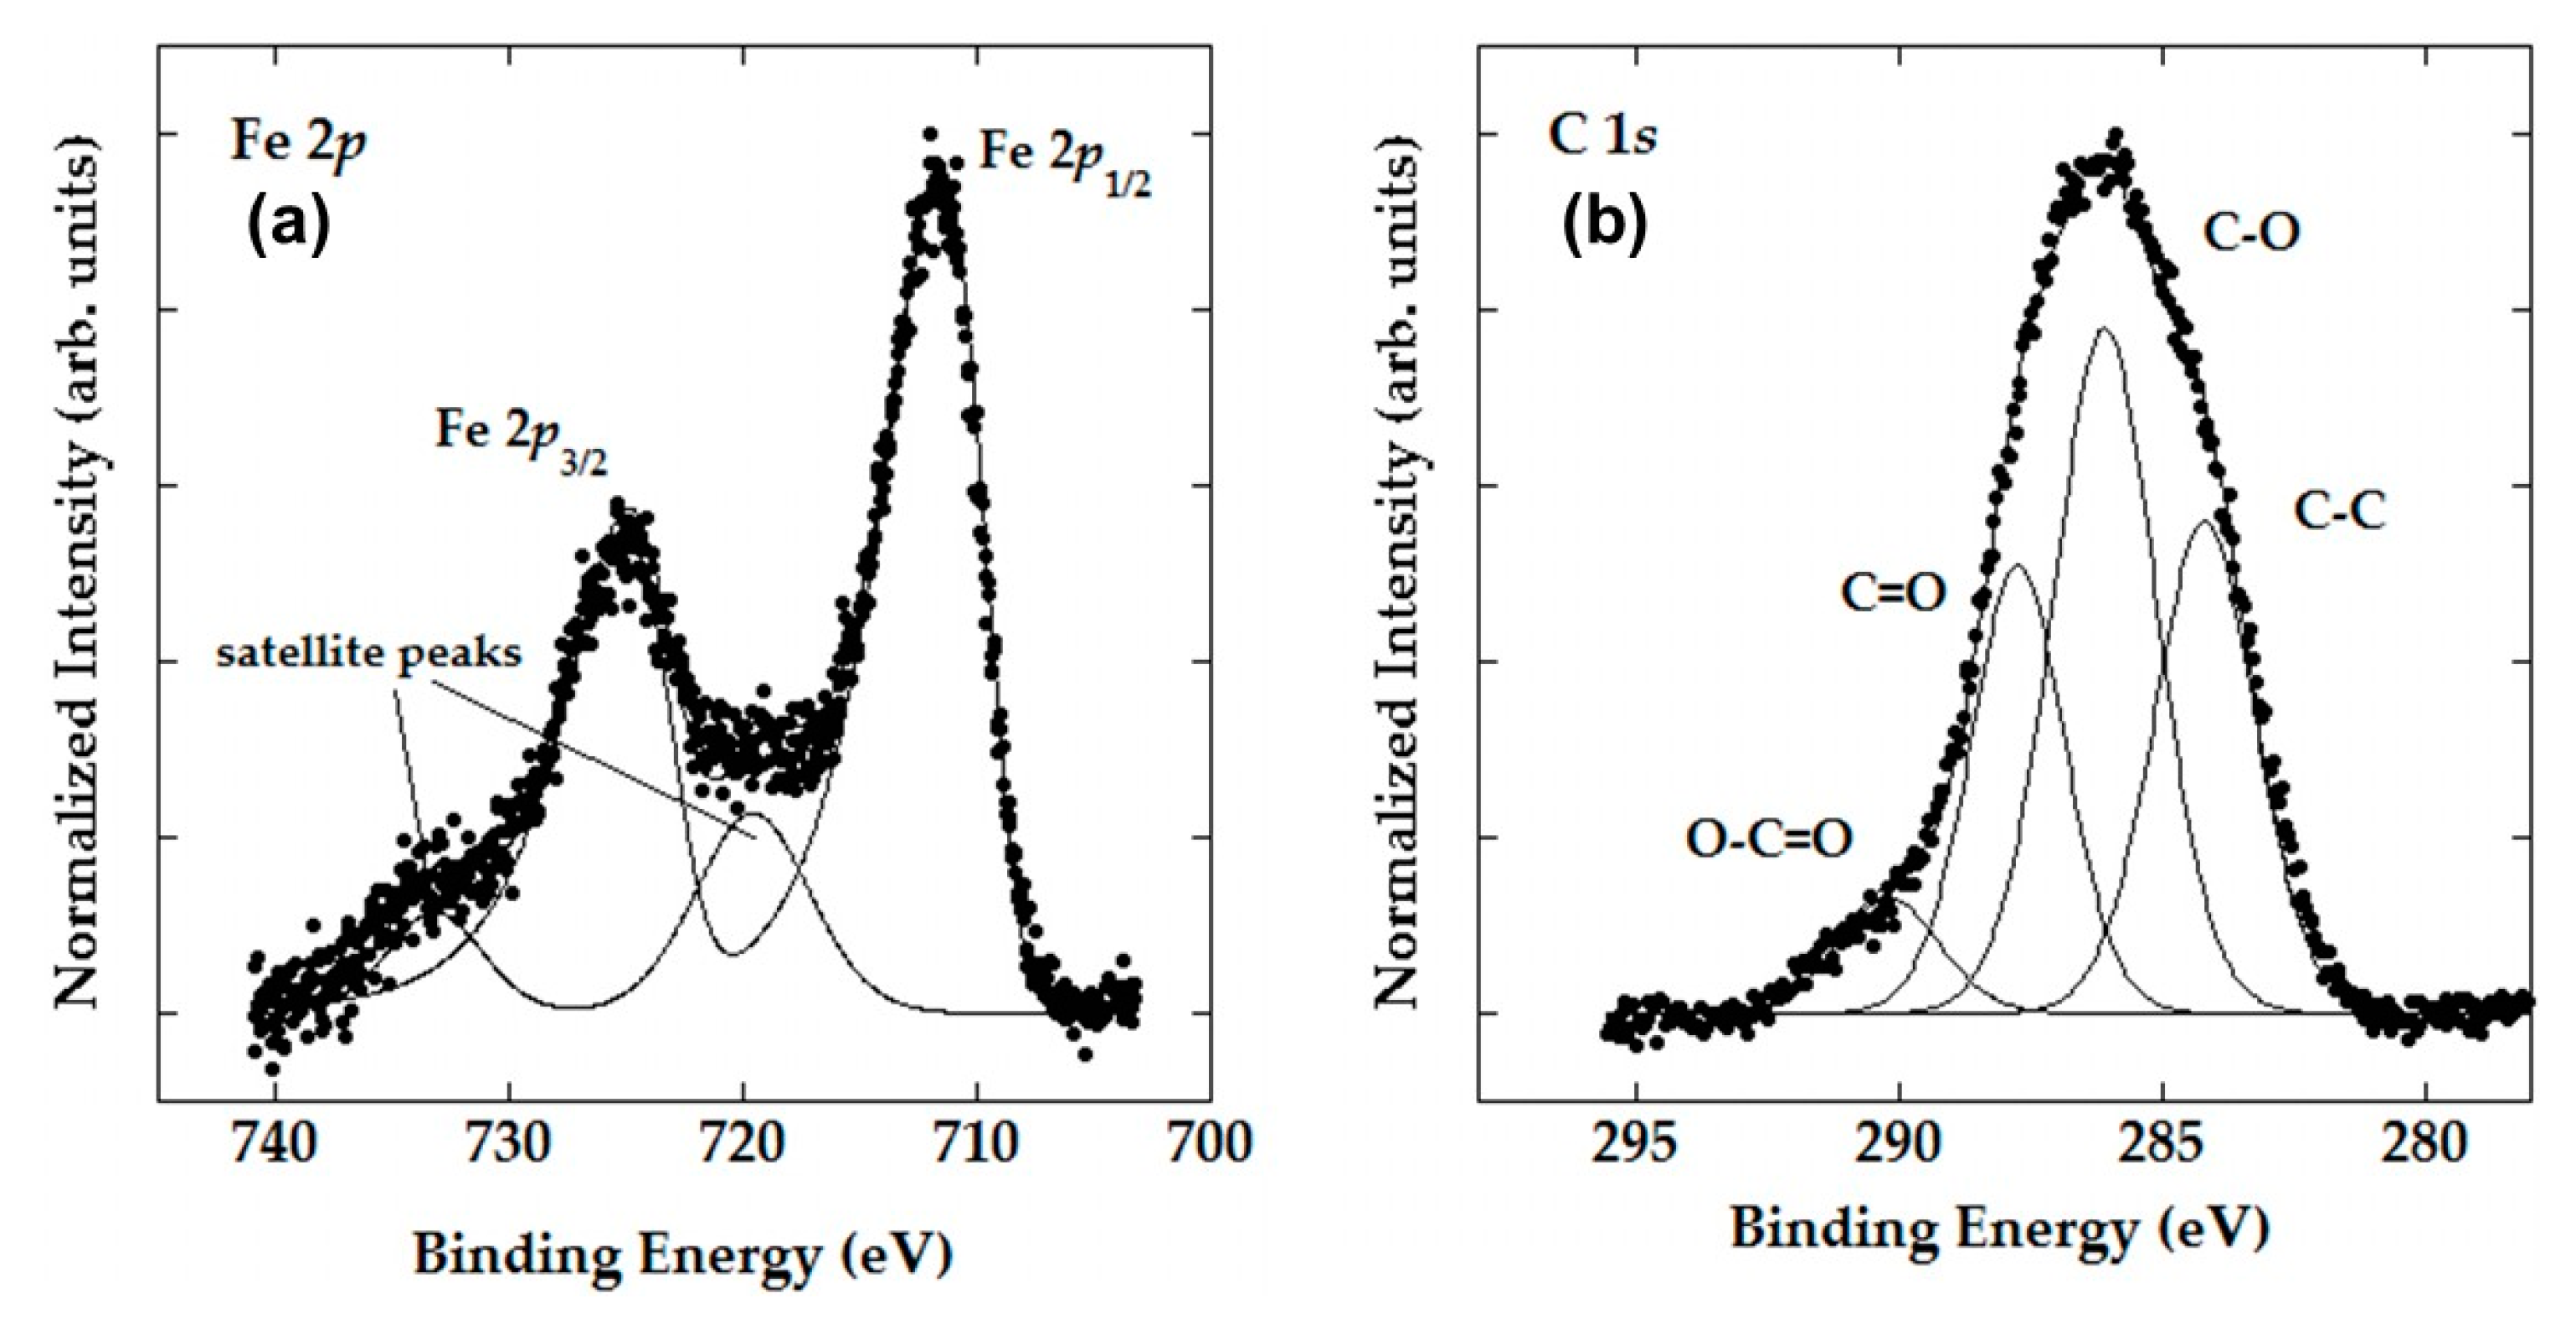
To gain a better insight into the surface properties of the prepared CLI-based adsorbents, an XPS analysis was performed. The high-resolution spectra of the Fe 2p and C 1s regions obtained using XPS measurements for MAG-CLI and GO-MAG-CLI, respectively, are shown in Figure 6. The results indicate that the iron is present in the Fe3+ oxidative state [35,58]. This is in accordance with the obtained results for the Mössbauer spectroscopy. The deconvoluted C 1s peaks in Figure 6b show peak binding energies of 284.8, 286.2, 288.2, and 290.1 eV, which correspond to C–C, C–O, C=O, and O–C=O bonds, respectively, indicating the presence of oxidized graphene sheets [59].
Table 6 gives the relative elemental composition of CLI and the synthesized composites, which was determined based on the studied elements’ XPS peak intensities. During the CLI’s modification with MAG, the content of exchangeable cations (K and Ca) negligibly decreased while the content of Fe increased. The Fe content increase was significantly higher than the decrease in exchangeable cations content, so it can be concluded that the conversion of CLI to MAG-CLI occurs not only through an ion exchange reaction but also through Fe species precipitation on the CLI surface. The carbon present in the CLI and MAG-CLI spectra (Figure S3) came from the contamination layer caused by sample handling in the air. The binding energy detected in the carbon C 1s XPS spectra of CLI was 284.7 eV, which can be assigned to C–C and C–H bonds [60].
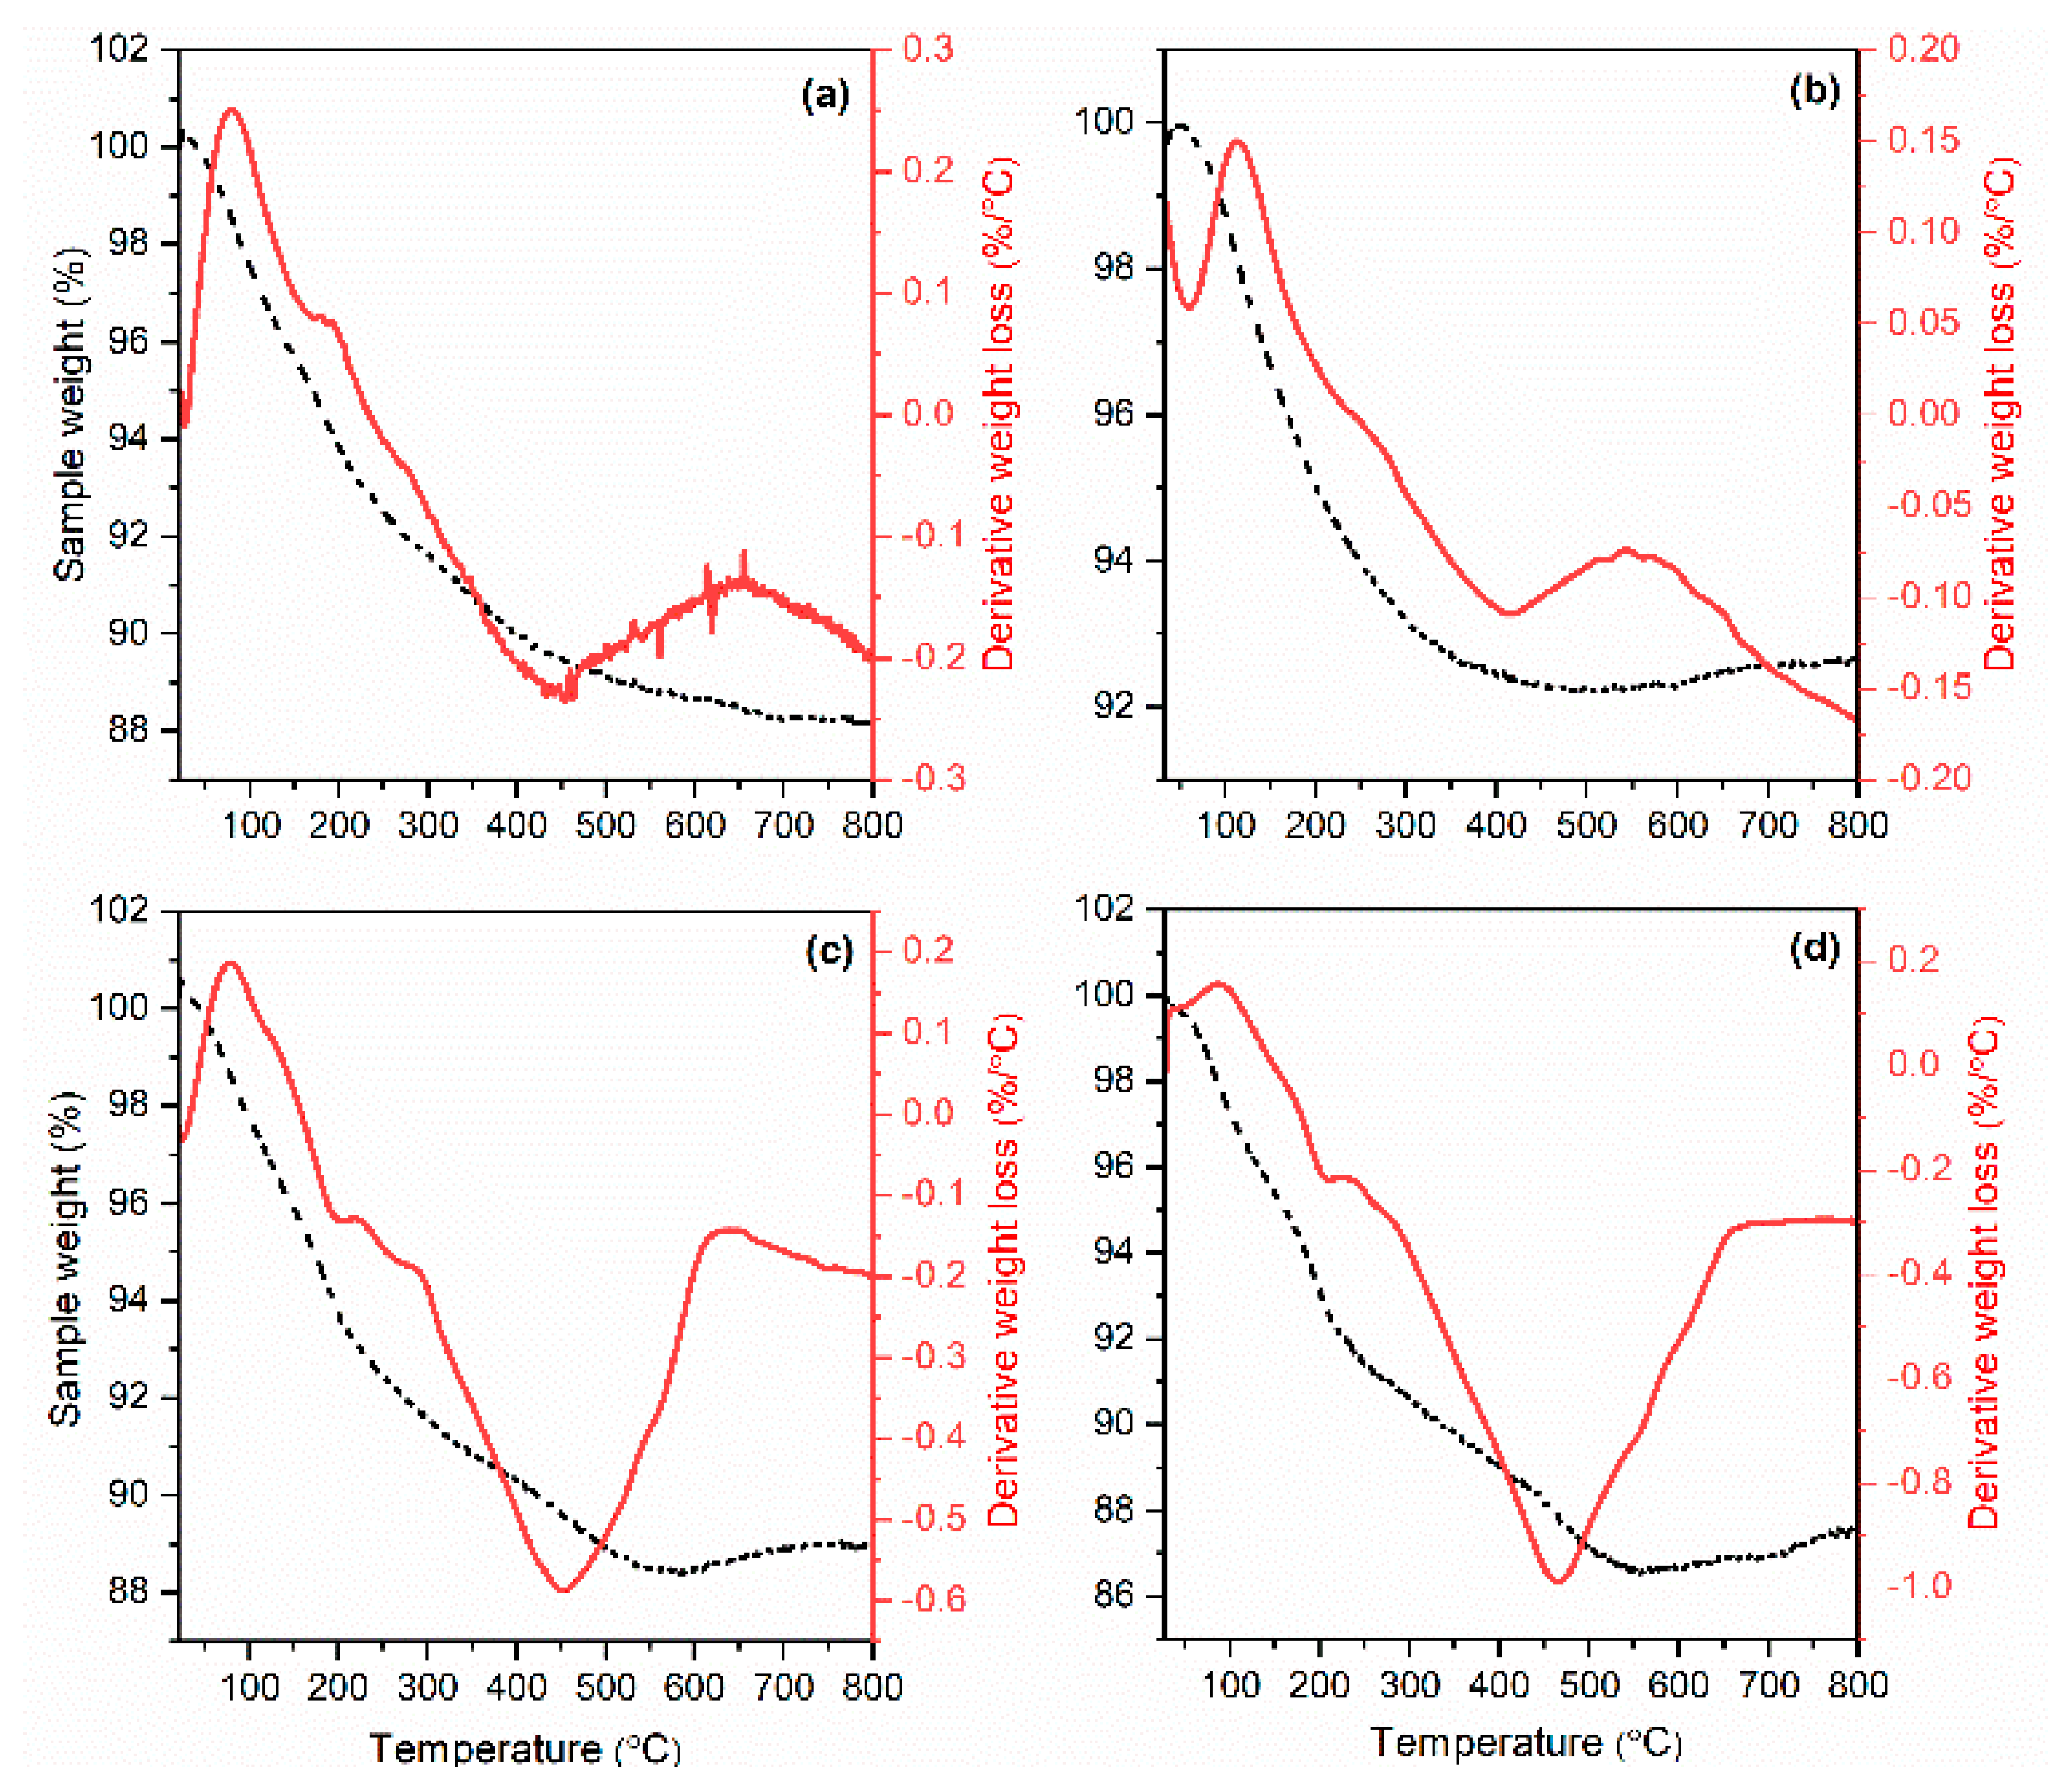
The thermograms of CLI, MAG-CLI, and GO-MAG-CLI (Figure 7) show rapid weight loss (5–10 wt.%) in the temperature range from 25 up to 300 °C, which could be attributed to the loss of the water located mostly in the CLI cavities [61]. Generally, the endothermic peak in that range is produced by the water molecule adsorption phenomenon from the different cationic sites [62]. In the samples where GO is present, the first decomposition of unstable oxygen groups occurs at lower temperatures (below 200 °C), which overlap with the water loss. Afterwards, at around 200 °C, a small exothermic peak can be observed, which corresponds to the decomposition caused by the elimination of more stable oxygen functional groups. The third step of the weight loss occurs in a temperature range from 400 to 500 °C, which can be attributed to the combustion of the carbon skeleton of the GO [63,64]. The total weight loss results for all analyzed samples are similar, varying from 8 to 12 wt.%.
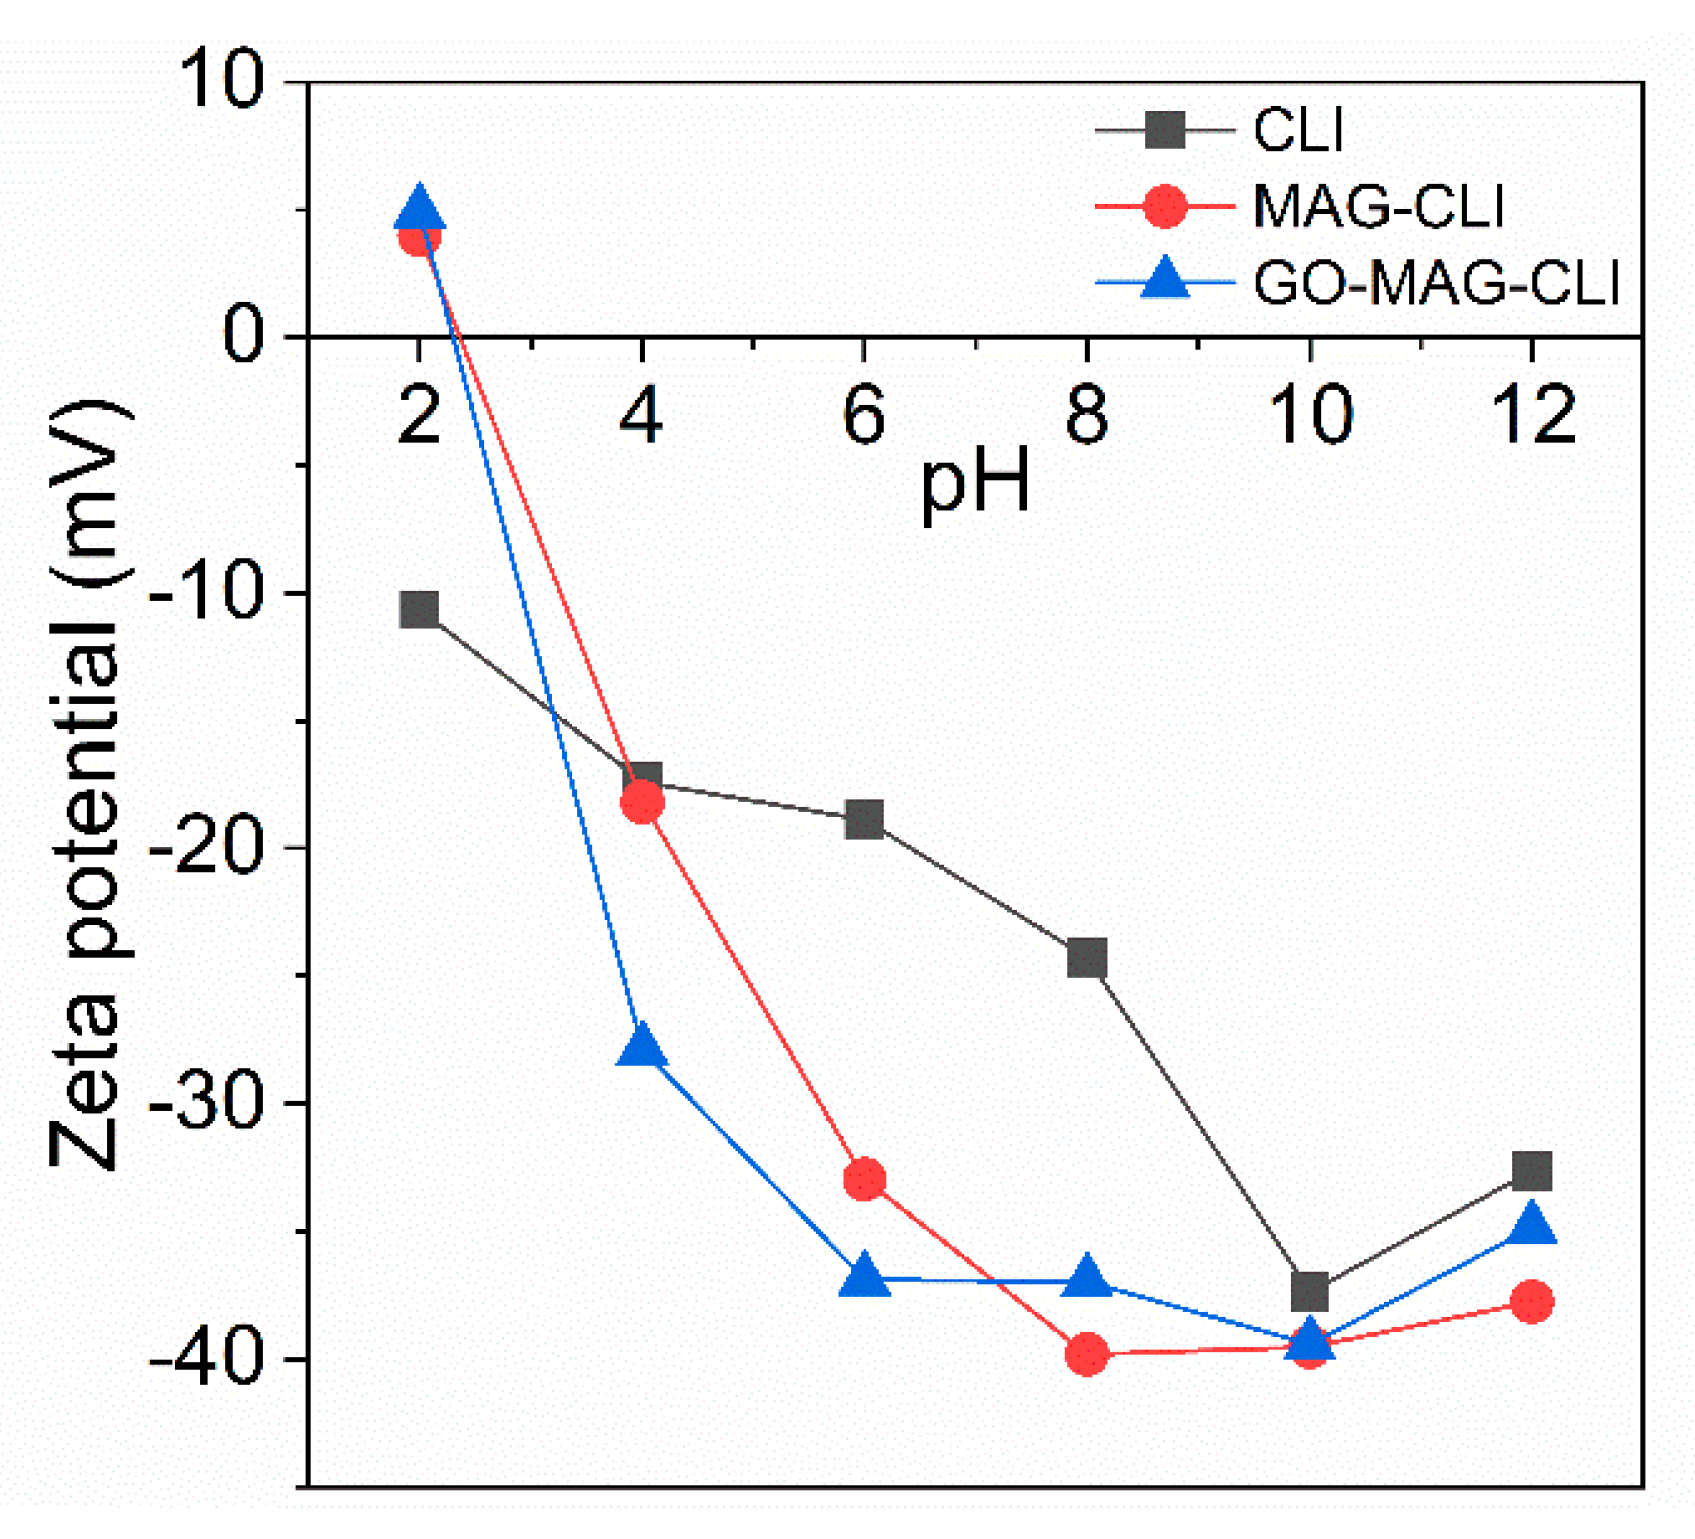
The graphs of the zeta potential as a function of pH (Figure 8) show that the zeta potential of CLI changed with modifications, although all three samples had a negatively charged surface across a wide range of pH values from 3 to 12. For MAG-CLI and GO-MAG-CLI, the point of zero charge (PZC) was at a pH = 2.4. The surface charge of GO-MAG-CLI was positive at a pH below PZC with the –OH and –COOH groups of GO in the form of –OH2+ and –COOH2+. At pH values higher than PZC, these groups were ionized and the GO-MAG-CLI surface was negatively charged. Due to the CIP zwitterionic nature, its adsorption on CLI-based composites is strongly pH-dependent. Thus, the GO-MAG-CLI has the highest adsorption ability for CIP in slightly acidic conditions (pH~5) due to the electrostatic attraction between the negatively charged adsorbent’s surface and the cationic form of the CIP molecule.
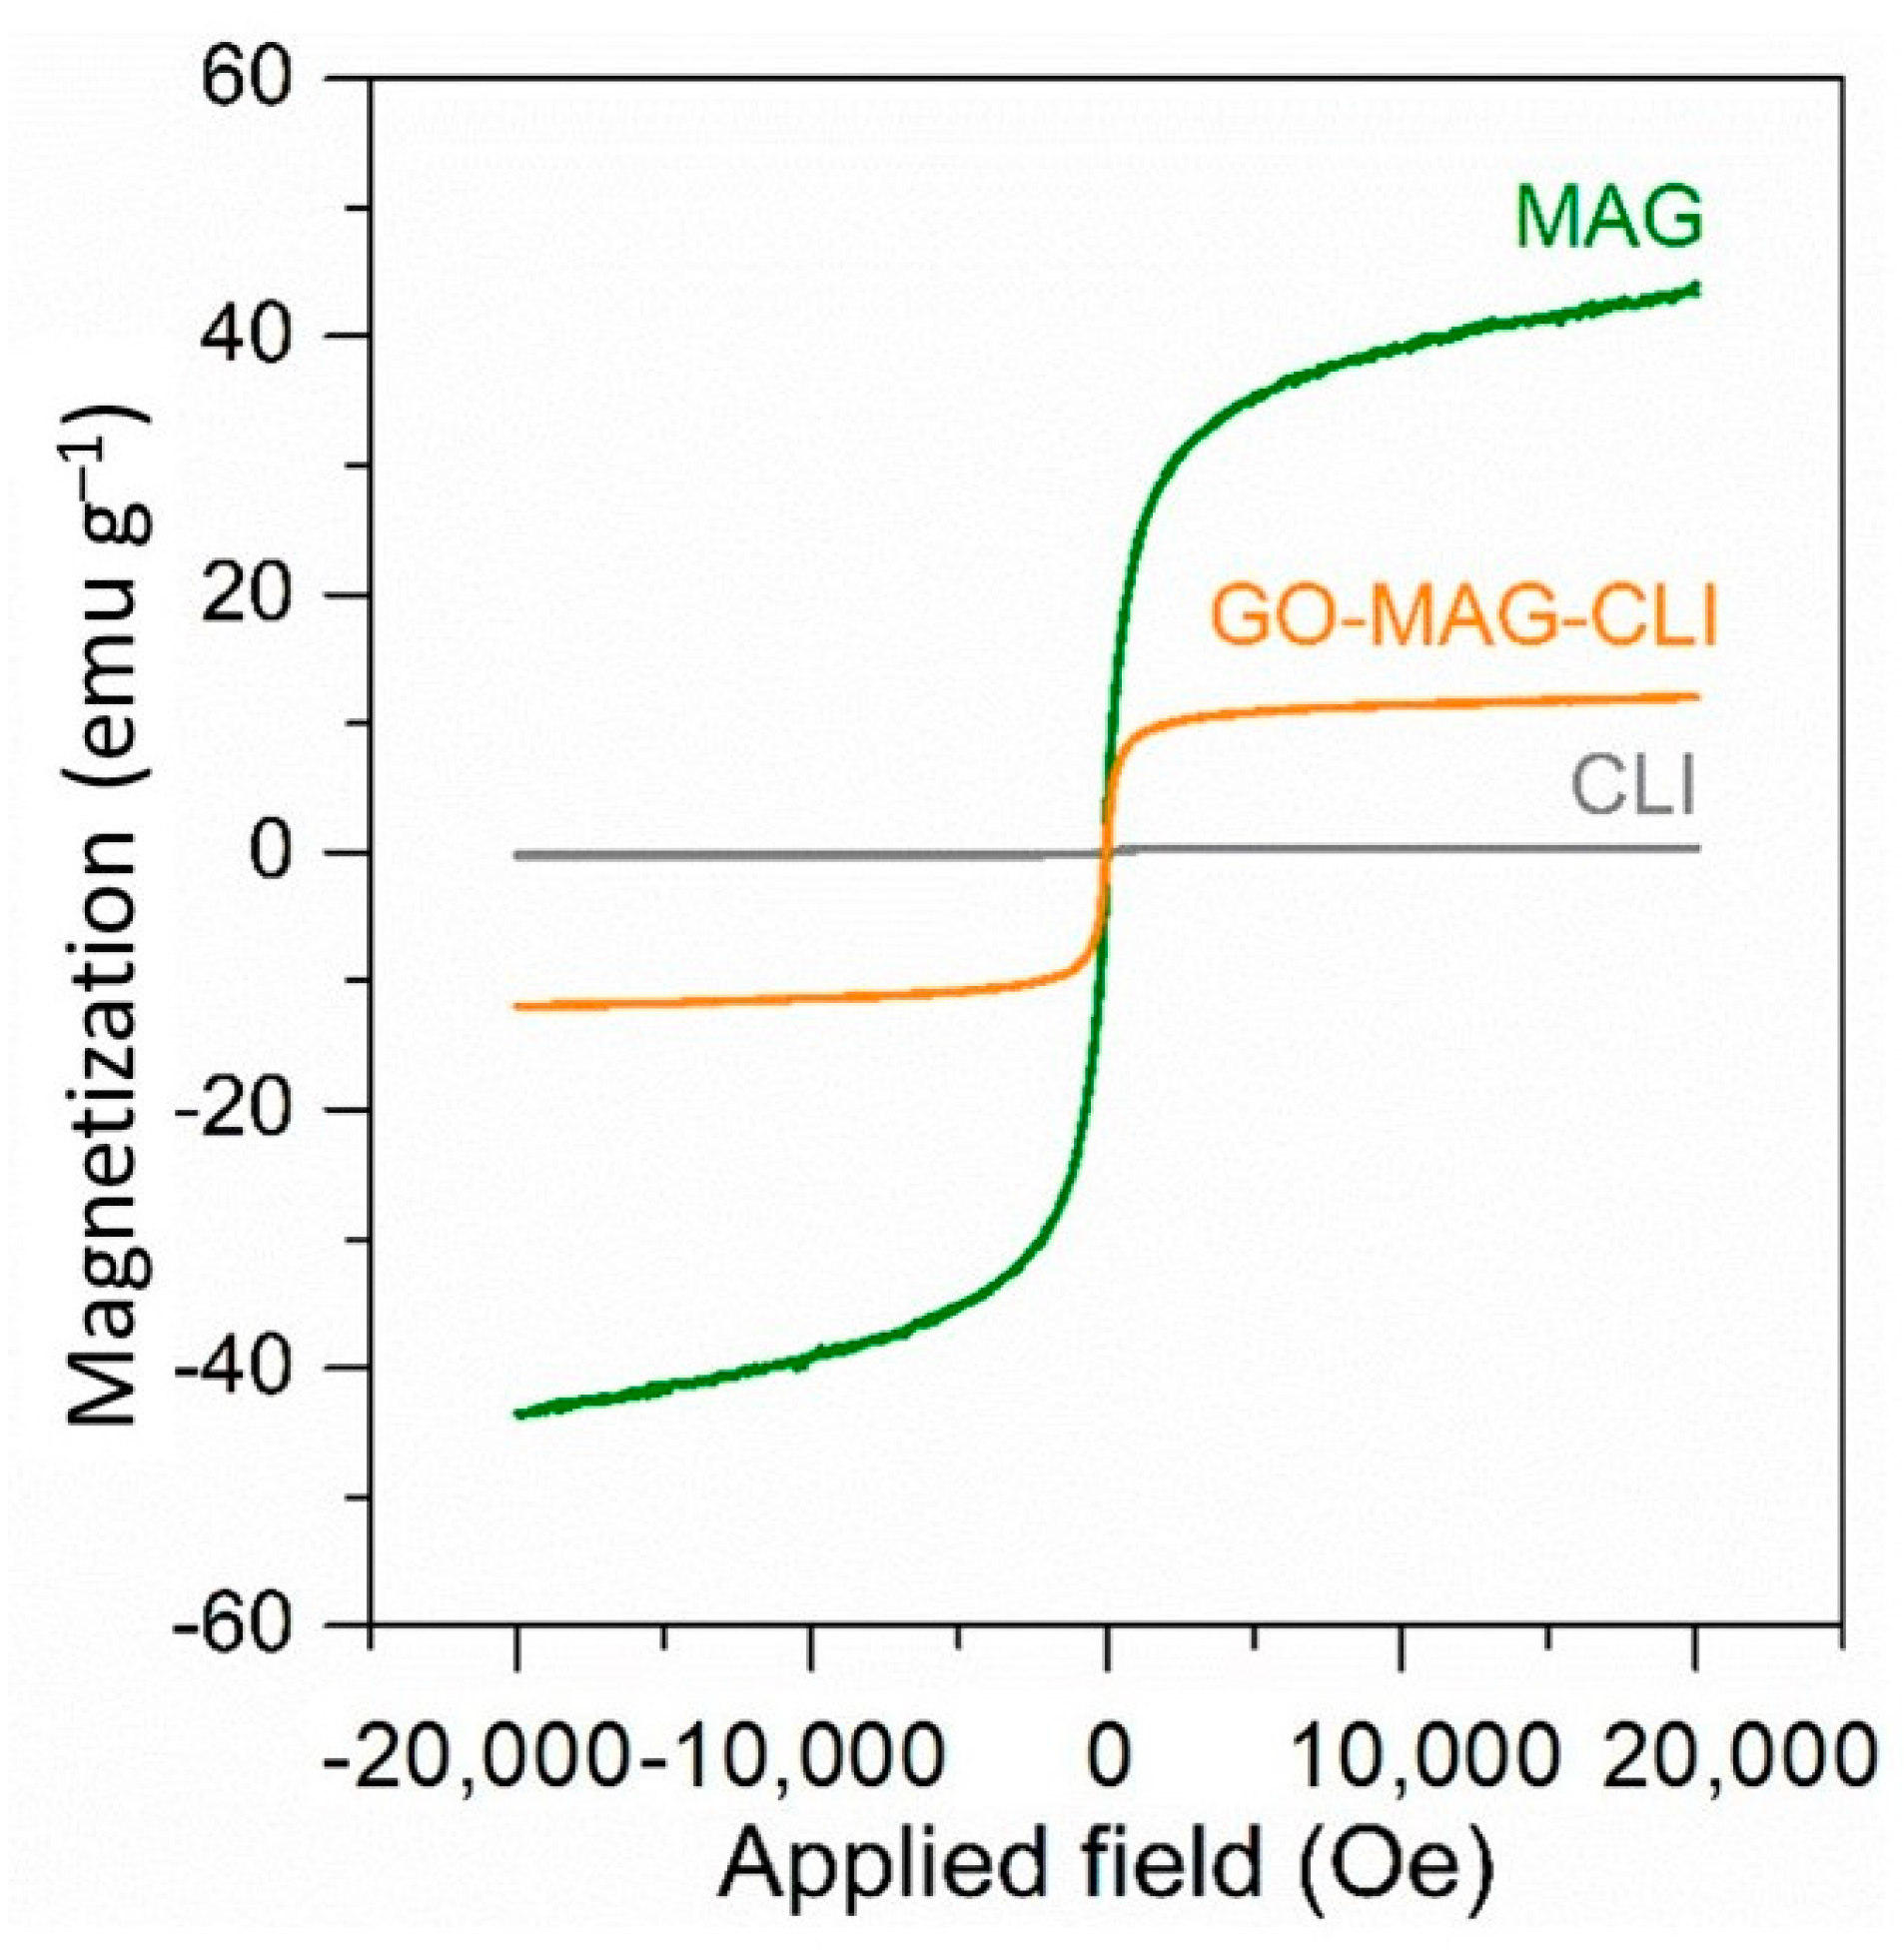
Figure 9 presents the magnetization curves of GO-MAG-CLI, pure CLI, and iron oxide magnetic nanoparticles (MAG) as reference materials. Both the MAG and GO-MAG-CLI showed similar superparamagnetic behaviors, with saturation magnetization values of 44.07 and 12.00 emu g−1 within a magnetic field lower than 2 T, respectively. The lower saturation magnetization value of GO-MAG-CLI was the result of MAG precipitation on the CLI surface. However, the obtained value indicates that the precipitation of iron oxide nanoparticles onto CLI can induce magnetism to CLI, since CLI itself does not exhibit magnetic properties. Additionally, GO-MAG-CLI retains magnetic properties after the CIP adsorption (not shown), suggesting that the magnetic separation of the spent GO-MAG-CLI from the water media is possible.

3.2. Optimization of CIP Adsorption Process Using Model

Based on the RSM–CCF design, 90 experiments were performed (12 axial points, 48 factorial or cube points, and 30 replicates at the center point) to model the adsorption of CIP onto CLI, MAG-CLI, and GO-MAG-CLI and to evaluate the optimum adsorption parameters.
Firstly, the data were studied to verify the normality of the residuals via the normal probability plot of the residuals (Figure 10a). As observed in Figure 10a, the residuals show normality, which indicates the adequacy of the predicted model. The plot of the internally studentized residuals against the predicted response values (Figure 10b) shows the even scattering of points above and below the x-axis. Regarding the previously mentioned facts, it can be concluded that the fitted model is adequate, with a high coefficient of determination (R2 = 0.9989).
An assessment of the validity and adequacy of the model and the most important effects and probable interactions between the variables was performed using an ANOVA—a statistical method that allows the hypotheses to be tested based on the model parameters [10,65]. The ANOVA results for the polynomial model are outlined in Table S1. Based on the table, the F- and p-values of the developed model are equal to 596.73 and <0.0001, respectively. Therefore, the polynomial model is highly significant for CIP removal by CLI-based adsorbents (Table S1). According to the results, the variables with the greatest impact on the CIP adsorption are the linear parameters of the initial CIP concentration (A); pH value (B); type of adsorbent (E); and interaction terms BE, CE, and BCE.
To describe the process of CIP adsorption onto the CLI and CLI-based adsorbents, higher-order polynomial models were developed by introducing the adsorption results, i.e., the adsorption capacities. In order to achieve the best statistical properties of the model, the response had to be transformed by applying a square root transformation. The relative impact of the factors on the CIP removal can be identified by analyzing the values of the coefficients of the final equation, which is expressed in terms of coded factors using Equation (2).
The final equations in terms of the actual factors for CLI, MAG-CLI, and GO-MAG-CLI and the adsorption capacity for CIP were given by Equations (3)–(5), respectively. Factors variables are denoted as follows: A = X1, B = X2, C = X3, and D = X4.
Sqrt(q) = 2.08 + 0.5862‧A − 0.3774‧B + 0.1117‧C + 0.0718‧D − 0.2097E[1] −
0.2156E[2] − 0.0521‧AB + 0.0185‧AD + 0.044‧AE[1] − 0.1374‧AE[2] −
0.0339‧BC − 0.1154‧BE[1] − 0.1207‧BE[2] − 0.3838‧CE[1] + 0.3332‧CE[2] −
0.0228‧DE[1] − 0.0279‧DE[2] + 0.0949‧B2 + 0.045‧C2 − 0.0403‧D2 + 0.015‧ABC
+ 0.0396‧ABE[1] + 0.0256‧ABE[2] − 0.0683‧ACE[1] + 0.1229‧ACE[2]
+ 0.0031‧ADE[1] − 0.022‧ADE[2] + 0.014‧BCD − 0.1472‧BCE[1]
+ 0.2274‧BCE[2] + 0.0034‧CDE[1] − 0.0183‧CDE[2] − 0.0807‧A2B − 0.1214‧A2C
+ 0.3386‧A2E[1] − 0.3314‧A2E[2] + 0.2901‧B2E[1] − 0.1964‧B2E[2]
+ 0.0682‧C2E[1] − 0.1487‧C2E[2] − 0.0383‧ABCE[1] + 0.0451‧ABCE[2]
− 0.1637‧A2B2 + 0.0987‧A2BE[1] − 0.0921‧A2BE[2] + 0.1855‧A2CE[1]
− 0.0826‧A2CE[2] − 0.1318‧AB2E[1] + 0.144‧AB2E[2] − 0.007‧ABCDE[1]
+ 0.0236‧ABCDE[2] − 0.5789‧A2B2E[1] + 0.6417‧A2B2E[2]
Y1/2 = −16.01 + 1.51X1 + 4.84X2 + 0.07X3 + 0.04X4 − 0.41X1X2 − 0.005X1X3 + 0.0002X1X4 − 0.01X2X3 + 0.0001X3X4 − 0.02X12 − 0.34X22 + 0.001X32 − 0.002X42
− 0.0001X1X2X3 + 0.00001X2X3X4 + 0.01X12X2 + 0.03X1X22 + 0.01X12X2
+ 0.03X1X22 − 0.0005X12X22
Y1/2 = 25.38 − 1.59X1 − 6.98X2 + 0.03X3 + 0.05X4 + 0.46X1X2 + 0.002X1X3
+ 0.00005X1X4 + 0.005X2X3 − 0.0002X3X4 + 0.03X12 + 0.46X22 + 0.003X32
− 0.002X42 + 0.0003X1X2X3 + 0.00001X2X3X4 − 0.01X12X2 − 0.00005X12X3
− 0.03X1X22 − 0.000001X1X2X4 + 0.0005X12X22
Y1/2 = 0.15X1 + 0.81X2 − 0.02X3 + 0.04X4 − 0.04X1X2 + 0.003X1X3 + 0.0002X1X4
− 0.01X2X3 + 0.0001X3X4 − 0.002X12 − 0.05X22 + 0.001X32 − 0.002X42
+ 0.00005X1X2X3 + 0.000004X2X3X4 + 0.001X12X2 − 0.0001X22X3 + 0.003X1X22
+ 0.000001X1X2X3X4 − 0.0001X12X22

3.3. Effects of Variables on CIP Adsorption

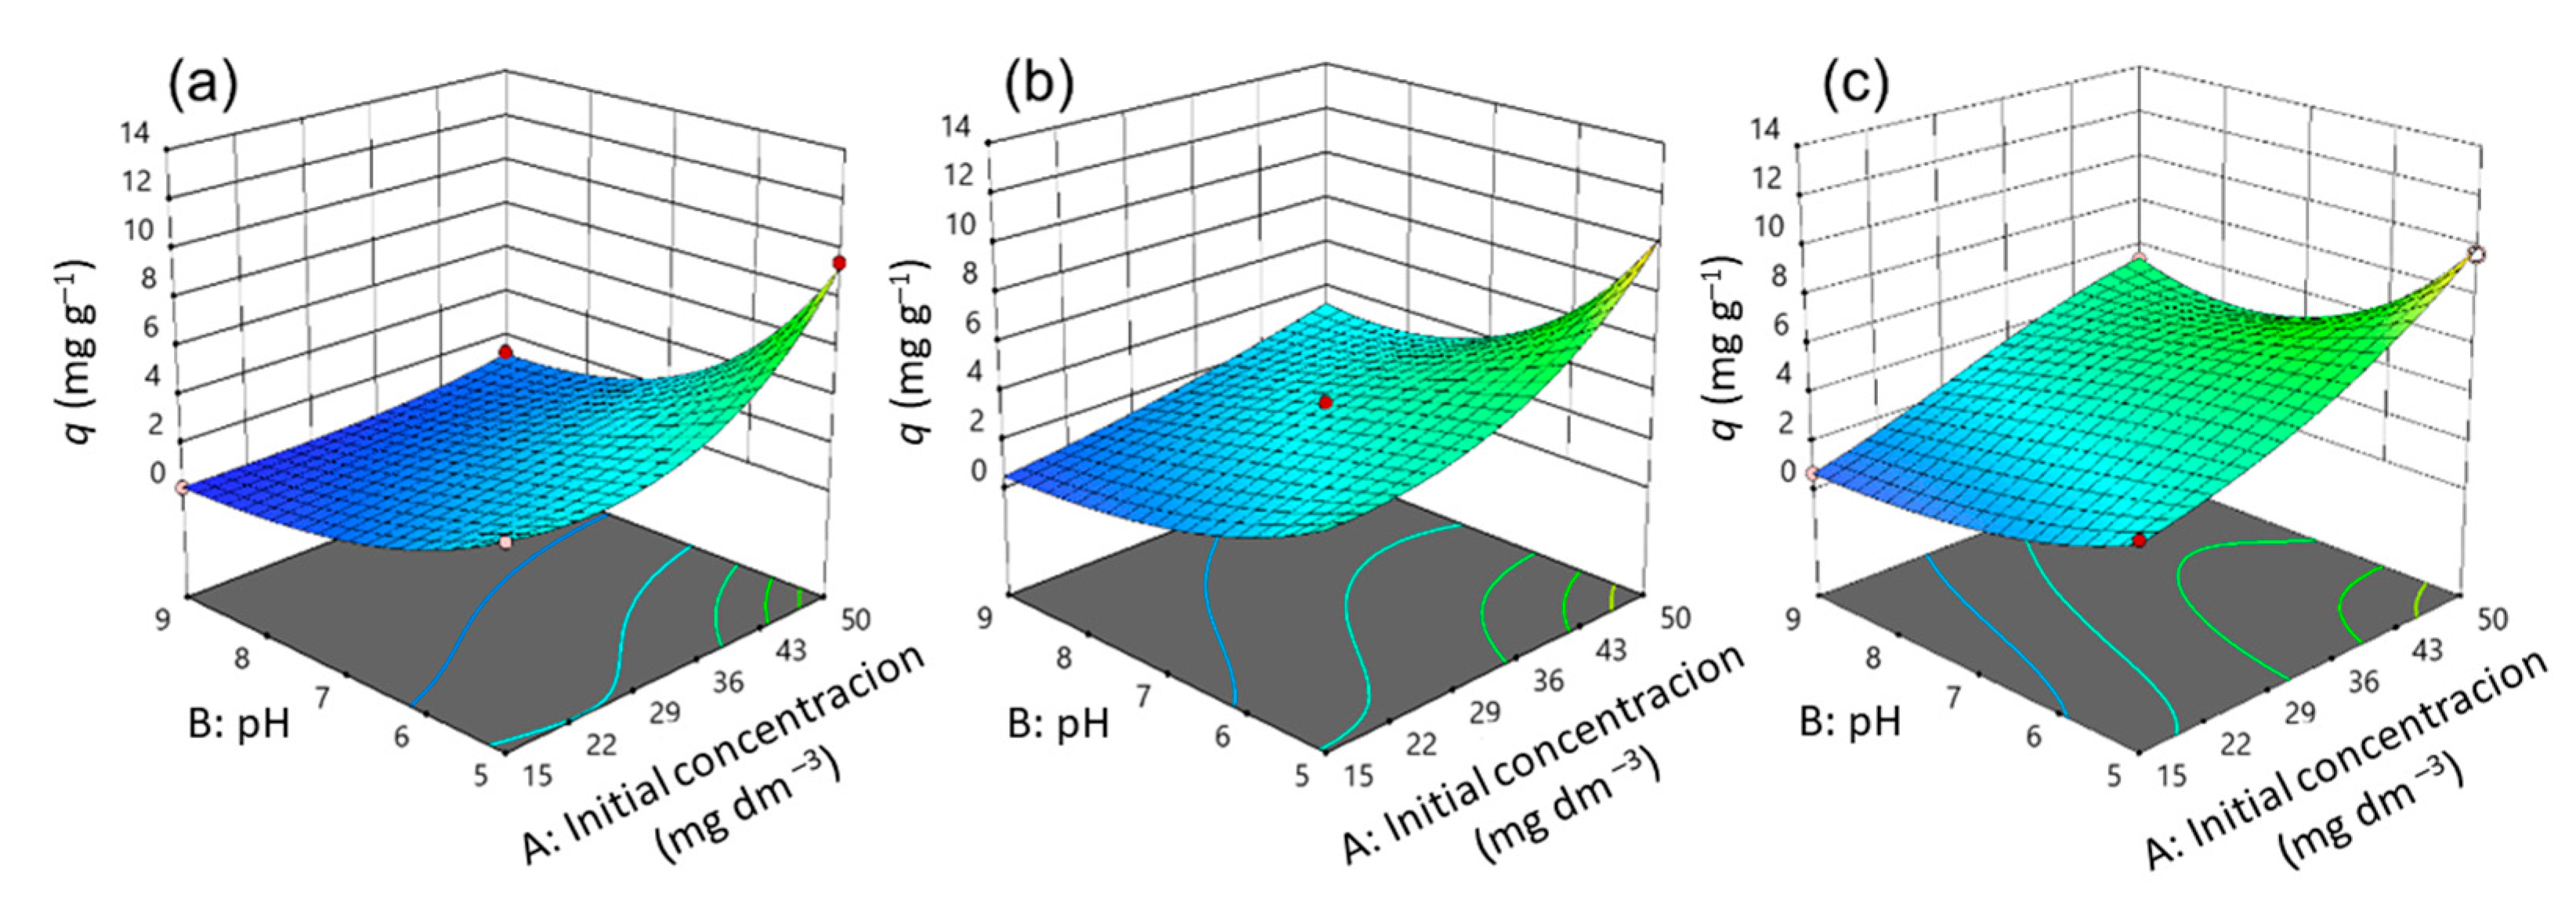
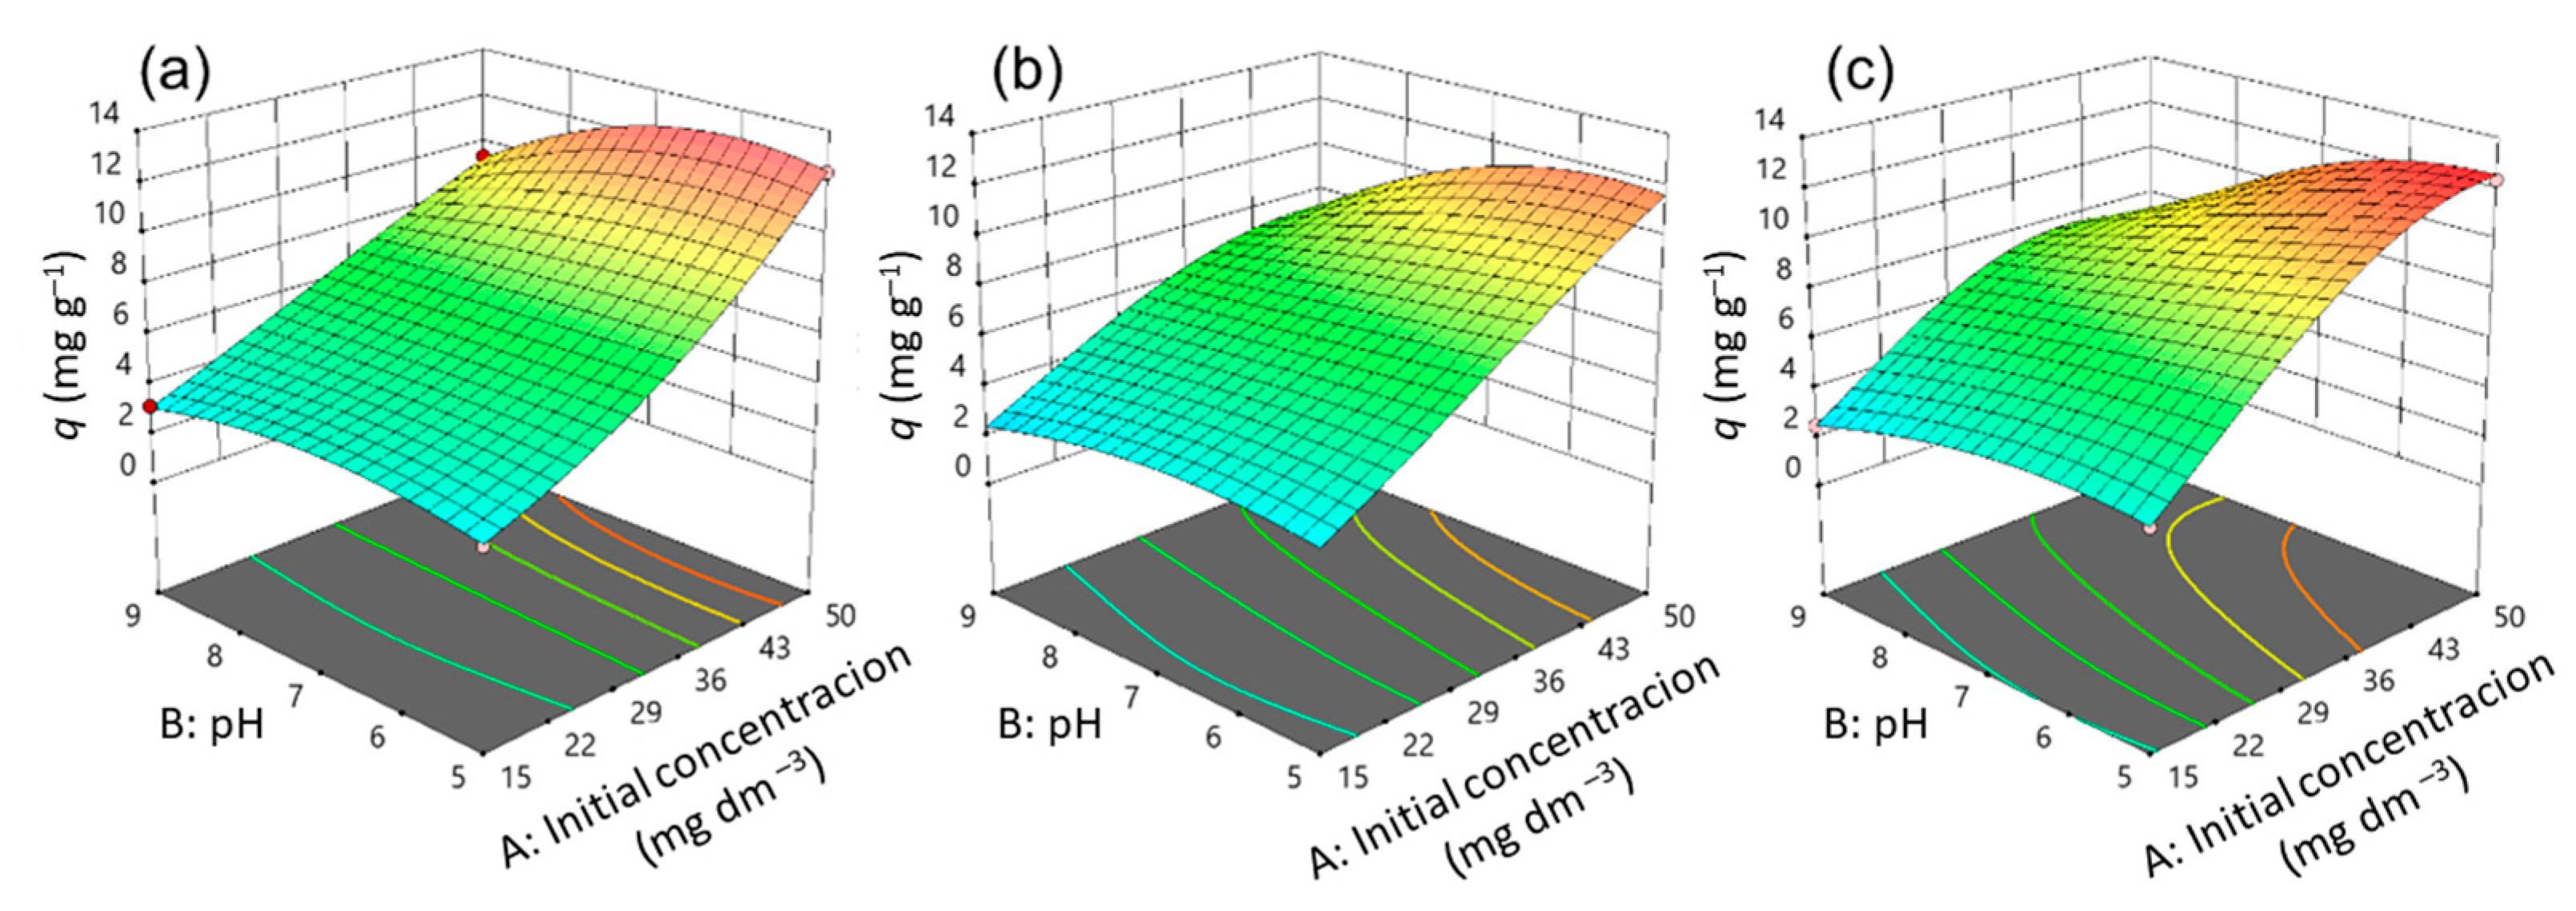
Three-dimensional diagrams (Figure 11, Figure 12 and Figure 13) and contours (Figure S4) help to clarify the effects of independent variables on the responses at different points [36]. The optimal conditions that provide the maximum adsorption capacity for CIP using the CLI, MAG-CLI, and GO-MAG-CLI adsorbents are obtained using the multicriteria optimization process and are presented via contour diagrams (Figure S4) and in Table 7.
The effects of the operational parameters including the initial CIP concentration, pH, temperature, and contact time on the adsorption of ciprofloxacin onto CLI, MAG-CLI, and GO-MAG-CLI adsorbents were studied. Figure 11, Figure 12 and Figure 13 show three-dimensional surface plots related to the interactive effects of the initial CIP concentration and pH at three different temperatures and for all three adsorbents at a fixed contact time of 20 min. The contact time is one of the crucial parameters in the determination of wastewater treatment cost-effectiveness. The removal efficiency of contaminants usually increases with the contact time until the equilibrium is reached [66,67]. Accordingly, the adsorption capacity of all three studied CLI-based adsorbents increased with increasing contact time, and the results at the maximum studied time are shown.
The adsorption capacity for CIP was significantly dependent on its initial concentration, and in general the adsorption capacity increased by increasing the initial antibiotic concentration. The enchantment of the adsorption capacity for CIP by increasing the CIP concentration in the solution could be a result of improving the concentration gradient as the adsorption driving force, as well as the availability of the uncovered adsorbent’s surface area at the beginning of the process [19,27]. A comparable result was obtained for CIP removal using activated carbon [67].
The pH value proved to be the second most significant factor for the CIP adsorption onto CLI, MAG-CLI, and GO-MAG-CLI, since the pH controls the nature of the adsorbent’s surface and adsorbate molecules, and in turn the adsorbate–adsorbent interactions [7]. As Figure 11, Figure 12 and Figure 13 indicate, the adsorption capacity of the prepared adsorbents for CIP slightly increases with the pH decreasing from 9 to 5. Consequently, the optimum pH of CIP adsorption onto CLI-based adsorbents is found to be around 5. Since the CIP molecule is a zwitterion, with pKa values of 5.90 and 8.89 for the amine and carboxyl group, respectively, it exists in a cationic form at pH levels below 5.90, whereas pH values above 8.89 favor its anionic form [7,8]. Accordingly, at the pH of 5, CIP is mainly present as a cation, and the surfaces of the CLI, MAG-CLI, and GO-MAG-CLI are negatively charged. Therefore, the CLI-based adsorbents’ particle and CIP molecules attracted each other, and the adsorption efficiency increased. On the other hand, the adsorption efficiency was reduced to a pH higher than 8.89 due to the electrostatic repulsion between an anionic form of the CIP molecule and the negatively charged surface of the adsorbents. A similar result was reported by Najafpoor et al. [10] for CIP removal from synthetic wastewaters using γ-Al2O3 nanoparticles.
The interaction of the initial CIP concentration and pH for different temperatures showed that GO-MAG-CLI had a maximum adsorption capacity for CIP at the highest applied temperature (Figure 13c) and CLI had a maximum adsorption capacity at the lowest applied temperature (Figure 11a), while the capacity of MAG-CLI did not change significantly with the temperature (Figure 12). Since the adsorption process mainly occurs as an exothermic process, the decrease in CLI adsorption ability with the temperature increase can be explained by Le Chatelier’s principle. A degree of the decrease in adsorption ability depends on the heat of adsorption; the higher the adsorption heat, the higher the temperature needed to decrease the adsorption ability to some extent [68]. The enhancement in the mobility of CIP molecules with an increase in the solution temperature can, consequently, lead to the equilibrium shift towards desorption. A similar trend was observed for the cephalexin adsorption by Fe3O4 nanoparticles [27]. The lower adsorption ability of MAG-CLI for CIP in comparison to the ability of pristine CLI could be ascribed to the slightly degraded CLI surface after the coating of MAG nanoparticles, which resulted in a decrease in the number of active sites on the surface available for the CIP adsorption.
As expected, GO-MAG-CLI showed the highest adsorption capacity for CIP at all studied temperatures. It was found that GO itself had a great adsorption ability for CIP removal from water media [34]. A coating of CLI with GO could enlarge the active surface area and subsequently the amount of surface sites available for the antibiotic molecule adsorption [29,69].

3.4. Adsorption Isotherm Study

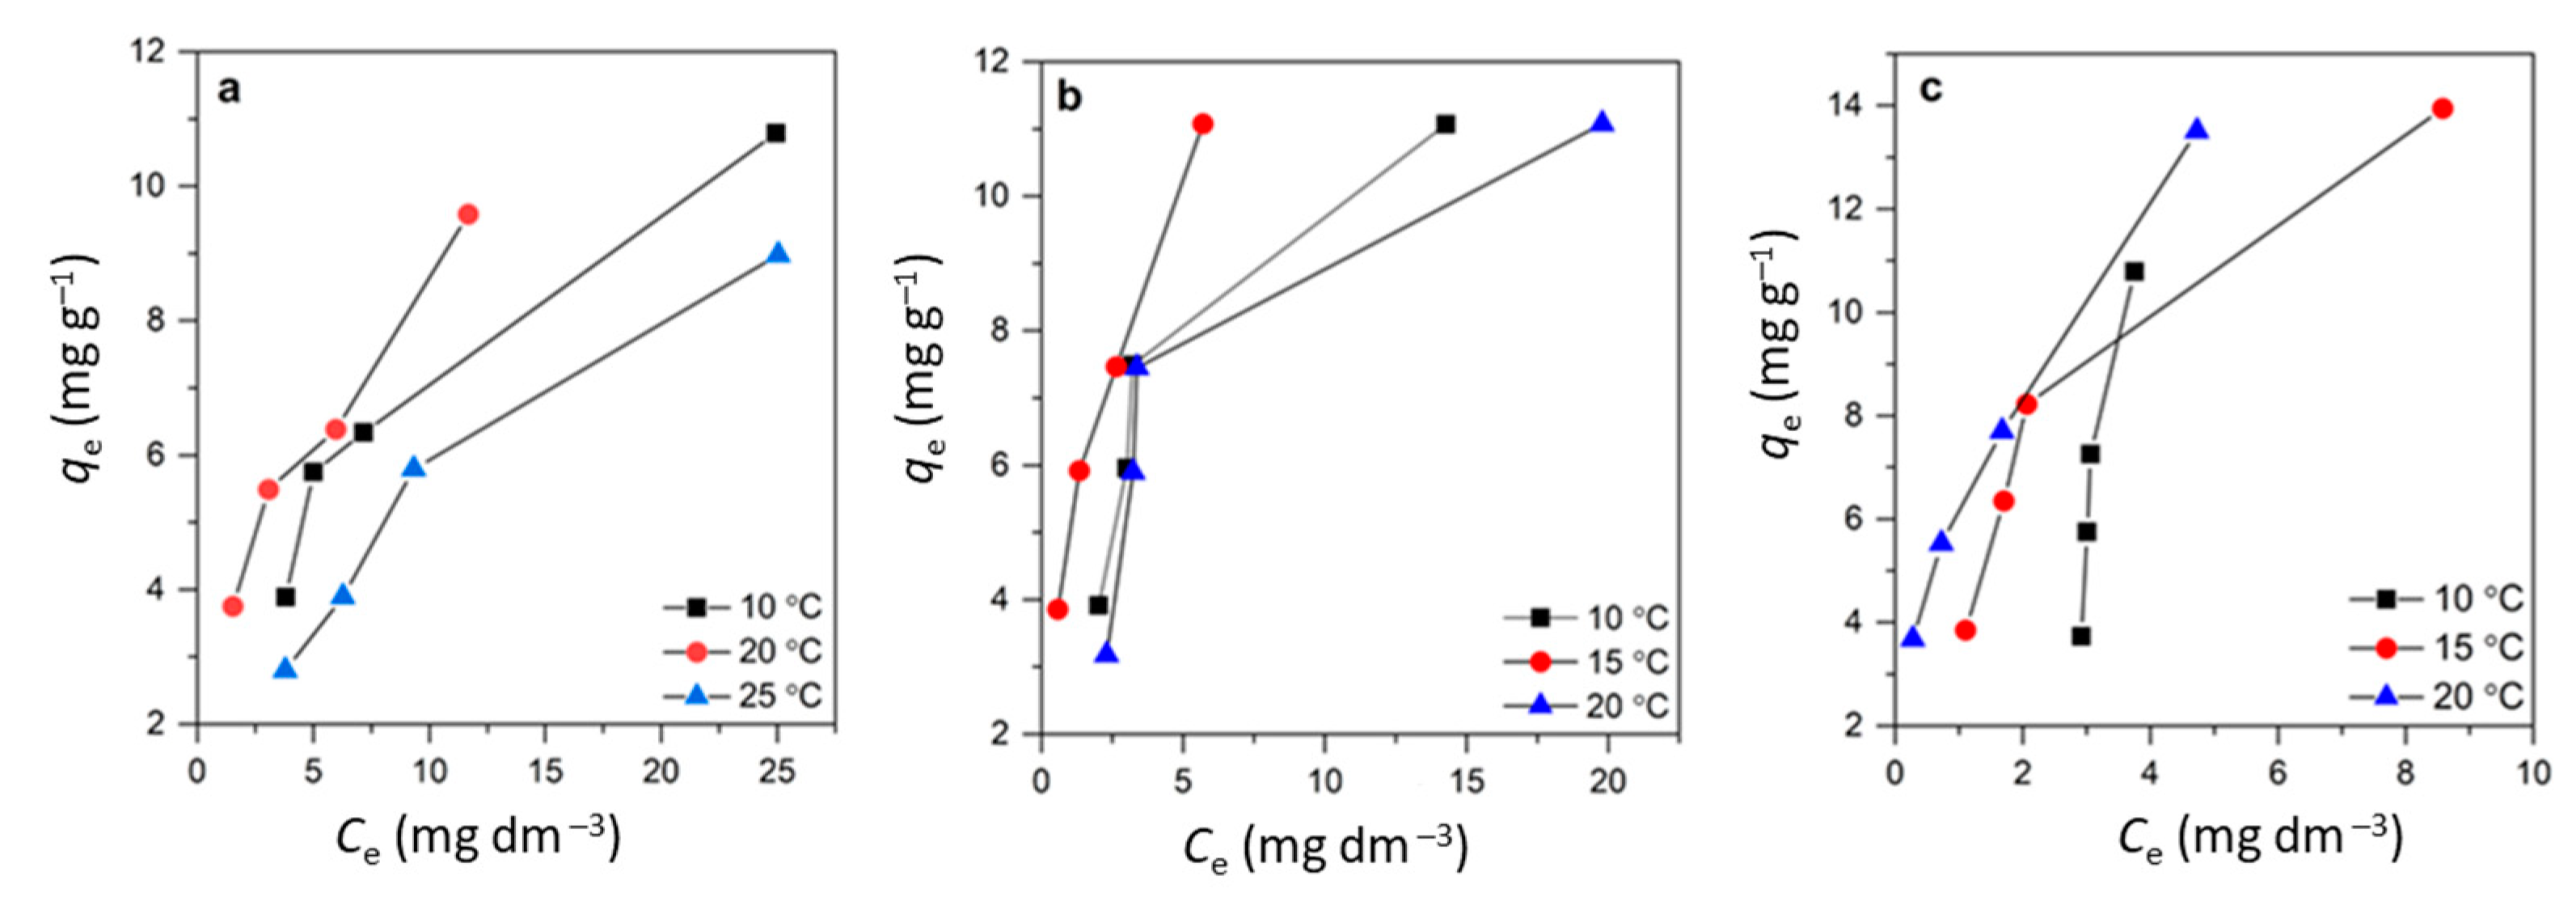
Adsorption isotherms describe the relationships between the amount of absorbed antibiotic molecule onto the adsorbent and the equilibrium antibiotic concentration in the solution. The adsorption of CIP on CLI, MAG-CLI, and GO-MAG-CLI was studied at 10, 15, and 20 °C for the initial CIP concentrations of 15, 25, 32.5, and 50 mg dm−3 at pH = 5 and a solid-to-liquid ratio of 1:250, for which the previous study showed the highest CIP removal efficiency [45].
The adsorption capacity levels of CLI, MAG-CLI, and GO-MAG-CLI increased with the initial CIP concentration at all studied temperatures (Figure 14). In the case of CLI, the adsorption capacity slightly decreased with temperature, while the capacity of GO-MAG-CLI increased with the temperature increase for all studied initial CIP concentrations. However, an increase in temperature did not cause any significant changes in the adsorption capacity of MAG-CLI, which was found to be 11.07 mg g−1 for all investigated temperatures and initial CIP concentrations. This suggests that the MAG coating did not influence the CIP adsorption.
The adsorption equilibrium data given in Figure 14 were further analyzed using commonly applied empirical adsorption isotherm models [66,70]. Among the two parameters models, only the Langmuir and Freundlich isotherm models gave acceptable fits. The adsorption isotherm parameters were determined using a linear regression analysis according to the equations given in Table 8.
The results are summarized in Table 9. As can be seen from the obtained values of the linear regression correlation coefficients (R2), the Langmuir model gave a slightly better description for the CIP adsorption onto CLI, MAG-CLI, and GO-MAG-CLI. The maximum calculated capacities were 15.15 mg CIP g−1, 21.25 mg CIP g−1, and 47.91 mg CIP g−1 at 15 °C for CLI, MAG-CLI, and GO-MAG-CLI, respectively. Considering the assumptions of the Langmuir model [71], it could be concluded that one active site at the surface of adsorbents is occupied by only one CIP molecule, and that the CIP adsorption could not proceed beyond the monolayer. Furthermore, the Langmuir separation factor RL (not shown) was in the range of 0–1, indicating that the adsorption is a favorable process.

3.5. Adsorption Kinetics

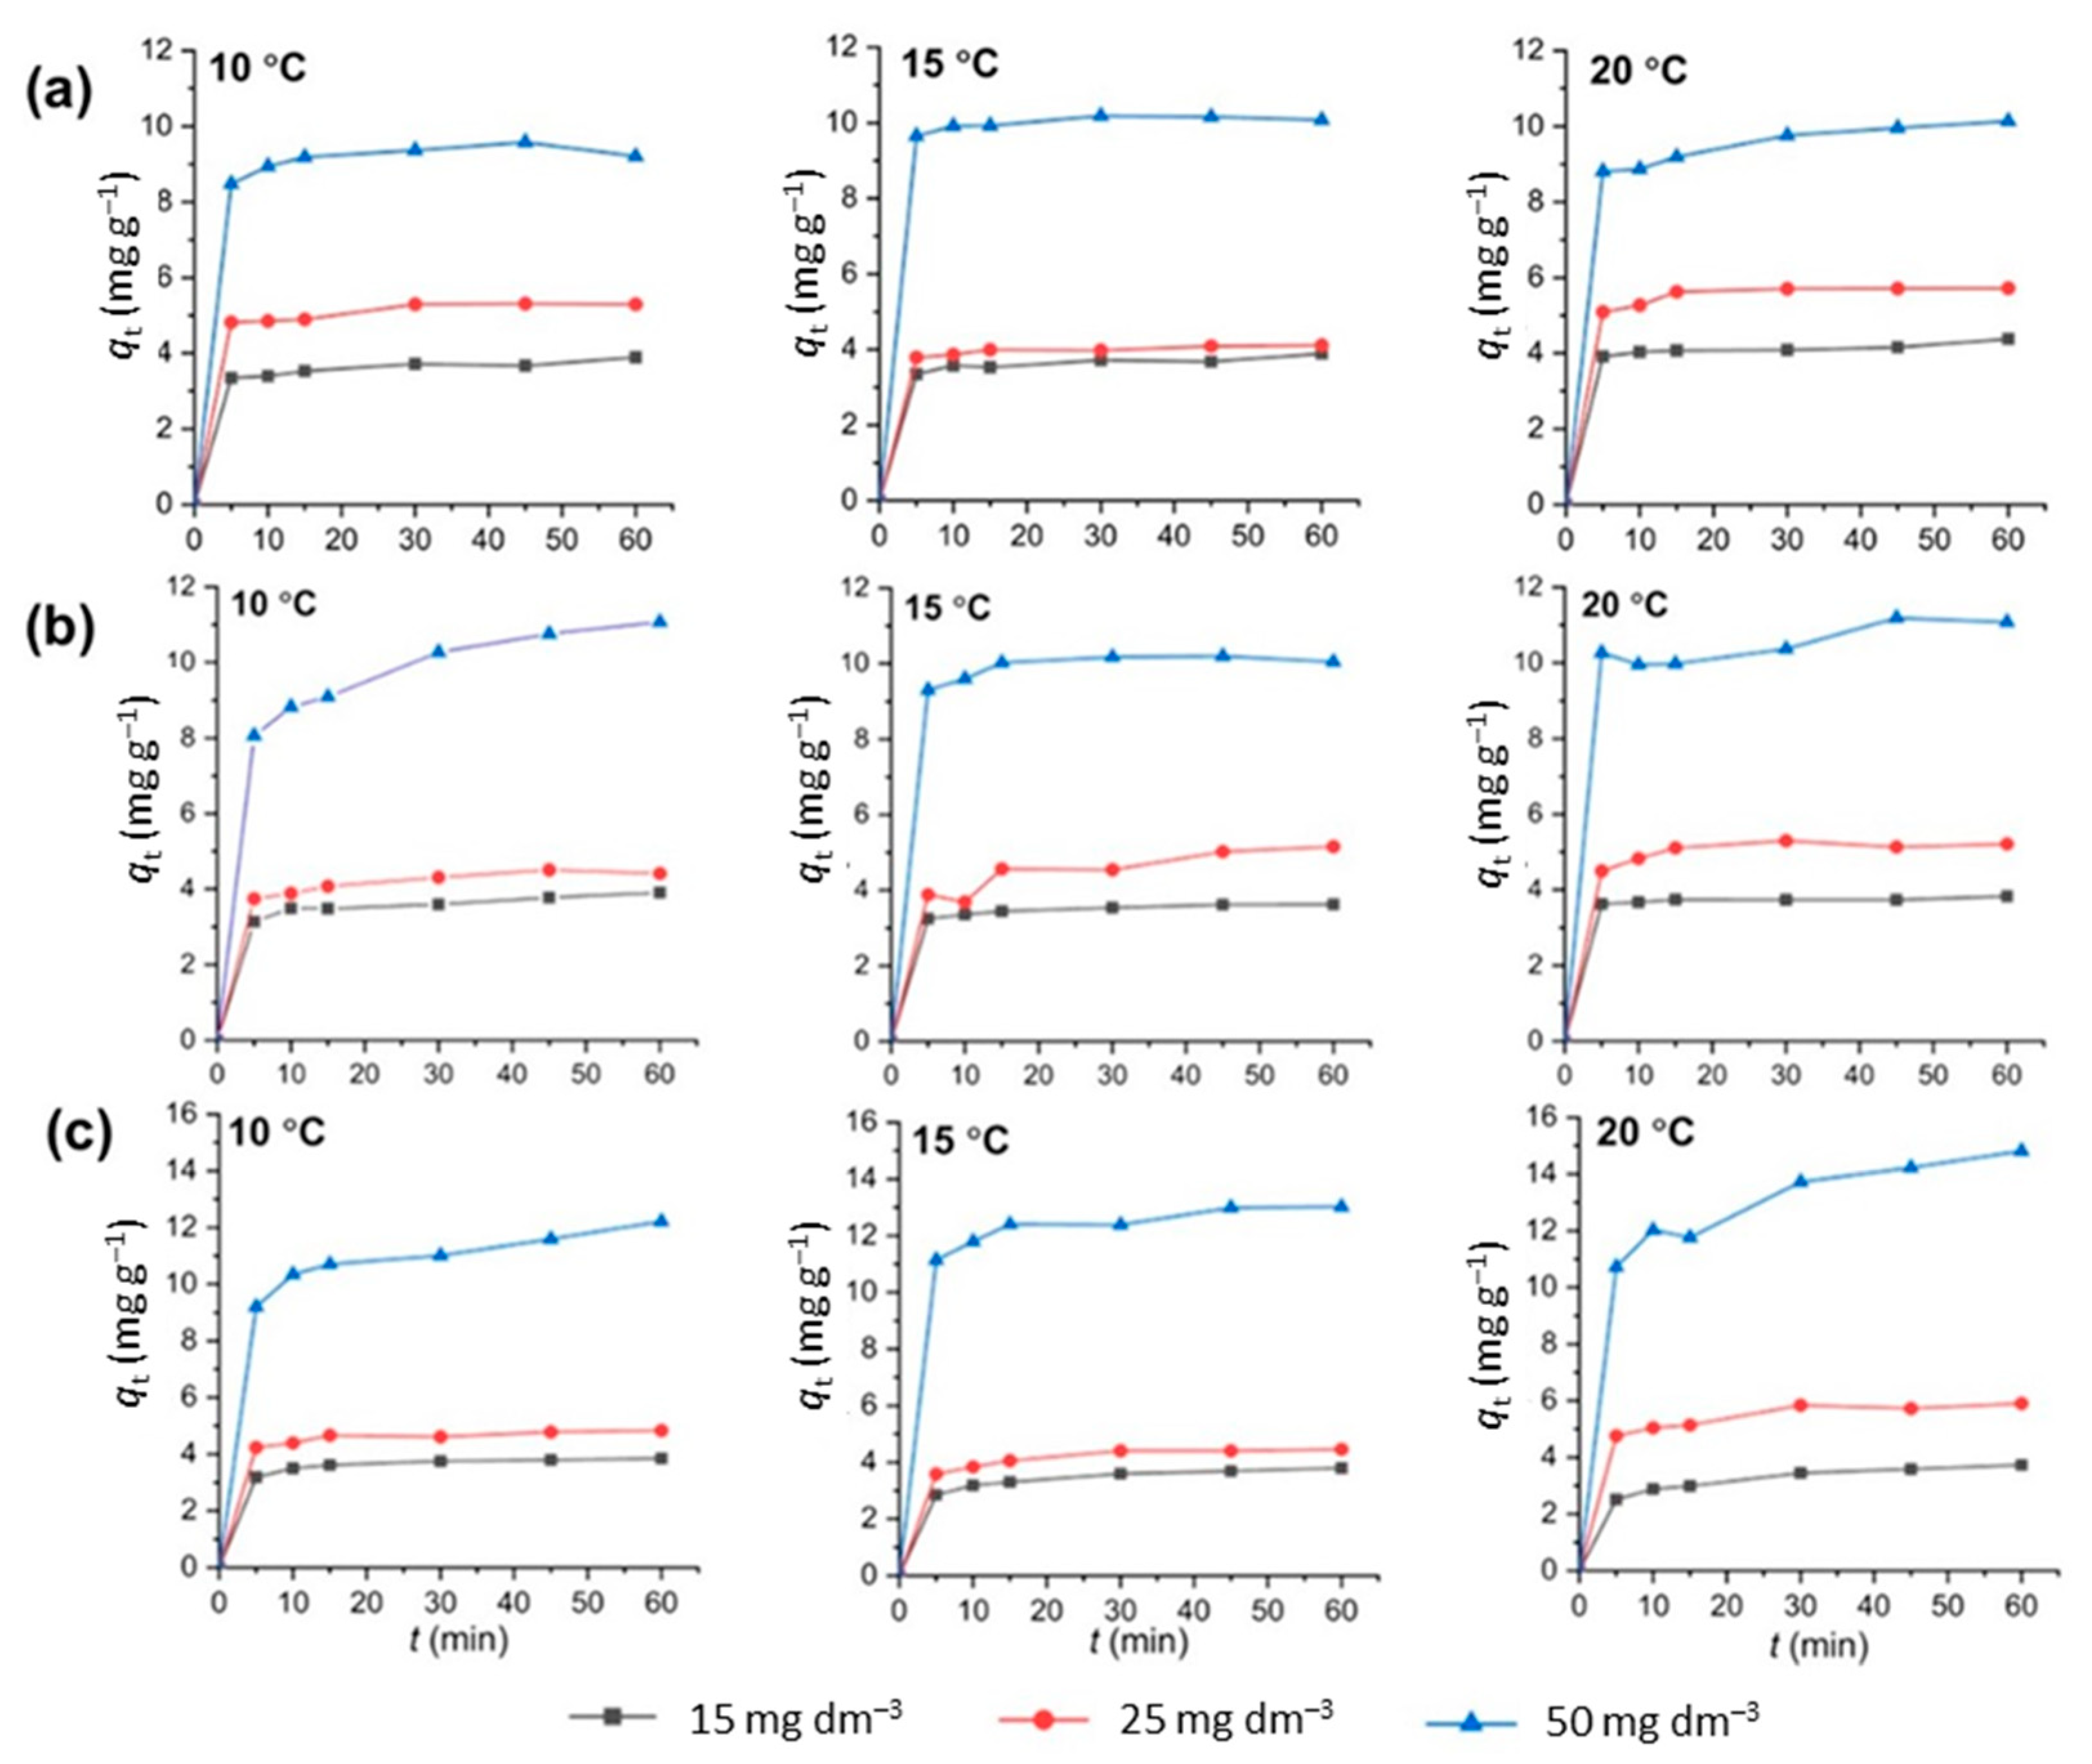
To investigate the dynamics of the CIP adsorption reaction, i.e., the relation between the adsorption time and adsorption capacity, as well as the process controlling mechanism, kinetic studies were performed [36]. Herein, the CIP adsorption dependence on time was investigated at 10, 15, and 20 °C for CIP solutions with C0 = 15, 25, and 50 mg dm−3. The adsorption capacities of CLI, MAG-CLI, and GO-MAG-CLI for CIP as a function of the contact time are shown in Figure 15.
For all three adsorbents, the CIP uptake increases rather sharply in the first 5 min of the adsorption for all studied temperatures and initial CIP concentrations. Further, the adsorption occurs more slowly. More than 85% of the maximum adsorption capacity is achieved within this first 5 min, which indicates fast adsorption kinetics of CIP onto CLI-based adsorbents.
The experimental data from Figure 15 were analyzed using two reaction-based kinetic models, i.e., Lagergren’s pseudo-first-order and pseudo-second-order kinetic models, and the interparticle diffusion model. Lagergren’s pseudo-first-order model can be expressed as follows:
dqt/dt = k1(qeqt)
where qe and qt are the amounts of adsorbed CIP (mg g−1) at equilibrium and at time t, respectively; k1 (min−1) is the equilibrium rate constant in the pseudo-first-order model. The Equation (6) can further be modified into a linear form by integration using the boundary conditions (qt = 0 − qt, and t = 0 − t):
log(qeqt) = logqe − (k1/2.303)t
According to Equation (7), the plot of log(qeqt) vs. time (t) provides estimates of qe and k1 from the intercept and the slope, respectively [72].
The pseudo-second-order equation assumes that the adsorption capacity is directly proportional to the number of occupied active sites on the adsorbent surface. This model has the advantage of studying the adsorption kinetics for low-concentration solutions [66,70]. The differential equation for the pseudo-second-order model can be represented as:
dqt/dt = k2(qeqt)2
where k2 (g mg−1 min−1) stands for the pseudo-second-order rate constant. By integrating Equation (8) in the same limits as above, the equation can be easily linearized into:
t/qt = 1/(k2qe2) + (1/qe)t
The linear plot of t/qt vs. t gives 1/qt as the slope and 1/(k2qe2) as the intercept.
By applying the two reaction-based kinetic models to the experimental data, the correlation coefficient (R2) values lower than 0.80 (not shown) obtained for the linear relation between log(qeqt) and t indicate that the adsorption of CIP did not follow the pseudo-first-order kinetic model. The adsorption of CIP on CLI-based adsorbents could be better described by the pseudo-second-order kinetic model, since the obtained R2 values of that model almost reached one. The kinetic parameters for the adsorption of CIP onto CLI, MAG-CLI, and GO-MAG-CLI calculated from the linear plots of the pseudo-second-order kinetic model are given in Table 10. According to the assumption of the pseudo-second-order model, chemisorption is the limiting step that controls the surface adsorption process, and the sites are occupied proportional to the square of the number of vacant surface sites [36]. Additionally, the maximum calculated capacities obtained for the highest studied concentration, 10.34 mg CIP g−1 (at 20 °C), 9.70 mg CIP g−1 (at 20 °C), and 15.43 mg CIP g−1 (at 10 °C) for CLI, MAG-CLI, and GO-MAG-CLI, respectively, were close to the experimentally obtained values. The Lagergren’s pseudo-second-order rate constants (k2) were in the range of 0.0329–0.5164 g mg−1 min−1 for all three studied adsorbents. The unclear trend of changing k2 values with temperature and initial CIP concentration changes indicates the complex mechanism of CIP adsorption onto the CLI-based adsorbents. Comparable results were obtained for the CIP adsorption by clays and γ-Al2O3 nanoparticles [10,14].
The application of the Weber–Morris diffusion model to the experimental data (not shown) resulted in parameter I (related to the thickness of the boundary layer) values higher than one, which indicated that the intra-particle diffusion is not the rate-limiting step [35].

4. Conclusions

Herein, the magnetic clinoptilolite coated with graphene oxide was synthesized using the combination of the microwave-assisted method and ultrasonication. The non-conventional approach of using microwave irradiation in composite synthesis has been proven to reduce the environmental impact and simplify the procedure. The synthesized composite showed a high adsorption ability towards the antibiotic ciprofloxacin present in the water media. The ciprofloxacin adsorption was optimized using the response surface methodology through the central composite factorial design framework. The highest adsorption capacity was achieved under the optimal conditions of a 48.47 mg dm−3 initial CIP concentration and pH of 5.10 at 24.78 °C and with a 19.20 min contact time. The final composite showed a higher adsorption capacity for ciprofloxacin than pristine clinoptilolite. According to the statistical analysis, the considered levels of the initial ciprofloxacin concentration and pH had the most significant effect on the ciprofloxacin adsorption. The process of ciprofloxacin adsorption was well described by the Langmuir adsorption isotherm and Lagergren’s pseudo-second-order kinetic model.

Supplementary Materials

The following supporting information can be downloaded at: https://www.mdpi.com/article/10.3390/nano13040740/s1, Figure S1: Diffraction pattern of MAG sample. Figure S2: Diffraction pattern of MAG-CLI sample. Figure S3: XPS survey spectra from the surfaces of (a) CLI, (b) MAG-CLI, and (c) GO-MAG-CLI. Figure S4: Contour diagrams for (a) CLI, (b) MAG-CLI, and (c) GO-MAG-CLI adsorption capacity optimization. Table S1: The ANOVA results of the model.

Author Contributions

Conceptualization, B.K. and L.Ć.; methodology, B.K. and L.Ć.; software, H.C.; validation, A.B., H.C., M.M., G.M. and L.Ć.; formal analysis, B.K., A.B., M.M. and G.M.; investigation, B.K.; resources, L.Ć.; data curation, B.K., A.B., H.C., M.M. and G.M.; writing—original draft preparation, B.K.; writing—review and editing, A.B., H.C., M.M., G.M. and L.Ć.; visualization, B.K., A.B., H.C. and M.M.; supervision, L.Ć.; project administration, L.Ć.; funding acquisition, L.Ć. All authors have read and agreed to the published version of the manuscript.

Funding

This research was funded by the European Union’s Horizon 2020 research and innovation program under the Marie Skłodowska-Curie grant agreement, MSCA-ITN-2018, grant number 812880.

Data Availability Statement

The data presented in this study are available upon reasonable request from the corresponding author.

Acknowledgments

The authors acknowledge Rea Veseli and Marko Skozrit for their technical support during the experimental work.

Conflicts of Interest

The authors declare no conflict of interest.

References

  1. Johnson, A.C.; Keller, V.; Dumont, E.; Sumpter, J.P. Assessing the concentrations and risks of toxicity from the antibiotics ciprofloxacin, sulfamethoxazole, trimethoprim and erythromycin in European rivers. Sci. Total Environ. 2015, 511, 747–755. [Google Scholar] [CrossRef] [PubMed] [Green Version]
  2. Frade, V.M.F.; Dias, M.; Teixeira, A.C.S.C.; Palma, M.S.A. Environmental contamination by fluoroquinolones. Braz. J. Pharm. Sci. 2014, 50, 41–54. [Google Scholar] [CrossRef]
  3. Sriram, A.; Kalanxhi, E.; Kapoor, G.; Craig, J.; Balasubramanian, R.; Brar, S.; Criscuolo, N.; Hamilton, A.; Klein, E.; Tseng, K.; et al. The State of the World’s Antibiotics 2021: A Global Analysis of Antimicrobial Resistance and Its Drivers; Center for Disease Dynamics, Economics & Policy: Washington, DC, USA, 2021. [Google Scholar]
  4. Murray, C.J.; Ikuta, K.S.; Sharara, F.; Swetschinski, L.; Robles Aguilar, G.; Gray, A.; Han, C.; Bisignano, C.; Rao, P.; Wool, E.; et al. Global burden of bacterial antimicrobial resistance in 2019: A systematic analysis. Lancet 2022, 399, 629–655. [Google Scholar] [CrossRef] [PubMed]
  5. LeBel, M. Ciprofloxacin: Chemistry, mechanism of action, resistance, antimicrobial spectrum, pharmacokinetics, clinical trials, and adverse reactions. Pharmacother. J. Hum. Pharmacol. Drug Ther. 1988, 8, 3–30. [Google Scholar] [CrossRef]
  6. Rakshit, S.; Sarkar, D.; Elzinga, E.J.; Punamiya, P.; Datta, R. Mechanisms of ciprofloxacin removal by nano-sized magnetite. J. Hazard. Mater. 2013, 246–247, 221–226. [Google Scholar] [CrossRef] [PubMed]
  7. Genç, N.; Dogan, E.C. Adsorption kinetics of the antibiotic ciprofloxacin on bentonite, activated carbon, zeolite, and pumice. Desalination Water Treat. 2015, 53, 785–793. [Google Scholar] [CrossRef]
  8. Carabineiro, S.A.C.; Thavorn-Amornsri, T.; Pereira, M.F.R.; Serp, P.; Figueiredo, J.L. Comparison between activated carbon, carbon xerogel and carbon nanotubes for the adsorption of the antibiotic ciprofloxacin. Catal. Today 2012, 186, 29–34. [Google Scholar] [CrossRef]
  9. De Andrade, J.R.; Oliveira, M.F.; da Silva, M.G.C.; Vieira, M.G.A. Adsorption of pharmaceuticals from water and wastewater using nonconventional low-cost materials: A review. Ind. Eng. Chem. Res. 2018, 57, 3103–3127. [Google Scholar] [CrossRef]
  10. Najafpoor, A.A.; Nemati Sani, O.; Alidadi, H.; Yazdani, M.; Navaei Fezabady, A.A.; Taghavi, M. Optimization of ciprofloxacin adsorption from synthetic wastewaters using γ-Al2O3 nanoparticles: An experimental design based on response surface methodology. Colloids Interface Sci. Commun. 2019, 33, 100212. [Google Scholar] [CrossRef]
  11. Lin, C.C.; Lee, C.Y. Adsorption of ciprofloxacin in water using Fe3O4 nanoparticles formed at low temperature and high reactant concentrations in a rotating packed bed with co-precipitation. Mater. Chem. Phys. 2020, 240, 122049. [Google Scholar] [CrossRef]
  12. El-Shafey, E.S.I.; Al-Lawati, H.; Al-Sumri, A.S. Ciprofloxacin adsorption from aqueous solution onto chemically prepared carbon from date palm leaflets. J. Environ. Sci. 2012, 24, 1579–1586. [Google Scholar] [CrossRef]
  13. Zhang, B.; Han, X.; Gu, P.; Fang, S.; Bai, J. Response surface methodology approach for optimization of ciprofloxacin adsorption using activated carbon derived from the residue of desilicated rice husk. J. Mol. Liq. 2017, 238, 316–325. [Google Scholar] [CrossRef]
  14. Cheng, R.; Li, H.; Liu, Z.; Du, C. Halloysite nanotubes as an effective and recyclable adsorbent for removal of low-concentration antibiotics ciprofloxacin. Minerals 2018, 8, 387. [Google Scholar] [CrossRef] [Green Version]
  15. Ashiq, A.; Sarkar, B.; Adassooriya, N.; Walpita, J.; Rajapaksha, A.U.; Ok, Y.S.; Vithanage, M. Sorption process of municipal solid waste biochar-montmorillonite composite for ciprofloxacin removal in aqueous media. Chemosphere 2019, 236, 124384. [Google Scholar] [CrossRef]
  16. Ngeno, E.C.; Shikuku, V.O.; Orata, F.; Baraza, L.D.; Kimosop, S.J. Caffeine and ciprofloxacin adsorption from water onto clinoptilolite: Linear isotherms, kinetics, thermodynamic and mechanistic studies. S. Afr. J. Chem. 2019, 72, 136–142. [Google Scholar] [CrossRef]
  17. Wang, S.; Peng, Y. Natural zeolites as effective adsorbents in water and wastewater treatment. Chem. Eng. J. 2010, 156, 11–24. [Google Scholar] [CrossRef]
  18. Ambrozova, P.; Kynicky, J.; Urubek, T.; Nguyen, V.D. Synthesis and modification of clinoptilolite. Molecules 2017, 22, 1107. [Google Scholar] [CrossRef] [Green Version]
  19. Javanbakht, V.; Ghoreishi, S.M.; Habibi, N.; Javanbakht, M. A novel magnetic chitosan/clinoptilolite/magnetite nanocomposite for highly efficient removal of Pb(II) ions from aqueous solution. Powder Technol. 2016, 302, 372–383. [Google Scholar] [CrossRef]
  20. Arora, M.; Eddy, N.K.; Mumford, K.A.; Baba, Y.; Perera, J.M.; Stevens, G.W. Surface modification of natural zeolite by chitosan and its use for nitrate removal in cold regions. Cold Reg. Sci. Technol. 2010, 62, 92–97. [Google Scholar] [CrossRef]
  21. Rajput, S.; Pittman, C.U.; Mohan, D. Magnetic magnetite (Fe3O4) nanoparticle synthesis and applications for lead (Pb2+) and chromium (Cr6+) removal from water. J. Colloid Interface Sci. 2016, 468, 334–346. [Google Scholar] [CrossRef]
  22. Savić, A.B.; Čokeša, D.; Lazarević, S.; Jokić, B.; Janaćković, D.; Petrović, R.; Živković, L.S. Tailoring of magnetite powder properties for enhanced phosphate removal: Effect of PEG addition in the synthesis process. Powder Technol. 2016, 301, 511–519. [Google Scholar] [CrossRef]
  23. Salem Attia, T.M.; Hu, X.L.; Yin, D.Q. Synthesised magnetic nanoparticles coated zeolite (MNCZ) for the removal of arsenic (As) from aqueous solution. J. Exp. Nanosci. 2014, 9, 551–560. [Google Scholar] [CrossRef]
  24. Kouli, M.E.; Banis, G.; Tsarabaris, P.; Ferraro, A.; Hristoforou, E. A Study on magnetic removal of sodium, calcium and potassium ions from seawater using magnetite/clinoptilolite–Na composite nanoparticles. J. Magn. Magn. Mater. 2018, 465, 692–699. [Google Scholar] [CrossRef]
  25. Neolaka, Y.A.B.; Lawa, Y.; Naat, J.; Riwu, A.A.P.; Mango, A.W.; Darmokoesoemo, H.; Widyaningrum, B.A.; Iqbal, M.; Kusuma, H.S. Efficiency of activated natural zeolite-based magnetic composite (ANZ-Fe3O4) as a novel adsorbent for removal of Cr(VI) from wastewater. J. Mater. Res. Technol. 2022, 18, 2896–2909. [Google Scholar] [CrossRef]
  26. Salem Attia, T.M.; Hu, X.L.; Yin, D.Q. Synthesized magnetic nanoparticles coated zeolite for the adsorption of pharmaceutical compounds from aqueous solution using batch and column studies. Chemosphere 2013, 93, 2076–2085. [Google Scholar] [CrossRef]
  27. Mohseni-Bandpi, A.; Al-Musawi, T.J.; Ghahramani, E.; Zarrabi, M.; Mohebi, S.; Vahed, S.A. Improvement of zeolite adsorption capacity for cephalexin by coating with magnetic Fe3O4 nanoparticles. J. Mol. Liq. 2016, 218, 615–624. [Google Scholar] [CrossRef]
  28. Ahribesh, A.A.; Lazarević, S.; Janković-Častvan, I.; Jokić, B.; Spasojević, V.; Radetić, T.; Janaćković, Đ.; Petrović, R. Influence of the synthesis parameters on the properties of the sepiolite-based magnetic adsorbents. Powder Technol. 2017, 305, 260–269. [Google Scholar] [CrossRef]
  29. Silva, M.R.; Lecus, A.; Gajdardziska-Josifovska, M.; Schofield, M.; Virnoche, M.; Chang, J.; Chen, J.; Garman, D. Graphene-oxide loading on natural zeolite particles for enhancement of adsorption properties. RSC Adv. 2020, 10, 4589–4597. [Google Scholar] [CrossRef] [Green Version]
  30. Zhang, S.; Wang, H.; Liu, J.; Bao, C. Measuring the specific surface area of monolayer graphene oxide in water. Mater. Lett. 2020, 261, 127098. [Google Scholar] [CrossRef]
  31. Ramesha, G.K.; Vijaya Kumara, A.; Muralidhara, H.B.; Sampath, S. Graphene and graphene oxide as effective adsorbents toward anionic and cationic dyes. J. Colloid Interface Sci. 2011, 361, 270–277. [Google Scholar] [CrossRef]
  32. Yang, Z.; Yan, H.; Yang, H.; Li, H.; Li, A.; Cheng, R. Flocculation performance and mechanism of graphene oxide for removal of various contaminants from water. Water Res. 2013, 47, 3037–3046. [Google Scholar] [CrossRef] [PubMed]
  33. Gao, Y.; Li, Y.; Zhang, L.; Huang, H.; Hu, J.; Shah, S.M.; Su, X. Adsorption and removal of tetracycline antibiotics from aqueous solution by graphene oxide. J. Colloid Interface Sci. 2012, 368, 540–546. [Google Scholar] [CrossRef]
  34. Chen, H.; Gao, B.; Li, H. Removal of sulfamethoxazole and ciprofloxacin from aqueous solutions by graphene oxide. J. Hazard. Mater. 2015, 282, 201–207. [Google Scholar] [CrossRef]
  35. Wang, F.; Yang, B.; Wang, H.; Song, Q.; Tan, F.; Cao, Y. Removal of ciprofloxacin from aqueous solution by a magnetic chitosan grafted graphene oxide composite. J. Mol. Liq. 2016, 222, 188–194. [Google Scholar] [CrossRef]
  36. Sabbagh, N.; Tahvildari, K.; Mehrdad Sharif, A.A. Application of chitosan-alginate bio composite for adsorption of malathion from wastewater: Characterization and response surface methodology. J. Contam. Hydrol. 2021, 242, 103868. [Google Scholar] [CrossRef]
  37. Bhattacharya, S. Central composite design for response surface methodology and its application in pharmacy. In Response Surface Methodology in Engineering Science; Kayaroganam, P., Ed.; IntechOpen Limited: London, UK, 2021; pp. 1–19. [Google Scholar] [CrossRef]
  38. Coelho, A. TOPAS-Academic 4.1; Coelho Software: Brisbane, Australia, 2007. [Google Scholar]
  39. Ming, D.W.; Dixon, J.B. Quantitative determination of clinoptilolite in soils by a cation-exchange capacity method. Clays Clay Miner. 1987, 35, 463–468. [Google Scholar] [CrossRef]
  40. Rajic, N.; Stojakovic, D.; Jovanovic, M.; Logar, N.Z.; Mazaj, M.; Kaucic, V. Removal of nickel(II) ions from aqueous solutions using the natural clinoptilolite and preparation of nano-NiO on the exhausted clinoptilolite. Appl. Surf. Sci. 2010, 257, 1524–1532. [Google Scholar] [CrossRef]
  41. Stojakovic, D.; Milenkovic, J.; Daneu, N.; Rajic, N. A study of the removal of copper ions from aqueous solution using clinoptilolite from Serbia. Clays Clay Miner. 2012, 59, 277–285. [Google Scholar] [CrossRef]
  42. Pati, S.S.; Kalyani, S.; Mahendran, V.; Philip, J. Microwave assisted synthesis of magnetite nanoparticles. J. Nanosci. Nanotechnol. 2014, 14, 5790–5797. [Google Scholar] [CrossRef] [PubMed]
  43. Iskandar, F.; Fitriani, P.; Merissa, S.; Mukti, R.R.; Khairurrijal; Abdullah, M. Fe3O4/zeolite nanocomposites synthesized by microwave assisted coprecipitation and its performance in reducing viscosity of heavy oil. In AIP Conference Proceedings; American Institute of Physics Inc.: Melville, NY, USA, 2014; Volume 1586, pp. 132–135. [Google Scholar]
  44. Muhamad, K.S.S.K.; Mohamed, F.; Radiman, S.; Hamzah, A.; Sarmani, S.; Siong, K.K.; Yasir, M.S.; Rahman, I.A.; Rosli, N.R.A.M. Synthesis and characterization of exfoliated graphene oxide. In AIP Conference Proceedings; American Institute of Physics Inc.: Melville, NY, USA, 2016; Volume 1784. [Google Scholar]
  45. Kalebić, B.; Pavlović, J.; Dikić, J.; Rečnik, A.; Gyergyek, S.; Škoro, N.; Rajić, N. Use of natural clinoptilolite in the preparation of an efficient adsorbent for ciprofloxacin removal from aqueous media. Minerals 2021, 11, 518. [Google Scholar] [CrossRef]
  46. Awwad, N.S.; Eed, E.M.; el Askary, A.; Ibrahium, H.A.; Moustapha, M.E.; Ahmed, M.K. Development of nanocomposite based on hydroxyapatite/hematite/graphene oxide for medical applications. J. Mater. Res. Technol. 2022, 18, 4340–4352. [Google Scholar] [CrossRef]
  47. Krishnamoorthy, K.; Veerapandian, M.; Yun, K.; Kim, S.J. The Chemical and structural analysis of graphene oxide with different degrees of oxidation. Carbon 2013, 53, 38–49. [Google Scholar] [CrossRef]
  48. Joos, A.; Rümenapp, C.; Wagner, F.E.; Gleich, B. Characterisation of iron oxide nanoparticles by Mössbauer spectroscopy at ambient temperature. J. Magn. Magn. Mater. 2016, 399, 123–129. [Google Scholar] [CrossRef]
  49. Schwaminger, S.P.; Bauer, D.; Fraga-García, P.; Wagner, F.E.; Berensmeier, S. Oxidation of magnetite nanoparticles: Impact on surface and crystal properties. CrystEngComm 2017, 19, 246–255. [Google Scholar] [CrossRef] [Green Version]
  50. Kozakova, Z.; Kuritka, I.; Kazantseva, N.E.; Babayan, V.; Pastorek, M.; Machovsky, M.; Bazant, P.; Saha, P. The formation mechanism of iron oxide nanoparticles within the microwave-assisted solvothermal synthesis and its correlation with the structural and magnetic properties. Dalton Trans. 2015, 44, 21099–21108. [Google Scholar] [CrossRef] [Green Version]
  51. Gahrouei, Z.E.; Imani, M.; Soltani, M.; Shafyei, A. Synthesis of iron oxide nanoparticles for hyperthermia application: Effect of ultrasonic irradiation assisted co-precipitation route. Adv. Natural Sci. Nanosci. Nanotechnol. 2020, 11, 025001. [Google Scholar] [CrossRef]
  52. Saber Braim, F.; Noor Ashikin Nik Ab Razak, N.; Abdul Aziz, A.; Qasim Ismael, L.; Kayode Sodipo, B. Ultrasound assisted chitosan coated iron oxide nanoparticles: Influence of ultrasonic irradiation on the crystallinity, stability, toxicity and magnetization of the functionalized nanoparticles. Ultrason. Sonochem. 2022, 88, 106072. [Google Scholar] [CrossRef]
  53. Sohrabi, N.; Mohammadi, R.; Ghassemzadeh, H.R.; Heris, S.S.S. Equilibrium, kinetic and thermodynamic study of diazinon adsorption from water by clay/GO/Fe3O4: Modeling and optimization based on response surface methodology and artificial neural network. J. Mol. Liq. 2021, 328, 115384. [Google Scholar] [CrossRef]
  54. Yu, Y.; Murthy, B.N.; Shapter, J.G.; Constantopoulos, K.T.; Voelcker, N.H.; Ellis, A.V. Benzene carboxylic acid derivatized graphene oxide nanosheets on natural zeolites as effective adsorbents for cationic dye removal. J. Hazard. Mater. 2013, 260, 330–338. [Google Scholar] [CrossRef]
  55. Wojciechowska, A.; Lendzion-Bielun, Z. Synthesis and characterization of magnetic nanomaterials with adsorptive properties of arsenic ions. Molecules 2020, 25, 4117. [Google Scholar] [CrossRef]
  56. Kouvelos, E.; Kesore, K.; Steriotis, T.; Grigoropoulou, H.; Bouloubasi, D.; Theophilou, N.; Tzintzos, S.; Kanelopoulos, N. High pressure N2/CH4 adsorption measurements in clinoptilolites. Micropor. Mesopor. Mater. 2007, 99, 106–111. [Google Scholar] [CrossRef]
  57. Jevtić, S.; Arčon, I.; Rečnik, A.; Babić, B.; Mazaj, M.; Pavlović, J.; Matijaševic, D.; Nikšić, M.; Rajić, N. The iron(III)-modified natural zeolitic tuff as an adsorbent and carrier for selenium oxyanions. Micropor. Mesopor. Mater. 2014, 197, 92–100. [Google Scholar] [CrossRef]
  58. Lu, X.F.; Chen, X.Y.; Zhou, W.; Tong, Y.X.; Li, G.R. α-Fe2O3@PANI core-shell nanowire arrays as negative electrodes for asymmetric supercapacitors. ACS Appl. Mater. Interfaces 2015, 7, 14843–14850. [Google Scholar] [CrossRef] [PubMed]
  59. Johra, F.T.; Lee, J.W.; Jung, W.G. Facile and safe graphene preparation on solution based platform. J. Ind. Eng. Chem. 2014, 20, 2883–2887. [Google Scholar] [CrossRef]
  60. Tam, N.T.M.; Liu, Y.; Bashir, H.; Yin, Z.; He, Y.; Zhou, X. Efficient removal of diclofenac from aqueous solution by potassium ferrate-activated porous graphitic biochar: Ambient condition influences and adsorption mechanism. Int. J. Environ. Res. Public Health 2019, 17, 291. [Google Scholar] [CrossRef] [Green Version]
  61. Alver, B.E.; Sakizci, M.; Yörükoǧullari, E. Investigation of clinoptilolite rich natural zeolites from Turkey: A combined XRF, TG/DTG, DTA and DSC study. J. Therm. Anal. Calorim. 2010, 100, 19–26. [Google Scholar] [CrossRef]
  62. Carotenuto, G.; Camerlingo, C. Kinetic investigation of water physisorption on natural clinoptilolite at room temperature. Micropor. Mesopor. Mater. 2020, 302, 110238. [Google Scholar] [CrossRef]
  63. Hidayat, R.; Wahyuningsih, S.; Ramelan, A.H. Simple synthesis of RGO (reduced graphene oxide) by thermal reduction of GO (graphene oxide). In IOP Conference Series: Materials Science and Engineering; Institute of Physics Publishing: Bristol, UK, 2020; Volume 858. [Google Scholar]
  64. Morais, A.; Alves, J.P.C.; Lima, F.A.S.; Lira-Cantu, M.; Nogueira, A.F. Enhanced photovoltaic performance of inverted hybrid bulk-heterojunction solar cells using TiO2/reduced graphene oxide films as electron transport layers. J. Photonics. Energy 2015, 5, 057408. [Google Scholar] [CrossRef]
  65. Shafeeyan, M.S.; Wan Daud, W.M.A.; Houshmand, A.; Arami-Niya, A. The application of response surface methodology to optimize the amination of activated carbon for the preparation of carbon dioxide adsorbents. Fuel 2012, 94, 465–472. [Google Scholar] [CrossRef]
  66. Thy, L.T.M.; Linh, N.T.C.; Tram, N.T.T.; Tu, T.H.; Tai, L.T.; Khang, P.T.; Nam, H.M.; Hieu, N.H.; Phong, M.T. Fabrication and response surface methodology for the adsorption of nickel ferrite-graphene oxide nanocomposite for the removal of Methylene Blue from water. J. Nanomater. 2021, 2021, 4636531. [Google Scholar] [CrossRef]
  67. Zhang, J.; Yan, M.; Sun, G.; Liu, K. An environment-friendly Fe3O4@CFAS porous ceramic: Adsorption of Cu(II) ions and process optimisation using response surface methodology. Ceram. Int. 2021, 47, 8256–8264. [Google Scholar] [CrossRef]
  68. Tian, J.; Guan, J.; Gao, H.; Wen, Y.; Ren, Z. The adsorption and mass-transfer process of cationic red X-GRL dye on natural zeolite. Water Sci. Technol. 2016, 73, 2119–2131. [Google Scholar] [CrossRef] [PubMed]
  69. Kim, D.W.; Han, H.; Kim, H.; Guo, X.; Tsapatsis, M. Preparation of a graphene oxide/faujasite composite adsorbent. Micropor. Mesopor. Mater. 2018, 268, 243–250. [Google Scholar] [CrossRef]
  70. Mutavdžić Pavlović, D.; Ćurković, L.; Grčić, I.; Šimić, I.; Župan, J. Isotherm, kinetic, and thermodynamic study of ciprofloxacin sorption on sediments. Environ. Sci. Pollut. Res. 2017, 24, 10091–10106. [Google Scholar] [CrossRef] [PubMed]
  71. Langmuir, I. The adsorption of gases on plane surface of glass, mica, and platinum. J. Am. Chem. Soc. 1918, 40, 1361–1403. [Google Scholar] [CrossRef]
  72. Weber, W.J., Jr.; Morris, J.C. Advances in water pollution research: Removal of biologically resistant pollutants from waste waters by adsorption. In Proceedings of the International Conference on Water Pollution Symposium, London, UK, 3–7 September 1962; Volume 2, p. 231. [Google Scholar]
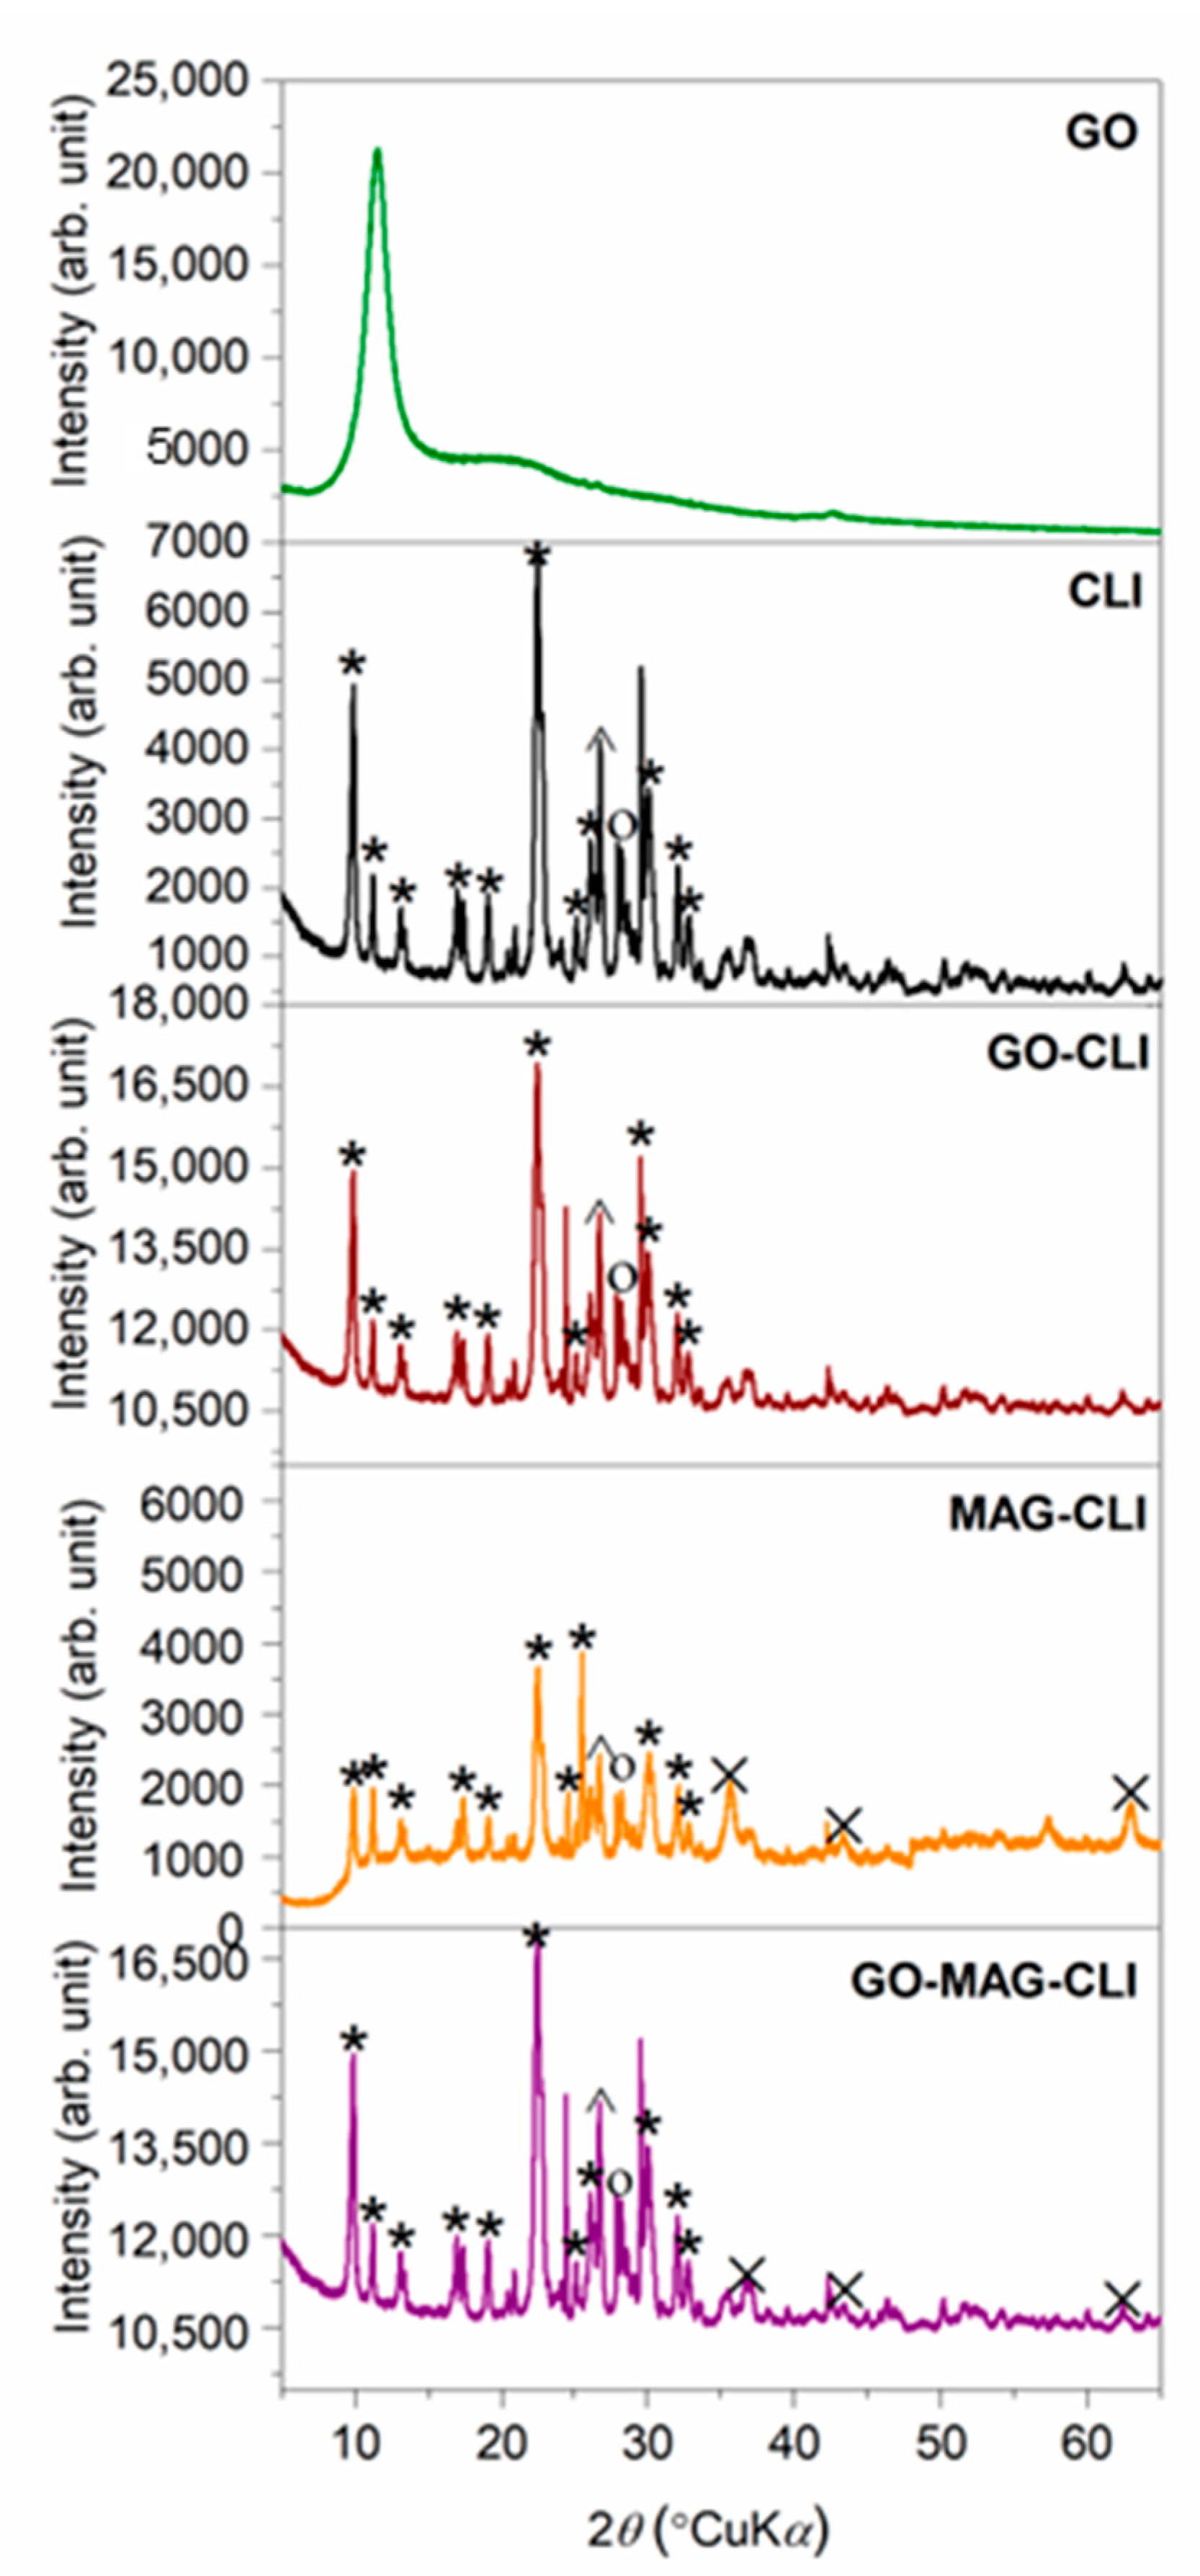
Figure 1. PXRD patterns of CLI, MAG-CLI, GO-MAG-CLI, GO-CLI, and GO (*—clinoptilolite; ˄—quartz; ○—feldspar; ×—maghemite).
Nanomaterials 13 00740 g001
Figure 2. SEM images of (a) CLI, (b) MAG-CLI, and (c) GO-MAG-CLI.
Nanomaterials 13 00740 g002
Figure 3. 57Fe Mössbauer spectra of (a) MAG and (b) MAG-CLI samples (•–experimental data). The insets show the distribution of Bhf.
Nanomaterials 13 00740 g003
Figure 4. Raman spectra of GO and GO-CLI.
Nanomaterials 13 00740 g004
Figure 5. (a) Nitrogen adsorption/desorption isotherms and (b) pore size distributions.
Nanomaterials 13 00740 g005
Figure 6. High-resolution XPS spectra of the (a) Fe 2p region of MAG-CLI and (b) C 1s region of GO-MAG-CLI samples.
Nanomaterials 13 00740 g006
Figure 7. TG (dash) and DTG (solid) curves of (a) CLI, (b) MAG-CLI, (c) GO-MAG-CLI, and (d) GO-CLI.
Nanomaterials 13 00740 g007
Figure 8. Zeta potential as a function of pH for CLI, MAG-CLI, and GO-MAG-CLI.
Nanomaterials 13 00740 g008
Figure 9. The magnetization curves of MAG, CLI, and GO-MAG-CLI.
Nanomaterials 13 00740 g009
Figure 10. (a) A normal probability plot of residuals and (b) studentized residuals vs. predicted values plot.
Nanomaterials 13 00740 g010
Figure 11. A 3D representation of response surface plots for the CLI adsorbent at a contact time of 20 min for (a) 10 °C, (b) 17.5 °C, and (c) 25 °C.
Nanomaterials 13 00740 g011
Figure 12. A 3D representation of response surface plots for the MAG-CLI adsorbent at a contact time of 20 min for (a) 10 °C, (b) 17.5 °C, and (c) 25 °C.
Nanomaterials 13 00740 g012
Figure 13. A 3D representation of response surface plots for the GO-MAG-CLI adsorbent at a contact time of 20 min for (a) 10 °C, (b) 17.5 °C, and (c) 25 °C.
Nanomaterials 13 00740 g013
Figure 14. The adsorption isotherms for CIP on (a) CLI, (b) MAG-CLI, and (c) GO-MAG-CLI; qe is the amount of the adsorbed CIP (mg per 1 g of the adsorbents) and Ce is the CIP solution concentration at equilibrium.
Nanomaterials 13 00740 g014
Figure 15. Adsorption kinetics at different temperatures for CIP on (a) CLI, (b) MAG-CLI, and (c) GO-MAG-CLI; qt is the amount of the adsorbed CIP (mg CIP g−1 CLI) after time t.
Nanomaterials 13 00740 g015
Table 1. Design parameters and response variables selected for the experiment.
FactorUnitsLevels
−10+1
X1: A—Initial CIP concentrationmg dm−31532.550
X2: B—pH 579
X3: C—Temperature°C1017.525
X4: D—Contact timemin512.520
E[1] E[2]
X5: E—AdsorbentCategoricalCLIMAG-CLIGO-MAG-CLI
RESPONSE
Adsorption capacity (q)mg g−1
Table 2. The phase analysis of MAG and MAG-CLI samples obtained by quantitative XRD analysis using the RIR method.
PhaseAmount (wt.%)
MAG
Maghemite (γ-Fe2O3)38.7
Goethite (FeO(OH))17.0
Magnetite (Fe3O4)10.1
Hematite (α-Fe2O3)8.4
MAG-CLI
Clinoptilolite (CLI)69.4
Maghemite (γ-Fe2O3)23.5
Table 3. Mössbauer parameters for the MAG nanoparticles.
Componentδ1, mm s−1ΔEQ 2, mm s−1Bhf 3, TArea, %Phase
Sextet0.37–0.2051.539.5α−Fe2O3
Sextet0.37–0.2638.0114.6α−FeOOH
Sextet0.69
0.25
0.06
–0.04
46.19
48.69
6.6
5.2
Fe3O4 octahedral
Fe3O4 tetrahedral
Sextet0.330.0029.71 *64.0γ−Fe2O3
1 Isomer shift relative to α–Fe; 2 quadrupole splitting; 3 hyperfine magnetic field.
Table 4. Mössbauer parameters for the MAG-CLI sample.
Componentδ1, mm s−1ΔEQ 2, mm s−1Bhf 3, TArea, %Assignation
Sextet0.37–0.0336.99 *68.6γ−Fe2O3
Doublet0.340.6631.4γ−Fe2O3
superparamagnetic
1 Isomer shift relative to α–Fe; 2 quadrupole splitting; 3 hyperfine magnetic field.
Table 5. Textural properties of CLI, GO-CLI, MAG-CLI, and GO-MAG-CLI samples.
SampleSBET 1, m2 g−1Vtot 2, cm3 g−1
CLI24.50.099
GO-CLI37.40.120
MAG-CLI52.10.180
GO-MAG-CLI64.80.219
1 Specific surface area; 2 total pore volume.
Table 6. The relative contents of elements (at.%) in the studied samples as determined by the XPS analysis.
ElementCLIMAG-CLIGO-MAG-CLI
at.%
O60.660.648.8
C4.718.527.2
Fe5.74.2
Si26.818.516.3
Al5.43.92.2
Ca1.81.60.9
K0.90.60.4
Table 7. Optimal conditions for the CIP adsorption onto the prepared CLI-based adsorbents.
AdsorbentOptimal Solution
CLIC0(CIP) = 50 mg dm−3
pH = 6.41
T = 9.85 °C
t = 18.95 min
MAG-CLIC0(CIP) = 50 mg dm−3
pH = 5
T = 20.98 °C
t = 13.70 min
GO-MAG-CLIC0(CIP) = 48.47 mg dm−3
pH = 5.10
T = 24.78 °C
t = 19.20 min
Table 8. Equations of the used two-parameter adsorption isotherm models [71].
Isotherm ModelEquation *Model Parameters
Langmuir1/qe = [1/(QmaxbL)] × 1/Ce + 1/QmaxQmax, bL
Freundlichlogqe = logKF + (1/n) logCeKF, n
Note: * qe is the amount of CIP adsorbed at equilibrium (mg g−1); Ce is the equilibrium liquid-phase concentration (mg dm−3). In the Langmuir isotherm model, Qmax (mg g−1) and bL (dm3 mg−1) are the Langmuir constants related to the maximum adsorption capacity and adsorption energy, respectively. In Freundlich isotherm model, KF (mg g−1(dm3 mg−1)1/n) and n are isotherm parameters characterizing the adsorption capacity and intensity, respectively.
Table 9. The parameters obtained by the applied adsorption isotherm models for the adsorption of CIP onto CLI, MAG-CLI, and GO-MAG-CLI; R2 is the correlation coefficient.
Langmuir Isotherm ModelFreundlich Isotherm Model
T, °CQmax, mg g−1bL, dm3 mg−1R2KF, mg g−1(dm3 mg−1)1/nnR2
CLI1015.150.140.99852.422.400.9838
1511.970.110.99992.281.920.9829
2012.600.230.99903.302.570.9981
MAG-CLI1014.910.150.97642.521.860.9679
1521.250.050.98131.441.510.9792
2021.000.080.99222.051.580.9967
GO-MAG-CLI1017.430.120.97792.281.610.9148
1547.910.020.97811.471.300.9707
2041.780.020.94201.321.360.9192
Table 10. Rate constants for Lagergren’s pseudo-second-order kinetic model for the adsorption of CIP on CLI, MAG-CLI, and GO-MAG-CLI (R2 is the correlation coefficient of the linear regression).
Lagergren’s Pseudo-Second-Order Rate Parameters
CLIMAG-CLIGO-MAG-CLI
C0, mg dm−3T, °Ck2 1, g mg−1 min−1qe 2, mg g−1R2k2, g mg−1 min−1qe, mg g−1R2k2, g mg−1 min−1qe, mg g−1R2
15100.17513.910.99920.31333.430.99950.06783.920.9994
150.20793.890.99920.24452.860.99980.10913.910.9998
200.20064.370.99910.32434.260.99990.21023.910.9999
25100.18985.400.99990.11595.590.99990.08756.060.9996
150.35114.140.99990.13105.080.99910.13174.580.9999
200.25275.800.99990.12585.410.99690.19774.890.9998
50100.33909.400.99950.13598.600.99990.019615.430.9991
150.516410.150.99990.08617.840.99980.062013.250.9998
200.064410.340.99980.06739.700.99790.032912.450.9989
1 Pseudo-second-order rate constant; 2 adsorption capacity.
Disclaimer/Publisher’s Note: The statements, opinions and data contained in all publications are solely those of the individual author(s) and contributor(s) and not of MDPI and/or the editor(s). MDPI and/or the editor(s) disclaim responsibility for any injury to people or property resulting from any ideas, methods, instructions or products referred to in the content.