Abstract
Ti-bearing blast furnace slag (TBFS) can be converted to impurity bearing TiOSO4 solution for TiO2 pigment production. However, the H2TiO3 (MTA) hydrolyzed from the solution has too high Fe/V impurity to meet the standard for TiO2 pigment. In this study, we found that Fe3+ and V3+ were easily hydrolyzed and entered the MTA lattice, and hence could not be removed by washing. Furthermore, Fe/V was hard to co-remove by the traditional reduction method. Therefore, the Fe/V non-hydrolysis condition (Ti3+ = 0.01 M, F = 3.0, T = 130 °C; Ti3+ = 0.01 M, F = 3.5, T = 150 °C) was determined by thermodynamic calculations. However, at these conditions, the Ti hydrolysis ratio was low or the reaction time was long. Therefore, a new two-step hydrothermal hydrolysis process was proposed. Step 1 (130 °C, 2 h) ensured the non-hydrolysis of V3+, and Ti was partially hydrolyzed to increase the H2SO4 concentration. Step 2 (150 °C, 2 h) ensured a high Ti hydrolysis ratio (>0.95) and short total reaction time (4–6 h). Finally, a high-purity MTA was obtained (Fe = 21 ppm, V = 145 ppm). These results provide new insights into the control of the hydrolysis of impurity ions in solutions and help to optimize the process of TiO2 pigment preparation from TBFS.
1. Introduction
Titanium-bearing blast furnace slag (TBFS) is a byproduct during the smelting of vanadium-bearing titanomagnetite, which contains up to 23 wt.% TiO2 and various impurities (Ca, Si, Al, Mg, Fe, V, Mn) [1,2]. In China, TBFS production is more than 5 million t/a. The high content of TiO2 reduces the CaO activity, which inhibits applications in cement production, resulting in a low utilization rate (<3%) and significant slag accumulation (80–100 million tons in total) [2,3].
Extraction of valuable elements by hydrometallurgy has received widespread attention due to its low cost [4,5,6]. Recently, the extraction of Ti from TBFS by the sulfuric acid roasting method has received wide attention because of its energy saving, low cost, and high Ti recovery rate [7,8,9,10]. In this method, TBFS is roasted with concentrated H2SO4 (80–95%) at 100–300 °C, then leached and filtered to form an impurities-bearing TiOSO4 solution, where the extraction of Ti is ~88% [7,11]. Like the sulfate process for TiO2 pigment production, the impurities-bearing TiOSO4 solution hydrolyzes to form H2TiO3 (MTA). Then MTA is calcined to form TiO2 pigment [11,12]. However, due to the low concentration of TiOSO4 (0.6–0.8 mol·L−1, vs. 2.4–2.8 mol·L−1 in the industry) and the various impurities (Al, Mg, Fe, V, Mn), the production of pigment-grade TiO2 has not at this time been achieved [9,11,12].
One important reason is that some impurity ions hydrolyze at high temperatures and co-precipitate with MTA, which cannot be removed by washing [13,14]. The color-developing impurity elements in the impurities-bearing TiOSO4 solution include Mn, Fe, and V, which all lower the whiteness of pigment [15]. The occurrence of these elements is as the dissolved species Mn2+, Fe3+/Fe2+, and VO2+/V3+, respectively. Among them, Fe3+ and V3+ are easily hydrolyzed [12,16,17]. However, there are strict requirements for the content of both Fe (30 ppm) and V (7 ppm) in MTA [12,18].
For the removal of Fe and V from MTA, the method used in the sulfate process is to reduce Fe3+ to Fe2+ and use high concentrations of H2SO4 to inhibit the hydrolysis of V3+ [12,18]. However, the impurities-bearing TiOSO4 solution from TBFS has a low concentration of H2SO4 and more V3+ [11], so the V3+ can more readily hydrolyze. If V3+ is oxidized to VO2+, this will lead to the formation and possible hydrolysis of Fe3+, so it is difficult to achieve acceptable co-removal of Fe/V. Therefore, it is necessary to increase the H2SO4 concentration by vacuum evaporation, which significantly increases the energy consumption [19,20]. Another viable option is to separate the Fe/V from the original solution, such as via adsorption, extraction, etc. Elnagar et al. [21] extracted trace Fe3+ (0.03–80 mg/L) from titanium concentrates with organic complexation and solvent extraction (efficiency > 98.50%). Middlemas et al. [22] proposed a new method for the production of titanium dioxide pigment, which used solvent extraction to remove Fe3+ and finally produce good quality anatase pigment (Fe < 20 ppm). Peng et al. [23] adsorbed vanadium(V) with melamine, resulting in 99.89% removal. However, these methods have high agent consumption, are long processes, and have increased costs.
In this study, for the MTA made from impurity bearing TiOSO4 solution, we found the Fe/V impurity could not be co-removed by the acid neutralization followed by solution reduction method traditionally. Therefore, we determined the conditions for non-hydrolysis of Fe/V by thermodynamic calculation. However, at these conditions, the Ti hydrolysis ratio was low and the reaction time was long. Therefore, we provided a new simplified two-step hydrolysis process. Without acid neutralization, Ti3+ in the original solution inhibited the hydrolysis of Fe. Step 1 (130 °C, 2 h) ensured the non-hydrolysis of V and generated enough free H2SO4. Step 2 (150 °C, 2 h) promoted the hydrolysis of TiOSO4. Finally, high purity MTA was obtained (Fe = 21 ppm, V = 145 ppm) with a high Ti hydrolysis ratio (>0.95) and reasonable reaction time (4–6 h).
2. Materials and Methods
2.1. Materials and Reagents
TBFS was obtained from the Panzhihua Iron & Steel (Group) Co., Ltd. (Panzhihua, China). The TBFS composition determined by X-ray fluorescence spectroscopy (XRF) is shown in Table 1. Commercial chemicals of analytical grade and deionized water with a resistivity >18 MΩ·cm−1 were used in the experiments. Titanyl sulfate-sulfuric acid hydrate (TiOSO4·xH2O·yH2SO4, 93%), aluminum sulfate octa decahydrate (Al2(SO4)3·18H2O, 99%), and anhydrous magnesium sulfate (MgSO4, 99%) were purchased from Shanghai Macklin Biochemical Co., Ltd. (Shanghai, China). Ammonium iron (III) sulfate dodecahydrate (NH4FeSO4·12H2O, 99%), calcium oxide (CaO, 99%), methyl orange (indicator grade), and ammonium thiocyanate (NH4SCN, 99%) were purchased from Shanghai Macklin Biochemical Co., Ltd. (Shanghai, China). Sulfuric acid (H2SO4, 98%), aluminum powder (Al, 99%), and sodium hydroxide (NaOH, 99%) were purchased from Beijing Tong Guang Fine Chemicals Company (Beijing, China). All of the chemicals were used without any further purification.

Table 1.
The composition of TBFS determined by XRF.
2.2. Experimental Method
The process of making impurity bearing TiOSO4 solution from TBFS was according to our previous research [7,11,24]: TBFS was decomposed by 90% H2SO4 at 150 °C for 1 h to obtain solid mixtures. The mixtures were leached with water at 65 °C for 1 h and filtered to separate the solid (mainly SiO2 and CaSO4) to obtain the impurity bearing TiOSO4 solution. The impurities were sulfates of various impurity ions. The properties of TBFS and the reactions of the TBFS decomposition were studied previously [2,7].
The composition of the solution was determined by using inductively coupled plasma atomic emission spectroscopy (ICP-AES), as shown in Table 2. The F-value is the acidity factor determined as given by Equation (1)
where m is the mass concentration, g/L. The H2SO4 in TiOSO4 refers to the H2SO4 generated by the hydrolysis of TiOSO4. The sum of the two is referred to as the effective H2SO4 in the sulfate process [25]. The effective H2SO4 is determined by 0.5000 mol·L−1 NaOH neutralization titration (methyl orange as the indicator) [11]. The concentration of Ti3+ was determined by titration with 0.1000 mol·L−1 NH4FeSO4 (NH4SCN as the indicator).
Table 2.
The composition of impurity bearing TiOSO4 solution determined by ICP-AES and titration.
The impurity bearing TiOSO4 solution was treated with two different processes. Following the traditional sulfate process, the solution was neutralized by CaO to adjust the F-value = 1.50, then the Ti3+ concentration increased by reacting with Al powder for 1–5 h, and finally thermally hydrolyzed at 110 °C for 4 h at atmospheric pressure. For the new two-step hydrothermal hydrolysis, without any pre-treatment, the solution was sealed in a Teflon-lined autoclave, and firstly hydrothermally hydrolyzed at 110–130 °C for 2–4 h, and then hydrothermally hydrolyzed at 150 °C for 2 h. After hydrolysis, MTA was obtained by filtering. The MTA was washed twice with 5% H2SO4 and twice with deionized water and then dried in an oven at 105 °C for 4 h. Then, the MTA was dissolved in 98% H2SO4 at 250 °C for 0.3–0.5 h, and the clarified solution was diluted by deionized water and used to determine the Fe/V content in the MTA by using ICP-AES.
2.3. Characterization
The element analysis of the power sample was carried out by X-ray fluorescence spectroscopy (XRF, ARL PERFORM X, Thermo Fisher, Waltham, MA, USA). The solution ion concentration was determined by inductively coupled plasma atomic emission spectroscopy (ICP-AES, ARCOS II, Spectro, Kleve, Germany). The phase was identified from measurements using an X-ray diffractometer (Bruker-AXS D8 Advance, Karlsruhe, Germany) with Cu Kα (0.154178 nm) radiation. The surface composition of the samples was examined with an X-ray photoelectron spectrometer (XPS, PHI-5300, PHI, Lafayette, LA, USA) using an Al Kα (1486.6 eV) X-ray source. All spectra were calibrated to the binding energy of the adventitious C 1 s peak at 284.8 eV. The morphology and microstructure of the samples were characterized with a field emission scanning electron microscope (FESEM, JSM 7401F, JEOL, Hitachi, Tokyo, Japan).
3. Results and Discussion
3.1. The Hydrolysis Behavior and Occurrence form of Fe/V in MTA
The main impurity elements of TiOSO4 solution obtained from TBFS were Mg, Al, Fe, V, and Mn, where both Fe and V possibly existed in two states (Fe2+/Fe3+ and V3+/VO2+). Table 3 shows the theoretical pH at the beginning of the hydrolysis of these impurity ions. The precipitation pH was calculated by the ion concentrations and Ksp of the corresponding hydroxides. Al3+, Fe3+, and V3+ had low precipitation pH, which meant they were easy to hydrolysis.
Table 3.
The theoretical pH at the beginning of the impurity ions hydrolysis.
Figure 1a summaries the two processes for the synthesis of MTA from the impurity bearing TiOSO4 solution. Firstly, in order to ensure the hydrolysis ratio would be >95%, CaO slurry was added to neutralize the H2SO4 with a decrease in acidity from F = 3.02 to F = 1.50 (F is the acidity factor defined in Equation (1)). The reduction of the solution acidity promoted the hydrolysis of Fe/V. If the solution was directly hydrolyzed at 110 °C, Fe-MTA was obtained consistent with the hydrolysis of Fe3+. In the sulfate process, Ti3+ was used to reduce the Fe3+ to Fe2+ to inhibit the hydrolysis of Fe and the adsorption of Fe3+ [12]. In order to generate Ti3+, we applied Al reduction (). The added Al did not significantly affect the concentration of Al in the solution. However, if the solution was reduced, V-MTA was formed. The composition of Fe-MTA and V-MTA is shown in Table 4; all the impurity contents are in terms of TiO2 wt.%. Though Al was hydrolyzed, it was colorless and therefore did not affect the pigment quality.
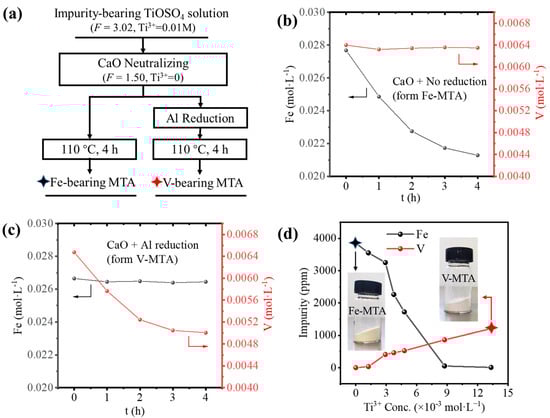
Figure 1.
(a) The two processes for preparing MTA from the impurity bearing TiOSO4 solution. (b) The behavior of Fe/V hydrolysis for the formation of Fe-MTA. (c) The behavior for Fe/V hydrolysis for the formation of V-MTA. (d) Influence of Ti3+ concentration on the Fe/V impurity content in MTA. The black star marks the sample Fe-MTA, and the red star marks the V-MTA.
Table 4.
The impurity content (TiO2 wt.%) of Fe-MTA and V-MTA.
Figure 1b shows the Fe/V hydrolysis behavior in the unreduced solution. The concentration of V was unchanged, while the concentration of Fe was decreasing exponentially. This means the only Fe was hydrolyzed and precipitated with MTA. With the hydrolysis of TiOSO4, the concentration of H2SO4 was increased (), so finally the hydrolysis of Fe was inhibited and the concentration of Fe was unchanged. Figure 1c shows the Fe/V hydrolysis behavior in the Al reduced solution. Though Fe was unhydrolyzed due to Al reduction with an unchanged concentration, V was hydrolyzed and the concentration was decreasing exponentially like Fe. The reason for this was the formation of V3+, as shown in Equations (2)–(4), where E0 is the standard electrode potential of the reactions at 25 °C.
When the solution was unreduced, no Ti3+ was formed, so the solution was in the oxidized state. Fe existed as Fe3+, and V existed as VO2+. Fe3+ was easy to hydrolyze and formed Fe-MTA. When the solution was reduced by Al, Ti3+ was generated, Fe3+ converted to Fe2+, and VO2+ converted to V3+. V3+ was easy to hydrolyze and formed V-MTA. According to the Nernst equation, the concentration of Ti3+ affects the redox potential of the solution and finally determines the concentration of Fe2+/Fe3+ and V3+/VO2+. Therefore, the aim was to find a suitable Ti3+ concentration in the solution for minimal Fe/V hydrolysis, as shown in Figure 1d. The results show that Fe or V in MTA was always >500 ppm at different Ti3+ concentrations, so the Fe/V could not be removed simultaneously by Al reduction.
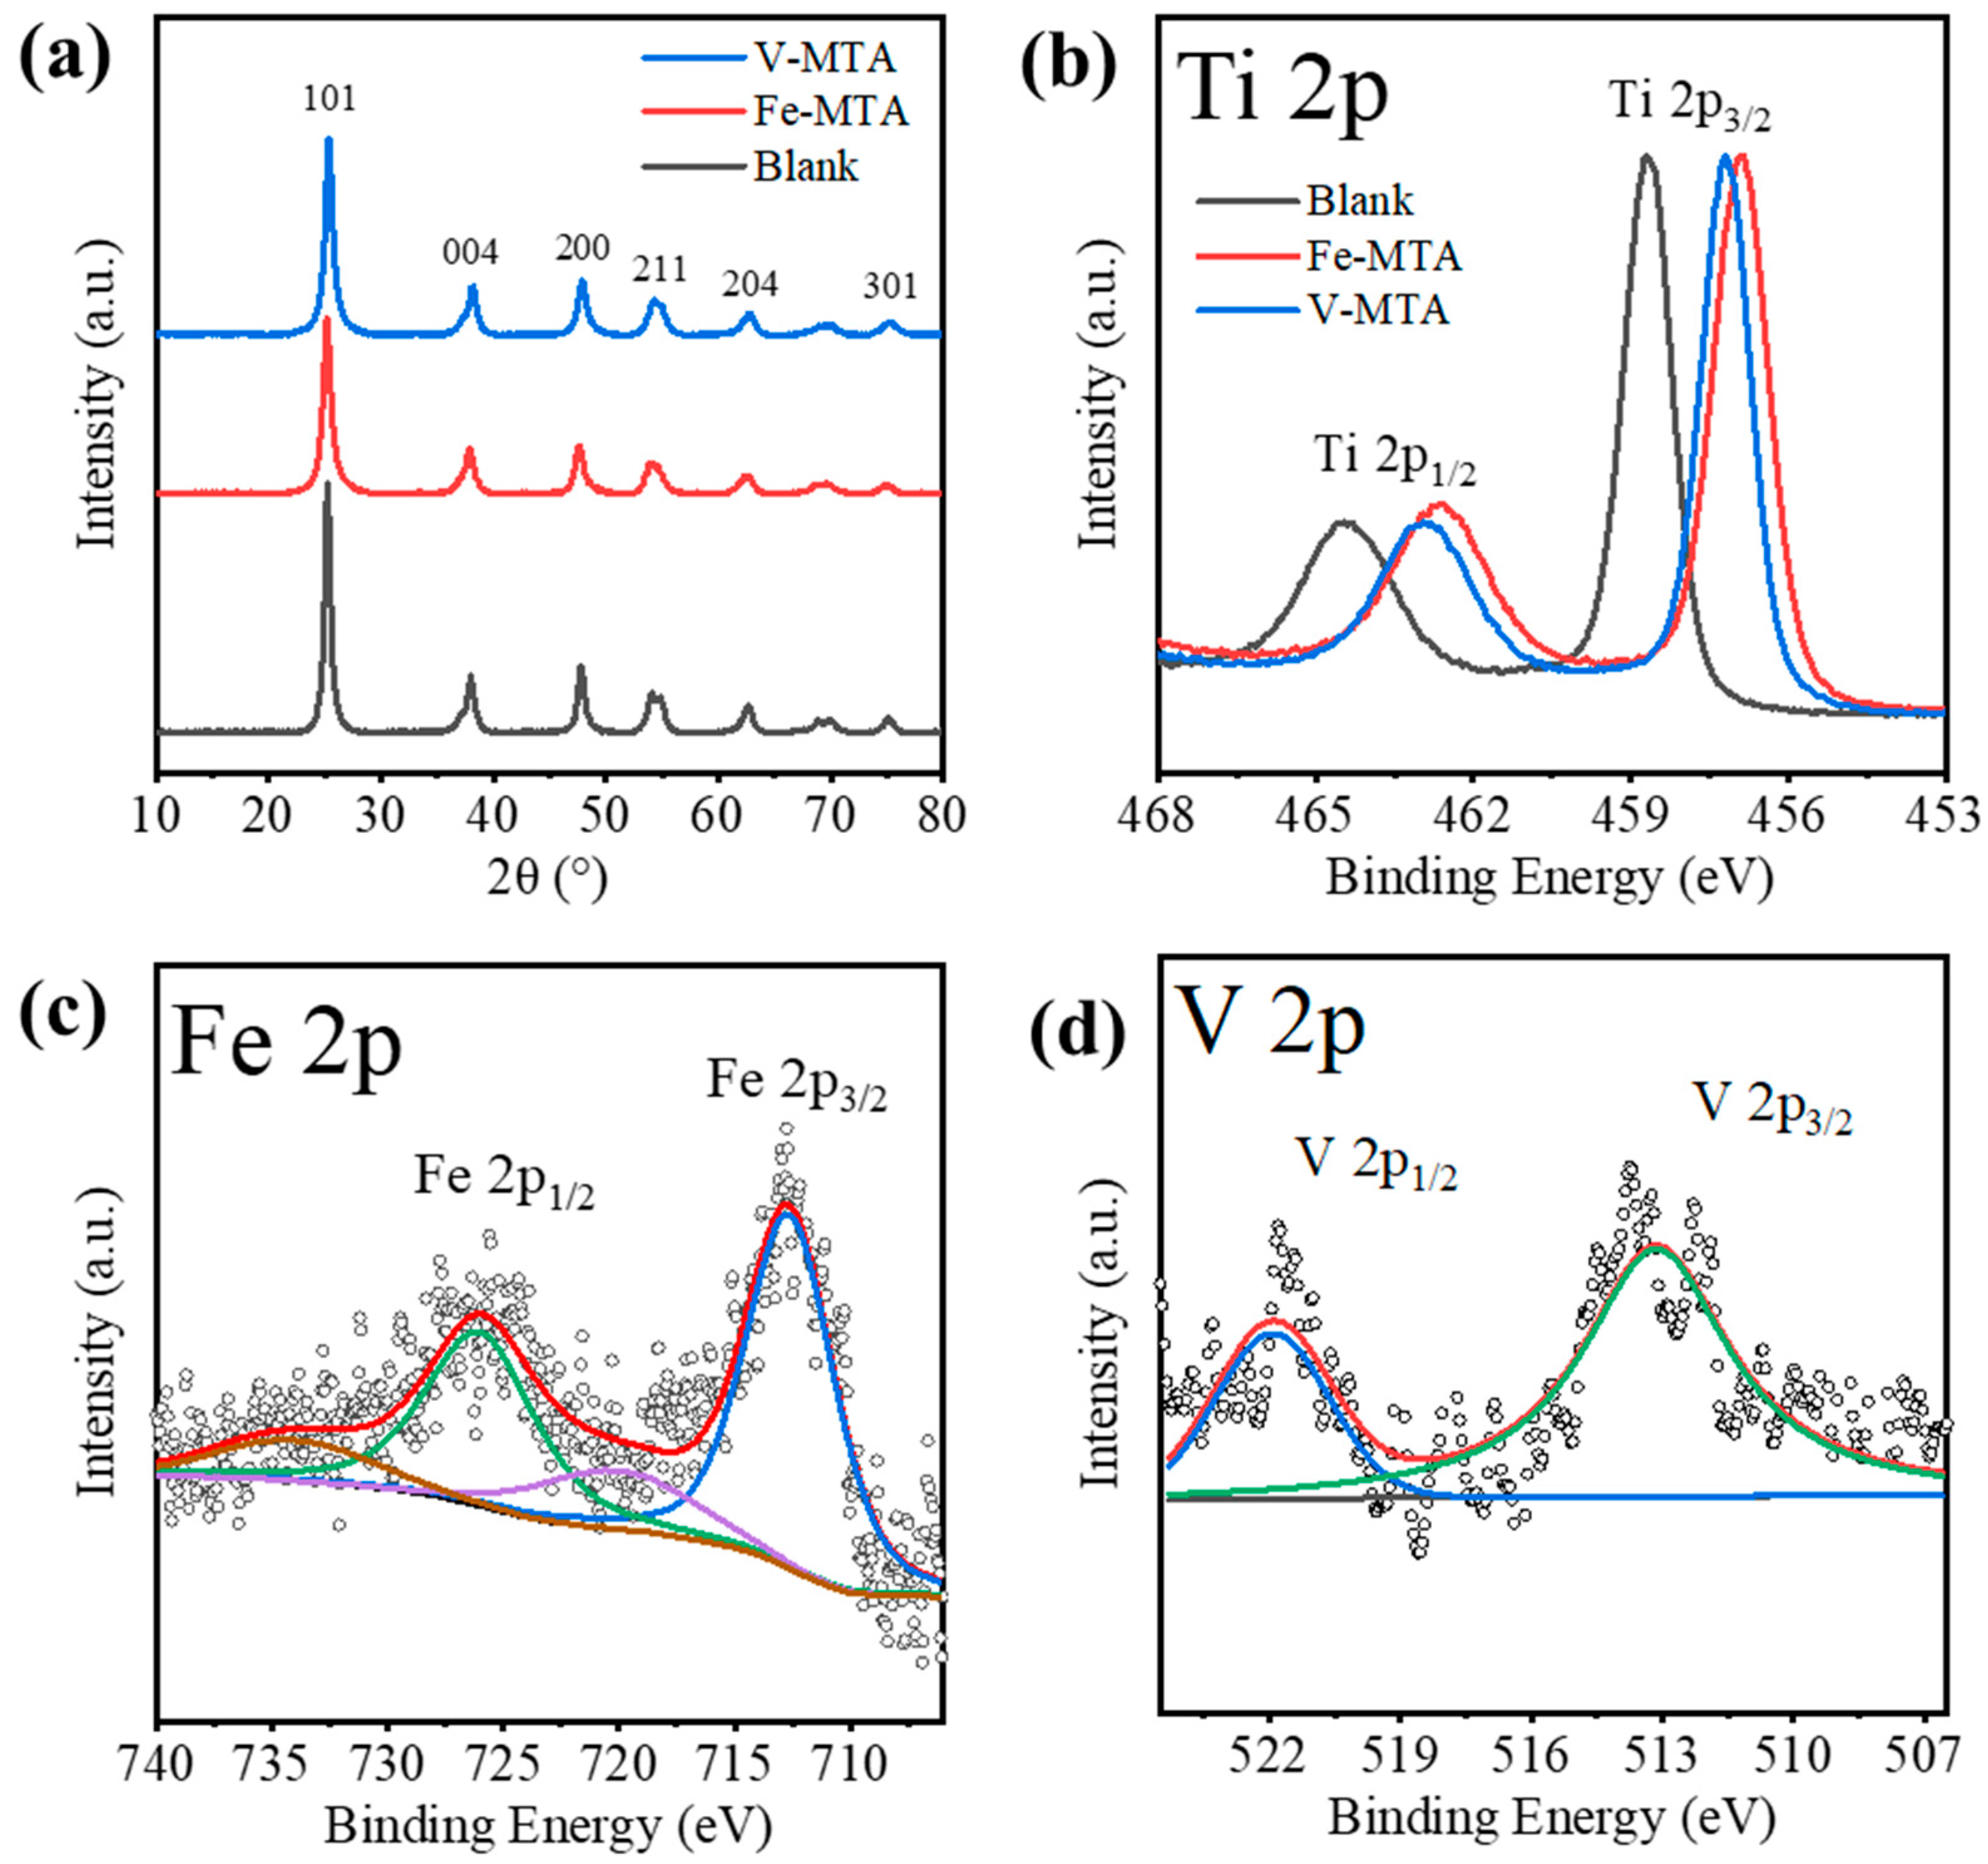
Figure 2a shows the XRD patterns of Fe/V-MTA and blank MTA. The blank MTA was synthesized from the Mg/Al-bearing TiOSO4 solution at the same conditions with Fe-MTA. The solution was prepared from reagents (TiOSO4, MgSO4, Al2(SO4)3) without Fe/V impurities. The crystalline product in these samples was anatase (PDF 21-1272). Table 5 shows the analysis of the (101) peak. Fe/V-MTA had lower diffraction intensity and smaller crystal size than blank MTA, which means the Fe/V in the solution affected the hydrolysis of TiO2+ and inhibited the growth of the anatase nanocrystals in MTA. The changes of 2θ for Fe/V-MTA indicate that Fe/V may have entered the anatase nanocrystals and changed the lattice spacing. Figure 2b shows the XPS Ti 2p spectra of Fe/V-MTA and blank MTA. The peaks at ~465.1 and 459.4 eV of blank MTA were assigned to Ti 2p1/2 and Ti 2p3/2 of the Ti4+ state [26]. For Fe/V-MTA, the negative shift of binding energy ~1.8 eV indicated that some Ti4+ ions were replaced by Fe/V, and the Ti-O-Ti in anatase changed to Ti-O-Fe/V. Figure 2c shows the XPS Fe 2p spectra of Fe-MTA. The peaks centered at ~723.9 and 712.6 eV were assigned to Fe 2p1/2 and Fe 2p3/2 of the Fe (III) species, and the spin–orbit splitting characteristic of Fe3+ corresponded to typical features of Fe(OH)3 [27]. Figure 2d shows the XPS V 2p spectra of V-MTA. The peaks centered at ~521.8 and 514.4 eV were assigned to V 2p1/2 and V 2p3/2 of V3+, which was close to V(OH)3 [28,29]. Therefore, the results indicate that some of the Fe3+/V3+ hydrolyzed with TiO2+ at high temperature and entered the lattice of anatase nanocrystals so these impurities could not be removed by dilute H2SO4 or water.
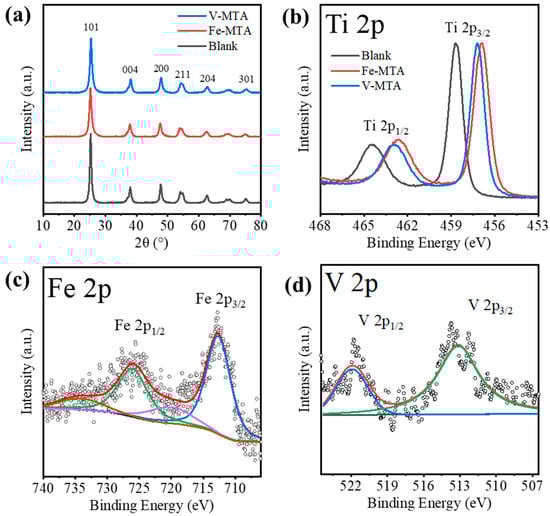
Figure 2.
(a) XRD patterns and (b) XPS Ti 2p spectra of V/Fe/Blank-MTA. (c) XPS Fe 2p spectra of Fe-MTA. (d) XPS V 2p spectra of V-MTA.
Table 5.
The analysis of the anatase (101) peak in XRD patterns.
3.2. Thermodynamic Equilibrium Calculation of the Hydrolysis Process
It has been proposed that Fe/V enters the MTA lattice by hydrolysis with TiO2+, so the key to controlling the impurity content is to inhibit the hydrolysis of Fe3+/V3+. It is known that if a reaction cannot proceed thermodynamically, then kinetically the reaction cannot proceed. Therefore, assessing if the Fe3+/V3+ hydrolysis reaction will happen thermodynamically at different reaction conditions will help to identify the Fe3+/V3+ non-hydrolysis condition. Therefore, a thermodynamic calculation for the hydrolysis process of impurity bearing TiOSO4 solution was carried out. The equilibria of the impurities-bearing TiOSO4 solution for the thermodynamic calculation are given in Equations (5)–(16).
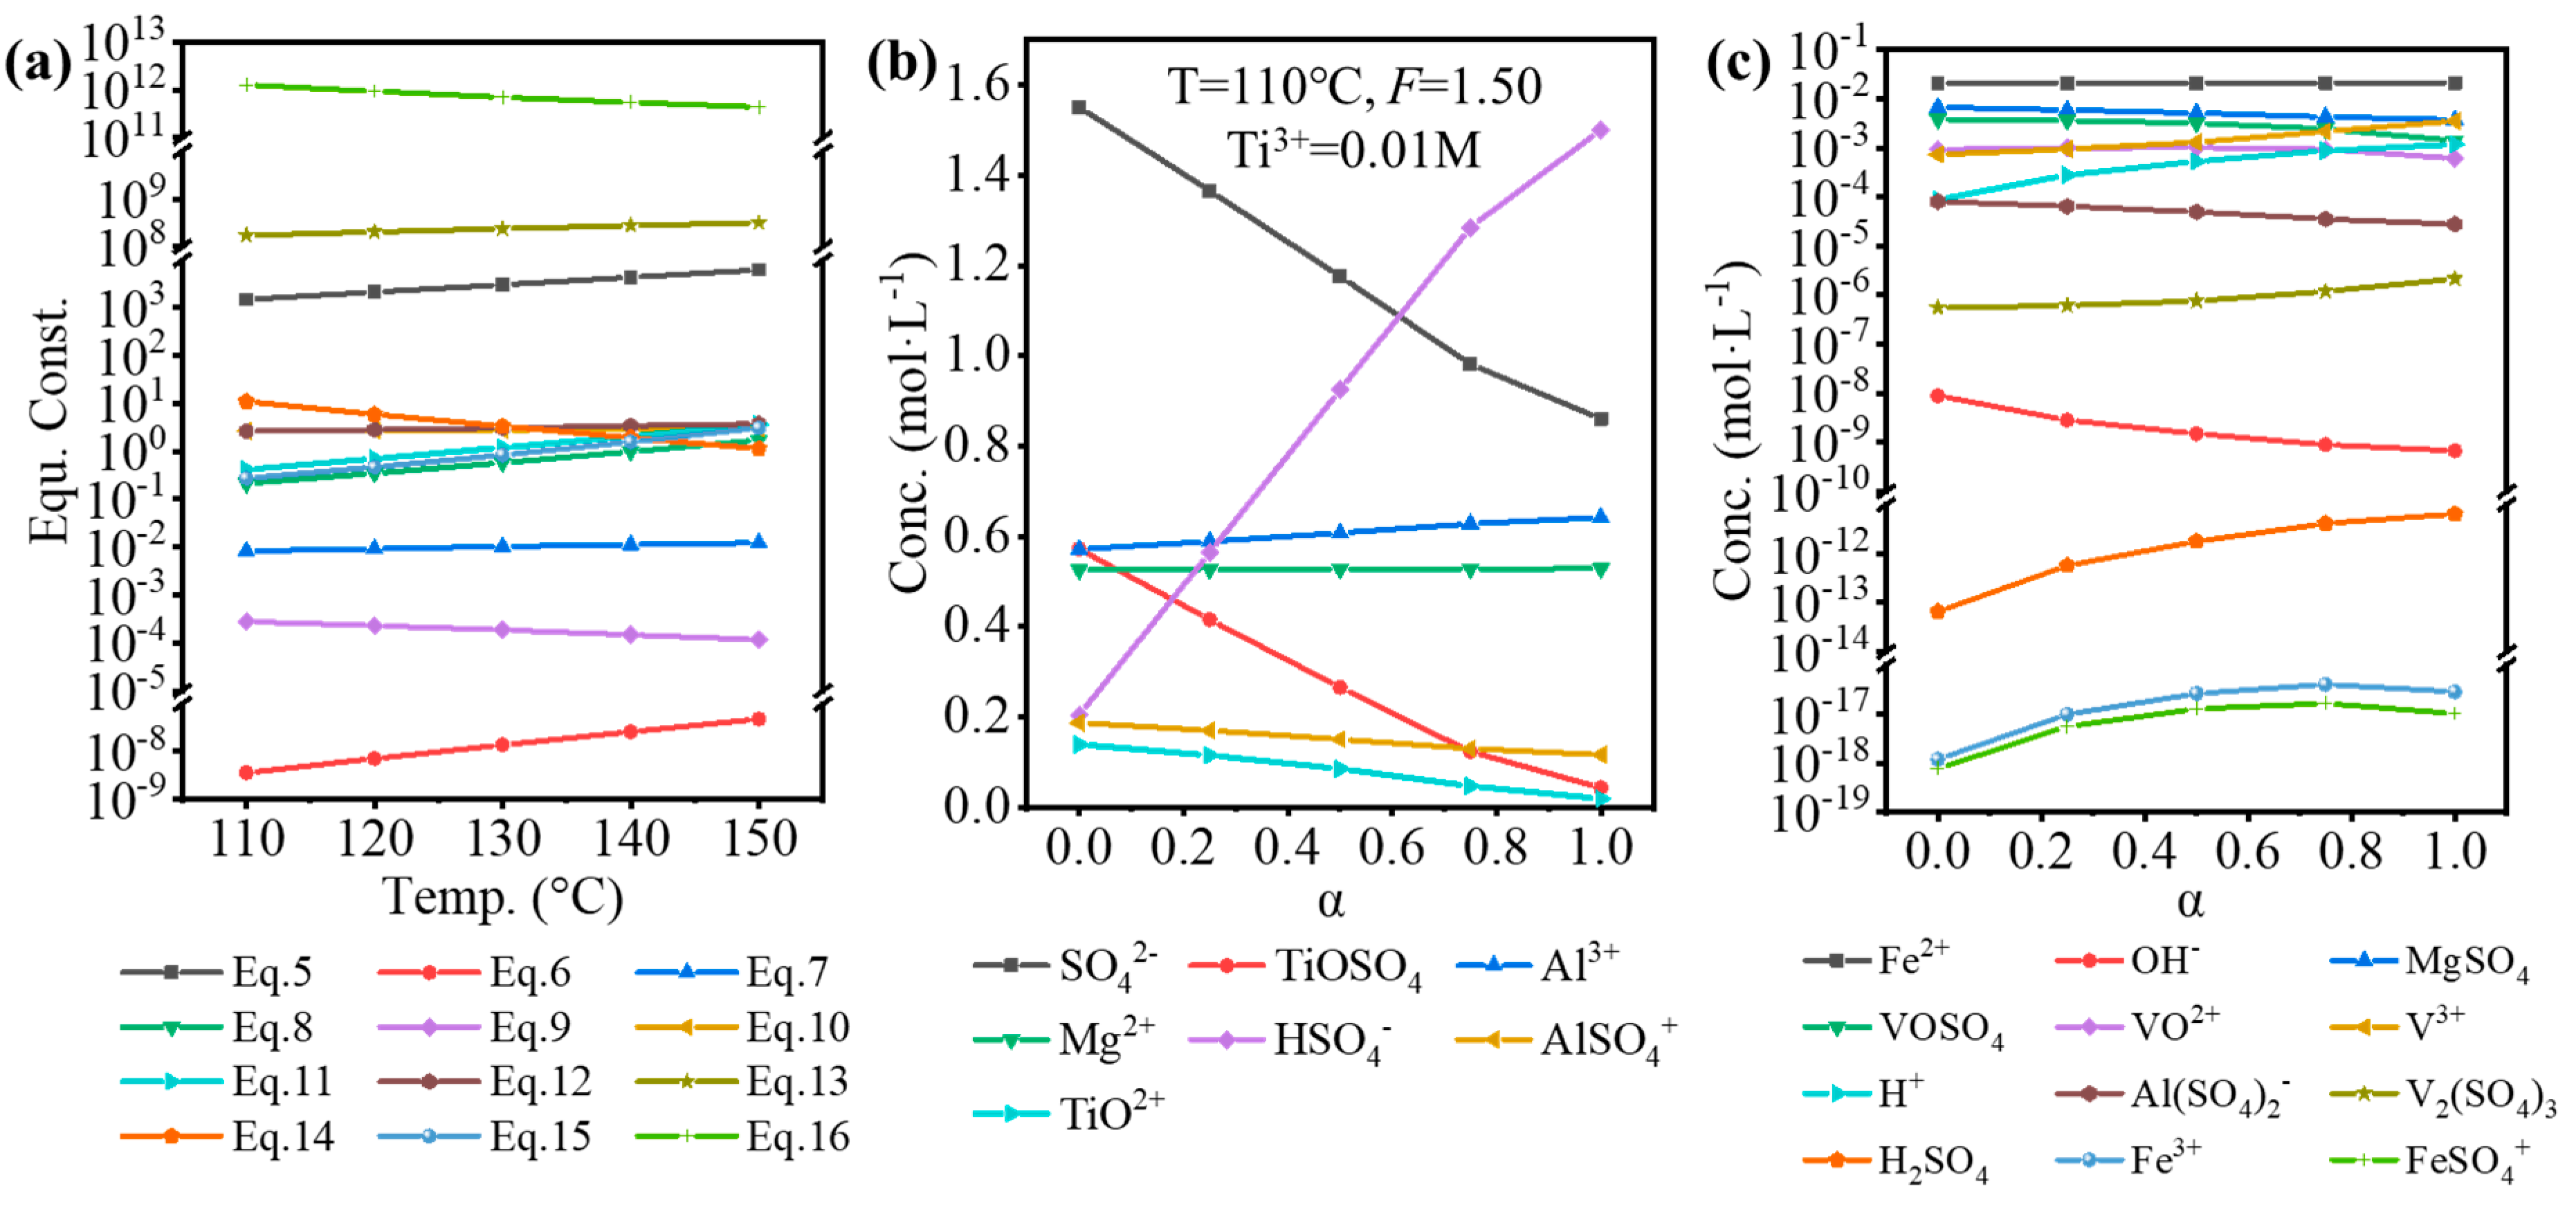
The standard equilibrium constant or relevant electrode potential was obtained from various handbooks and articles [16,17,30,31,32]. By using Van’t Hoff, Kirchhoff’s, and Nernst equations, the equilibrium constants for Equations (5)–(16) at 110–150 °C were obtained, as shown in Figure 3a. By using the Newton–Raphson method, based on the original composition of the solution in Table 2 and equilibrium constants, the equilibrium composition was calculated, as shown in Figure 3b,c. Here, α was referred to as the hydrolysis ratio, which was determined by Equation (17).
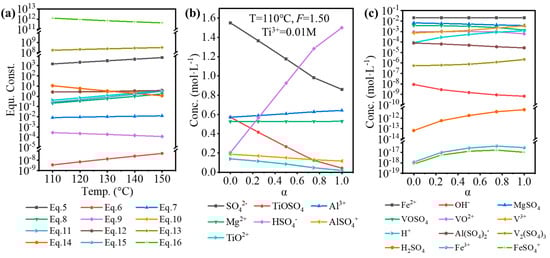
Figure 3.
(a) Calculated equilibrium constants for Equations (5)–(16) at 110–150 °C. The major (b) and minor (c) components of the impurities-bearing TiOSO4 solution at different hydrolysis ratios (α).
The temperature (110 °C), F-value (1.50), and [Ti3+] (0.01 mol·L−1) used in the calculation were the experimental conditions. With increasing hydrolysis ratio, [SO42−], [TiOSO4], [TiO2+], and [OH−] decreased, while [HSO4−], [H+], and [H2SO4] increased, which was because H2SO4 was formed during the hydrolysis of TiOSO4 (). The concentration of impurity ions changed a little, but it is worth noting that the concentration of H+ was relatively low (0.001–0.01 mol·L−1). As shown in Table 6, the lower TiOSO4 concentration compared to that for the sulfate process contributed to the lower free H2SO4, corresponding to the lower concentration of H+. Even at higher F-value, the free H2SO4 of the impurities-bearing TiOSO4 solution was much lower than for the industrial sulfate process in the industry. Furthermore, a large quantity of SO42- introduced by the high concentration of impurity ions from TBFS promoted a positive proceeding of Equation (5), so lots of H+ was consumed.
Table 6.
The conc. of free H2SO4 for different F-value and TiOSO4 conc.
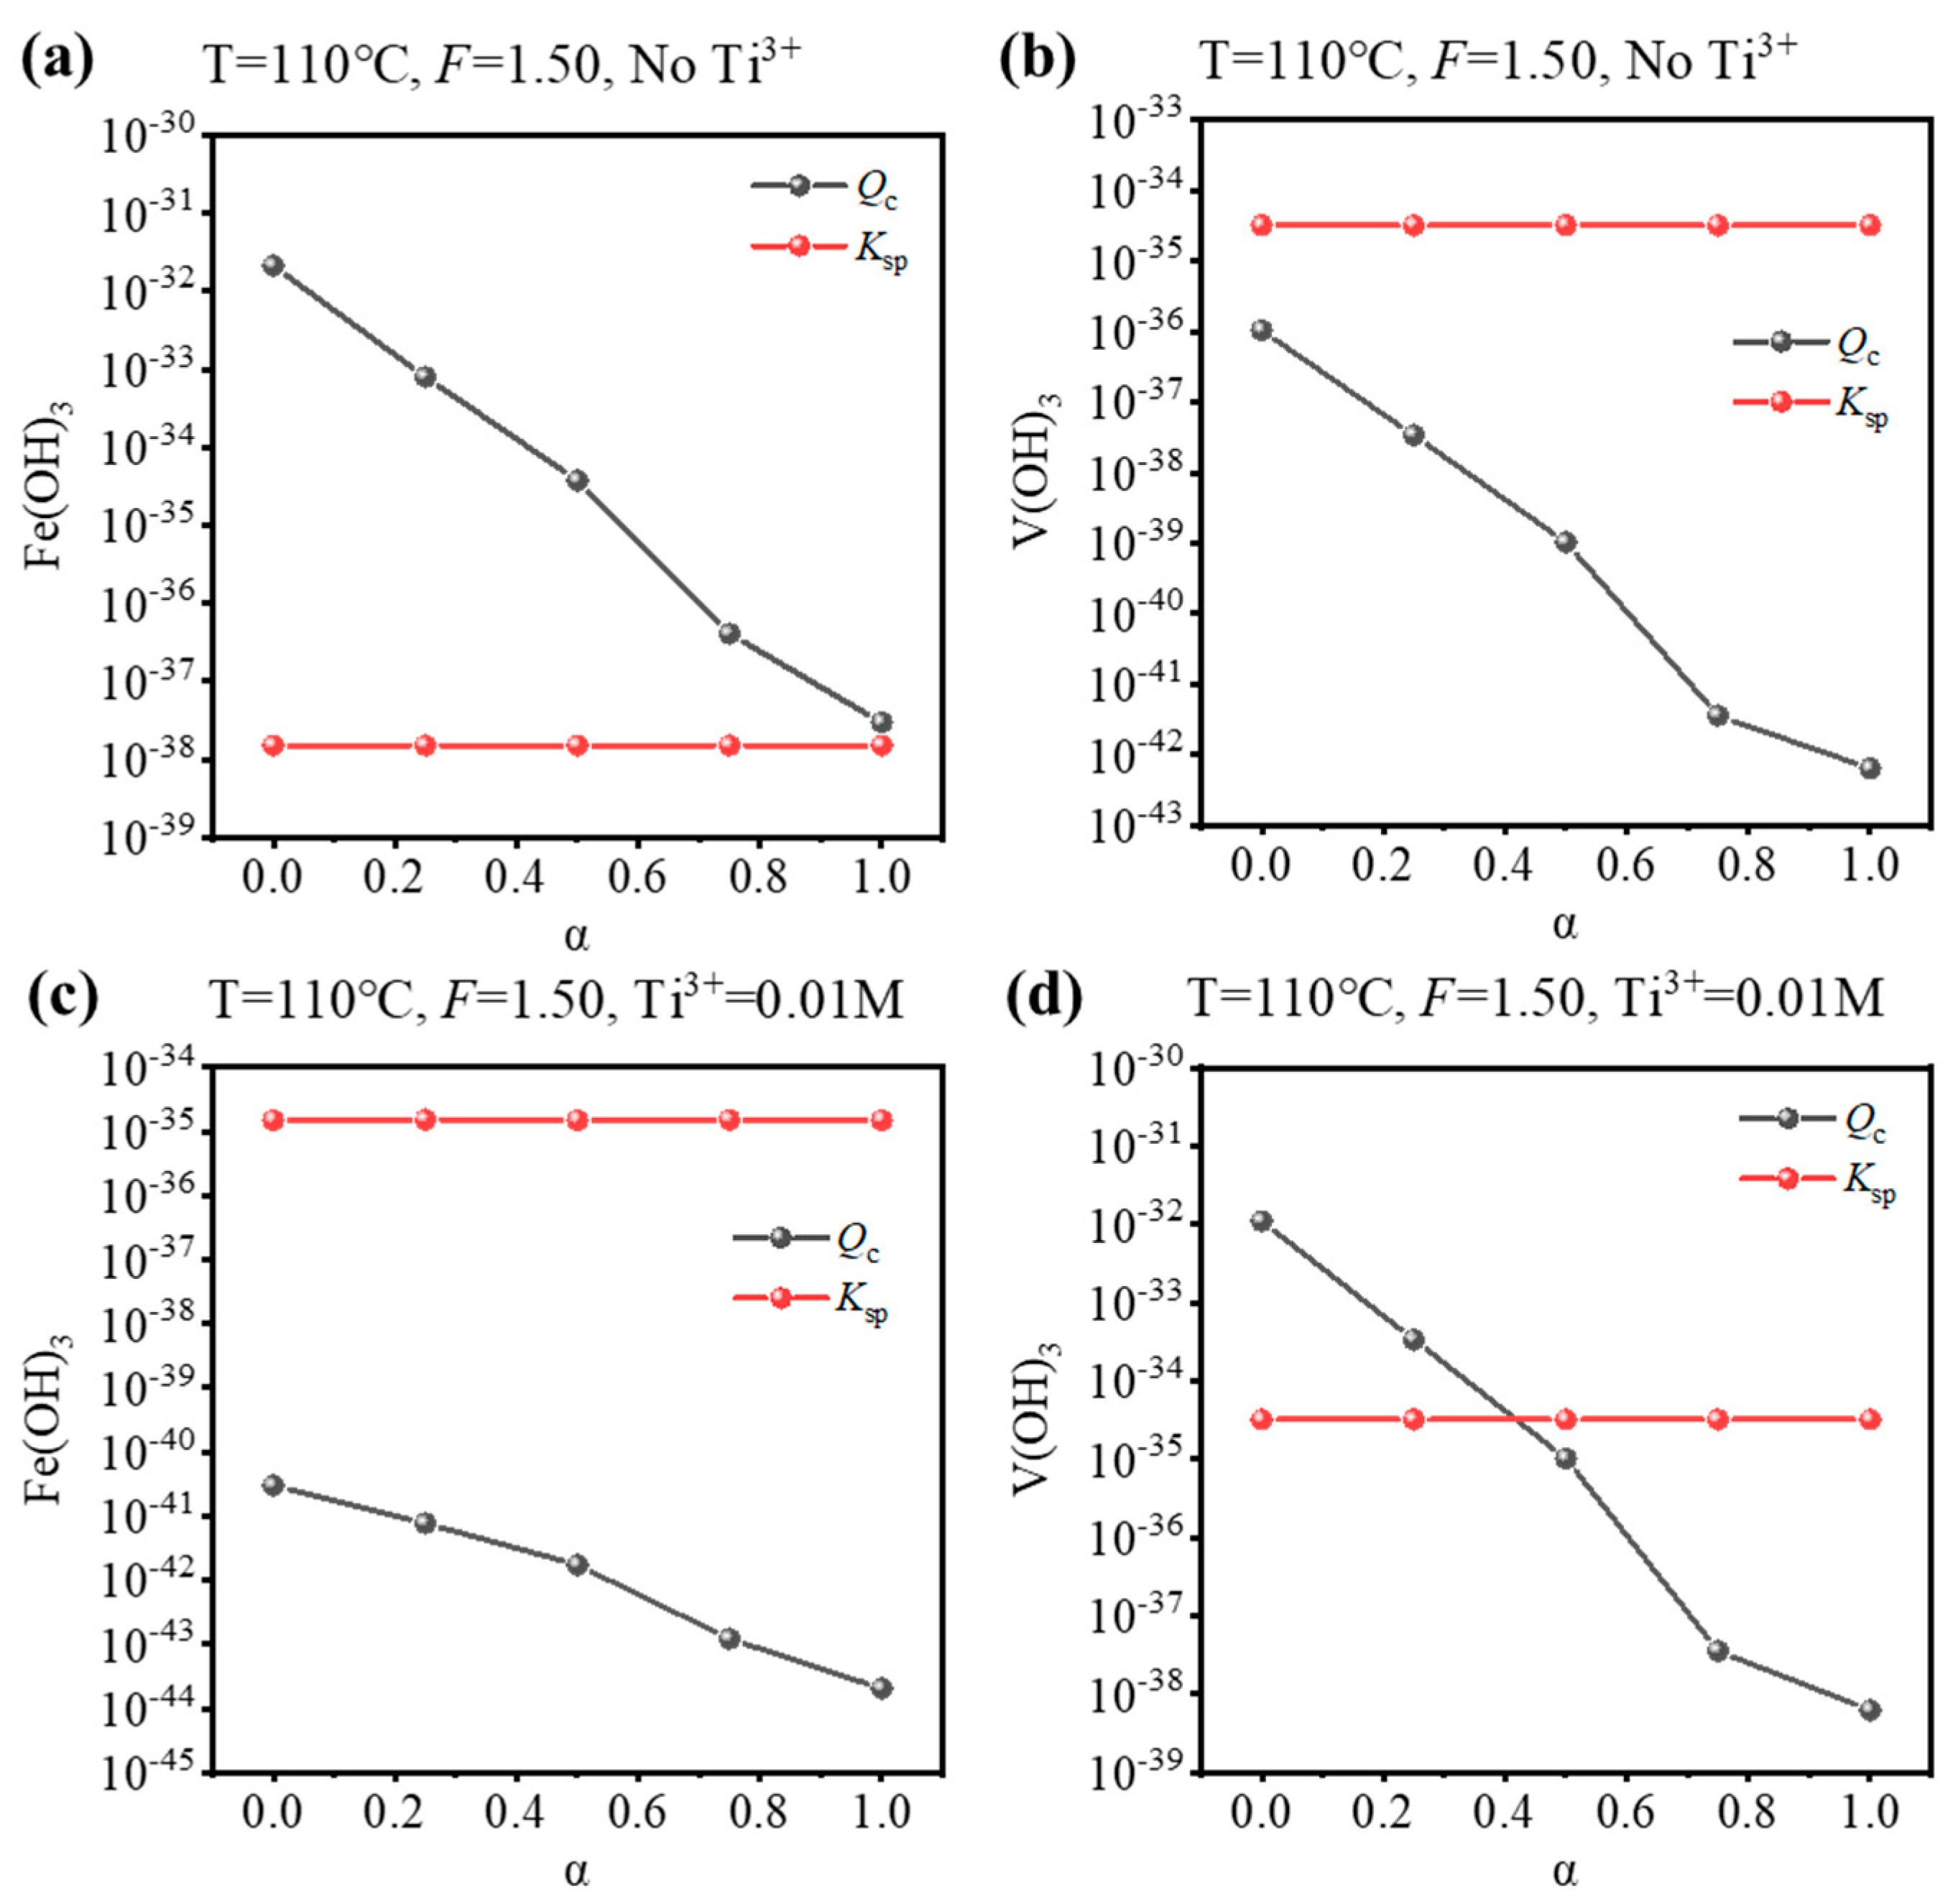
Based on the equilibrium composition, the concentration quotient (Qc) for Fe(OH)3 or V(OH)3 can be calculated, and whether Fe/V will be precipitated can be judged by comparing it with the corresponding solubility product (Ksp). If Qc > Ksp, precipitation is expected, and vice versa. To validate the results of the equilibrium composition, a comparison was performed for the condition that is used to synthesize Fe-MTA and V-MTA, as shown in Figure 4. For the Fe-MTA condition (Figure 4a,b), at any hydrolysis ratio, Fe(OH)3 formation was expected as Qc > Ksp and V(OH)3 formation was expected as Qc < Ksp. For the V-MTA condition (Figure 4c,d), V hydrolyzed while Fe did not at a low hydrolysis ratio, and neither Fe nor V was hydrolyzed at a high hydrolysis ratio. The calculations were consistent with the experimental results. Furthermore, the Qc values for Fe(OH)3/V(OH)3 significantly decreased with the increasing of α, so increasing the concentration of free H2SO4 (F-value) was expected to inhibit the hydrolysis of Fe/V.
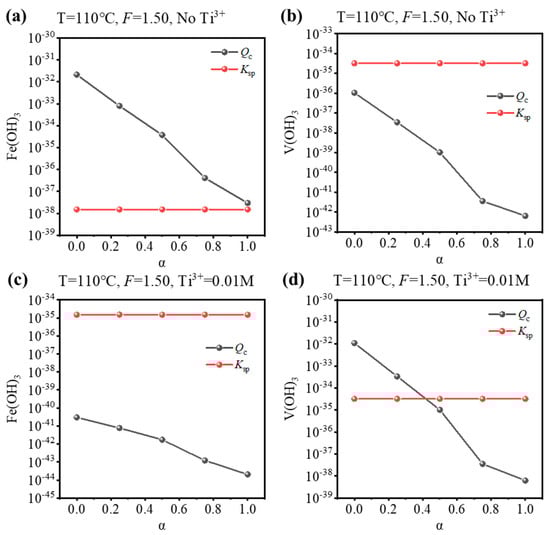
Figure 4.
Comparison of the Ksp/Qc values for Fe(OH)3 and V(OH)3 at different hydrolysis ratios (α) under the condition of the synthesis of (a,b) Fe-MTA (110 °C, F = 1.50, No Ti3+) and (c,d) V-MTA (110 °C, F = 1.50, 0.01 M Ti3+).
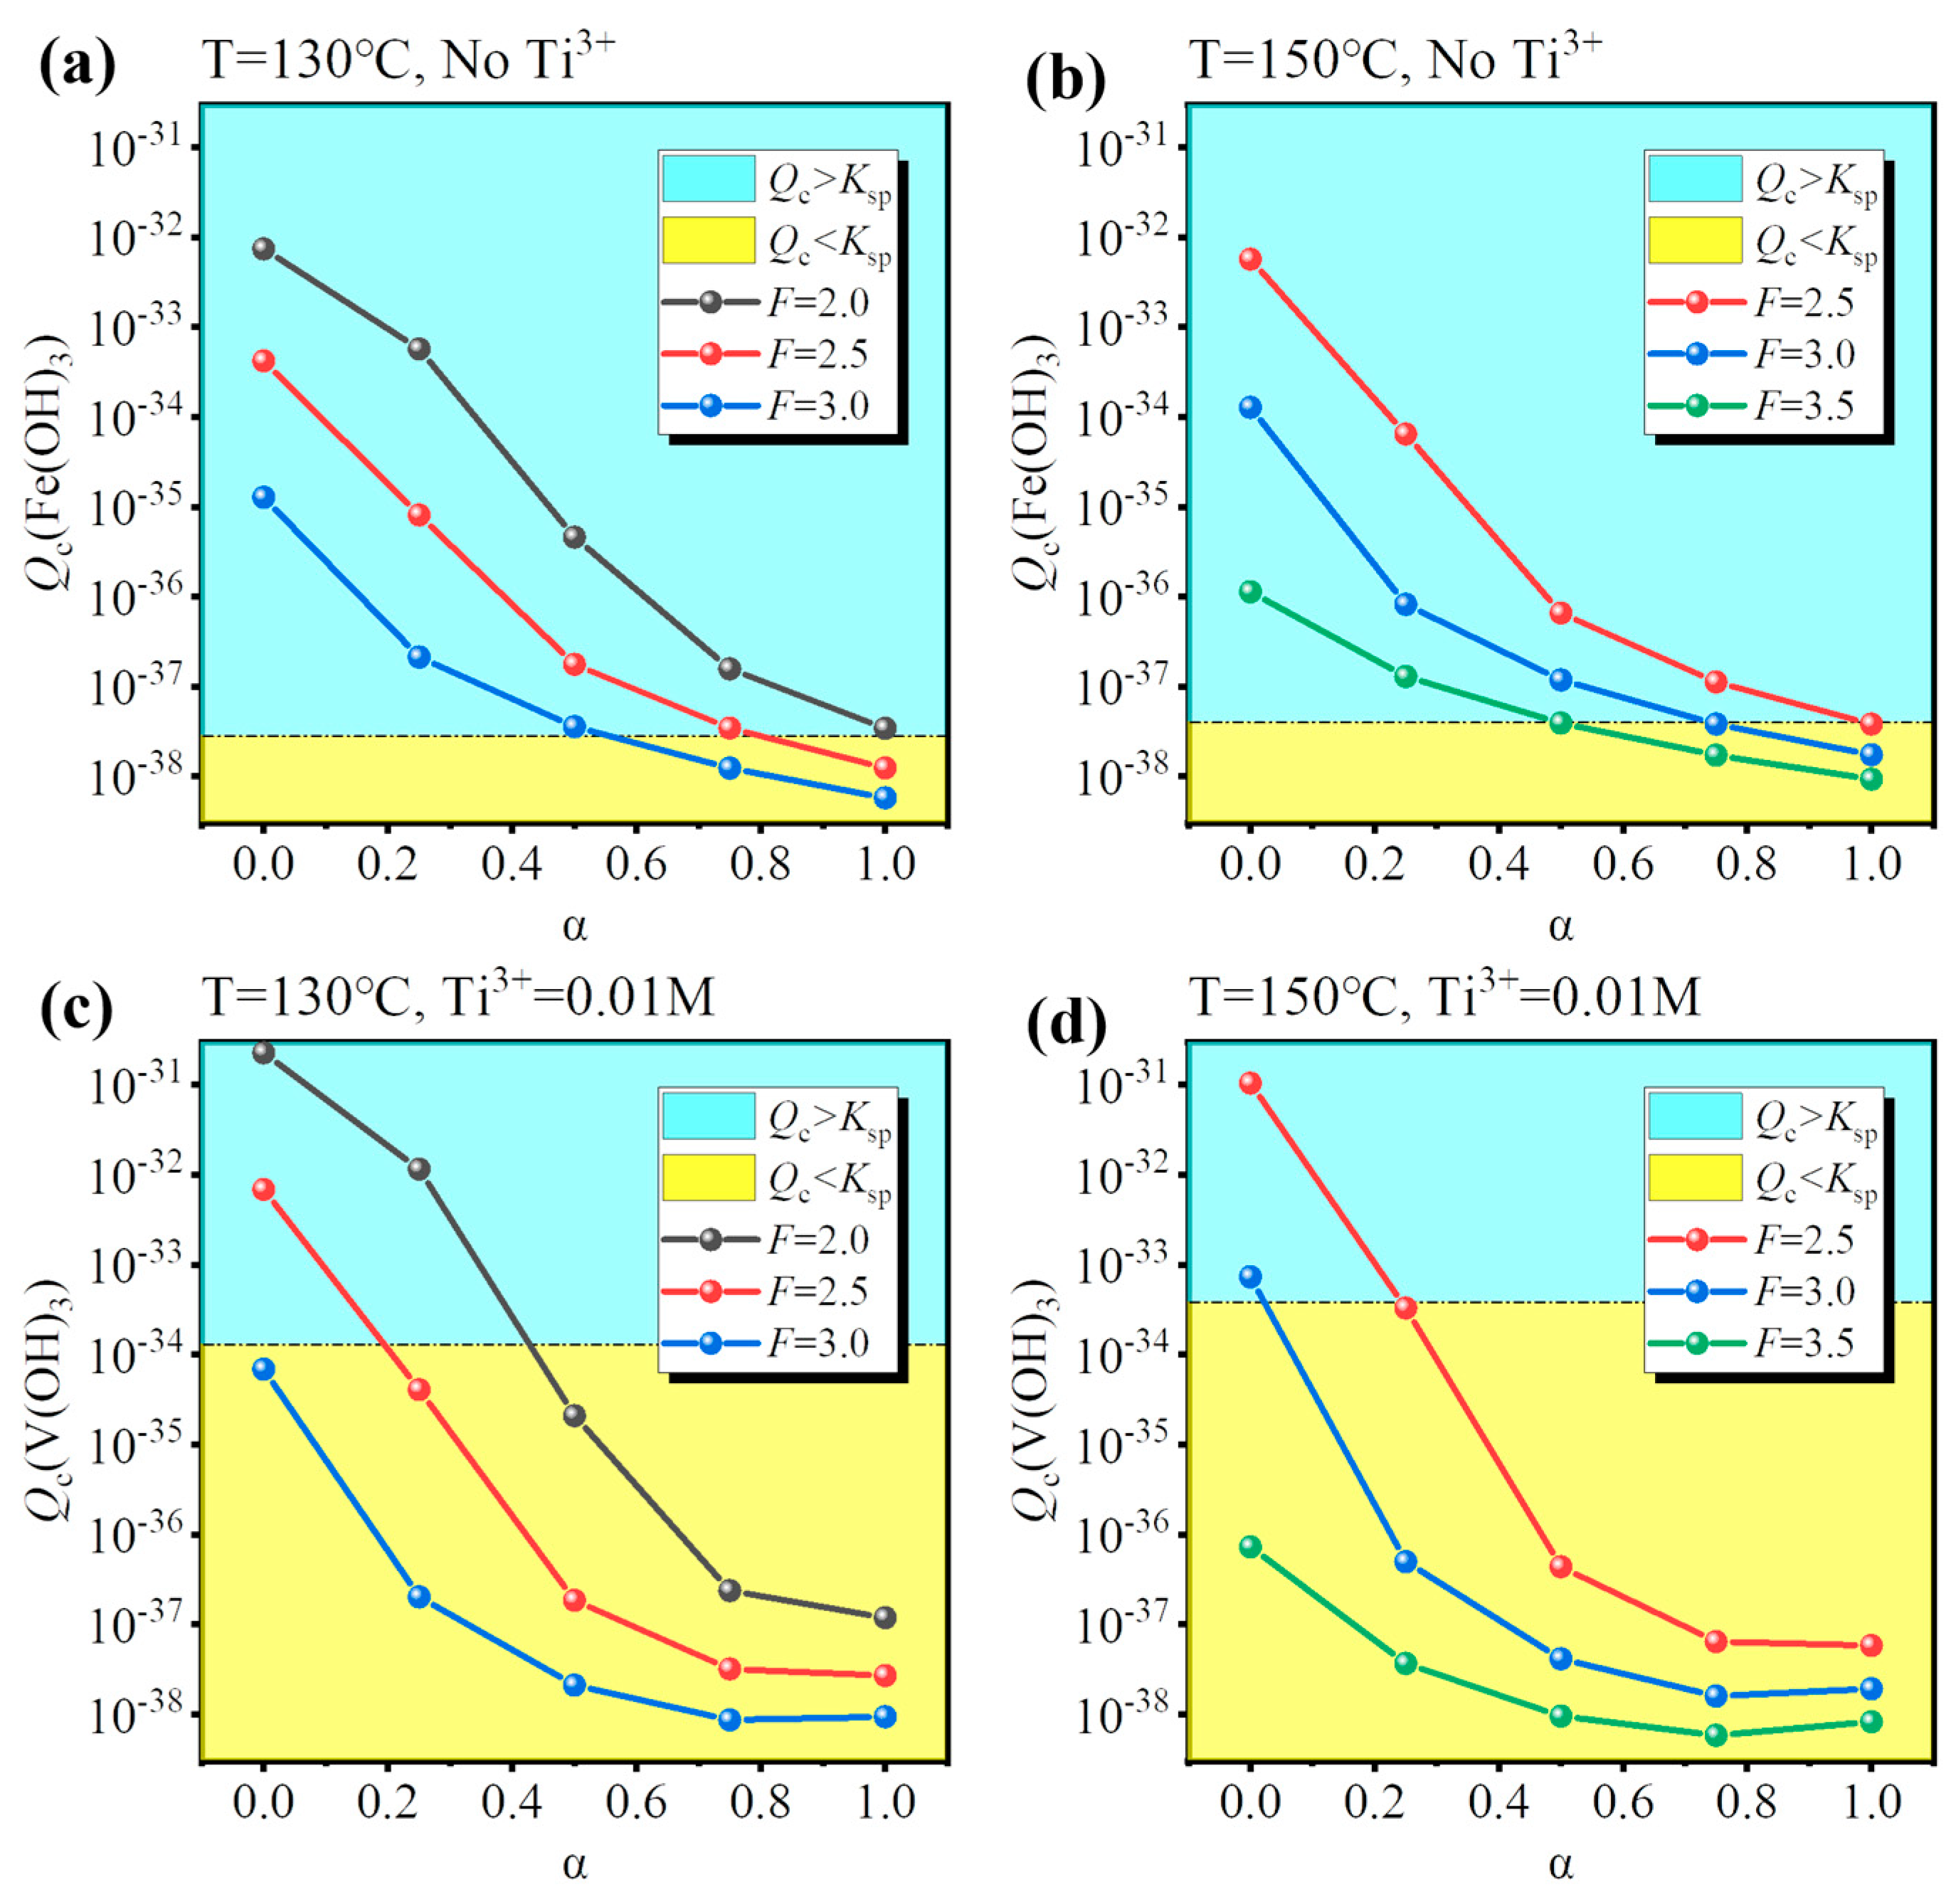
To identify the conditions for Fe/V co-removal, a simulation for different hydrolysis conditions (temperature, F-value, and Ti3+ concentration) was performed and the results are shown in Figure 5. As discussed before, increasing the concentration of free H2SO4 close to that of the industry standard is an effective way to inhibit the hydrolysis of Fe/V, so a suitable F-value was 2.0–3.5. However, increasing the F-value lowered the hydrolysis ratio, so a higher temperature was necessary (T = 130–150 °C). There were two ways for the co-removal: (1) inhibit Fe hydrolysis under oxidizing conditions (No Ti3+) or (2) inhibit V hydrolysis under reducing conditions (0.01 M Ti3+). The results show that Fe3+ was always hydrolyzed at a low hydrolysis ratio (Figure 5a,b), while V3+ had unhydrolyzed conditions (Figure 5c,d). Therefore, method (2) was optimal for Fe/V co-removal. The possible conditions were (130 °C, F = 3.0) and (150 °C, F = 3.5). However, for the condition (130 °C, F = 3.0), the Ti hydrolysis ratio was only 0.638 after 4 h; likewise, for the condition (150 °C, F = 3.5), the hydrolysis ratio was 0.842 after 4 h. Therefore, though the two possible conditions may ensure the Fe/V co-removal, they cannot ensure the Ti hydrolysis ratio >0.95 within a reasonable reaction time (4–6 h), which will lower the production efficiency.
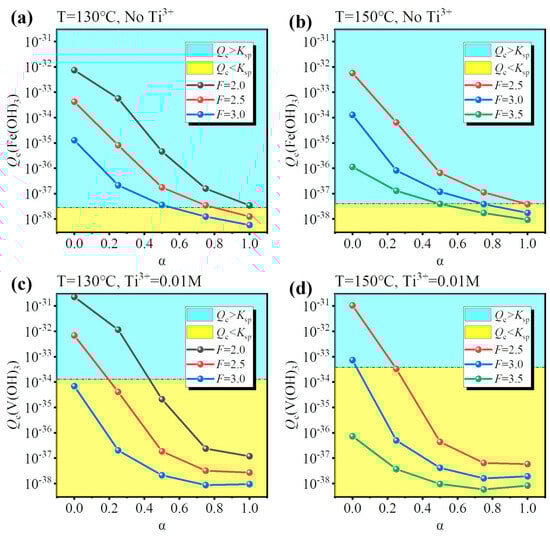
Figure 5.
Calculated effect of temperature (130/150 °C) and F-value (2.0/2.5/3.0/3.5) for assessing (a,b) Fe hydrolysis under oxidizing conditions (No Ti3+) and (c,d) V hydrolysis under reducing conditions (0.01 M Ti3+).
3.3. Two-Step Hydrothermal Hydrolysis for Fe and V Co-Removal
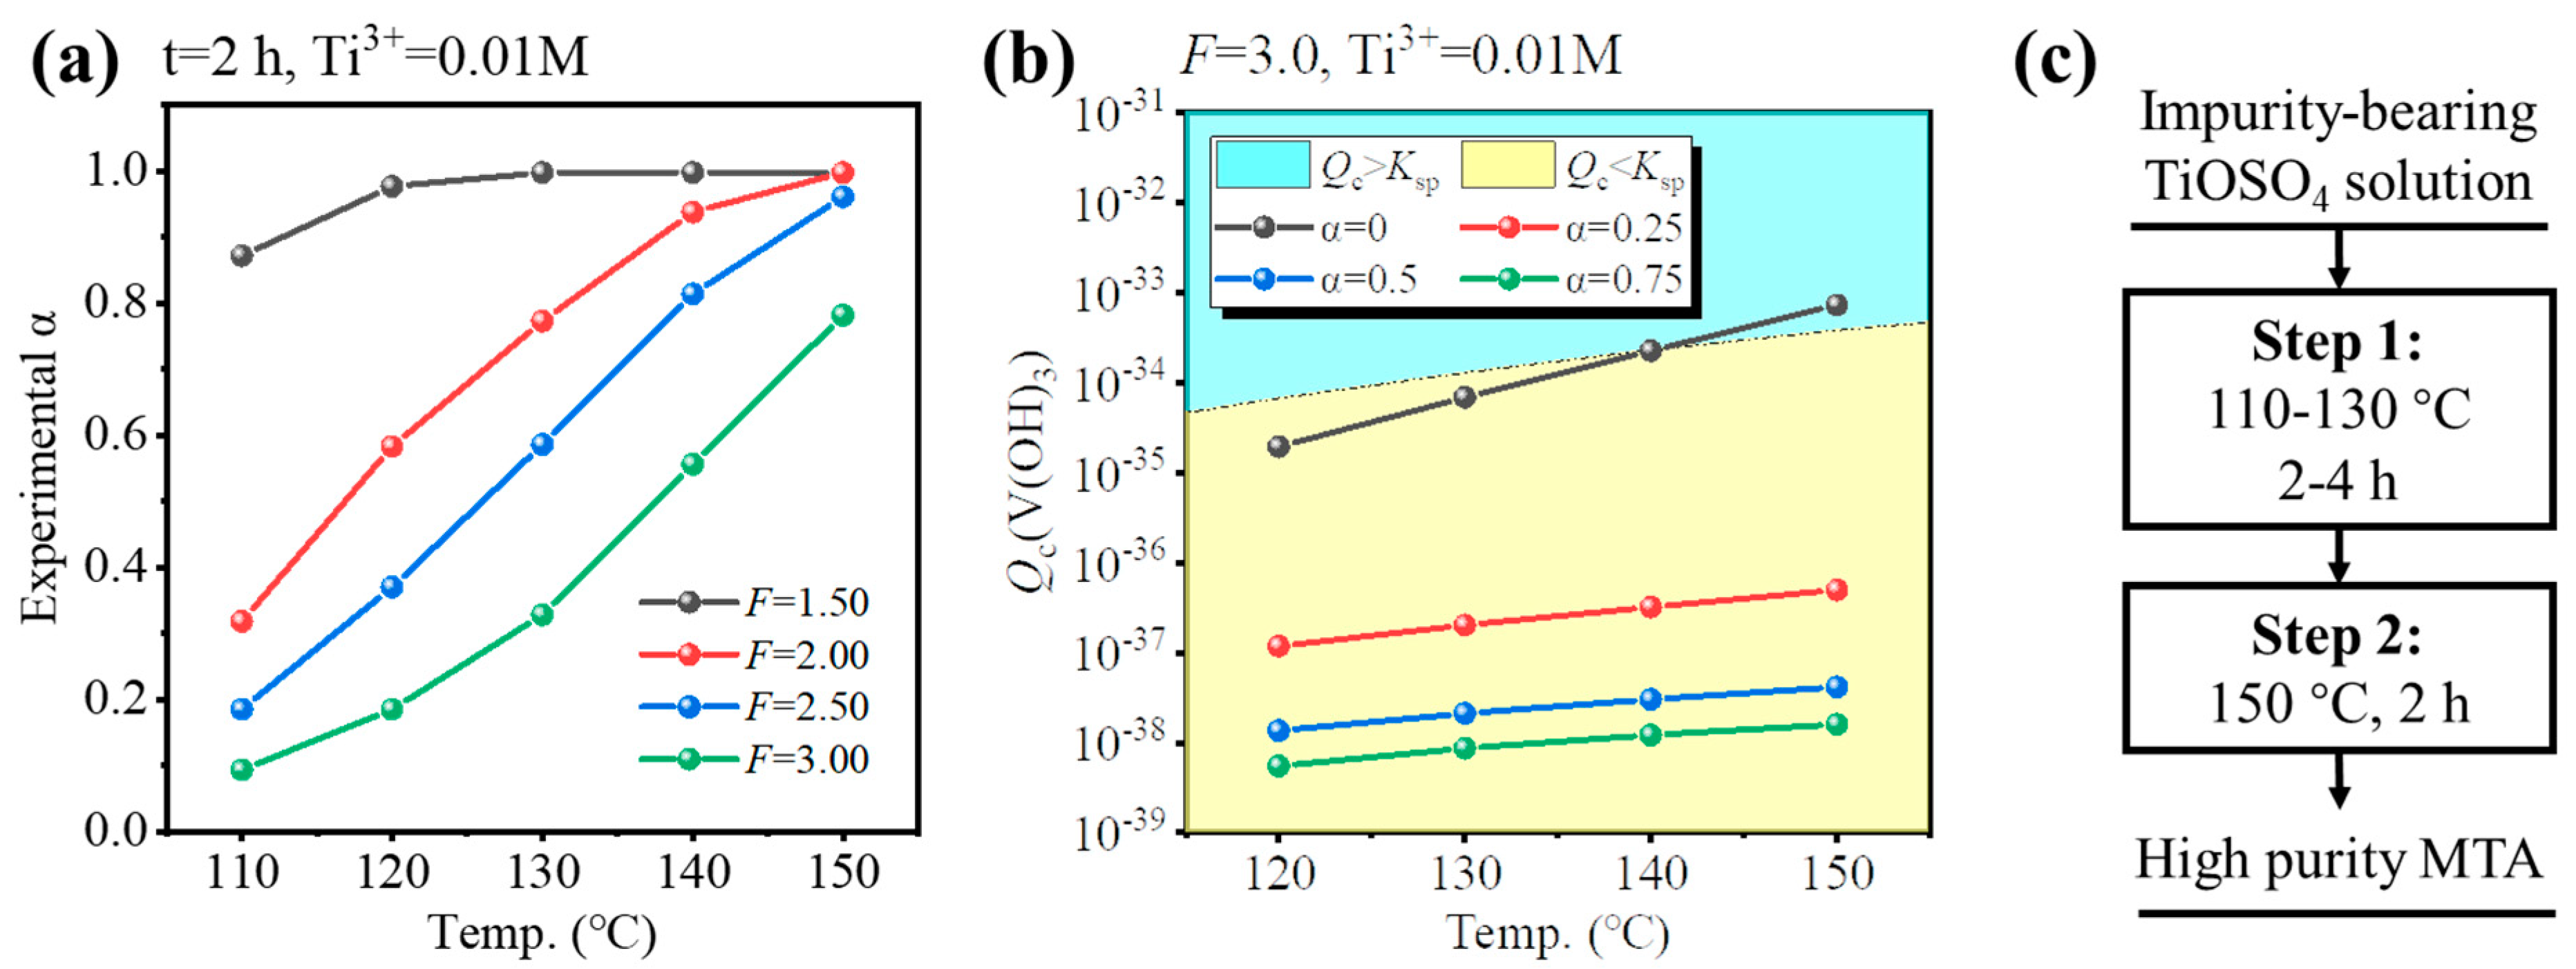
To ensure a high hydrolysis ratio (experimental α > 0.95) within a reasonable reaction time (4–6 h), the hydrolysis properties of impurities-bearing TiOSO4 solution were investigated, as shown in Figure 6a. For the solution formed by dissolution of TBFS, the F-value was 3.0. If the F-value was higher (F = 3.5), additional concentrated H2SO4 was required, and the temperature or reaction time for hydrolysis needed to be higher or longer. If the F-value was lower (F = 2.5), V3+ would hydrolyze during the initial stages of Ti hydrolysis as shown in Figure 5c,d. Thus, F = 3.0 was selected as optimal. For F = 3.0, the conditions whether V3+ hydrolyzed at different temperatures and hydrolysis ratios were investigated, so that several hydrolysis processes were provided as shown in Figure 6a,b. If the solution was hydrolyzed at 150 °C for 4 h, V3+ may have hydrolyzed at the initial stages of Ti hydrolysis (Qc > Ksp when α = 0), as shown in Figure 6b. If the solution was hydrolyzed at 130 °C for 4 h, though the V3+ was not hydrolyzed, the hydrolysis ratio was very low (0.32, 2 h), as shown in Figure 6a. Therefore, we provided a new two-step hydrothermal hydrolysis method, as shown in Figure 6c. For Step 1, the impurities-bearing TiOSO4 solution was hydrolyzed at low temperature to inhibit the V hydrolysis. According to Figure 6b, the suitable condition for hydrolysis was at 110–130 °C for 2–4 h to allow Ti to partially hydrolyze. As hydrolysis proceeded, [H2SO4] was increased, and the Ti hydrolysis ratio > 0.25, V3+ was not hydrolyzed at higher temperatures. Therefore, for Step 2, the solution was hydrolyzed at a higher temperature to ensure α > 0.95 within 6 h. According to Figure 6c, to reduce the total hydrolysis time, the hydrolysis at 150 °C was conducted for 2 h.
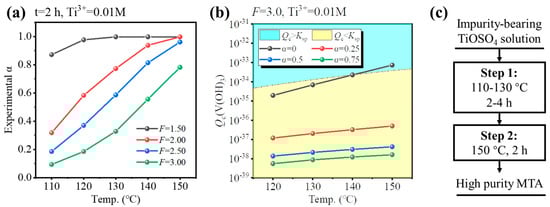
Figure 6.
(a) Hydrolysis ratio of impurities-bearing TiOSO4 solution for 2 h at 110–150 °C and F = 1.5–3.0. (b) Calculated Qc of V(OH)3 at F = 3.0, 120–150 °C, and various experimental α. (c) Concept of two-step hydrothermal hydrolysis process for Fe/V co-removal.
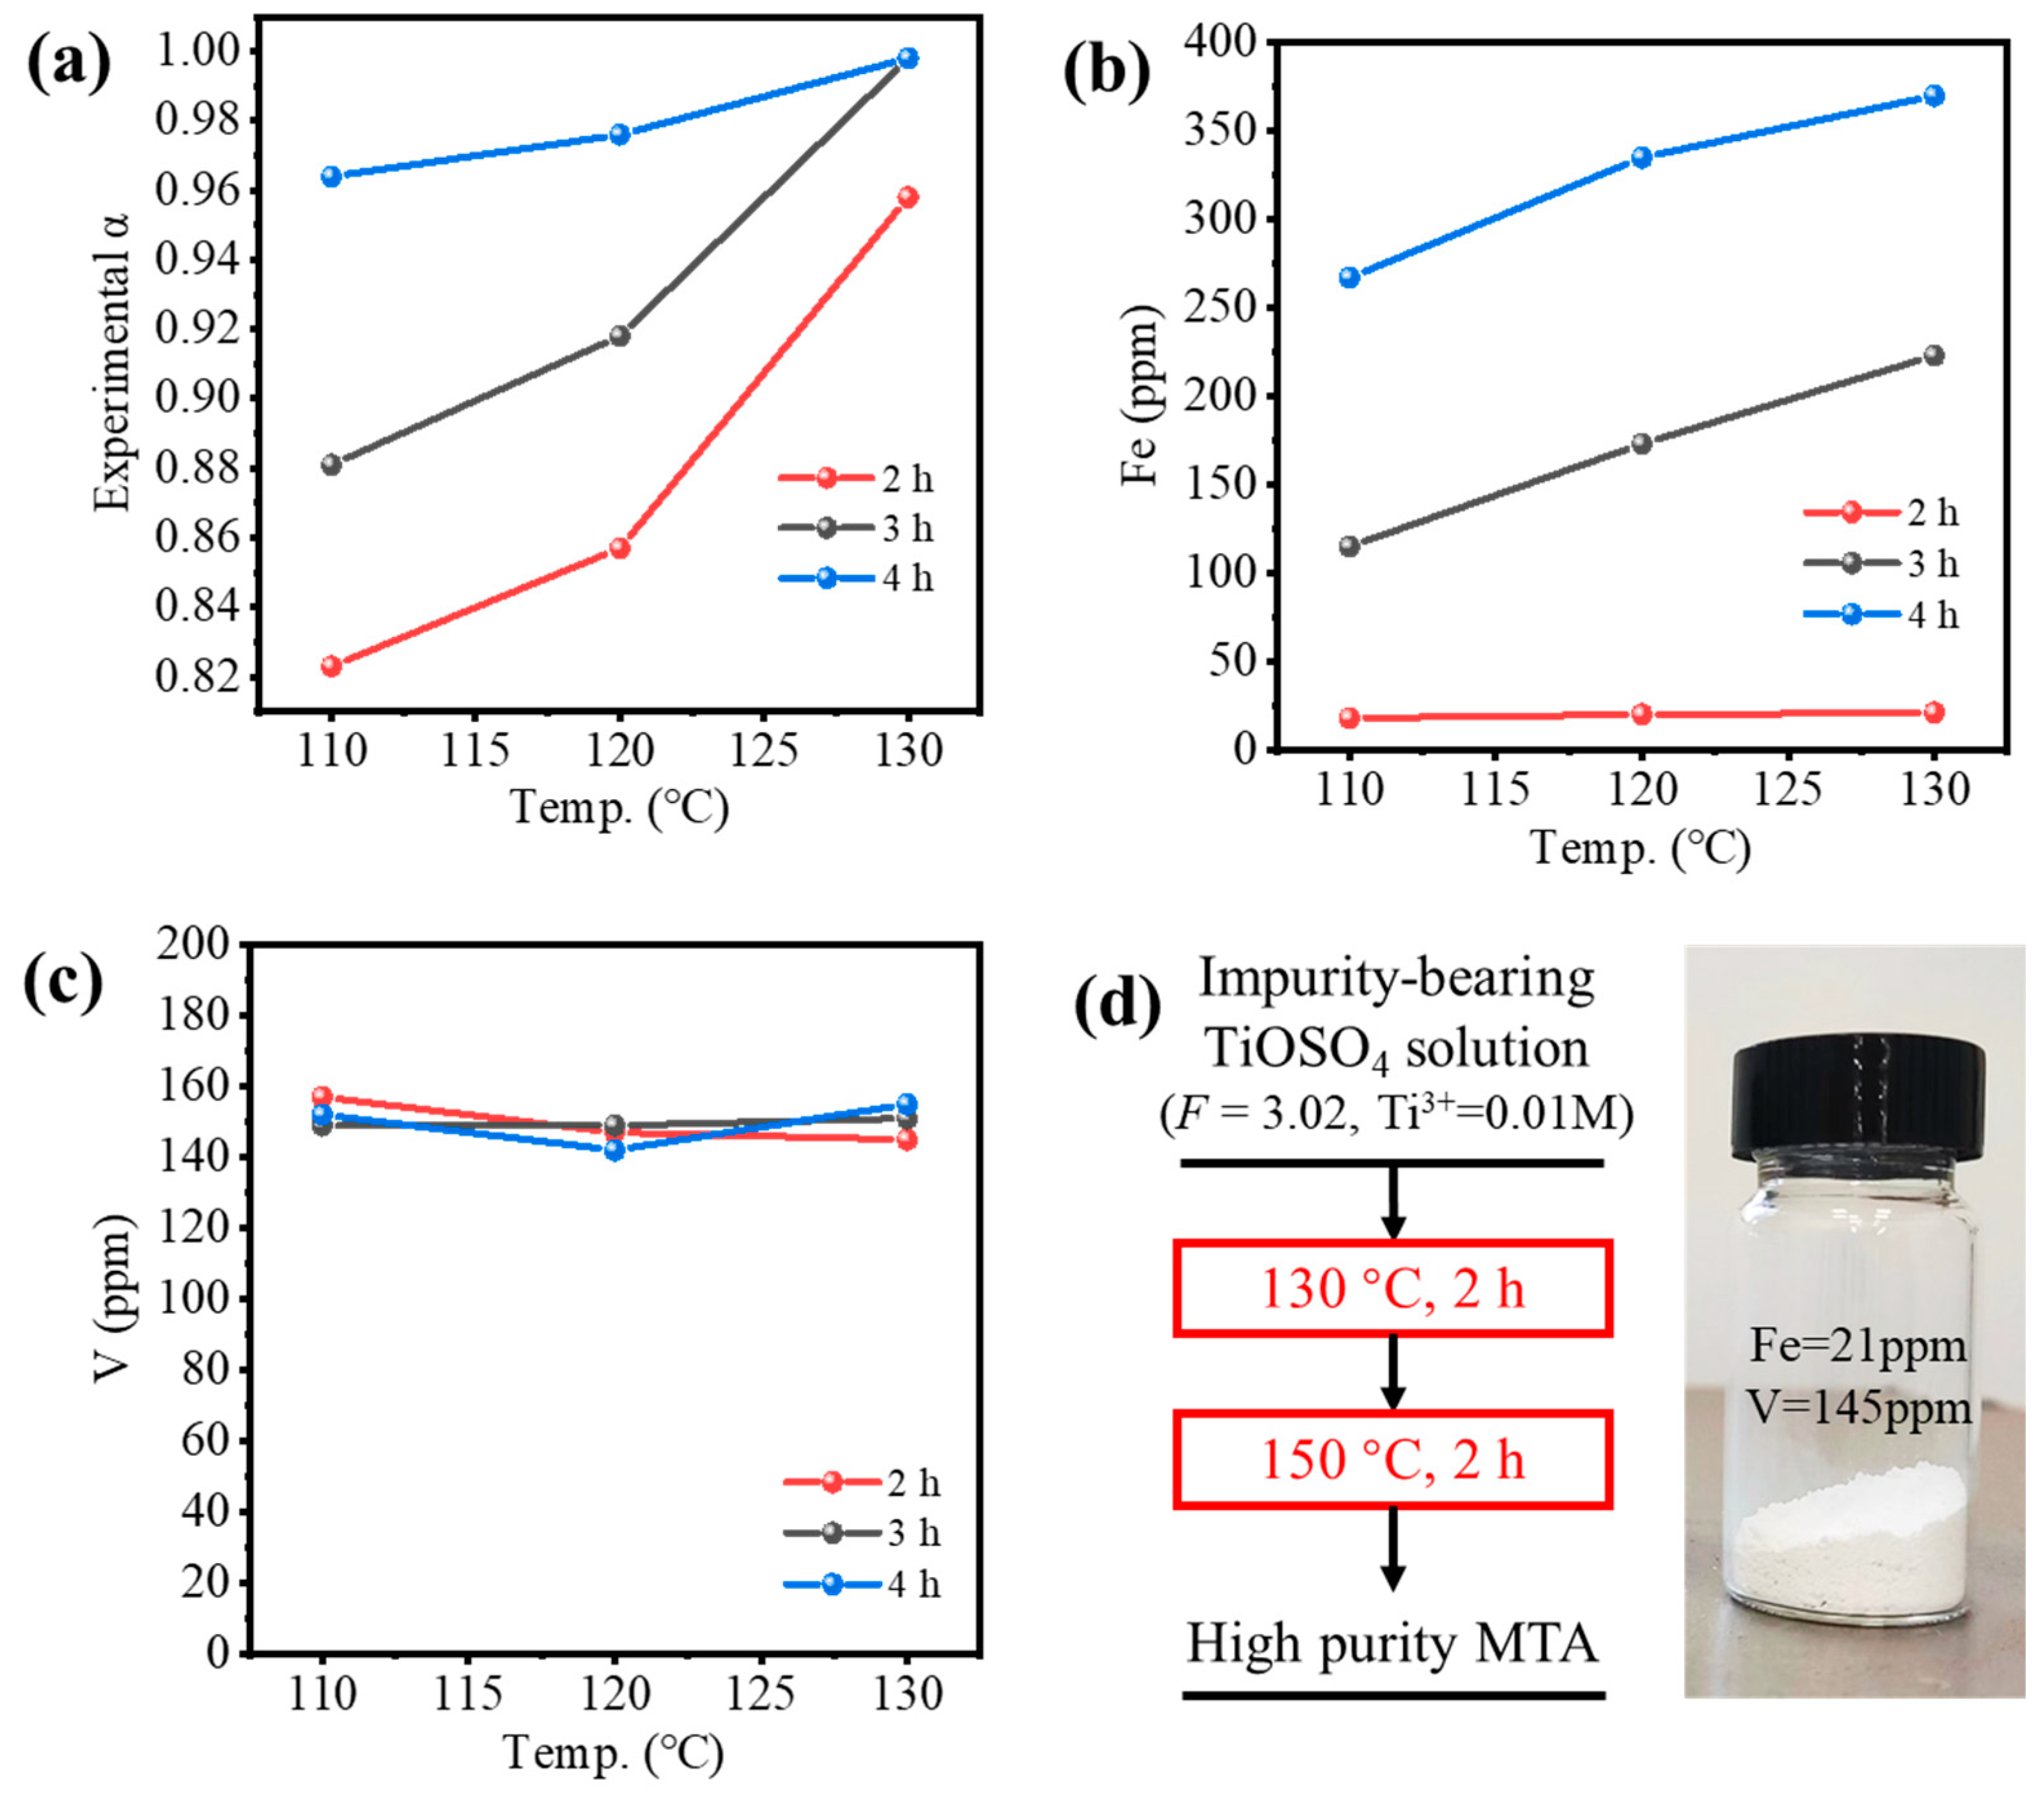
Figure 7 shows the experimental validation of the two-step hydrothermal hydrolysis method, where only the conditions of Step 1 were varied. Figure 7a shows the hydrolysis ratio was increased by the temperature and reaction time of Step 1; α > 0.95 could be achieved only if the reaction time was longer than 4 h or the temperature was 130 °C. Figure 7b shows the Fe content in MTA was only 21 ppm for the reaction time of 2 h, which met the requirement of TiO2 pigment (<30 ppm) and was much lower than Fe-MTA (3854 ppm), but it increased rapidly with hydrolysis time. This may have been because the oxygen in the autoclave gradually oxidized Ti3+ to TiO2+ as time went on, while Fe2+ was converted to Fe3+, resulting in an increase of the Fe content in MTA. Figure 7c shows that the V content in MTA at the different conditions was almost the same, which was in the range of 140–160 ppm. Despite not meeting the requirement of TiO2 pigment (>7 ppm), it was much lower than V-MTA (1205 ppm). Considering both the extent of hydrolysis and the Fe/V content, the optimal condition for Step 1 was hydrolysis at 130 °C for 2 h. The sample obtained with high purity is shown in Figure 7d. Compared with the traditional method (Figure 1a), the process was simpler. More importantly, Fe and V were both excluded by the two-step method (Fe = 21 ppm, V = 145 ppm). Compared with the optimal Fe/V content in Figure 1d, the impurities content of the two-step method was notably decreased and the color was white. Compared with previous relevant works [13,14,20], Fe was decreased from ~10,000 ppm to 21 ppm.
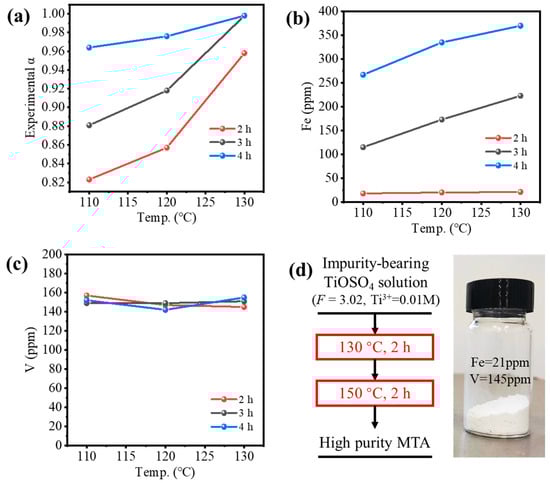
Figure 7.
(a) Experimental hydrolysis ratio of impurities-bearing TiOSO4 solution and (b) Fe or (c) V content in MTA obtained by the two-step method (different condition for Step 1 in Figure 6c). (d) High purity MTA obtained from the optimal two-step process.
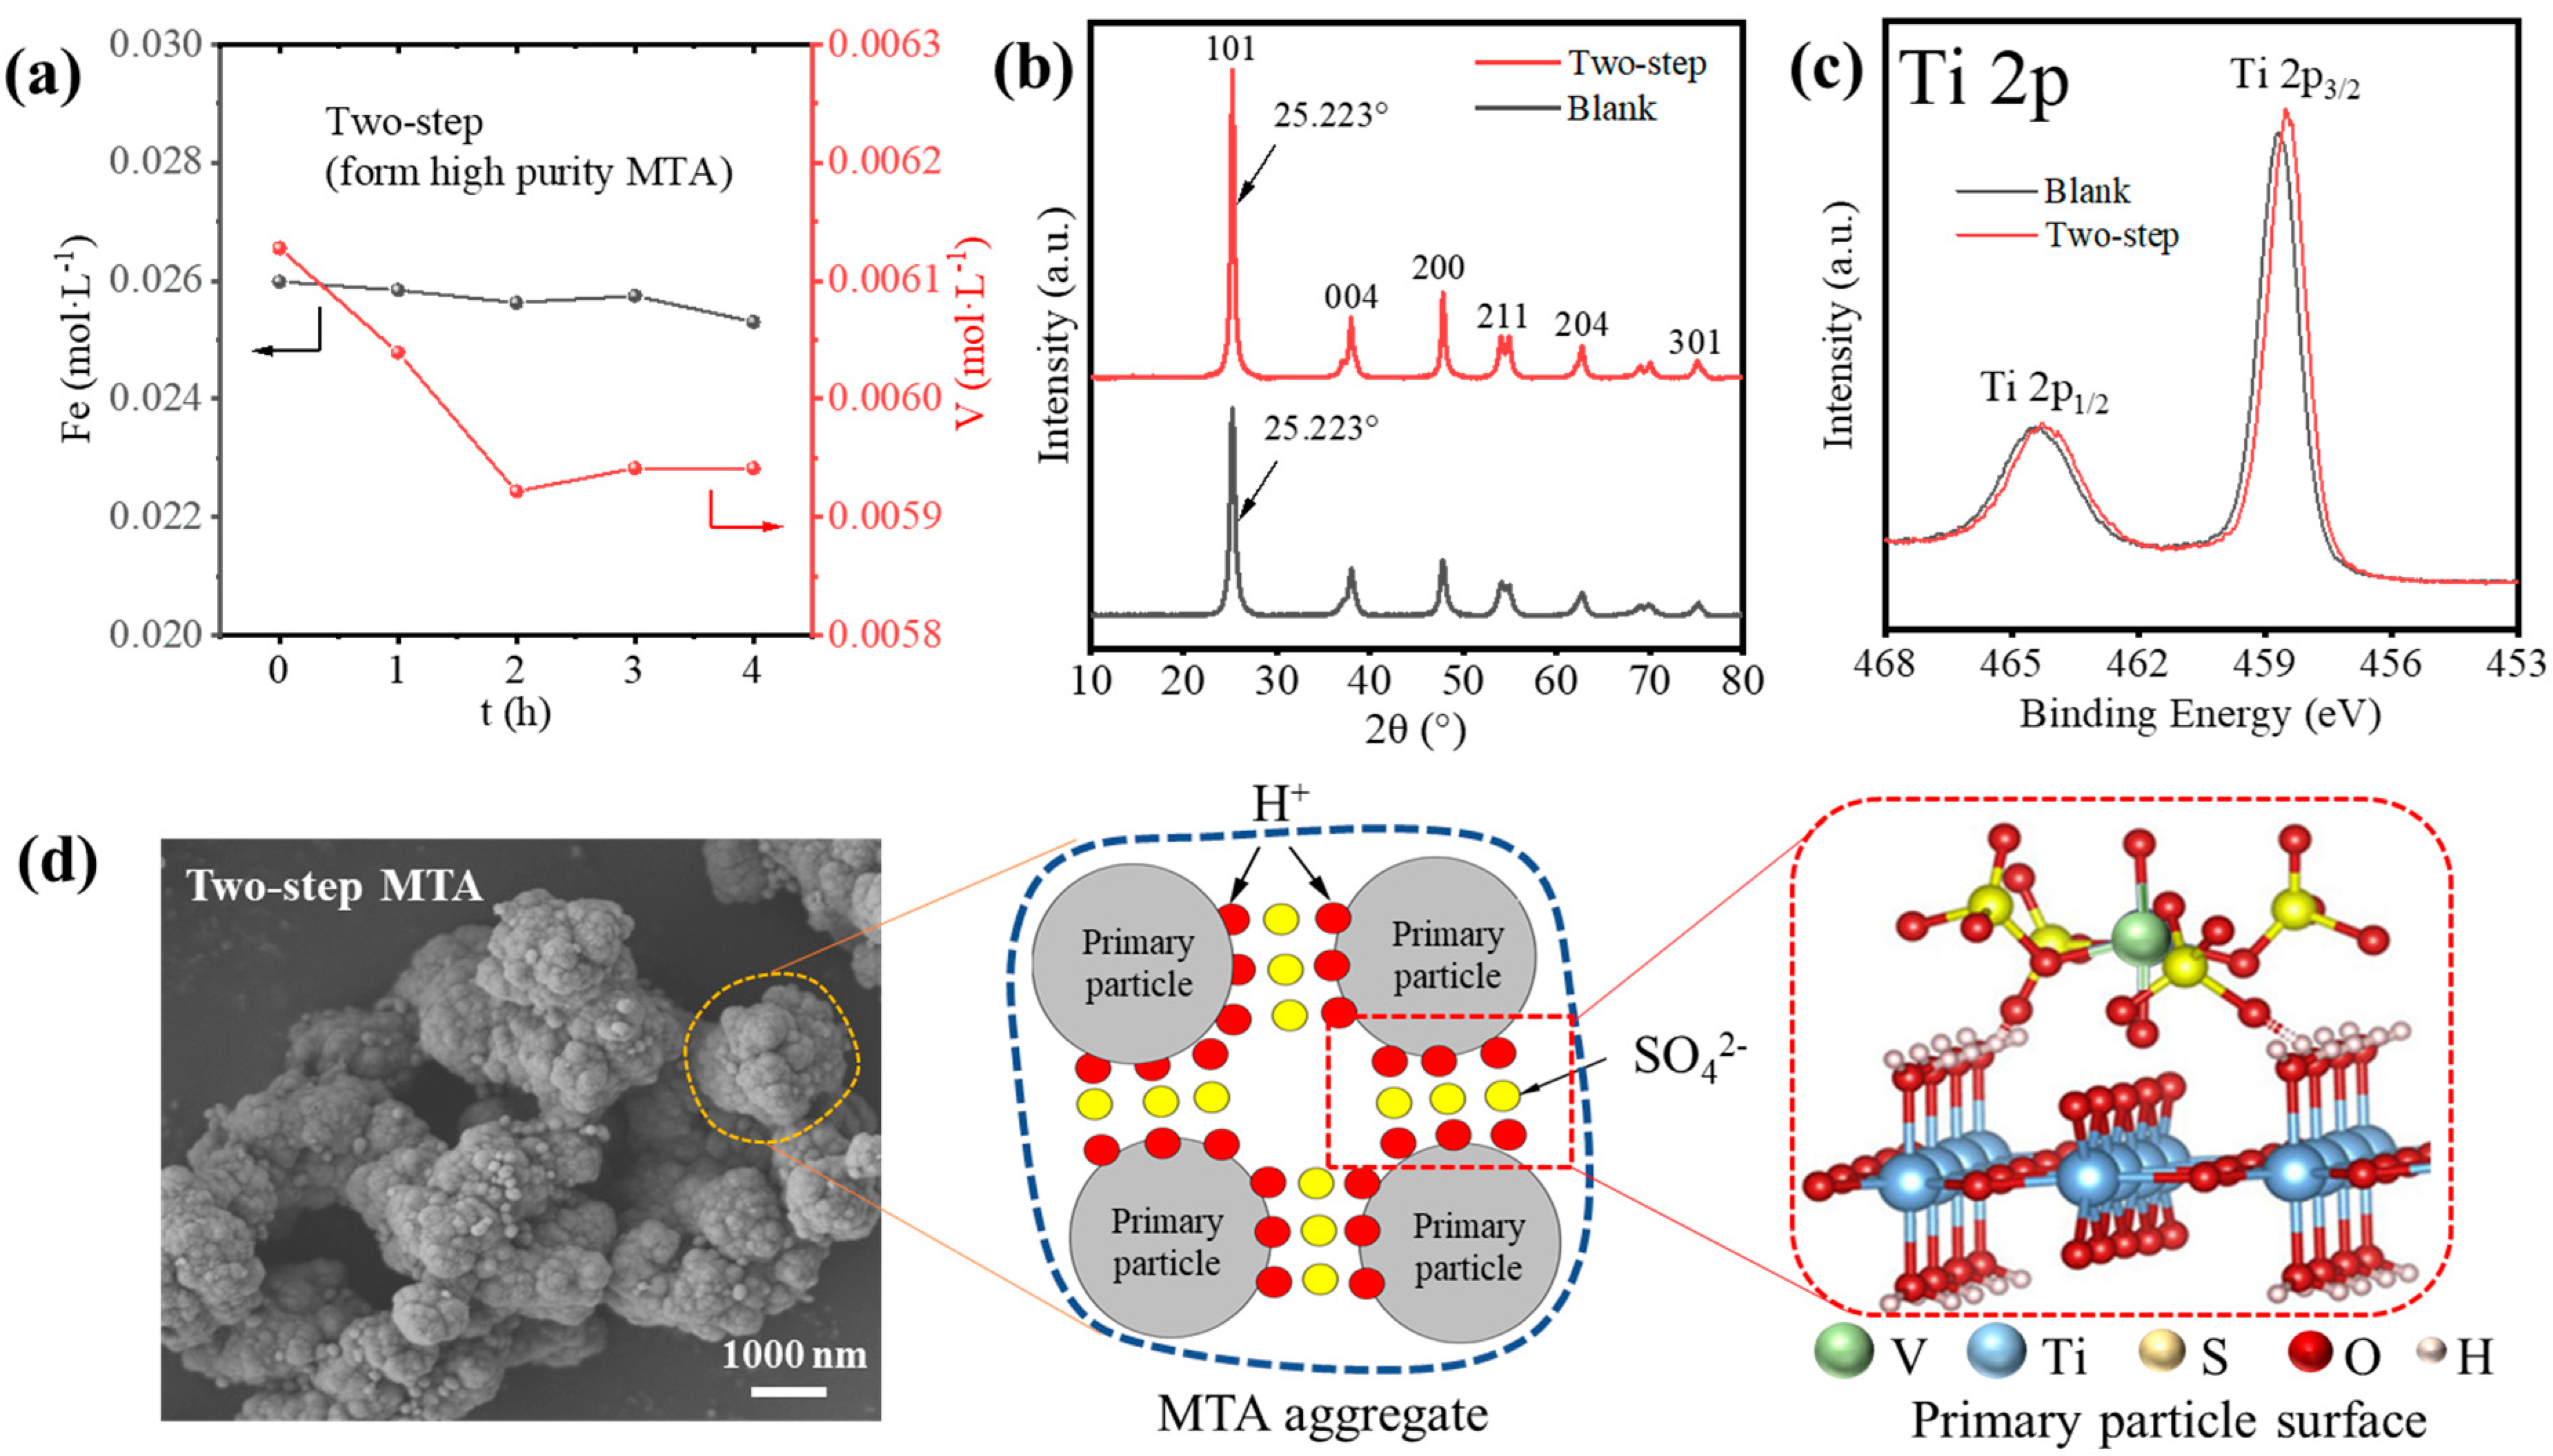
Though the two-step method reduced the Fe/V content of MTA, the V impurity was still high. Thus, we studied the possible reason for how V3+ entered the MTA from which the results are shown in Figure 8. As shown in Figure 8a, the reduction in V concentration up to 4 h was significantly less than before (Figure 1c). Furthermore, Figure 8b shows that the two-step MTA and blank MTA had the same XRD (101) peak position of anatase, which means the V3+ did not enter the lattice of MTA. This indicates that V3+ did not enter the MTA by hydrolysis but was present due to other mechanisms. Figure 8c compares the Ti 2p XPS spectra of the two-step MTA and blank MTA. The peaks at ~465.1 and 459.4 eV of blank MTA were assigned to Ti 2p1/2 and Ti 2p3/2 of the Ti4+ state. For the two-step MTA, the negative shift of binding energy ~0.2 eV indicated that some V3+ was located on the MTA surface and affected the electronic state of Ti4+, as previous studies have shown [33]. Therefore, V impurities in MTA may have been due to the adsorption of V3+. Furthermore, the V cannot be washed off, so the adsorption was not a simple physical adsorption. According to the formation and structure of MTA, we provided a possible mechanism for how V3+ enters the MTA in two-step hydrolysis, as shown in Figure 8d. The SEM image shows that the two-step MTA formed from impurity bearing TiOSO4 solution had hierarchical structures [34]; the aggregation of 30–100 nm primary anatase TiO2 particles to form final 1–3 μm MTA aggregates. Previous studies show that SO42− (4–6 wt.% SO3 of TiO2) is strongly adsorbed at the surface of the primary particles [34,35]. Furthermore, V3+ can readily complex with SO42−, so the V3+-SO42− complex may be formed on the primary particles surface of MTA, like the interaction between Al3+ and the hydrated TiO2 clusters [36,37]. As hydrolysis proceeds, primary particles agglomerate and therefore V3+ is trapped in MTA, which is difficult to wash off.
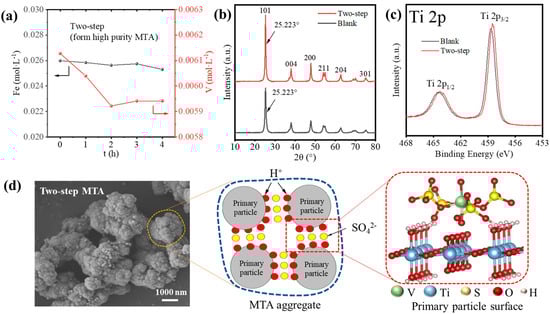
Figure 8.
(a) The hydrolysis behavior of Fe/V during the formation of two-step MTA. (b) XRD patterns and (c) XPS Ti 2p spectra of two-step MTA and blank MTA. (d) The SEM image and mechanism for how V3+ enters the MTA during the two-step hydrolysis.
For future studies of Fe/V co-reduced, the key to reduce the V content in MTA is to inhibit the formation of the V3+-SO42− complex. Specifically, there are two ways: (1) selective complexation of V3+ with complexing agents, and (2) converting V3+ to VO2+ with oxidizing agents to facilitate the dissolution of V in solution.
4. Conclusions
In this study, the formation of Fe/V bearing MTA from the impurities-bearing TiOSO4 solution was investigated, with the following conclusions:
- (1)
- Fe3+ and V3+ easily hydrolyzed with TiO2+ and entered the MTA lattice, resulting in these impurities being difficult to remove by washing. Traditionally manipulating Ti3+ could only remove one of Fe or V.
- (2)
- Based on thermodynamic calculations, the conditions for neither Fe nor V hydrolysis were determined: (a) Ti3+ = 0.01 M, F = 3.0, T = 130 °C. (b) Ti3+ = 0.01 M, F = 3.5, T = 150 °C.
- (3)
- To improve the Ti hydrolysis ratio (>0.95) and reduce the reaction time (4–6 h), two-step hydrolysis was provided (130 °C, 2 h + 150 °C, 2 h, Ti3+ = 0.01 M, F = 3.0), and impurity levels of Fe/V were notably reduced (Fe = 21 ppm, V = 145 ppm).
- (4)
- The residual V impurity may have been due to the adsorption of the V3+-SO42- complex on the surface of the MTA particles.
These findings will provide new insights into the control of the hydrolysis of impurity ions in solutions and help to optimize the process of making TiO2 pigment from TBFS.
Author Contributions
Conceptualization, F.Y. and L.X.; methodology, F.Y.; validation, F.Y. and Q.P.; formal analysis, F.Y.; investigation, F.Y.; data curation, F.Y. and Q.P.; writing—original draft preparation, F.Y.; writing—review and editing, F.Y., Q.P., J.W. and L.X.; supervision, J.W. and L.X.; project administration, L.X.; funding acquisition, L.X. All authors have read and agreed to the published version of the manuscript.
Funding
This study was supported by the National Natural Science Foundation of China (No. 52274410).
Data Availability Statement
Data are contained within the article.
Conflicts of Interest
The authors declare that they have no known competing financial interest or personal relationship that could have appeared to influence the work reported in this paper.
References
- Fan, G.; Wang, M.; Dang, J.; Zhang, R.; Lv, Z.; He, W.; Lv, X. A novel recycling approach for efficient extraction of titanium from high-titanium-bearing blast furnace slag. Waste Manag. 2021, 120, 626–634. [Google Scholar] [CrossRef] [PubMed]
- Shi, J.; Qiu, Y.; Yu, B.; Xie, X.; Dong, J.; Hou, C.; Li, J.; Liu, C. Titanium Extraction from Titania-Bearing Blast Furnace Slag: A Review. JOM 2022, 74, 654–667. [Google Scholar] [CrossRef]
- Fan, G.; Dang, J.; Lv, X.; Hu, M. Effect of basicity on the crystallization behavior of TiO2–CaO–SiO2 ternary system slag. CrystEngComm 2018, 20, 5422–5431. [Google Scholar] [CrossRef]
- Kamarou, M.; Moskovskikh, D.; Chan, H.L.; Wang, H.; Li, T.; Akinwande, A.A.; Romanovski, V. Low energy synthesis of anhydrite cement from waste lime mud. J. Chem. Technol. Biotechnol. 2023, 98, 789–796. [Google Scholar] [CrossRef]
- Smorokov, A.; Kantaev, A.; Bryankin, D.; Miklashevich, A.; Kamarou, M.; Romanovski, V. Low-temperature desiliconization of activated zircon concentrate by NH4HF2 solution. Miner. Eng. 2022, 189, 107909. [Google Scholar] [CrossRef]
- Smorokov, A.; Kantaev, A.; Bryankin, D.; Miklashevich, A.; Kamarou, M.; Romanovski, V. Low-temperature method for desiliconization of polymetallic slags by ammonium bifluoride solution. Environ. Sci. Pollut. Res. 2023, 30, 30271–30280. [Google Scholar] [CrossRef] [PubMed]
- Yang, Z.; Yang, F.; Yi, M.; Xiang, L. Estimation of Reaction Heat in Ti-Bearing Blast Furnace Slag—Sulfuric Acid System Based on Mechanical Mixture Model. Min. Metall. Explor. 2021, 38, 1247–1252. [Google Scholar] [CrossRef]
- Zhou, L.; Peng, T.; Sun, H.; Wang, S. Thermodynamics analysis and experiments on Ti-bearing blast furnace slag leaching enhanced by sulfuric acid roasting. RSC Adv. 2022, 12, 34990–35001. [Google Scholar] [CrossRef]
- He, S.; Wang, Y. Extraction of Valuable Components from Ti-Bearing Blast Furnace Slag Using Sulfuric Acid Calcination Process. JOM 2022, 75, 392–399. [Google Scholar] [CrossRef]
- Wang, L.; Chen, L.; Liu, W.; Zhang, G.; Tang, S.; Yue, H.; Liang, B.; Luo, D. Recovery of titanium, aluminum, magnesium and separating silicon from titanium-bearing blast furnace slag by sulfuric acid curing—Leaching. Int. J. Min. Met. Mater. 2022, 29, 1705–1714. [Google Scholar] [CrossRef]
- Yang, Z.; Yang, F.; Yi, M.; Xiang, L. Rule of hydrothermal hydrolysis of Mg/Al-bearing TiOSO4 solution. Inorg. Chem. Ind. 2021, 53, 113–116. [Google Scholar] [CrossRef]
- Winkler, J. Titanium Dioxide; Vincentz Network: Hannover, Germany, 2013. [Google Scholar]
- Xue, T.; Wang, L.; Qi, T.; Chu, J.; Qu, J.; Liu, C. Decomposition kinetics of titanium slag in sodium hydroxide system. Hydrometallurgy 2009, 95, 22–27. [Google Scholar] [CrossRef]
- Zhao, L.; Liu, Y.; Wang, L.; Zhao, H.; Chen, D.; Zhong, B.; Wang, J.; Qi, T. Production of Rutile TiO2 Pigment from Titanium Slag Obtained by Hydrochloric Acid Leaching of Vanadium-Bearing Titanomagnetite. Ind. Eng. Chem. Res. 2013, 53, 70–77. [Google Scholar] [CrossRef]
- Grzmil, B.; Grela, D.; Kic, B.; Podsiadły, M. The influence of admixtures on the course of hydrolysis of titanyl sulfate. Pol. J. Chem. Technol. 2008, 10, 4–12. [Google Scholar] [CrossRef]
- Speight, J. Lange’s Handbook of Chemistry; McGraw-Hill Book Co., Inc.: New York, NY, USA, 2005. [Google Scholar]
- Haynes, W.M. CRC Handbook of Chemistry and Physics; CRC Press: Boca Raton, FL, USA, 2016. [Google Scholar]
- Gázquez, M.J.; Bolívar, J.P.; Garcia-Tenorio, R.; Vaca, F. A Review of the Production Cycle of Titanium Dioxide Pigment. Mater. Sci. Appl. 2014, 5, 441–458. [Google Scholar] [CrossRef]
- Lu, R.; Liu, C.; Wub, J.; Sun, W.; Sun, Q.; Dong, L. Process optimization of the extra-adding seeded hydrolysis of TiOSO4 to H2TiO3 by using the unenriched solution for the manufacture of TiO2 pigment. J. Cryst. Growth 2021, 572, 126268. [Google Scholar] [CrossRef]
- Li, Z.; Wang, Z.; Li, G. Preparation of nano-titanium dioxide from ilmenite using sulfuric acid-decomposition by liquid phase method. Powder Technol. 2016, 287, 256–263. [Google Scholar] [CrossRef]
- Elnagar, M.M.; Hashem, M.A.; Hassanien, M.M.; Ismail, M.A. pH-controlled mixed micelle cloud point extraction for selective removal of trace levels of iron from titanium concentrates. Sep. Purif. Technol. 2021, 265, 118534. [Google Scholar] [CrossRef]
- Middlemas, S.; Fang, Z.Z.; Fan, P. A new method for production of titanium dioxide pigment. Hydrometallurgy 2013, 131–132, 107–113. [Google Scholar] [CrossRef]
- Peng, H.; Shang, Q.; Chen, R.; Zhang, L.; Chen, Y.; Guo, J. Step-Adsorption of Vanadium (V) and Chromium (VI) in the Leaching Solution with Melamine. Sci. Rep. 2020, 10, 6326. [Google Scholar] [CrossRef]
- Lin, S.; Yang, F.; Yang, Z.; Wang, J.; Xiang, L. Preparation of Hydrated TiO2 Particles by Hydrothermal Hydrolysis of Mg/Al-Bearing TiOSO4 Solution. Nanomaterials 2023, 13, 1179. [Google Scholar] [CrossRef] [PubMed]
- Tian, C.; Huang, S.; Yang, Y. Anatase TiO2 white pigment production from unenriched industrial titanyl sulfate solution via short sulfate process. Dyes Pigm. 2013, 96, 609–613. [Google Scholar] [CrossRef]
- Yang, F.; Luo, W.; Wang, J.; Xiang, L. Effects of Mg2+ doped TiO2 defect structures on TiO2 anatase-to-rutile phase transition. J. Alloys Compd. 2023, 958, 170529. [Google Scholar] [CrossRef]
- Wu, B.; Yang, Z.; Dai, X.; Yin, X.; Gan, Y.; Nie, F.; Ren, Z.; Cao, Y.; Li, Z.; Zhang, X. Hierarchical sheet-on-sheet heterojunction array of a beta-Ni(OH)2/Fe(OH)3 self-supporting anode for effective overall alkaline water splitting. Dalton Trans. 2021, 50, 12547–12554. [Google Scholar] [CrossRef] [PubMed]
- Balakhonov, S.V.; Efremova, M.V.; Ivanov, V.K.; Churagulov, B.R. Facile synthesis of vanadia aerogels with controlled V3+/V4+ ratio. Mater. Lett. 2015, 156, 109–112. [Google Scholar] [CrossRef]
- Zhang, J.; Wang, M.; Zeng, M.; Li, X.; Chen, L.; Yang, Z.; Chen, J.; Guo, B.; Ma, Z.; Li, X. Sulfite modified and ammonium ion intercalated vanadium hydrate with enhanced redox kinetics for aqueous zinc ion batteries. J. Power Source 2021, 496, 229832. [Google Scholar] [CrossRef]
- Szilágyi, I.; Königsberger, E.; May, P.M. Characterization of Chemical Speciation of Titanyl Sulfate Solutions for Production of Titanium Dioxide Precipitates. Inorg. Chem. 2009, 48, 2200–2204. [Google Scholar] [CrossRef] [PubMed]
- Crans, D.C.; Smee, J.J.; Gaidamauskas, E.; Yang, L. The Chemistry and Biochemistry of Vanadium and the Biological Activities Exerted by Vanadium Compounds. Chem. Rev. 2004, 104, 849–902. [Google Scholar] [CrossRef]
- Meites, L.; Matijević, E. A microcalorimetric investigation of the thermodynamics of formation of the HSO4−, AlSO4+, and Al(SO4)2− ions in aqueous solutions at temperatures between 25 and 70 °C. Anal. Chim. Acta 1982, 139, 197–205. [Google Scholar] [CrossRef]
- Liu, B.; Wang, X.; Cai, G.; Wen, L.; Song, Y.; Zhao, X. Low temperature fabrication of V-doped TiO2 nanoparticles, structure and photocatalytic studies. J. Hazard. Mater. 2009, 169, 1112–1118. [Google Scholar] [CrossRef]
- Sathyamoorthy, S.; Moggridge, G.D.; Hounslow, M.J. Particle Formation during Anatase Precipitation of Seeded Titanyl Sulfate Solution. Cryst. Growth Des. 2001, 1, 123–129. [Google Scholar] [CrossRef]
- Zheng, L.; Liang, B.; Lü, L.; Jia, L.; Li, C. Effect of impurities on the hydrolysis of low-concentration titanyl sulfate solutions. Res. Chem. Intermed. 2015, 41, 5423–5438. [Google Scholar] [CrossRef]
- Kanamori, K.; Kameda, E.; Okamoto, K.-I. Heptacoordinate vanadium (III) complexes containing a didentate sulfate ligand. X-ray structures of [V2(SO4)3 {N, N′-bis (2-pyridylmethyl)-1, 2-ethanediamine}2] and [V(SO4){N, N, N′, N′-tetrakis (2-pyridylmethyl)-1, 2-ethanediamine}]+ and their solution properties. Bull. Chem. Soc. Jpn. 1996, 69, 2901–2909. [Google Scholar] [CrossRef]
- Tian, M.; Liu, Y.; Wang, L.; Chen, D.; Zhao, H.; Meng, F.; Zhen, Y.; Qi, T. Role of aluminum salt on thermal hydrolysis of titanyl sulfuric–chloric mixture acid solution. J. Mater. Res. Technol. 2021, 14, 2486–2496. [Google Scholar] [CrossRef]

Disclaimer/Publisher’s Note: The statements, opinions and data contained in all publications are solely those of the individual author(s) and contributor(s) and not of MDPI and/or the editor(s). MDPI and/or the editor(s) disclaim responsibility for any injury to people or property resulting from any ideas, methods, instructions or products referred to in the content. |
© 2023 by the authors. Licensee MDPI, Basel, Switzerland. This article is an open access article distributed under the terms and conditions of the Creative Commons Attribution (CC BY) license (https://creativecommons.org/licenses/by/4.0/).