Abstract
This study investigated the synthesis of cerium oxide (CeO2) nanoparticles (NPs) and composites with reduced graphene oxide (rGO) for the enhanced electrochemical sensing of ammonia. CeO2 NPs were prepared by the focused laser ablation in liquid (LAL) method, which enabled the production of high-purity, spherical nanoparticles with a uniform dispersion and sizes under 50 nm in a short time. The effects of varying irradiation fluence and time on the nanoparticle size, production yield, and dispersion were systematically studied. The synthesized CeO2 NPs were doped with rGO to form CeO2/rGO composites, which were drop casted to modify the glassy carbon electrodes (GCE). The CeO2/rGO-GCE electrodes exhibited superior electrochemical properties compared with single-component electrodes, which demonstrated the significant potential for ammonia detection, especially at a 4 J/cm2 fluence. The CeO2/rGO composites showed uniformly dispersed CeO2 NPs between the rGO sheets, which enhanced the conductivity, as confirmed by SEM, EDS mapping, and XRD analysis. Cyclic voltammetry data demonstrated superior electrochemical activity of the CeO2/rGO composite electrodes, with the 2rGO/1CeO2 ratio showing the highest current response and sensitivity. The CV response to varying ammonia concentrations exhibited a linear relationship, indicating the electrode’s capability for accurate quantification. These findings highlight the effectiveness of focused laser ablation in enhancing nanoparticle synthesis and the promising synergistic effects of CeO2 and rGO in developing high-performance electrochemical sensors.
1. Introduction
Monitoring ammonia (NH4⁺) levels in the biomedical field is critically important due to its direct implications on human health [1,2], particularly in patients with liver disease [3]. The liver processes ammonia by converting it into urea for excretion [4]. However, in conditions such as cirrhosis [5], the liver’s capacity to handle ammonia diminishes, leading to its accumulation in the blood. Elevated ammonia levels can precipitate hepatic encephalopathy [6], which is a serious neuropsychiatric syndrome characterized by cognitive dysfunction, altered consciousness [7], and potentially a coma [8]. The necessity of effective ammonia monitoring is underscored by the metabolic origins of ammonia in the body, which is primarily produced from the catabolism [9] of amino acids in various organs, including the intestines [10], muscles [11], and kidneys [12]. Given the potential for ammonia to cause severe health complications, the real-time monitoring of blood NH4⁺ levels is essential [13], making ammonia sensors vital tools in managing liver diseases and preventing the onset of hepatic encephalopathy. Additionally, integrating these modified carbon-based sensors into portable devices for real-time monitoring or their use in clinical settings [14] for patient diagnostics could significantly enhance patient care and disease management.
Electrochemical sensors are highly effective for detecting and monitoring gases due to their high sensitivity, selectivity, and rapid response times [15,16,17]. These sensors work by generating electrical signals when target molecules interact with electrodes [18]. In this research, a CeO2/rGO glassy carbon electrode (GCE) was designed to detect ammonia. The CeO2/rGO composite electrode combines cerium oxide nanoparticles with reduced graphene oxide (rGO) for a synergistic effect [19] to enhance the sensor’s performance. CeO2 provides catalytic activity [20], while rGO offers high conductivity [21] and a large surface area [22] for electron transfer. The synergistic effect between CeO2 and rGO significantly improves the electrochemical activity of the electrode, making it highly sensitive and effective for ammonia detection. To fully exploit the synergistic properties, the uniform spherical size and high dispersion of CeO2 nanoparticles are crucial to increase the specific surface area and electron transport of the reaction [23,24].
To increase the production and improve the quality of CeO2 nanoparticles for sensor applications, this study employed a focused laser ablation in liquid (LAL) method [25]. Compared with our previous research [26], this technique aims to produce smaller, uniformly dispersed, and spherical CeO2 nanoparticles with enhanced production efficiency [27] and less aggregation [28]. The focused laser beam intensifies the energy density at the target site, promoting more efficient ablation and higher nanoparticle yield [29]. This method allows for producing high-purity CeO2 nanoparticles in a very short time, significantly boosting the overall production efficiency [30]. When the focused laser beam irradiates the target material, the atoms absorb the laser energy, causing rapid thermal expansion and evaporation, leading to the ejection of surface atoms [31,32]. These ejected atoms and clusters then rapidly cool and condense in the surrounding liquid medium, forming nanoparticles [33]. The rapid cooling stabilizes the nanoparticles at the desired size and shape, preventing further agglomeration [34]. Compared with other synthesis methods, LAL is a green physical technique [35] that offers controllable parameters [36] and the capability to achieve high temperatures without generating by-products [37]. This method ensures a high yield and uniformity of the resulting nanoparticles, enhancing their suitability for sensor applications by providing consistent and high-quality coatings.
In this research, by optimizing the preparation method of CeO2 nanoparticles through the focused laser ablation method, we achieved high-purity nanoparticles with uniform dispersion in a very short time and with a high production efficiency. The mechanisms of irradiation fluence and the time effect on the nanoparticle size, production yield, and uniform dispersion through this sintering process were investigated. Our results demonstrated that the optimized CeO2 nanoparticles synthesized via focused laser irradiation exhibited a high purity, a spherical shape, and uniform dispersion of a small size, which is essential for effective sensor applications. Furthermore, the CeO2/rGO composite electrodes were shown to have superior electrochemical properties compared with single-component electrodes, highlighting their significant potential for ammonia monitoring and broader electrochemical sensing applications. This study underscored the effectiveness of focused laser ablation in enhancing nanoparticle synthesis and the promising synergistic effects of CeO2 and rGO in developing high-performance electrochemical sensors.
2. Experimental Methods
The CeO2 targets were first prepared under a 100 MPa pressure by a tablet machine. This was followed by a sintering process: 900 °C for 2 h and 1250 °C for another 2 h, resulting in tablets with an approximate thickness of 0.3 mm after sintering shrinkage. The sintered CeO2 target was placed in a glass bottle with 5 mL of pure water. An Nd:YAG laser (532 nm, 10 Hz, 13 ns pulse width) was used for ablation after the adjustment of PBS and HWP, and the irradiation beam was focused by a lens onto the target with fluences of 2, 4, 6, and 8 J/cm2 for various durations (10, 20, 30, 40, 50, and 60 min).
rGO was prepared by sintering graphene oxide at 500 °C, followed by ultrasonication. A total of 8 g of rGO was dispersed in 50 mL of pure water and ultrasonicated for 2 h according to our previous study [38]. CeO2 NPs were added to the rGO suspension in molar ratios of 4:1, 2:1, 1:1, 1:2, and 1:4, and were dispersed by ultrasonication and stirring for 30 min. After 24 h of precipitation, the mixture was centrifuged and freeze dried. The resulting CeO2-rGO composites were drop casted onto glassy carbon electrodes (GCEs), applied five times, and oven dried at 80 °C.
The morphology of CeO2 nanoparticles synthesized via the focused LAL process was characterized using SEM (Hitachi High-Tech. Co. S-4800, Tokyo, Japan) and DLS (Sysmex Co. Zetasizer Nano, Hyogo, Japan). UV–Vis spectroscopy (Jasco. Co. V-670, Tokyo, Japan) was employed for the production calculation of nanoparticles. Both the raw materials and synthesized CeO2 nanoparticles were identified using XRD (Philips PANalytical, X’Pert-Pro-MRD, Almelo, The Netherlands). Energy-dispersive X-ray spectroscopy (EDS, 200 kV, JEM-2010F, Co. JEOL, Tokyo, Japan) was used to analyze the elemental composition of the CeO2 nanoparticles. Cyclic voltammetry (CV, RRDE-3A Rotating Ring Disk Electrode Apparatus Ver.3.0, Co. BAS, Numazu, Japan) was used to evaluate the electrochemical properties and sensing performance of the synthesized CeO2-rGO nanocomposites.
3. Results and Discussion
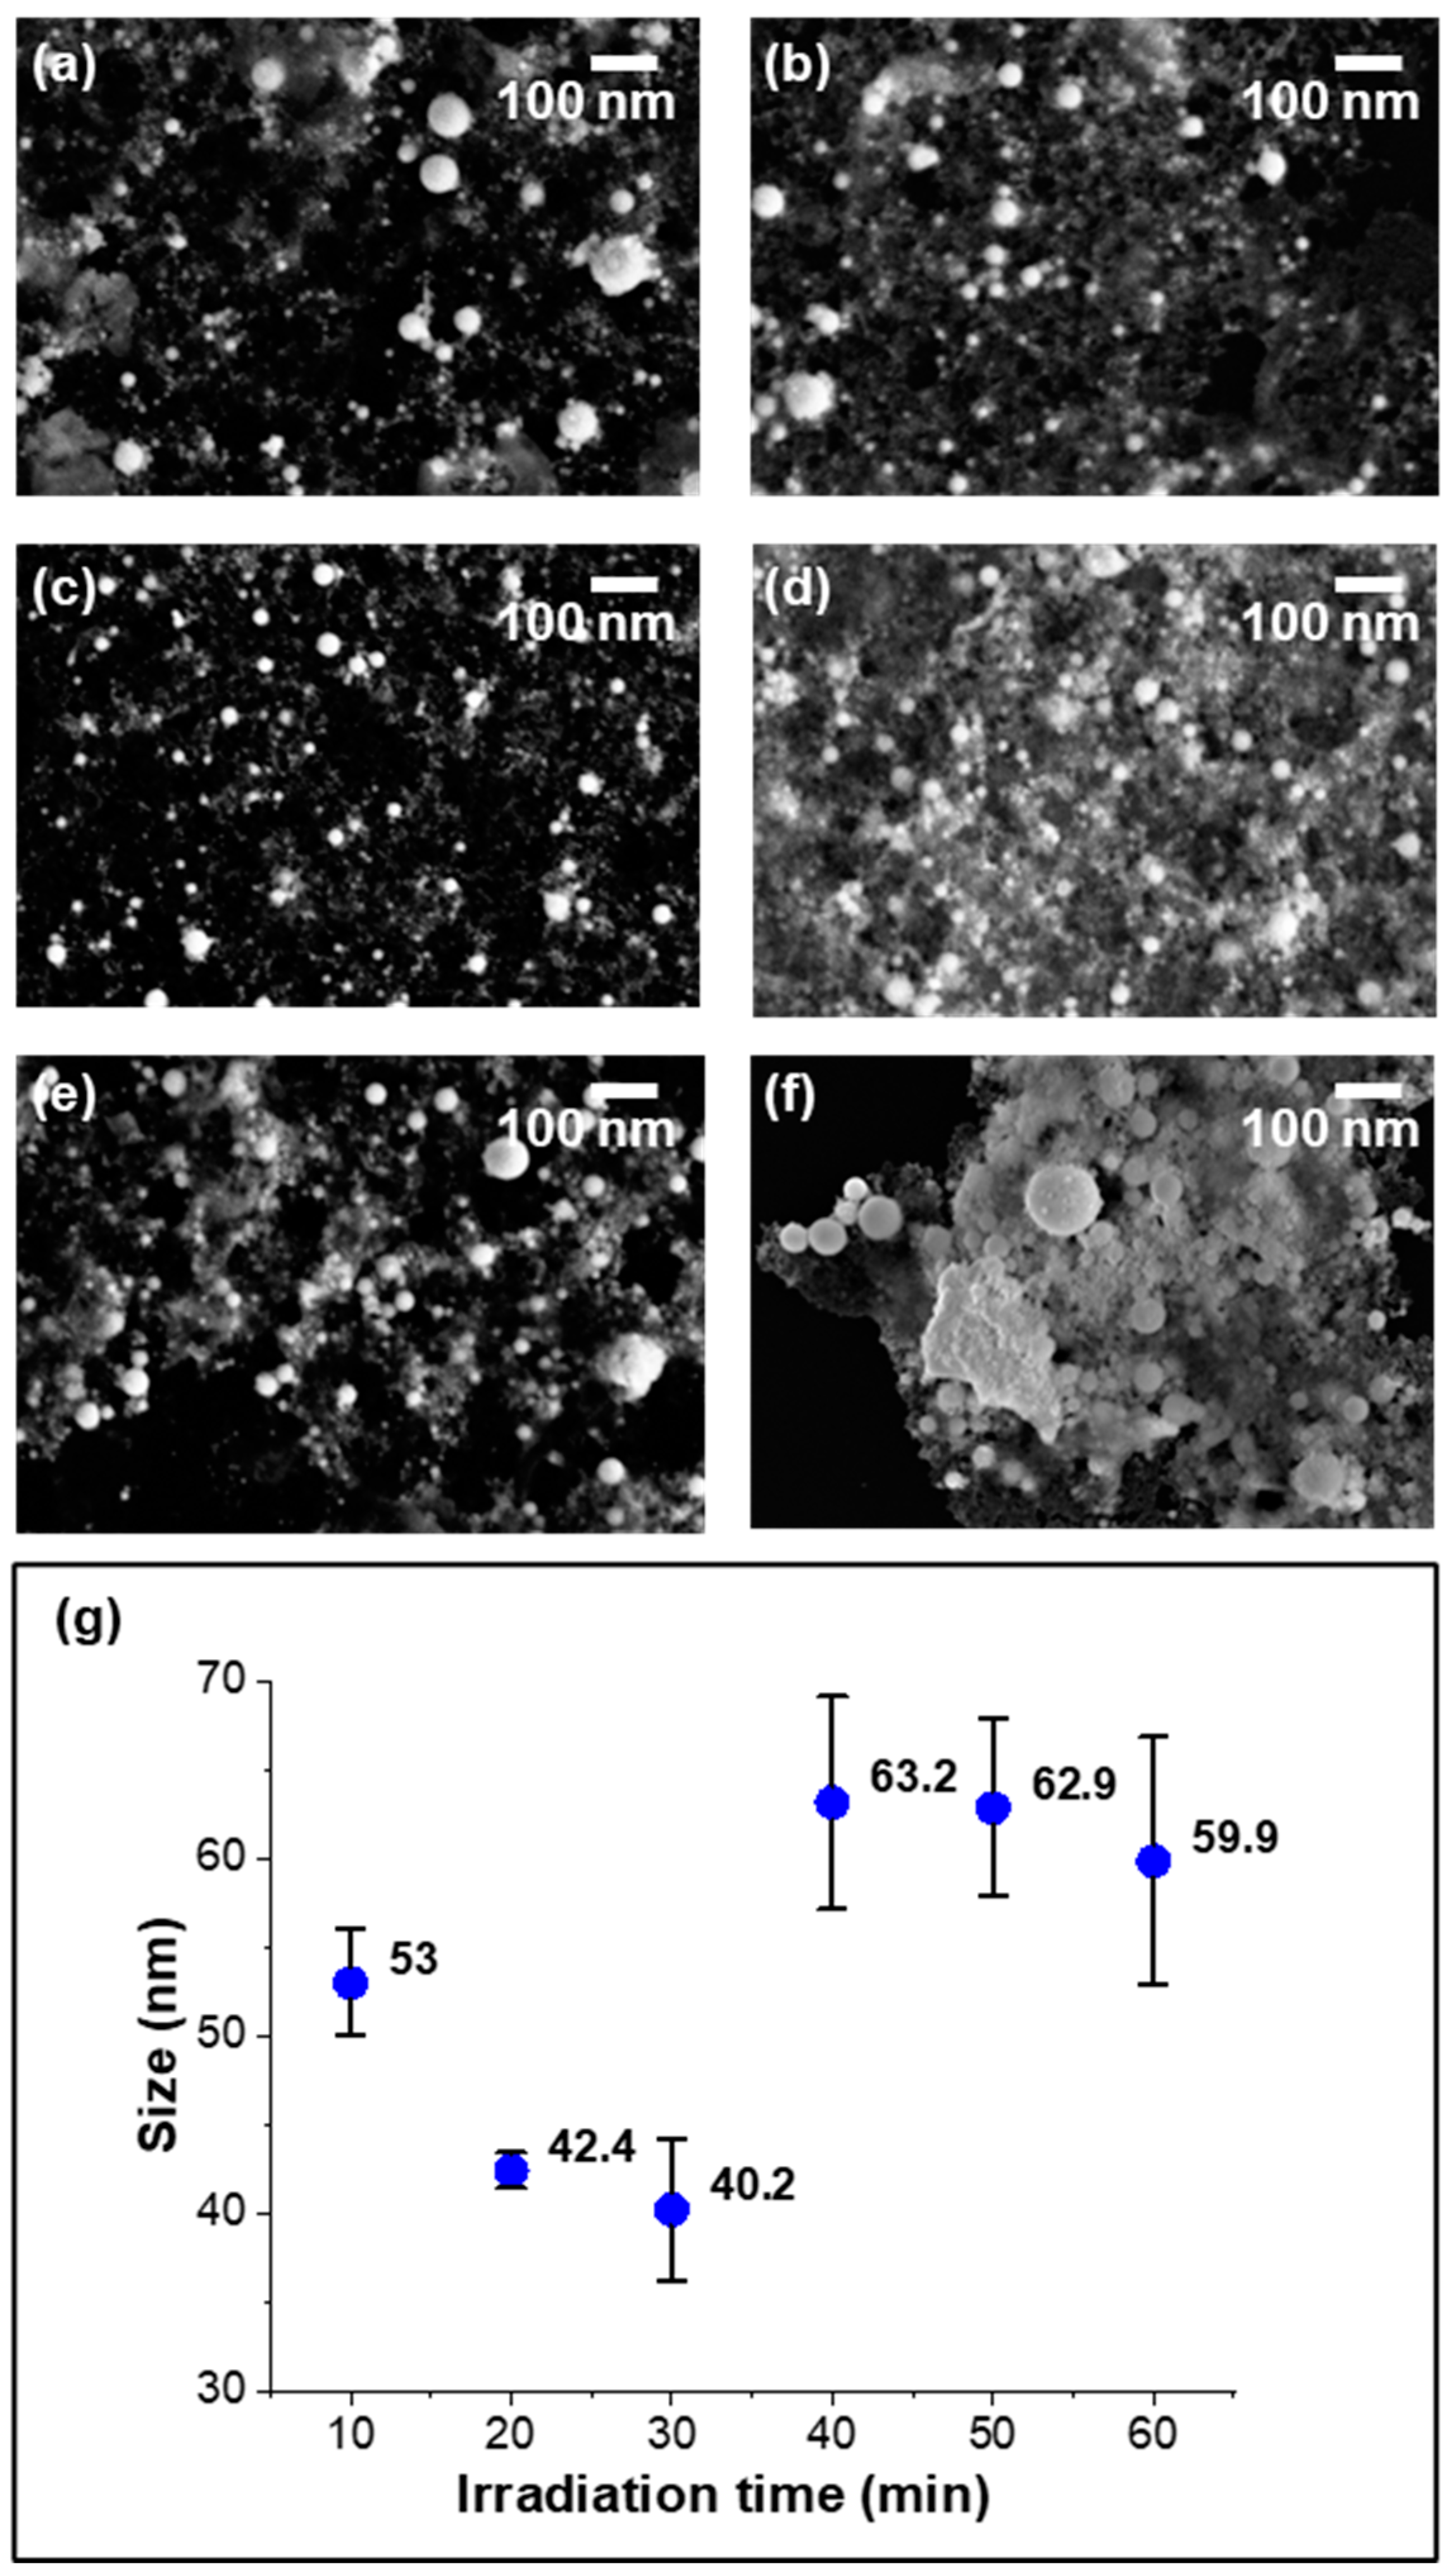
Figure 1 illustrates the size variation of the CeO2 nanoparticles synthesized via laser ablation in liquid (LAL) under a fluence of 4 J/cm2 and affected by increased irradiation time. This method effectively produces smaller and more uniformly sized nanoparticles compared with our previous research of non-beam-concentration techniques on suspension liquids [26]. The SEM figures show the existence of CeO2 nanoparticles in spherical shapes for each time duration, even for 10 min. The production of the nanoparticles also increased with prolonged irradiation time. This rapid formation process formed a plasma plume that interacted with the liquid, which peeled and cooled the nanoparticles [39]. Simultaneously, the CeO2 nanoparticles repeatedly underwent processes of melting, re-melting, and re-explosion, which resulted in a dynamic environment that favored the continuous production of small, uniformly sized particles. As the irradiation time increased, the SEM images show a gradual change in the nanoparticle morphology. Initially, the average particle size decreased with increased irradiation time and reached a minimum of around 30 min, indicating an efficient ablation process over time. The size distribution (Figure 1g) shows that at this stage, the primary particle sizes of the CeO2 nanoparticles decreased with the irradiation fluence increase. However, over 30 min, the primary particle size began to increase. This increase was likely due to the higher nanoparticle concentration in the liquid, where particles obstructed the laser path, which resulted in an insufficient irradiation fluence for some particles.
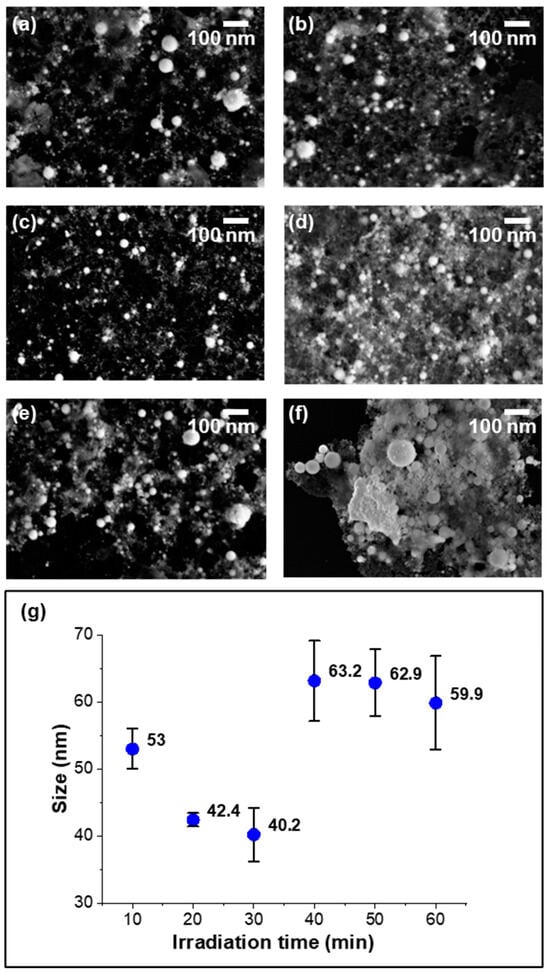
Figure 1.
SEM morphology of CeO2 nanoparticles ablated under a 5 J/cm2 fluence, with irradiation times of (a–f) 10, 20, 30, 40, 50, and 60 min, and (g) a histogram of average particle size with increased time.
To study the irradiation fluence effect on the CeO2 formation process, Figure 2 shows the SEM morphology of the CeO2 nanoparticles synthesized under the irradiation fluences of 2, 4, 6, and 8 J/cm2. The SEM images (a–d) show that as the irradiation fluence increased, the primary particle size decreased, as evidenced by the histogram of size distribution in Figure 2e and the average primary particle size (f). The linear fitting between the fluence and particle size indicates an inverse relationship, with a high R2 value of 0.92. This phenomenon could be attributed to the higher energy density provided by the increased fluence, which facilitated more efficient ablation and rapid cooling and led to the formation of smaller nanoparticles. At higher fluences, the energy delivered to the target material was sufficient to create a high-density plasma plume. This plasma plume enhanced the fragmentation of the target material into smaller nanoparticles.
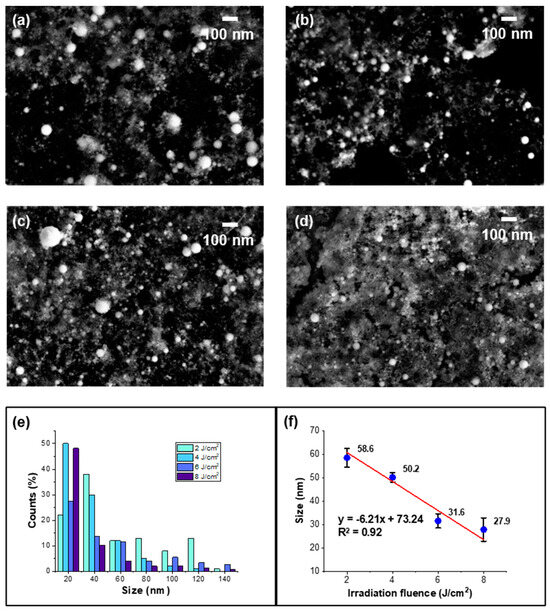
Figure 2.
SEM morphology of CeO2 nanoparticles ablated with an irradiation time of 30 min under irradiation fluences of (a–d) 2, 4, 6, and 8 J/cm2. (e) The primary size distribution and (f) average size of nanoparticles as a function of the laser fluence with a linear fitting.
However, with the irradiation fluence increase, particularly beyond 4 J/cm2, the SEM images (c, d) revealed a significant flocculent background beneath the CeO2 nanoparticles. This melting phenomenon occurred because of the laser-induced heating of the spinodal temperature in some areas, which was higher than the melting point of CeO2 [40]. Consequently, the material partially melted, which created a molten environment that facilitated the coalescence of nanoparticles into larger, irregular shapes. This effect was more pronounced at higher fluences due to the increased energy deposition and spinodal temperature, which not only ablated the target material but also induced localized melting. Also, due to the increased concentration by the effect of the higher fluence, clusters formed, as shown in Figure 2c,d. Therefore, we believe the irradiation fluence before the target melting (4 J/cm2) is the most suitable condition for preparing small-sized spherical CeO2 nanoparticles.
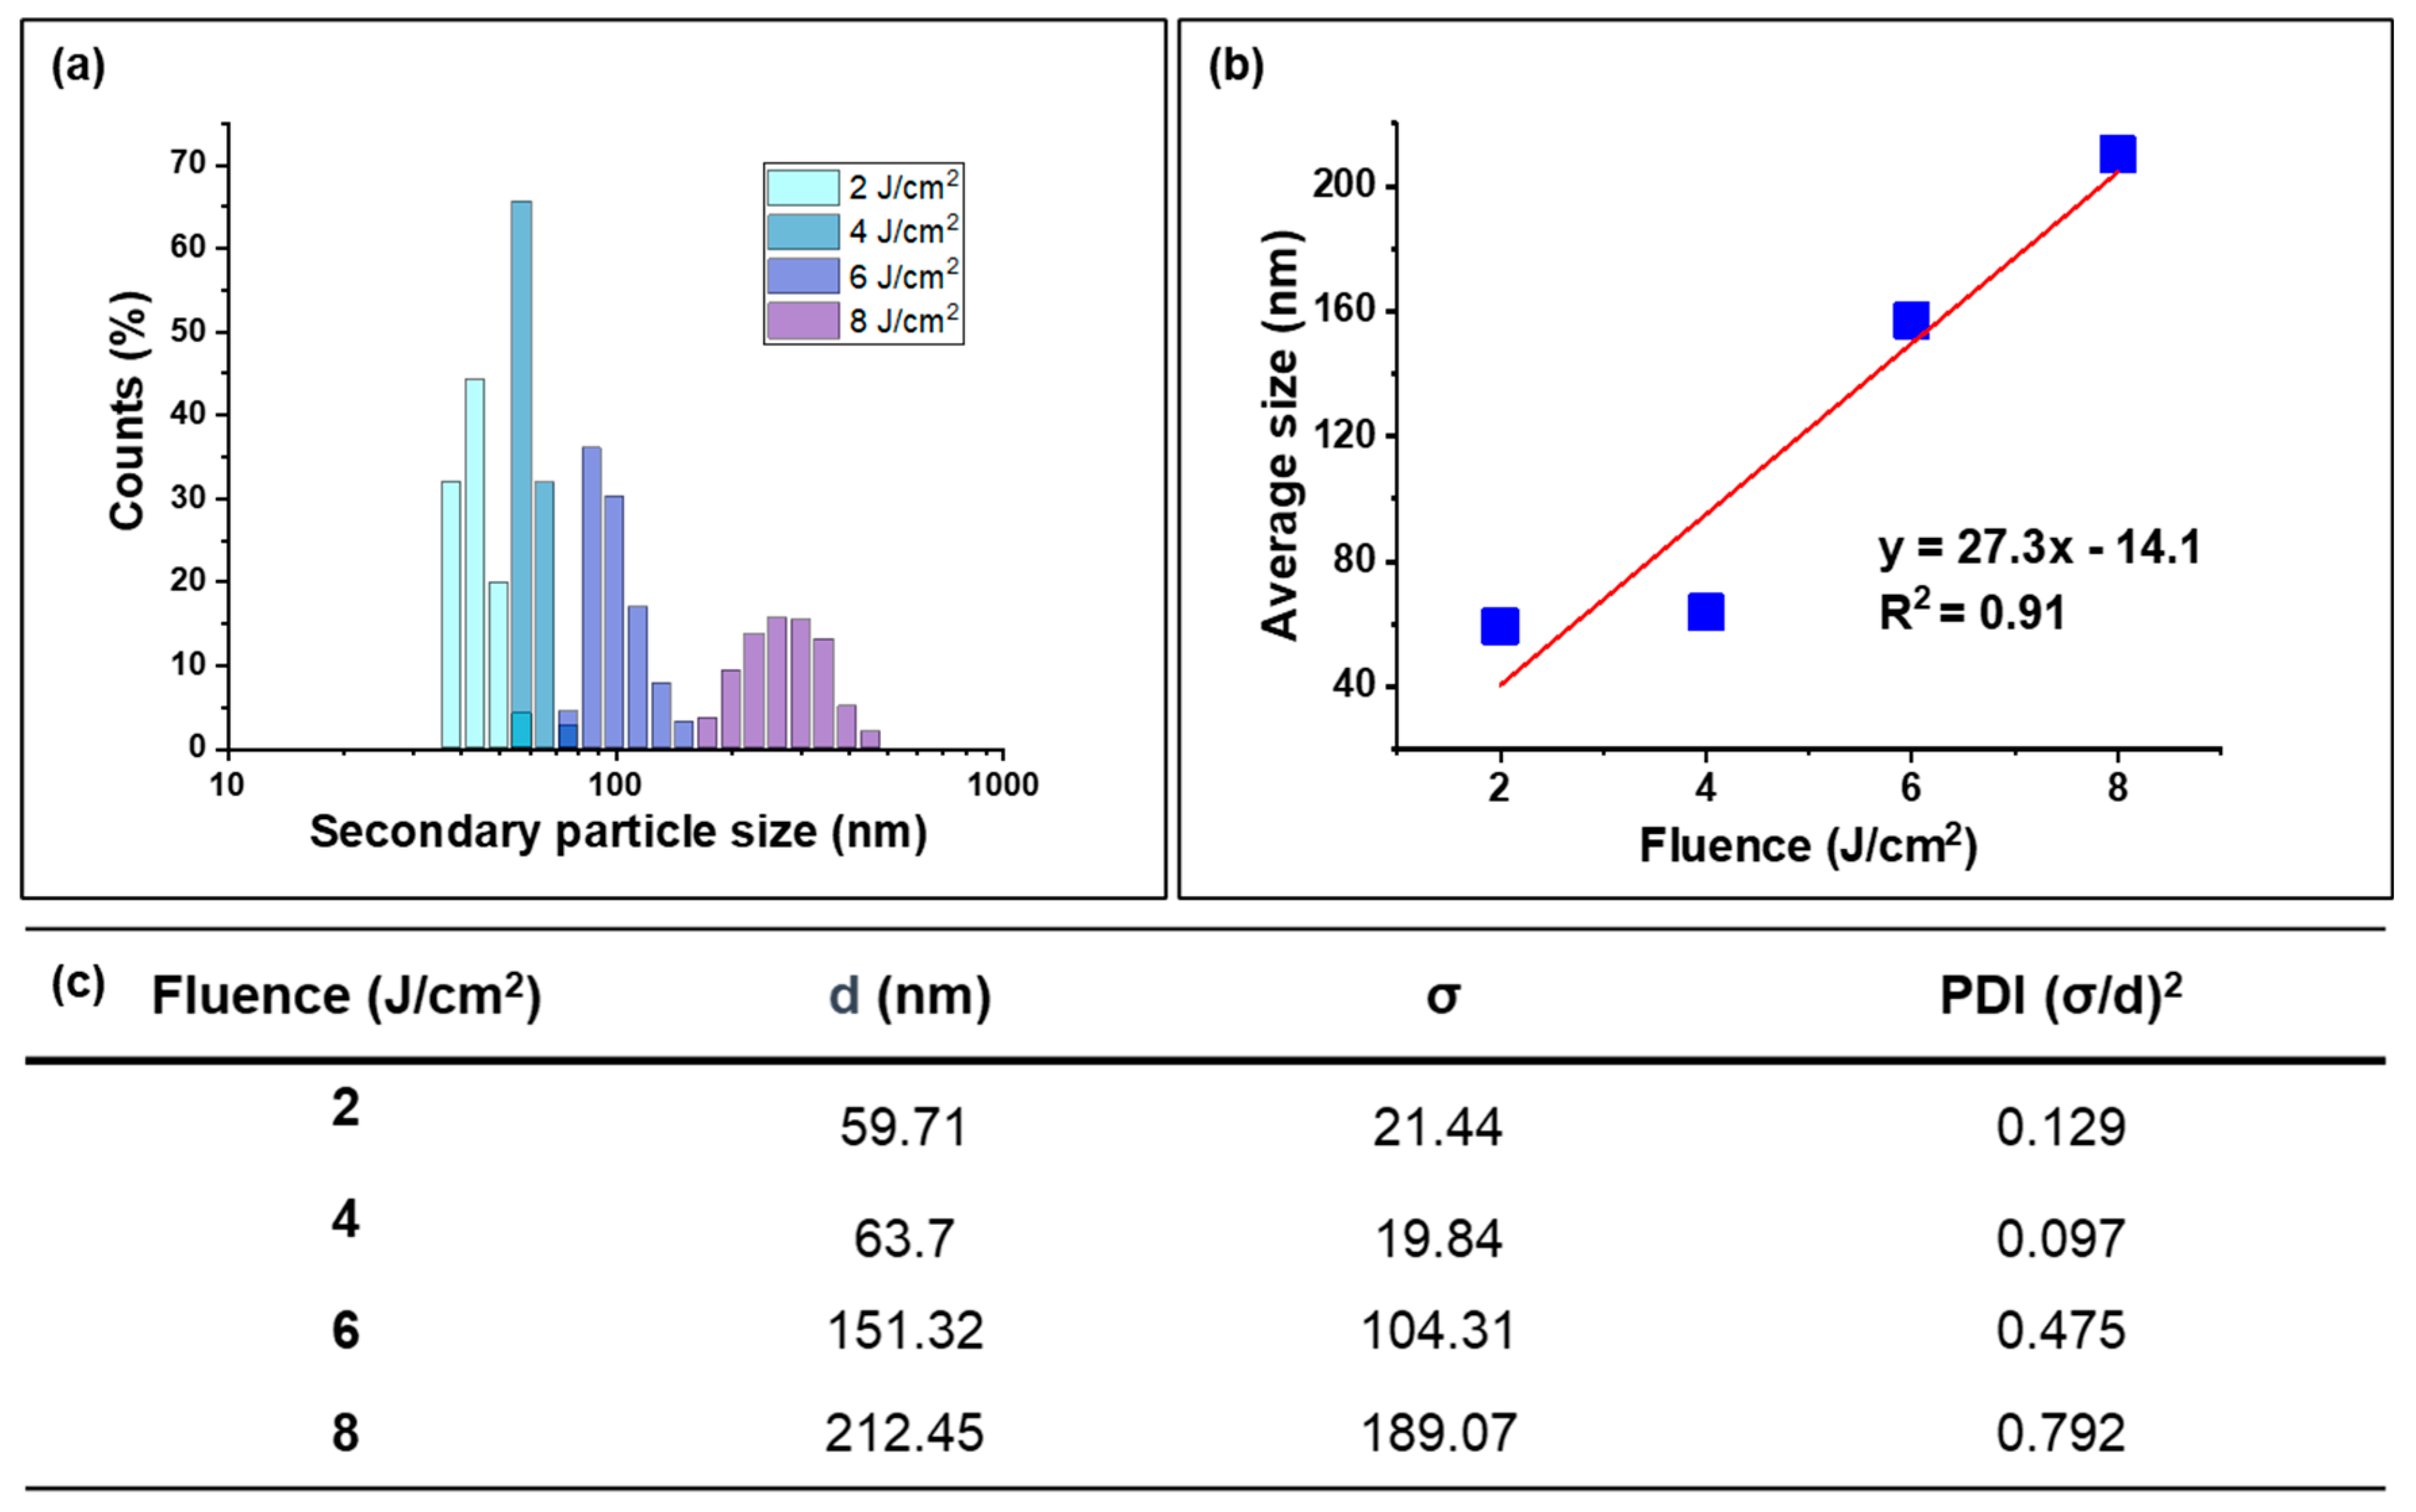
The secondary particle size distribution of CeO2 nanoparticles was measured by dynamic light scattering (DLS), as shown in Figure 3. The secondary particle size increased with increased fluence, and the linear fitting (Figure 2b) shows a positive relationship, which was in contrast with the primary particle size trend observed in the SEM data (Figure 2). This discrepancy could be attributed to the aggregation phenomenon, which was driven by several factors, such as the Van der Waals force [41], local electric charges [42], and the specific surface area [43] and led to minimizing the surface energy, which gave a thermodynamically stable status. As the fluence increased, more nanoparticles were generated, which led to higher particle concentrations in the solution. This higher concentration increased the likelihood of collisions and interactions between particles and resulted in the aggregation and formation of larger secondary particles. Additionally, as shown in the SEM image, the high-energy input at increased fluence levels could induce partial melting of the nanoparticles, which caused them to coalesce into larger aggregates upon cooling.

Figure 3.
(a) DLS histogram of secondary particle size distribution with an irradiation time of 30 min under irradiation fluences of 2, 4, 6, and 8 J/cm2. (b) Average secondary particle size as a function of energy fluence with the linear fitting. (c) PDI calculation of nanoparticles under each fluence.
To analyze the size distribution of the secondary particles, the polydispersity index (PDI) was calculated by Formula (1):
where σ is the standard deviation and d is the average particle size. The data in Figure 2c shows that the PDI increased significantly after aggregation and melting, indicating a broader and less uniform size distribution at higher fluences. Specifically, at a fluence below 4 J/cm2, the PDI value was around 0.1, suggesting a monodisperse system of CeO2 nanoparticles. However, as the fluence increased beyond 4 J/cm2, the PDI values rose, even to a PDI value of 0.792 under a fluence of 8 J/cm2, indicating an uneven size distribution of nanoparticles and reflecting the increased heterogeneity in particle size due to aggregation and melting effects.
The UV–visible data of the CeO2 nanoparticle suspension obtained after dilution 10 times were analyzed. Figure 4a shows the UV–vis spectra, where the suspension irradiated at 4 J/cm2 exhibited the highest absorption value, and this peak absorption was attributed to the large amount of dispersed nanosized CeO2 particles, which showed smaller and more uniformly sized nanoparticles at this fluence. As the fluence increased beyond 4 J/cm2, the absorption values tended to decrease, as depicted in Figure 4b, which can be explained by the aggregation phenomenon at higher fluences, which was consistent with the SEM (Figure 2) and DLS (Figure 3) data, where the agglomerated nanoparticles reduced the specific surface area for absorbing light and precipitate, which resulted in a decrease in the absorption peak.
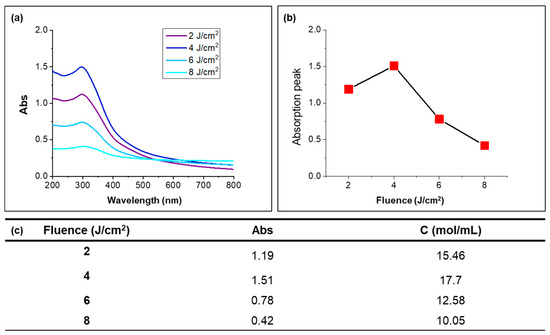
Figure 4.
(a) UV–vis spectrum of CeO2 nanoparticles ablated under each fluence with an irradiation time of 30 min. (b) Absorption peak intensity as a function of the irradiation fluence. (c) Concentration calculation under each fluence.
The concentration of CeO2 nanoparticles was calculated using the Beer–Lambert law [44] (Formula (2)), which relates the absorbance (A) to the concentration (C), path length (l), and molar absorptivity (ε):
Using the known concentration from the Supplementary Materials (Figure S1) and its corresponding UV–vis absorbance value, the molar absorptivity (ε) was determined, and the concentrations of CeO2 nanoparticle suspensions under different fluences are shown in Figure 4c. From the UV–vis data and subsequent calculations, the highest production of CeO2 nanoparticles was achieved at 17.7 mol/L and 4 J/cm2, which is approximately five times higher than the concentration produced using non-focused irradiation processes [25]. This significant increase in nanoparticle yield demonstrated the efficiency of the focused laser ablation method in generating high concentrations of well-dispersed CeO2.
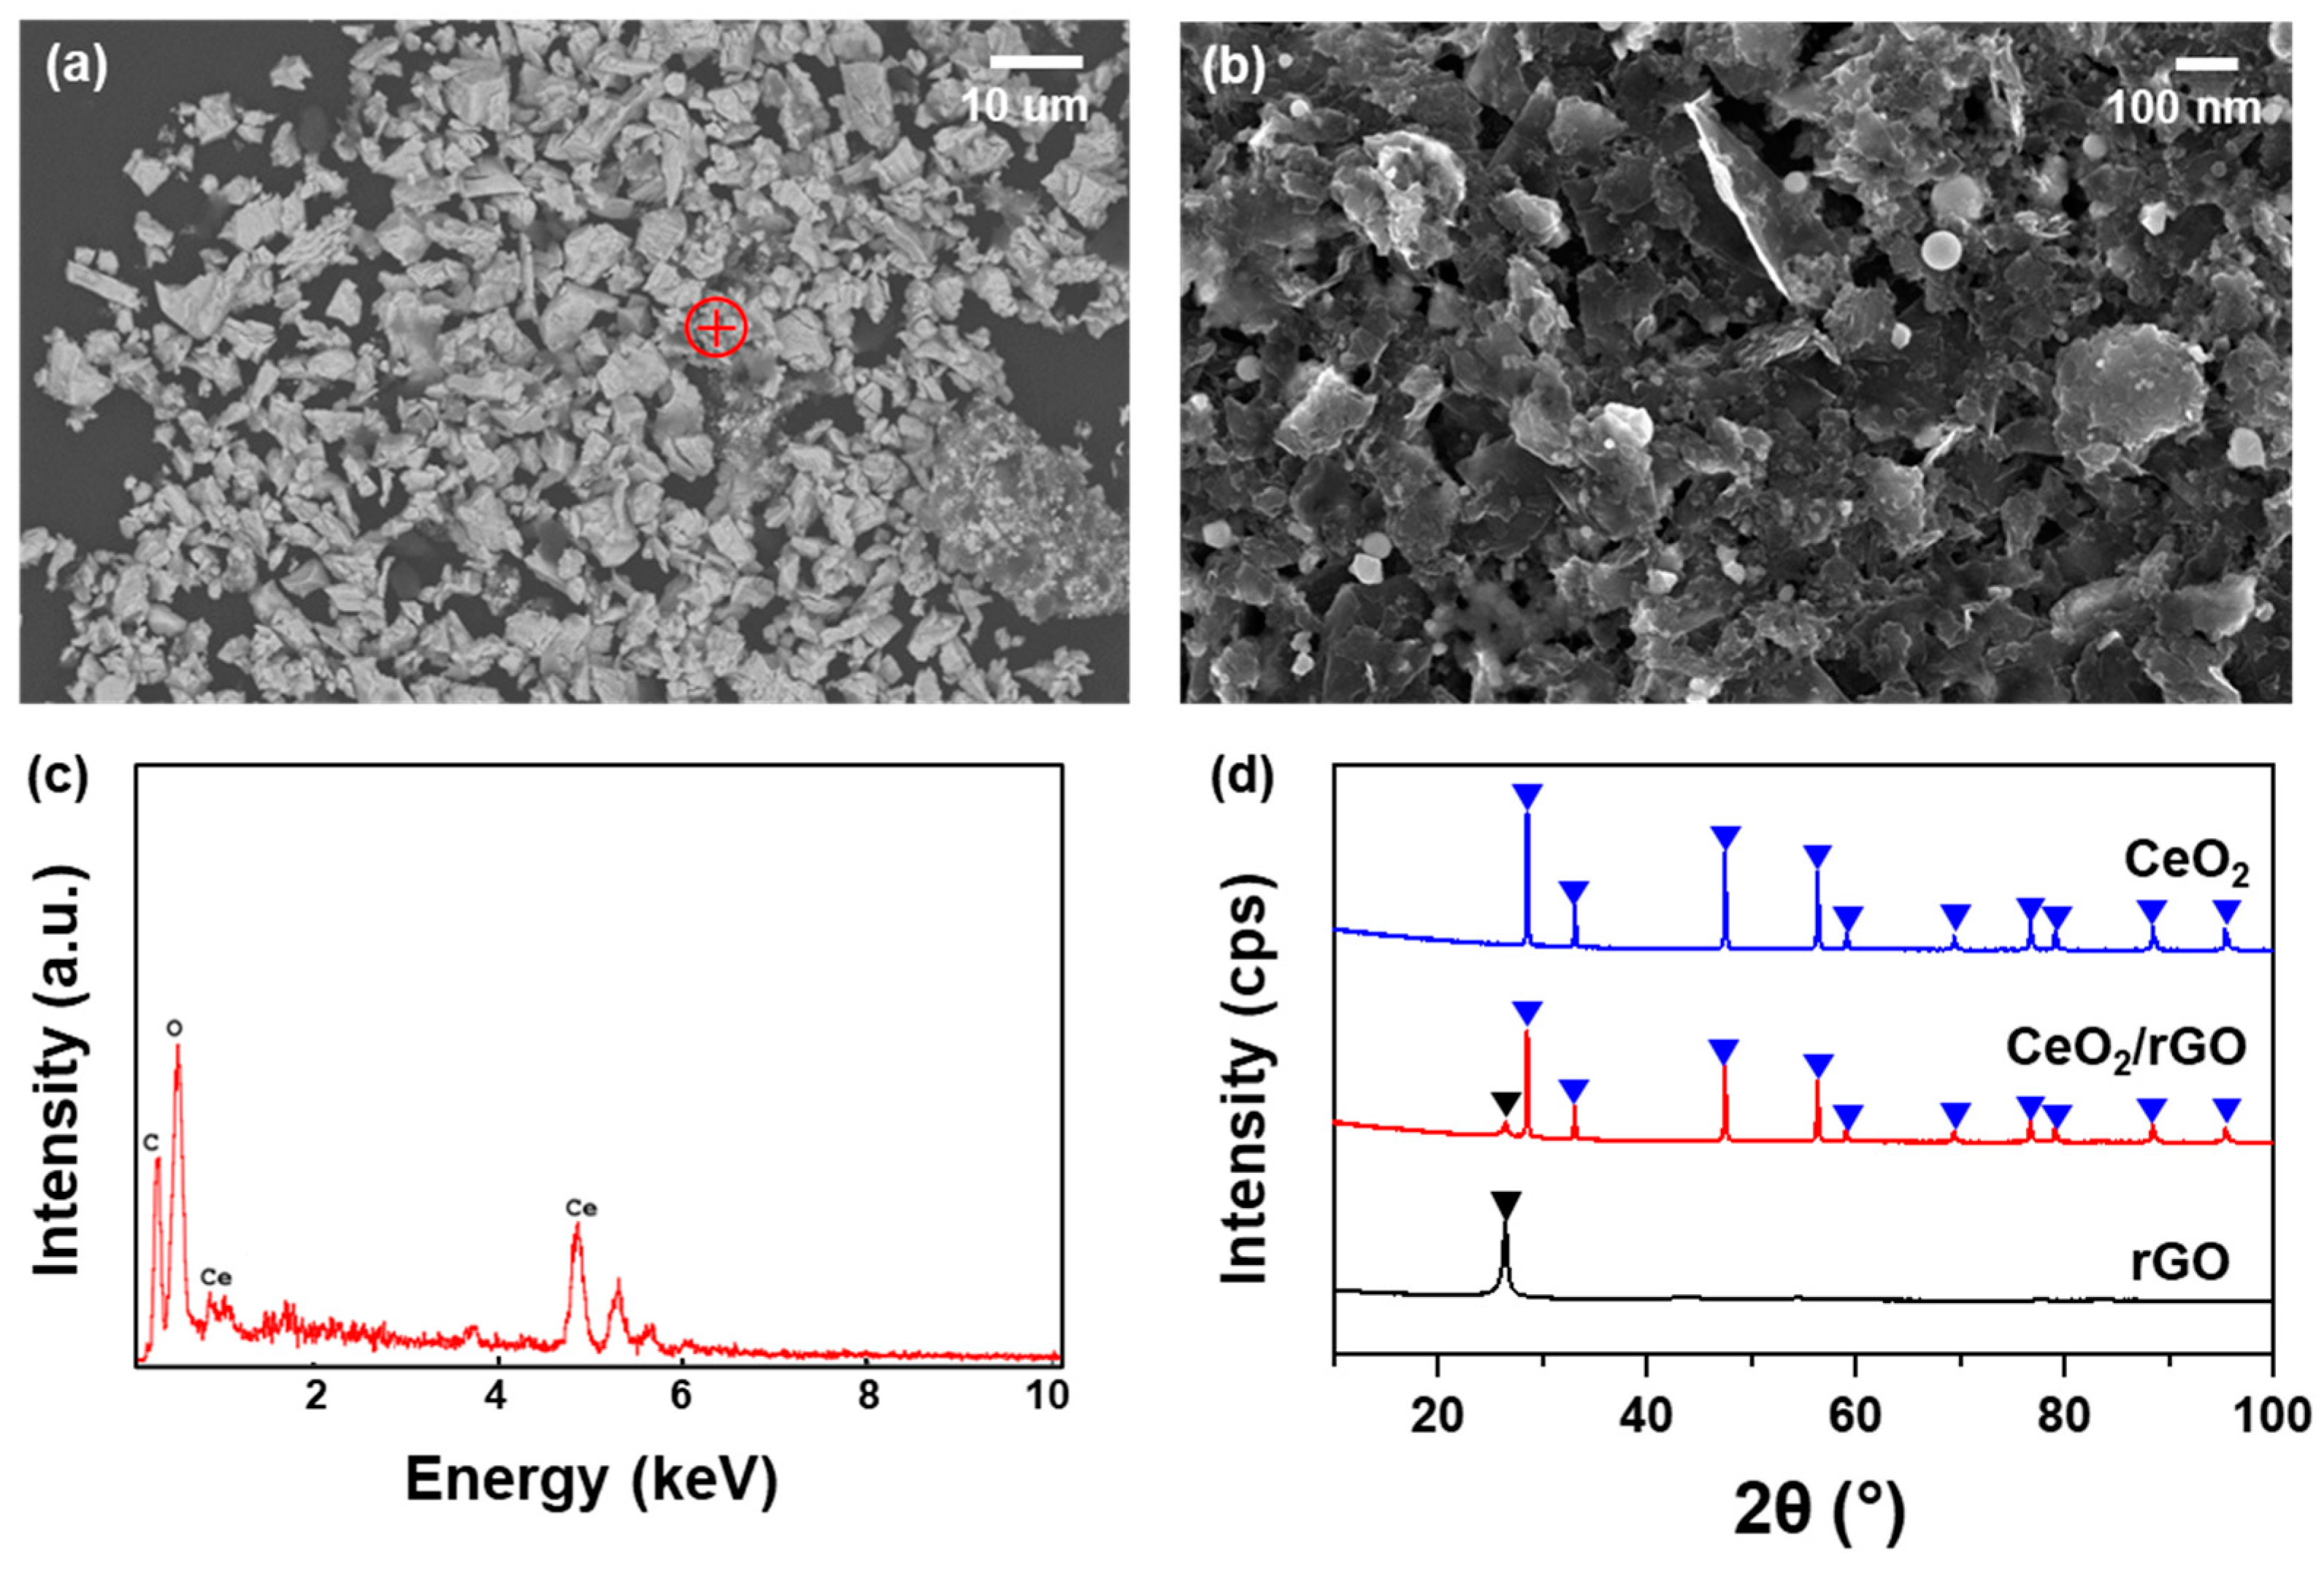
The morphology of the CeO2/rGO composite in a molar ratio of 1:1 is shown in Figure 5 through various characterization techniques. The SEM images (Figure 5a,b) at different magnifications demonstrate the uniform dispersion and combination of CeO2 nanoparticles into the gaps between the reduced graphene oxide (rGO) sheets, indicating that the rGO sheets served as an excellent support material for the CeO2 nanoparticles and enhanced the synergistic effects of the composite. The EDS mapping (Figure 5c) confirmed the presence of carbon (C), oxygen (O), and cerium (Ce) elements within the composite, with no detectable impurities. This elemental uniformity further supports the successful integration of CeO2 nanoparticles into the rGO matrix. The XRD patterns (Figure 5d) show distinct peaks corresponding to the (111), (200), (220), (311), (222), (400), (331), (420), and (422) crystallographic planes, which are characteristic of the cubic fluorite structure of CeO2. Additionally, the rGO pattern exhibited the (002) peak, which was significantly reduced after ultrasonication due to the adsorption of CeO2 nanoparticles between the rGO sheets. This adsorption reduced the interlayer spacing of rGO, and also because of the attenuation effect of CeO2 on X-rays, this led to a marked decrease in the intensity of the rGO diffraction peaks. The absence of any additional peaks in the XRD pattern indicates that there were no second phases present in the nanocomposites, suggesting a high purity of the CeO2/rGO composite.
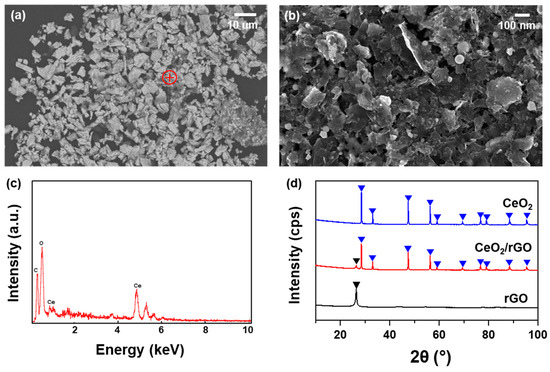
Figure 5.
(a) SEM image of CeO2/rGO composite in a molar ratio of 1:1 at low magnification; (b) SEM image at high magnification of the red pointed position in (a); (c) EDS mapping of the element distribution at the red point in (a); (d) XRD pattern of the CeO2 nanoparticles, rGO, and CeO2/rGO composite.
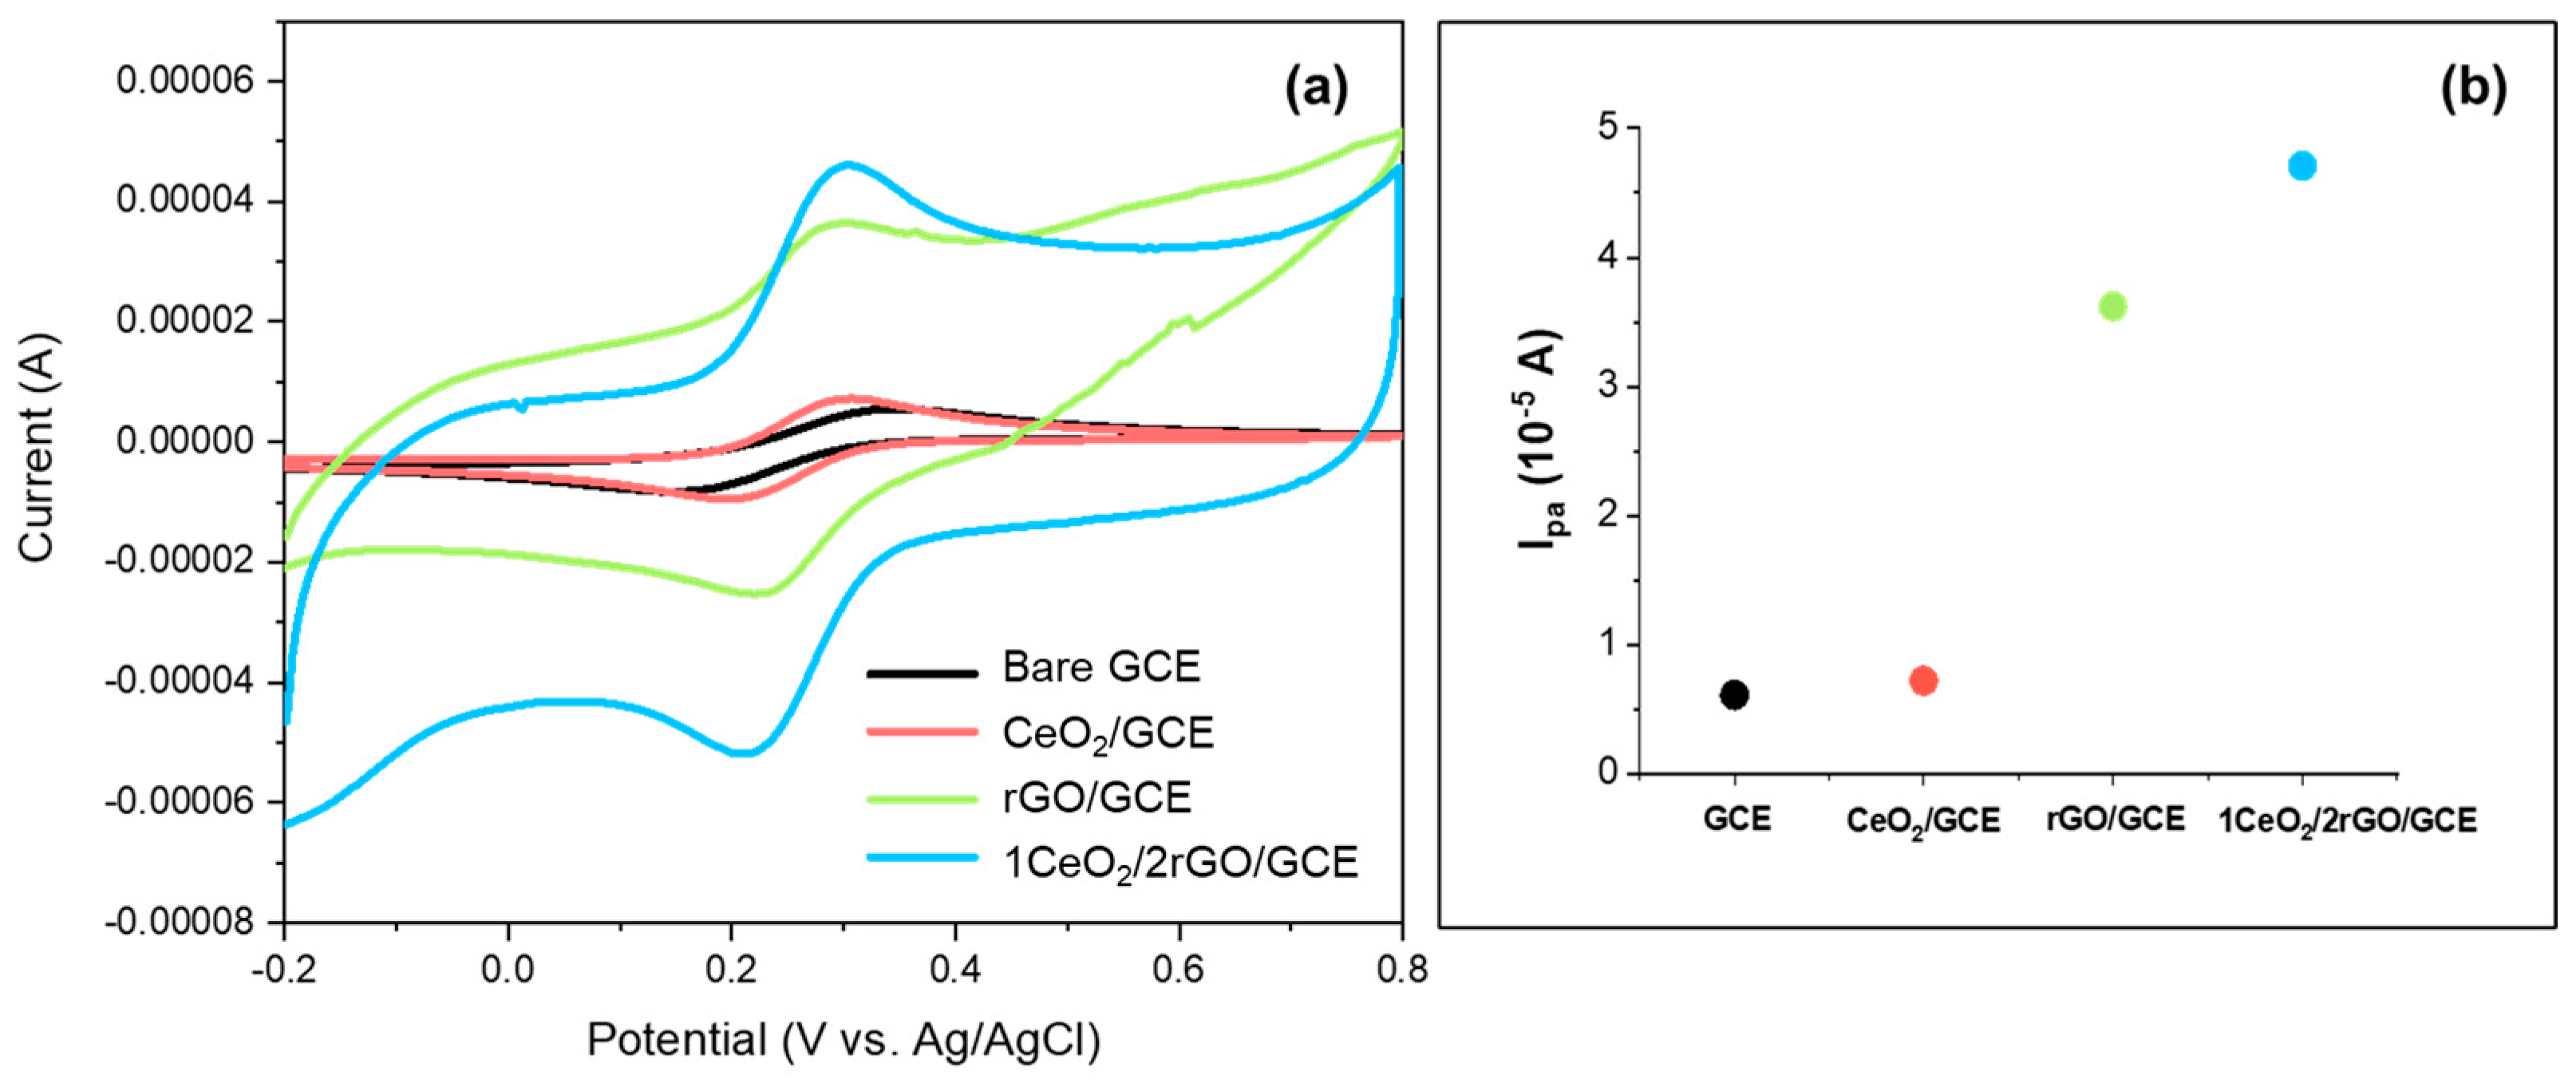
Cyclic voltammetry (CV) was used to measure the conductivity and sensitivity of the composite as an electrode coating for ammonia. The working electrode area was 0.07 cm2, with a sample interval of 5 mV under a 25 °C electrolyte temperature. Figure 6 shows the CV plot for different GCE coatings—bare GCE, CeO2/GCE, rGO/GCE, and CeO2/rGO/GCE (CeO2 and rGO in a molar ratio of 1:2)—in a 0.5 M KCl solution with 1 mM K3[Fe(CN)6] at a scan rate of 10 mV/s. The bare GCE showed a negligible current response, indicating poor electrochemical activity. The CeO2/GCE slightly improved the current response of the anodic peak (Ipa = 0.74 × 10⁻⁵ A), while rGO/GCE showed a significantly higher anodic peak (Ipa = 3.62 × 10⁻⁵ A) due to the rGO’s high conductivity and surface area. The 1CeO2/2rGO/GCE demonstrated the highest electron transfer and current response for the anodic peak (Ipa = 6.67 × 10⁻⁵ A), indicating that the combination of CeO2 and rGO enhanced the oxidation reaction. This enhancement was due to the synergistic effect between rGO and CeO2 nanoparticles like in a p–n heterojunction structure, where the oxygen-functional groups on the GO could facilitate the transfer of electrons as electron acceptors, and the CeO2 could donate or accept oxygen vacancies and electrons. This enhanced current response indicates that the CeO2/rGO composite is a promising candidate for high-sensitivity electrochemical applications.
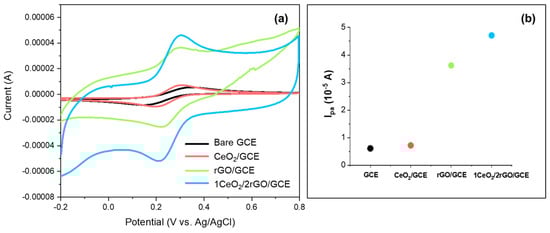
Figure 6.
(a) Cyclic voltammetry plots of GCE with different coatings (bare GCE, CeO2/GCE, rGO/GCE, 1CeO2/2rGO/GCE) in the presence of 1 mM K3[Fe(CN)6] in 0.5 M KCl, with a scan rate of 10 mV/s. (b) The anodic peak current of each coating.
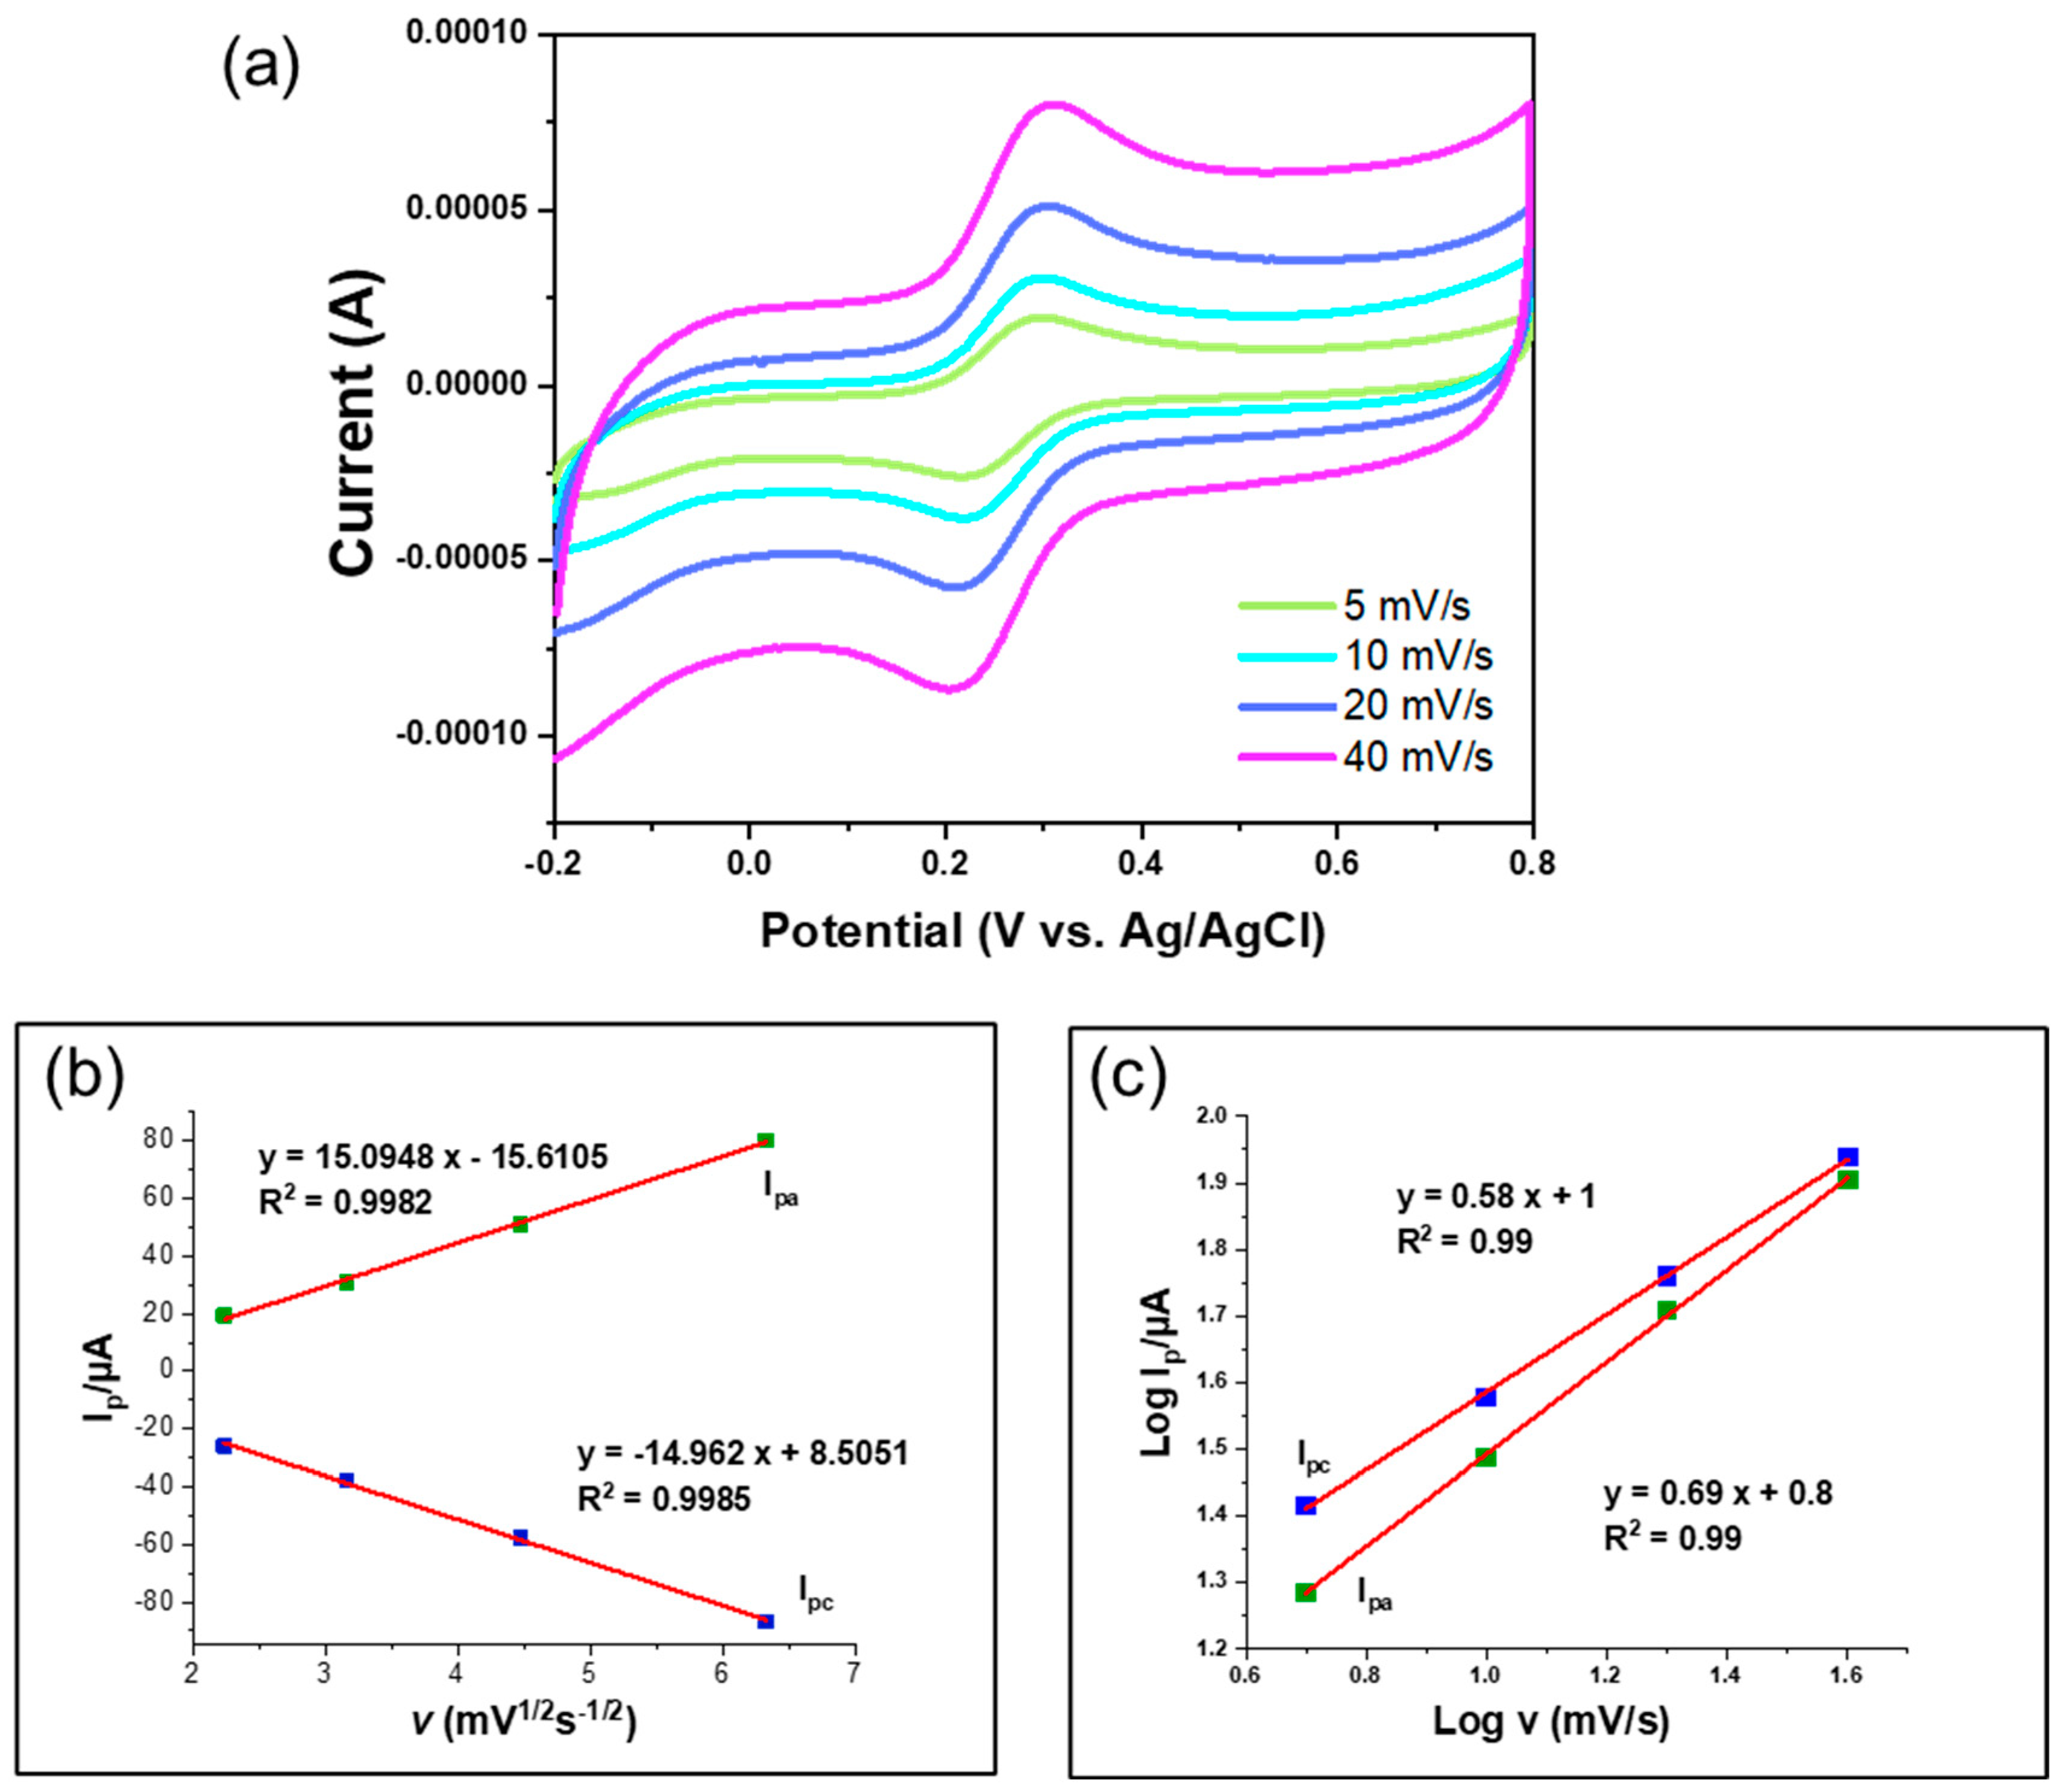
Figure 7 illustrates the cyclic voltammetry responses of the CeO2/rGO/GCE composite electrode at various scan rates (5, 10, 20, and 40 mV/s). The CV curves show that the peak currents for both anodic and cathodic processes increased with the scan rate. The linear relationship between the peak current and the square root of the scan rate (Figure 7b) suggests diffusion-controlled behavior, with high correlation coefficients (R2 = 0.9982 for Ipc and R2 = 0.9985 for Ipa), indicating that the CeO2/rGO/GCE composite electrode exhibited both surface-controlled and diffusion-controlled behavior, with effective electron transfer and high electrochemical activity. Additionally, the linear relationship between the logarithm of the redox peak current and the logarithm of scan rate (Figure 7c) was calculated with a slope of 0.69 (Ipa) and 0.58 (Ipc), which is close to 0.5, indicating that the diffusion-controlled mechanism dominated the reaction.
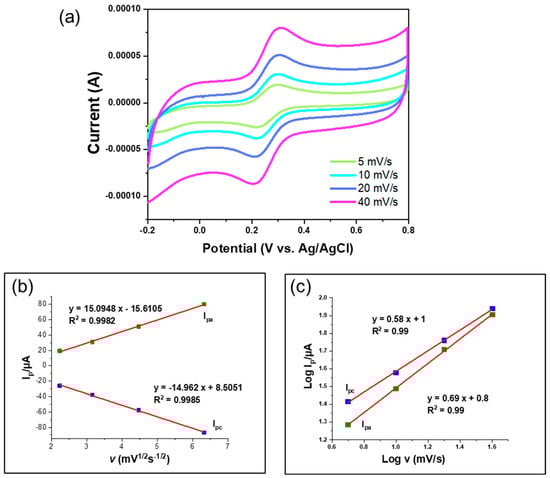
Figure 7.
(a) Cyclic voltammetry plots of CeO2/rGO/GCE (in a 1:1 molar ratio) with increased scan rate (5, 10, 20, 40 mV/s) in the presence of 1 mM K3[Fe(CN)6] in 0.5 M KCl. (b) Redox peak current as a function of the square root of the scan rate with a linear fitting. (c) The linear relationship between the logarithm of the redox peak current and the logarithm of the scan rate.
To analyze the sensitivity of NH4+, Figure 8 illustrates the CV plots of GCE with different coatings and various CeO2/rGO ratios. Figure 8a shows CV plots of the bare GCE, CeO2/GCE, rGO/GCE, and CeO2/rGO/GCE (molar ratio 1:1) in 0.5 M KCl with 1 M NH4⁺ at a scan rate of 20 mV/s. The bare GCE and CeO2/GCE electrodes exhibited a negligible current response, indicating they were not directly involved in the oxidation reactions. The rGO/GCE demonstrated a much higher current response due to rGO’s high electrical conductivity and large surface area, which facilitated better interaction with the NH4⁺ ions. However, the rGO/GCE showed an unclear peak, indicating a low selectivity. The CeO2/rGO/GCE kept the high current response with a higher selectivity, which was attributed to the synergistic effect between CeO2 and rGO; the mechanism of the reaction between the NH4+ ions and working electrodes is shown in Formula (3), where CeO2 has a unique oxygen vacancy structure that can transform between Ce4+ and Ce3+, thus acting as a bridge for the oxidation process of NH4+ (Formula (4)):
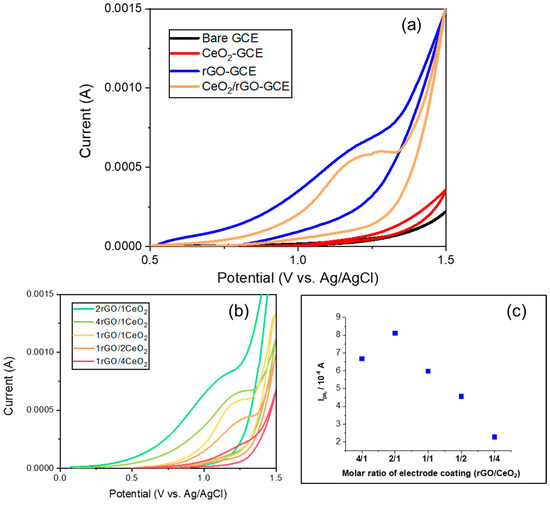
Figure 8.
(a) Cyclic voltammetry plots of GCE with different coatings (bare GCE, CeO2/GCE, rGO/GCE, CeO2/rGO/GCE) in the presence of 1 M NH4+ in 0.5 M KCl, with a scan rate of 20 mV/s; (b) CV plots of CeO2/rGO/GCE with different molar ratios (rGO/CeO2 = 4:1, 2:1, 1:1, 1:2, 1:4) in the presence of 1 M NH4+ in 0.5 M KCl and a scan rate of 20 mV/s; (c) anodic peak current (Ipa) value as a function of the composite ratio.
To study the current response effect on the composite ratio, Figure 8b presents CV plots of the GCE coated with different CeO2/rGO ratios (4:1, 2:1, 1:1, 1:2, 1:4) under the same conditions. The 2rGO/1CeO2 ratio exhibited the highest current response (0.82 mA, Figure 8c), indicating the most effective combination for enhancing electrochemical activity and sensitivity to NH4⁺, and much higher than the pure rGO coating (0.64 mA, Figure 8a). The 1rGO/2CeO2 and 1rGO/4CeO2 ratios exhibited moderate current responses, suggesting that a higher CeO2 content may hinder performance due to potential agglomeration and reduce the sensitivity.
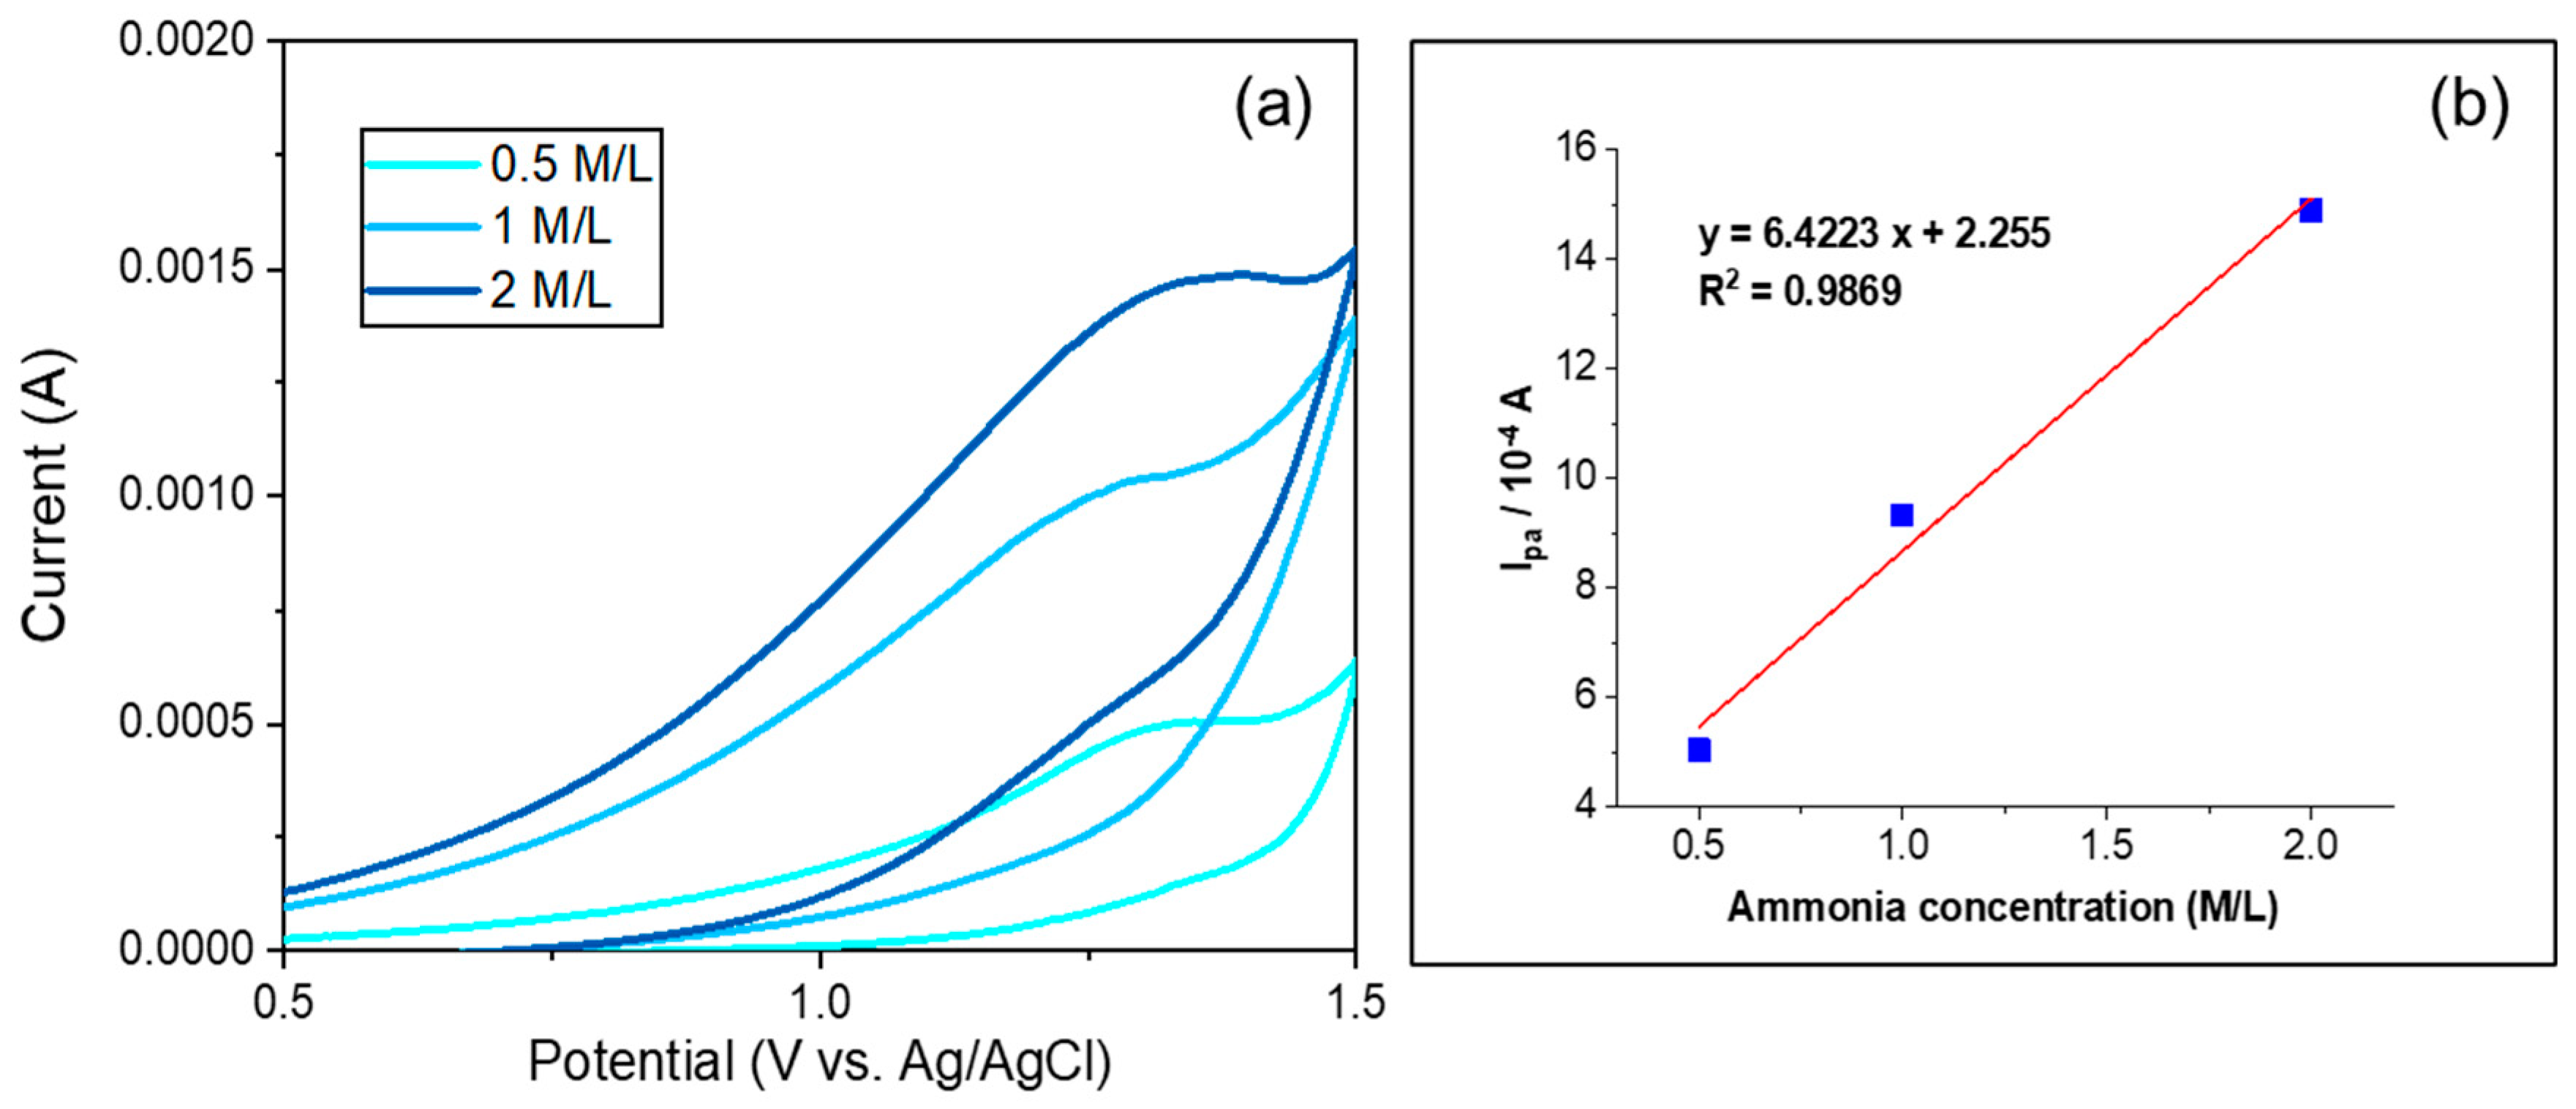
The CV plots of CeO2/rGO/GCE (in a 1:1 molar ratio) in the presence of increased ammonia concentrations (0.5, 1, and 2 M/L) in 0.5 M KCl solution are shown in Figure 9a. The current response significantly increased, where the increased current response suggests that the electrode was highly sensitive to changes in the ammonia concentration. The corresponding anodic peak current (Ipa) as a function of the ammonia concentration with a linear fitting is shown in Figure 9b, with the data points exhibiting a clear linear trend, as confirmed by the linear fitting (R2 = 0.9869). This linear relationship demonstrated that the peak current increased proportionally with the ammonia concentration, which allowed for accurate quantification based on the measured current. The enhanced current response and linearity highlight the effectiveness of the CeO2/rGO/GCE electrode for ammonia detection.
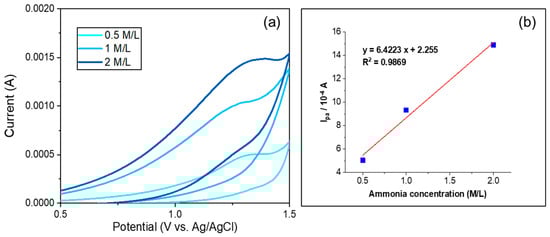
Figure 9.
(a) Cyclic voltammetry plots of CeO2/rGO/GCE (in a 1:1 molar ratio) in the presence of increased ammonia concentrations (0.5, 1, 2 M/L) in a 0.5 M KCl solution. (b) Anodic peak current (Ipa) as a function of the ammonia concentration with a linear fitting.
4. Conclusions
In this research, we explored the focused irradiation light on the preparation of CeO2 nanoparticles (NPs) and investigated the enhanced properties and performance of a CeO2/rGO coating on GCE electrodes. The increased irradiation time initially decreased the particle size due to efficient ablation and rapid cooling, but prolonged times led to aggregation due to higher nanoparticle concentrations. Higher fluence levels resulted in smaller primary particles but also induced significant melting and aggregation, which caused secondary particles to increase in size. UV–vis spectroscopy confirmed that the high production of CeO2 nanoparticles by focused light was significantly higher than non-focused irradiation processes, especially at a 4 J/cm2 fluence. The CeO2/rGO composites were shown to have uniformly dispersed CeO2 NPs between the rGO sheets, which enhanced the synergistic effect and provided high conductivity, as confirmed by SEM, EDS mapping, and XRD analysis. The cyclic voltammetry data demonstrated that the CeO2/rGO composite electrodes exhibited superior electrochemical activity compared with the single-component electrodes, where the 2rGO/1CeO2 ratio showed the highest current response and sensitivity. The CV response to varying ammonia concentrations exhibited a linear relationship, indicating the electrode’s capability for accurate quantification. Overall, this study highlighted the successful synthesis of uniformly dispersed CeO2 NPs with enhanced production efficiency and the development of CeO2/rGO composites with superior electrochemical properties for potential applications in ammonia sensing.
Supplementary Materials
The following supporting information can be downloaded at: https://www.mdpi.com/article/10.3390/nano14151238/s1, Figure S1. Absorption peak intensity as a function of CeO2 nanoparticle concentration and the linear fitting.
Author Contributions
Conceptualization, H.W.; Formal analysis, M.S.; Investigation, M.S.; Writing—original draft, M.S.; Writing—review & editing, H.W.; Supervision, H.W.; Project administration, H.W. All authors have read and agreed to the published version of the manuscript.
Funding
This research received no external funding.
Data Availability Statement
The data presented in this study is contained within this article.
Acknowledgments
The authors would like to thank Hajime Arai and Guanyu Wang (for the electrochemical measurements), Yoshitaka Kitamoto (for the SEM and DLS), and Masaaki Fujii and Shun-ichi Ishiuchi (for the laser) at the Materials Analysis Division, Open Facility Center, Tokyo Tech, for their support during this study.
Conflicts of Interest
The authors declare no conflict of interest.
References
- Wyer, K.E.; Kelleghan, D.B.; Blanes-Vidal, V.; Schauberger, G.; Curran, T.P. Ammonia emissions from agriculture and their contribution to fine particulate matter: A review of implications for human health. J. Environ. Manag. 2022, 323, 116285. [Google Scholar] [CrossRef]
- Brannelly, N.T.; Hamilton-Shield, J.P.; Killard, A.J. The Measurement of Ammonia in Human Breath and its Potential in Clinical Diagnostics Crit. Rev. Anal. Chem. 2016, 46, 490. [Google Scholar] [CrossRef] [PubMed]
- Ott, P.; Vilstrup, H. Cerebral effects of ammonia in liver disease: Current hypotheses. Metab. Brain Dis. 2014, 29, 901–911. [Google Scholar] [CrossRef]
- Moore, J.H.; Boczko, E.M.; Summar, M.L. Connecting the dots between genes, biochemistry, and disease susceptibility: Systems biology modeling in human genetics. Mol. Genet. Metab. 2005, 84, 104–111. [Google Scholar] [CrossRef]
- Holecek, M. Ammonia and amino acid profiles in liver cirrhosis: Effects of variables leading to hepatic encephalopathy. Nutrition 2015, 31, 14. [Google Scholar] [CrossRef] [PubMed]
- Butterworth, R.F. Pathophysiology of Hepatic Encephalopathy: A New Look at Ammonia. Metab. Brain Dis. 2002, 17, 221–227. [Google Scholar] [CrossRef]
- Watanabe, A. Cerebral changes in hepatic encephalopathy. J. Gastroenterol. Hepatol. 1998, 13, 752–760. [Google Scholar] [CrossRef]
- Zieve, L. Pathogenesis of hepatic encephalopathy. Metab. Brain Dis. 1987, 2, 147. [Google Scholar] [CrossRef] [PubMed]
- Mazelis, M. 15—Amino Acid Catabolism. Amino Acid Catabolism; Miflin, B.J., Ed.; Academic Press: Cambridge, MA, USA, 1980; p. 541. [Google Scholar]
- Duan, Y.; Liu, Q.; Wang, Y.; Zhang, J.; Xiong, D. Impairment of the intestine barrier function in Litopenaeus vannamei exposed to ammonia and nitrite stress. Fish Shellfish Immunol. 2018, 78, 279–288. [Google Scholar] [CrossRef]
- Wu, Y.; Xia, Y.; Hu, A.; Xiong, G.; Wu, W.; Shi, L.; Chen, L.; Guo, X.; Qiao, Y.; Liu, C.; et al. Difference in muscle metabolism caused by metabolism disorder of rainbow trout liver exposed to ammonia stress. Sci. Total. Environ. 2024, 924, 171576. [Google Scholar] [CrossRef]
- He, K.; Luo, X.; Wen, M.; Wang, C.; Qin, C.; Shao, J.; Gan, L.; Dong, R.; Jiang, H. Effect of acute ammonia toxicity on inflammation, oxidative stress and apoptosis in head kidney macrophage of Pelteobagrus fulvidraco and the alleviation of curcumin. Comp. Biochem. Physiol. Part C Toxicol. Pharmacol. 2021, 248, 109098. [Google Scholar] [CrossRef] [PubMed]
- Deepak, K.; Balapure, A.; Priya, P.; Kumar, P.; Dubey, S.K.; Javed, A.; Chattopadhyay, S.; Goel, S. Development of a microfluidic device for the dual detection and quantification of ammonia and urea from the blood serum. Sens. Actuators A Phys. 2024, 369, 115174. [Google Scholar] [CrossRef]
- Shooshtari, M.; Salehi, A. An electronic nose based on carbon nanotube -titanium dioxide hybrid nanostructures for detection and discrimination of volatile organic compounds. Sens. Actuators B Chem. 2022, 357, 131418. [Google Scholar] [CrossRef]
- Privett, B.J.; Shin, J.H.; Schoenfisch, M.H. Electrochemical Sensors. Anal. Chem. 2010, 82, 4723. [Google Scholar] [CrossRef] [PubMed]
- Saputra, H.A. Electrochemical sensors: Basic principles, engineering, and state of the art. Monatsh. Chem. 2023, 154, 1083–1100. [Google Scholar] [CrossRef]
- Bakker, E.; Telting-Diaz, M. Electrochemical Sensors. Anal. Chem. 2002, 74, 2781. [Google Scholar] [CrossRef] [PubMed]
- Gorbova, E.; Tzorbatzoglou, F.; Molochas, C.; Chloros, D.; Demin, A.; Tsiakaras, P. Fundamentals and Principles of Solid-State Electrochemical Sensors for High Temperature Gas Detection. Catalysts 2022, 12, 1. [Google Scholar] [CrossRef]
- Zaidi, S.A.; Shin, J.H. Molecularly Imprinted Polymer Electrochemical Sensors Based on Synergistic Effect of Composites Synthesized from Graphene and Other Nanosystems. Int. J. Electrochem. Sci. 2014, 9, 4598–4616. [Google Scholar] [CrossRef]
- Lin, B.; Liu, Y.; Heng, L.; Wang, X.; Ni, J.; Lin, J.; Jiang, L. Morphology Effect of Ceria on the Catalytic Performances of Ru/CeO2 Catalysts for Ammonia Synthesis. Ind. Eng. Chem. Res. 2018, 57, 9127–9135. [Google Scholar] [CrossRef]
- Ly, T.N.; Park, S. Highly sensitive ammonia sensor for diagnostic purpose using reduced graphene oxide and conductive polymer. Sci. Rep. 2018, 8, 18030. [Google Scholar] [CrossRef]
- Huang, T.-Y.; Kung, C.-W.; Wei, H.-Y.; Boopathi, K.M.; Chu, C.-W.; Ho, K.-C. A high performance electrochemical sensor for acetaminophen based on a rGO–PEDOT nanotube composite modified electrode. J. Mater. Chem. A 2014, 2, 7229–7237. [Google Scholar] [CrossRef]
- Wang, C.; Zhang, L.; Guo, Z.; Xu, J.; Wang, H.; Zhai, K.; Zhuo, X. A novel hydrazine electrochemical sensor based on the high specific surface area graphene. Microchim. Acta 2010, 169, 1–6. [Google Scholar] [CrossRef]
- Li, Y.; Zhang, P.; Ouyang, Z.; Zhang, M.; Lin, Z.; Li, J.; Su, Z.; Wei, G. Nanoscale Graphene Doped with Highly Dispersed Silver Nanoparticles: Quick Synthesis, Facile Fabrication of 3D Membrane-Modified Electrode, and Super Performance for Electrochemical Sensing. Adv. Funct. Mater. 2016, 26, 2122–2134. [Google Scholar] [CrossRef]
- Yang, G.W. Laser ablation in liquids: Applications in the synthesis of nanocrystals. Mater. Sci. 2007, 52, 648. [Google Scholar]
- Shi, M.; Kitamoto, Y.; Hara, M.; Wada, H. Preparation of CeO2 nanoparticles by laser ablation in liquid method and its UV-absorption properties. Appl. Phys. A 2022, 128, 968. [Google Scholar] [CrossRef]
- Monsa, Y.; Gal, G.; Lerner, N.; Bar, I. A simple strategy for enhanced production of nanoparticles by laser ablation in liquids. Nanotechnology 2020, 31, 235601. [Google Scholar] [CrossRef]
- Tilaki, R.M.; Zad, A.I.; Mahdavi, S.M. The effect of liquid environment on size and aggregation of gold nanoparticles prepared by pulsed laser ablation. J. Nanopart. Res. 2007, 9, 853–860. [Google Scholar] [CrossRef]
- Elsayed, K.A.; Imam, H.; Ahmed, M.; Ramadan, R. Effect of focusing conditions and laser parameters on the fabrication of gold nanoparticles via laser ablation in liquid. Opt. Laser Technol. 2013, 45, 495–502. [Google Scholar] [CrossRef]
- Dittrich, S.; Spellauge, M.; Barcikowski, S.; Huber, H.P.; Gökce, B. Time resolved studies reveal the origin of the unparalleled high efficiency of one nanosecond laser ablation in liquids. Opto-Electron. Adv. 2022, 5, 210053. [Google Scholar] [CrossRef]
- Devaux, D.; Fabbro, R.; Tollier, L.; Bartnicki, E. Generation of shock waves by laser-induced plasma in confined geometry. J. Appl. Phys. 1993, 74, 2268–2273. [Google Scholar] [CrossRef]
- Berthe, L.; Fabbro, R.; Peyre, P.; Bartnicki, E. Wavelength dependent of laser shock-wave generation in the water-confinement regime. J. Appl. Phys. 1999, 85, 7552–7555. [Google Scholar] [CrossRef]
- Waag, F.; Gökce, B.; Barcikowski, S. Ablation target cooling by maximizing the nanoparticle productivity in laser synthesis of colloids. Appl. Surf. Sci. 2019, 466, 647–656. [Google Scholar] [CrossRef]
- Taccogna, F. Nucleation and growth of nanoparticles in a plasma by laser ablation in liquid. J. Plasma Phys. 2015, 81, 495810509. [Google Scholar] [CrossRef]
- Luo, F.; Guan, Y.; Ong, W.; Du, Z.; Ho, G.; Li, F.; Sun, S.; Lim, G.; Hong, M. Enhancement of pulsed laser ablation in environmentally friendly liquid. Opt. Express 2014, 22, 23875–23882. [Google Scholar] [CrossRef]
- Nayral, C.; Viala, E.; Fau, P.; Senocq, F.; Jumas, J.-C.; Maisonnat, A.; Chaudret, B. Synthesis of Tin and Tin Oxide Nanoparticles of Low Size Dispersity for Application in Gas Sensing. Chem. A Eur. J. 2000, 6, 4082–4090. [Google Scholar] [CrossRef]
- Sajti, C.L.; Sattari, R.; Chichkov, B.N.; Barcikowski, S. Gram Scale Synthesis of Pure Ceramic Nanoparticles by Laser Ablation in Liquid. J. Phys. Chem. C 2010, 114, 2421–2427. [Google Scholar] [CrossRef]
- Shi, M.; Kitamoto, Y.; Wada, H. Synthesis of CeO2/rGO Nanocomposites by Laser Ablation in Liquid Method and the Characterization for Advanced Materials Development. J. Laser Micro Nanoeng. 2023, 18, 170–176. [Google Scholar]
- Soliman, W.; El-Ansary, S.; Badr, Y. Impact of Liquid Medium on Laser Ablation Mechanism: Surface Heating and Cooling. Lasers Manuf. Mater. Process. 2018, 5, 430–438. [Google Scholar] [CrossRef]
- Tabayashi, Y.; Sakaki, S.; Koshizaki, N.; Yamauchi, Y.; Ishikawa, Y. Behavior of Thermally Induced Nanobubbles during Instantaneous Particle Heating by Pulsed Laser Melting in Liquid. Langmuir 2021, 37, 7167–7175. [Google Scholar] [CrossRef]
- Zolotko, A.N.; Poletaev, N.I.; Vovchuk, J.I.; Florko, A.V. Nanoparticles formation by combustion techniques. In Gas Phase Nanoparticle Synthesis, Chapter 5; Granqvist, C.G., Kish, L.B., Marlow, W.H., Eds.; Kluwer Academic: Dordrecht, The Netherlands, 2004; pp. 123–156. [Google Scholar]
- Koehler, J.M.; Visaveliya, N.; Knauer, A. Controlling formation and assembling of nanoparticles by control of electrical charging, polarization, and electrochemical potential. Nanotechnol. Rev. 2014, 3, 553–568. [Google Scholar] [CrossRef]
- Bourrous, S.; Ribeyre, Q.; Lintis, L.; Yon, J.; Bau, S.; Thomas, D.; Vallières, C.; Ouf, F.-X. A semi-automatic analysis tool for the determination of primary particle size, overlap coefficient and specific surface area of nanoparticles aggregates. J. Aerosol Sci. 2018, 126, 122–132. [Google Scholar] [CrossRef]
- Kocsis, L.; Herman, P.; Eke, A. The modified Beer–Lambert law revisited. Phys. Med. Biol. 2006, 51, N91. [Google Scholar] [CrossRef] [PubMed]


Disclaimer/Publisher’s Note: The statements, opinions and data contained in all publications are solely those of the individual author(s) and contributor(s) and not of MDPI and/or the editor(s). MDPI and/or the editor(s) disclaim responsibility for any injury to people or property resulting from any ideas, methods, instructions or products referred to in the content. |
© 2024 by the authors. Licensee MDPI, Basel, Switzerland. This article is an open access article distributed under the terms and conditions of the Creative Commons Attribution (CC BY) license (https://creativecommons.org/licenses/by/4.0/).