A Comprehensive Optimization Course of Antimony Tin Oxide Nanofiller Loading in Polyamide 12: Printability, Quality Assessment, and Engineering Response in Additive Manufacturing


 , , , , , ,
  and
and
Abstract
:1. Introduction
- The effect of ATO as a filler on the behavior of the PA12 matrix material was investigated.
- The creation of PA12/ATO composites suitable for utilization in the MEX 3D printing (3D-P) process with the aim of producing objects with reinforced mechanical characteristics.
- Analyzing the influence of ATO on critical aspects of the fabricated parts, such as thermal stability, morphology, and quality metrics, such as the spatial consistency and the pore size and characteristics of the 3D printing specimens.
2. Materials and Methods
2.1. Materials
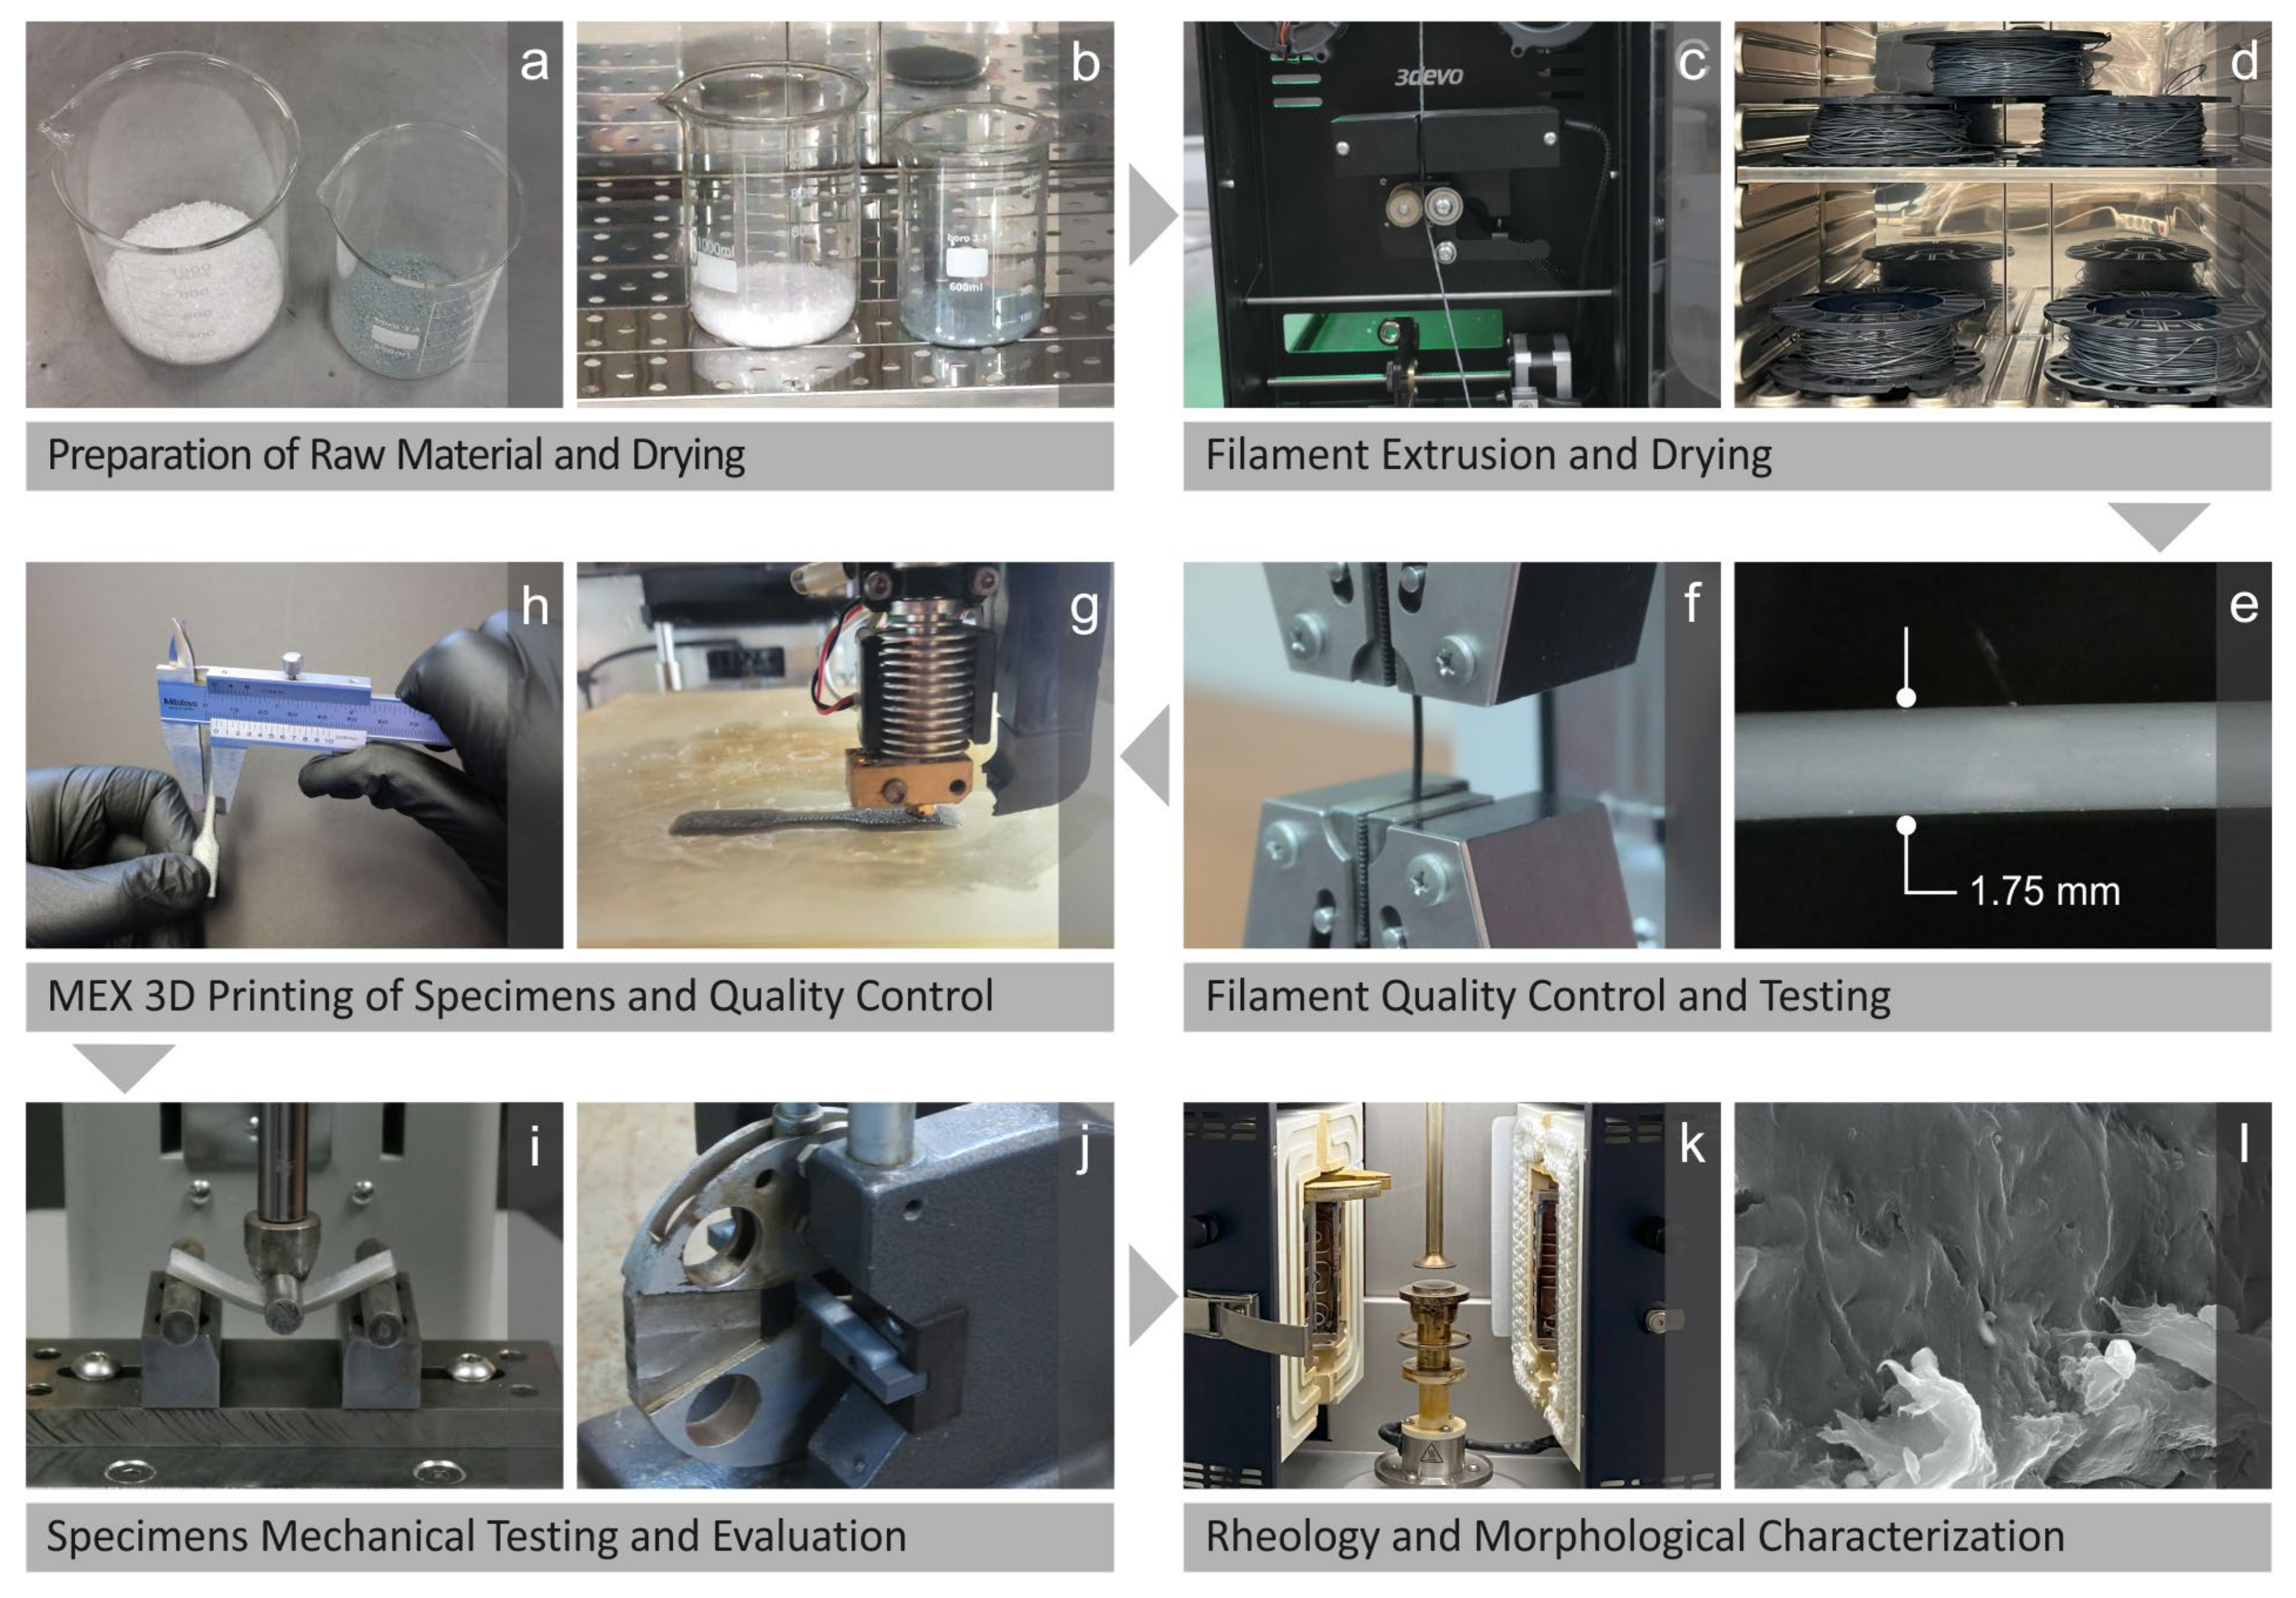
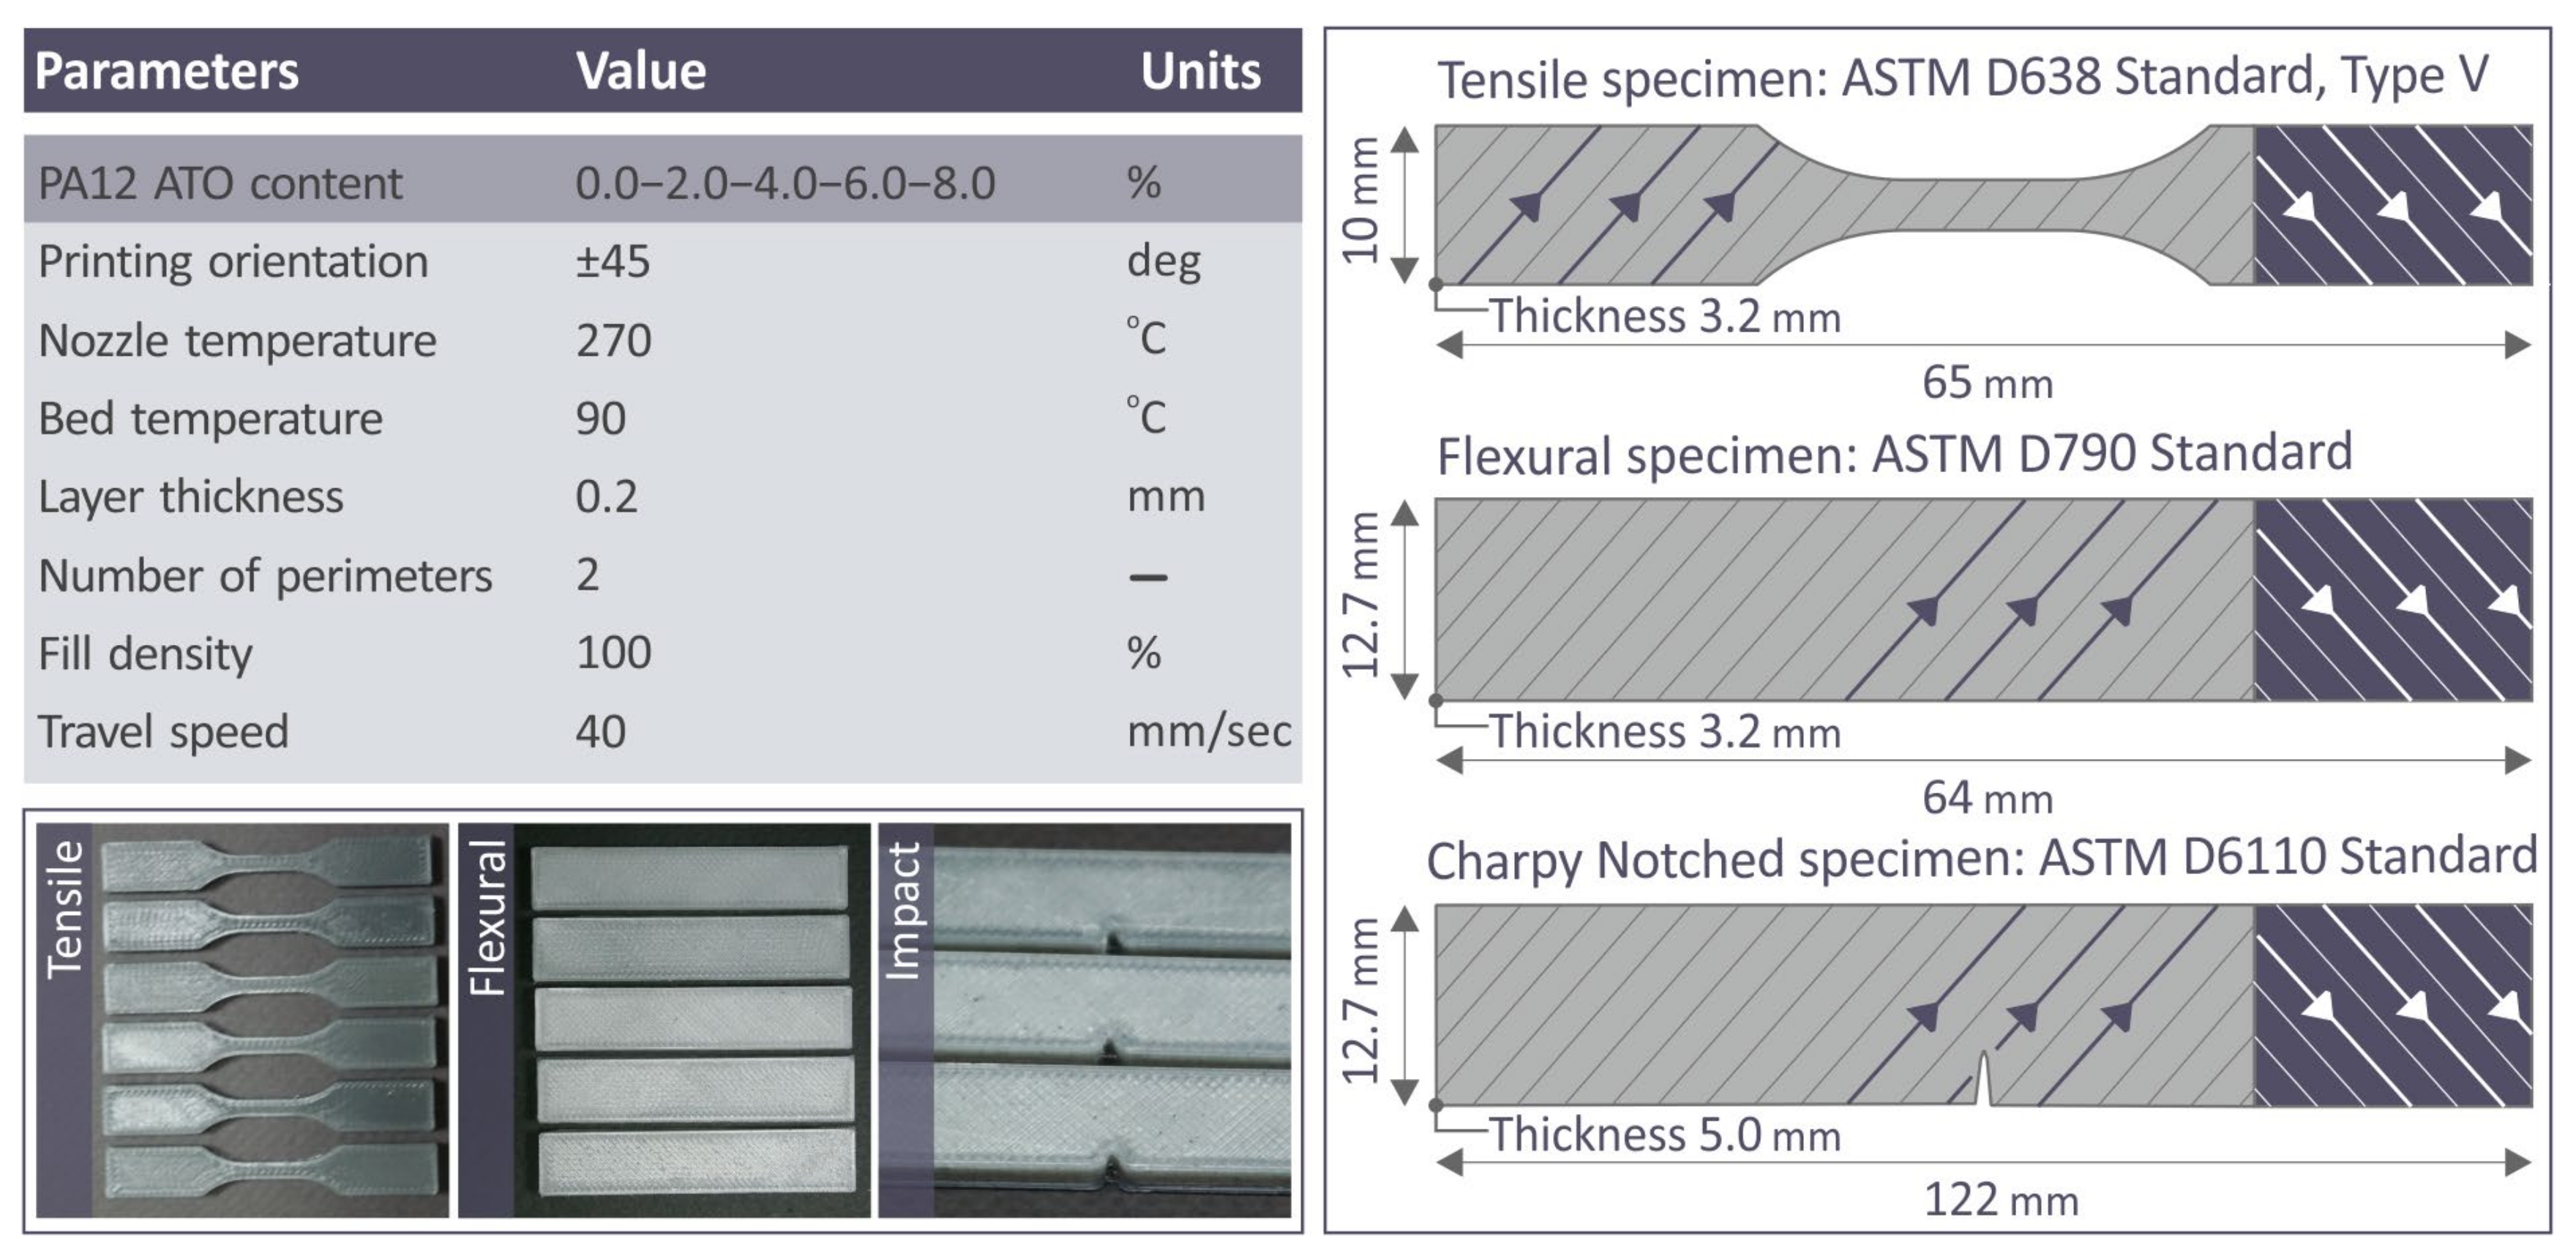
2.2. Mixture Preparation, Filament Extrusion, and Specimen 3D-P
2.3. Morphological and Chemical Investigation of the ATO Material along with the PA12/ATO Composites
2.4. Micro-Computed Tomography (μ-CT)
2.5. Mechanical Properties Testing
2.6. Raman Measurements
2.7. Rheometric Investigation
2.8. Thermal Behavior
3. Results
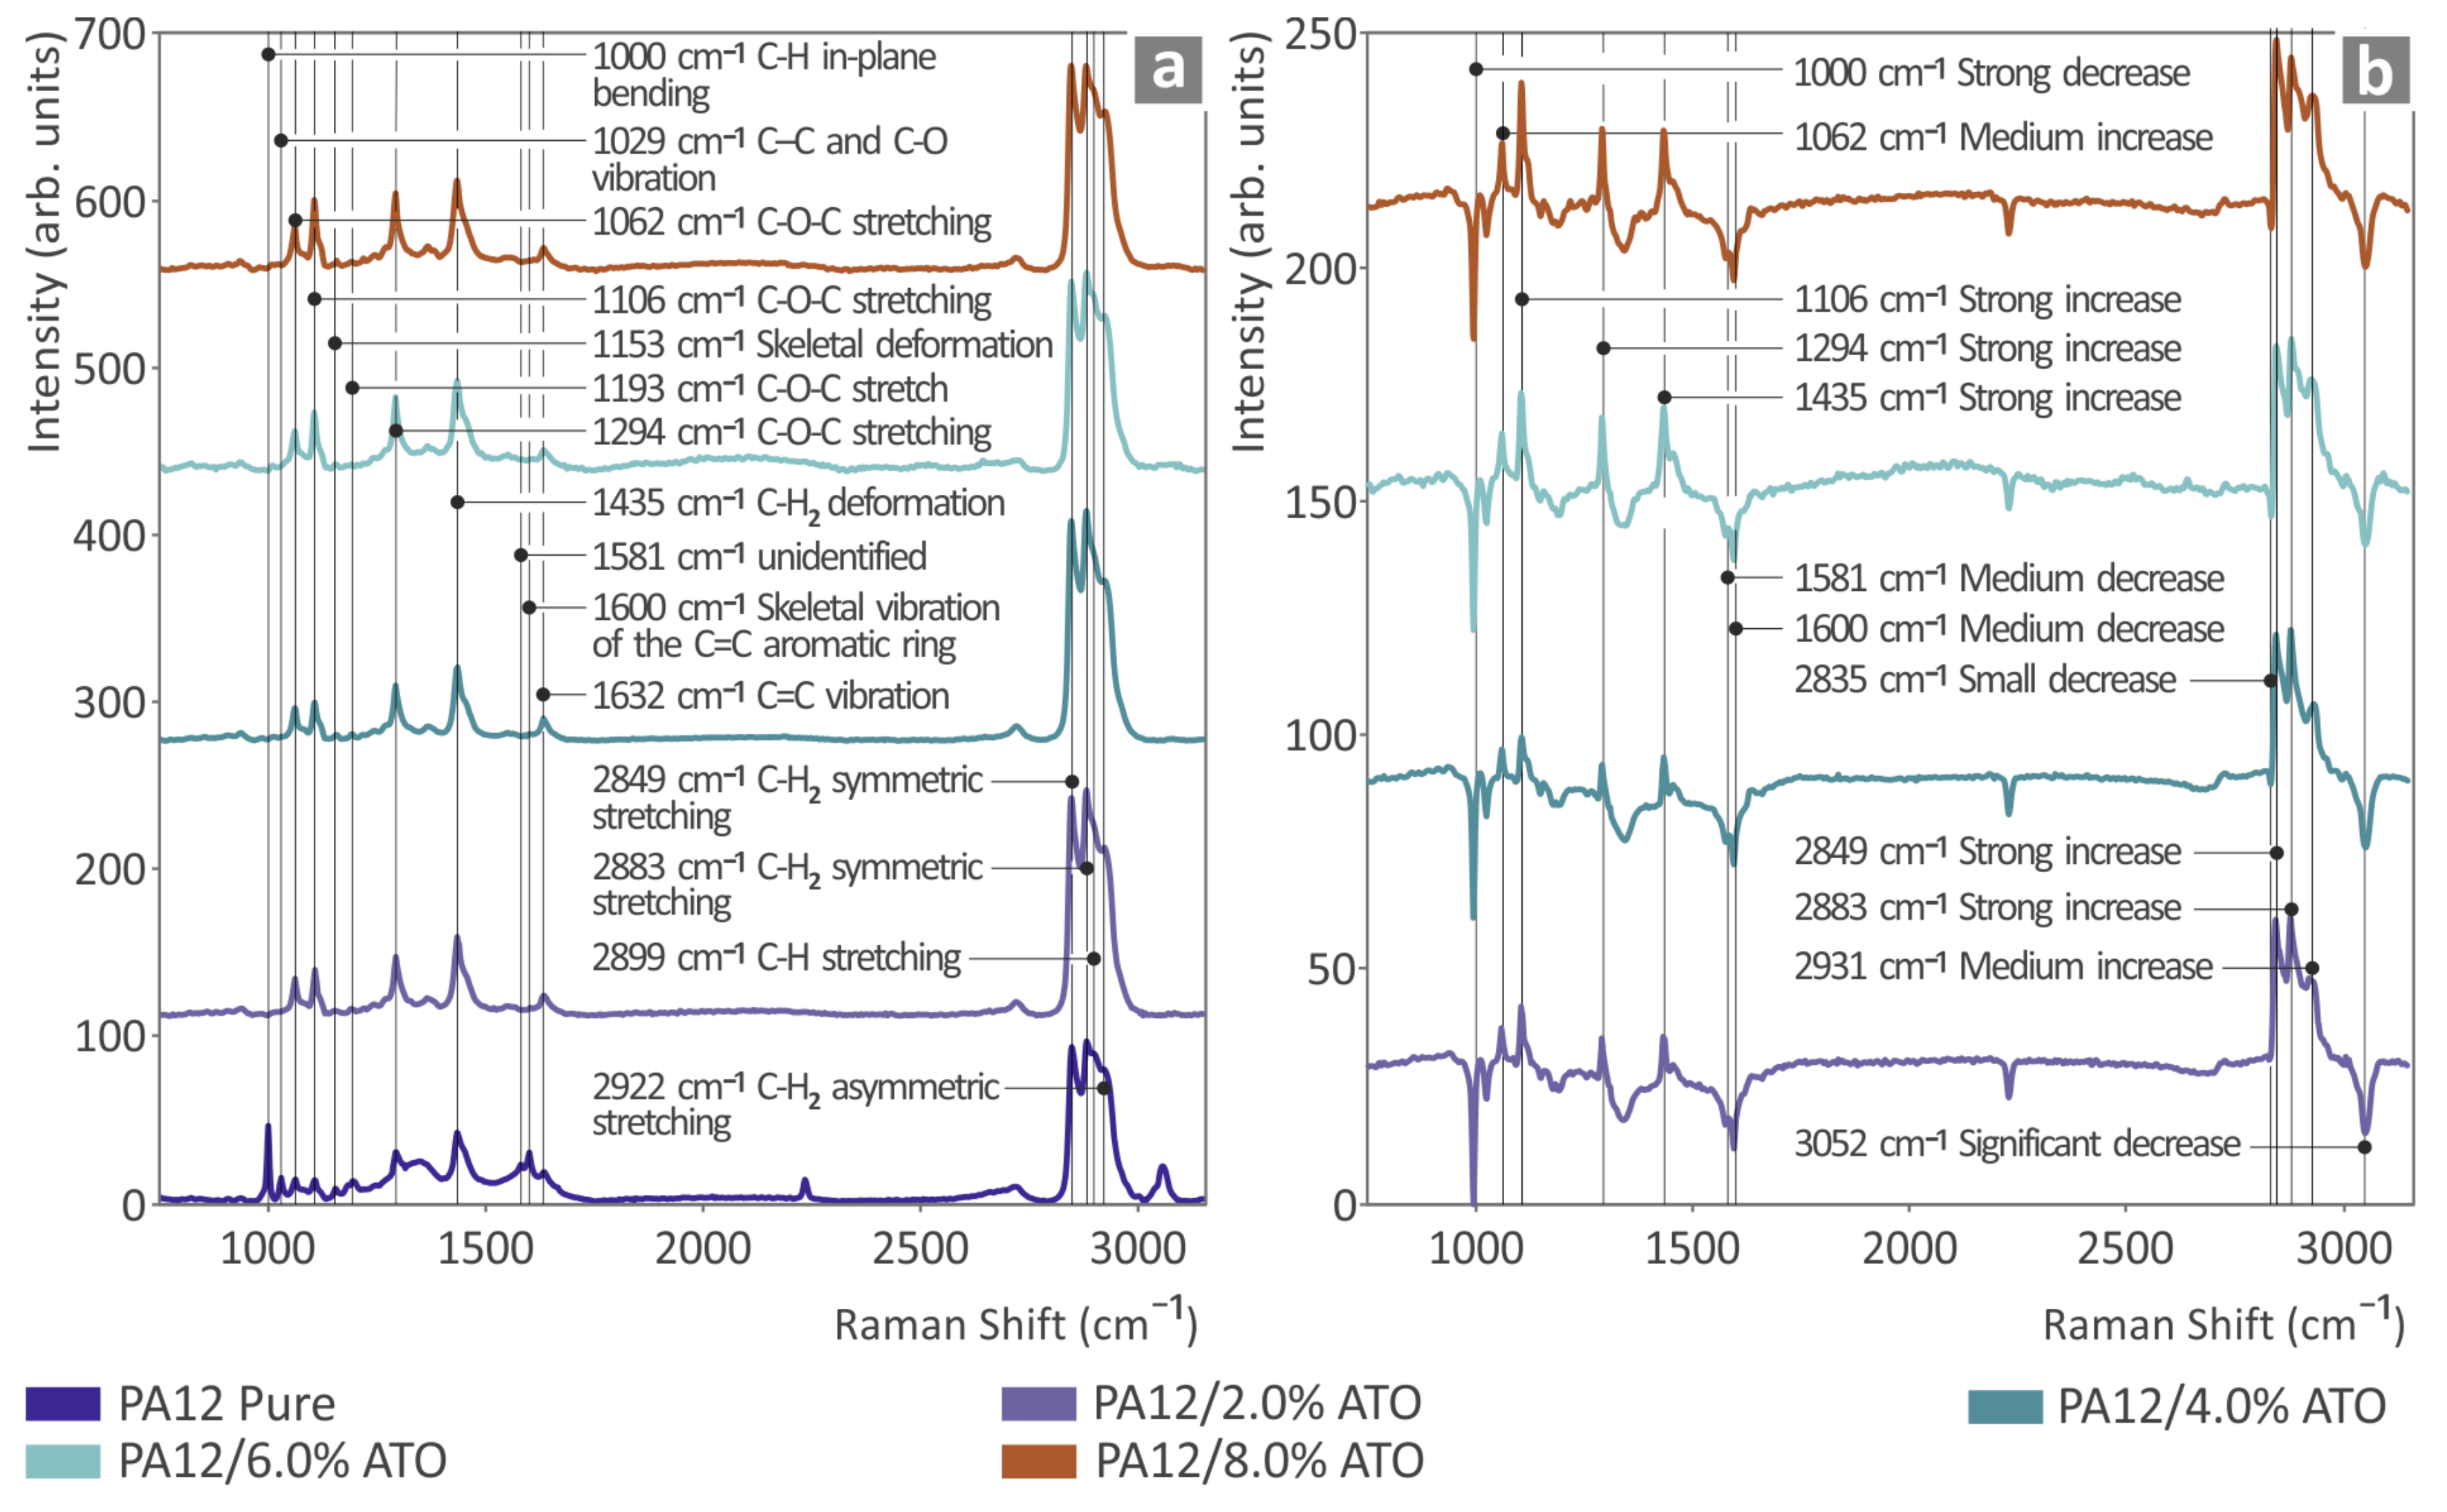
3.1. Raman Spectra
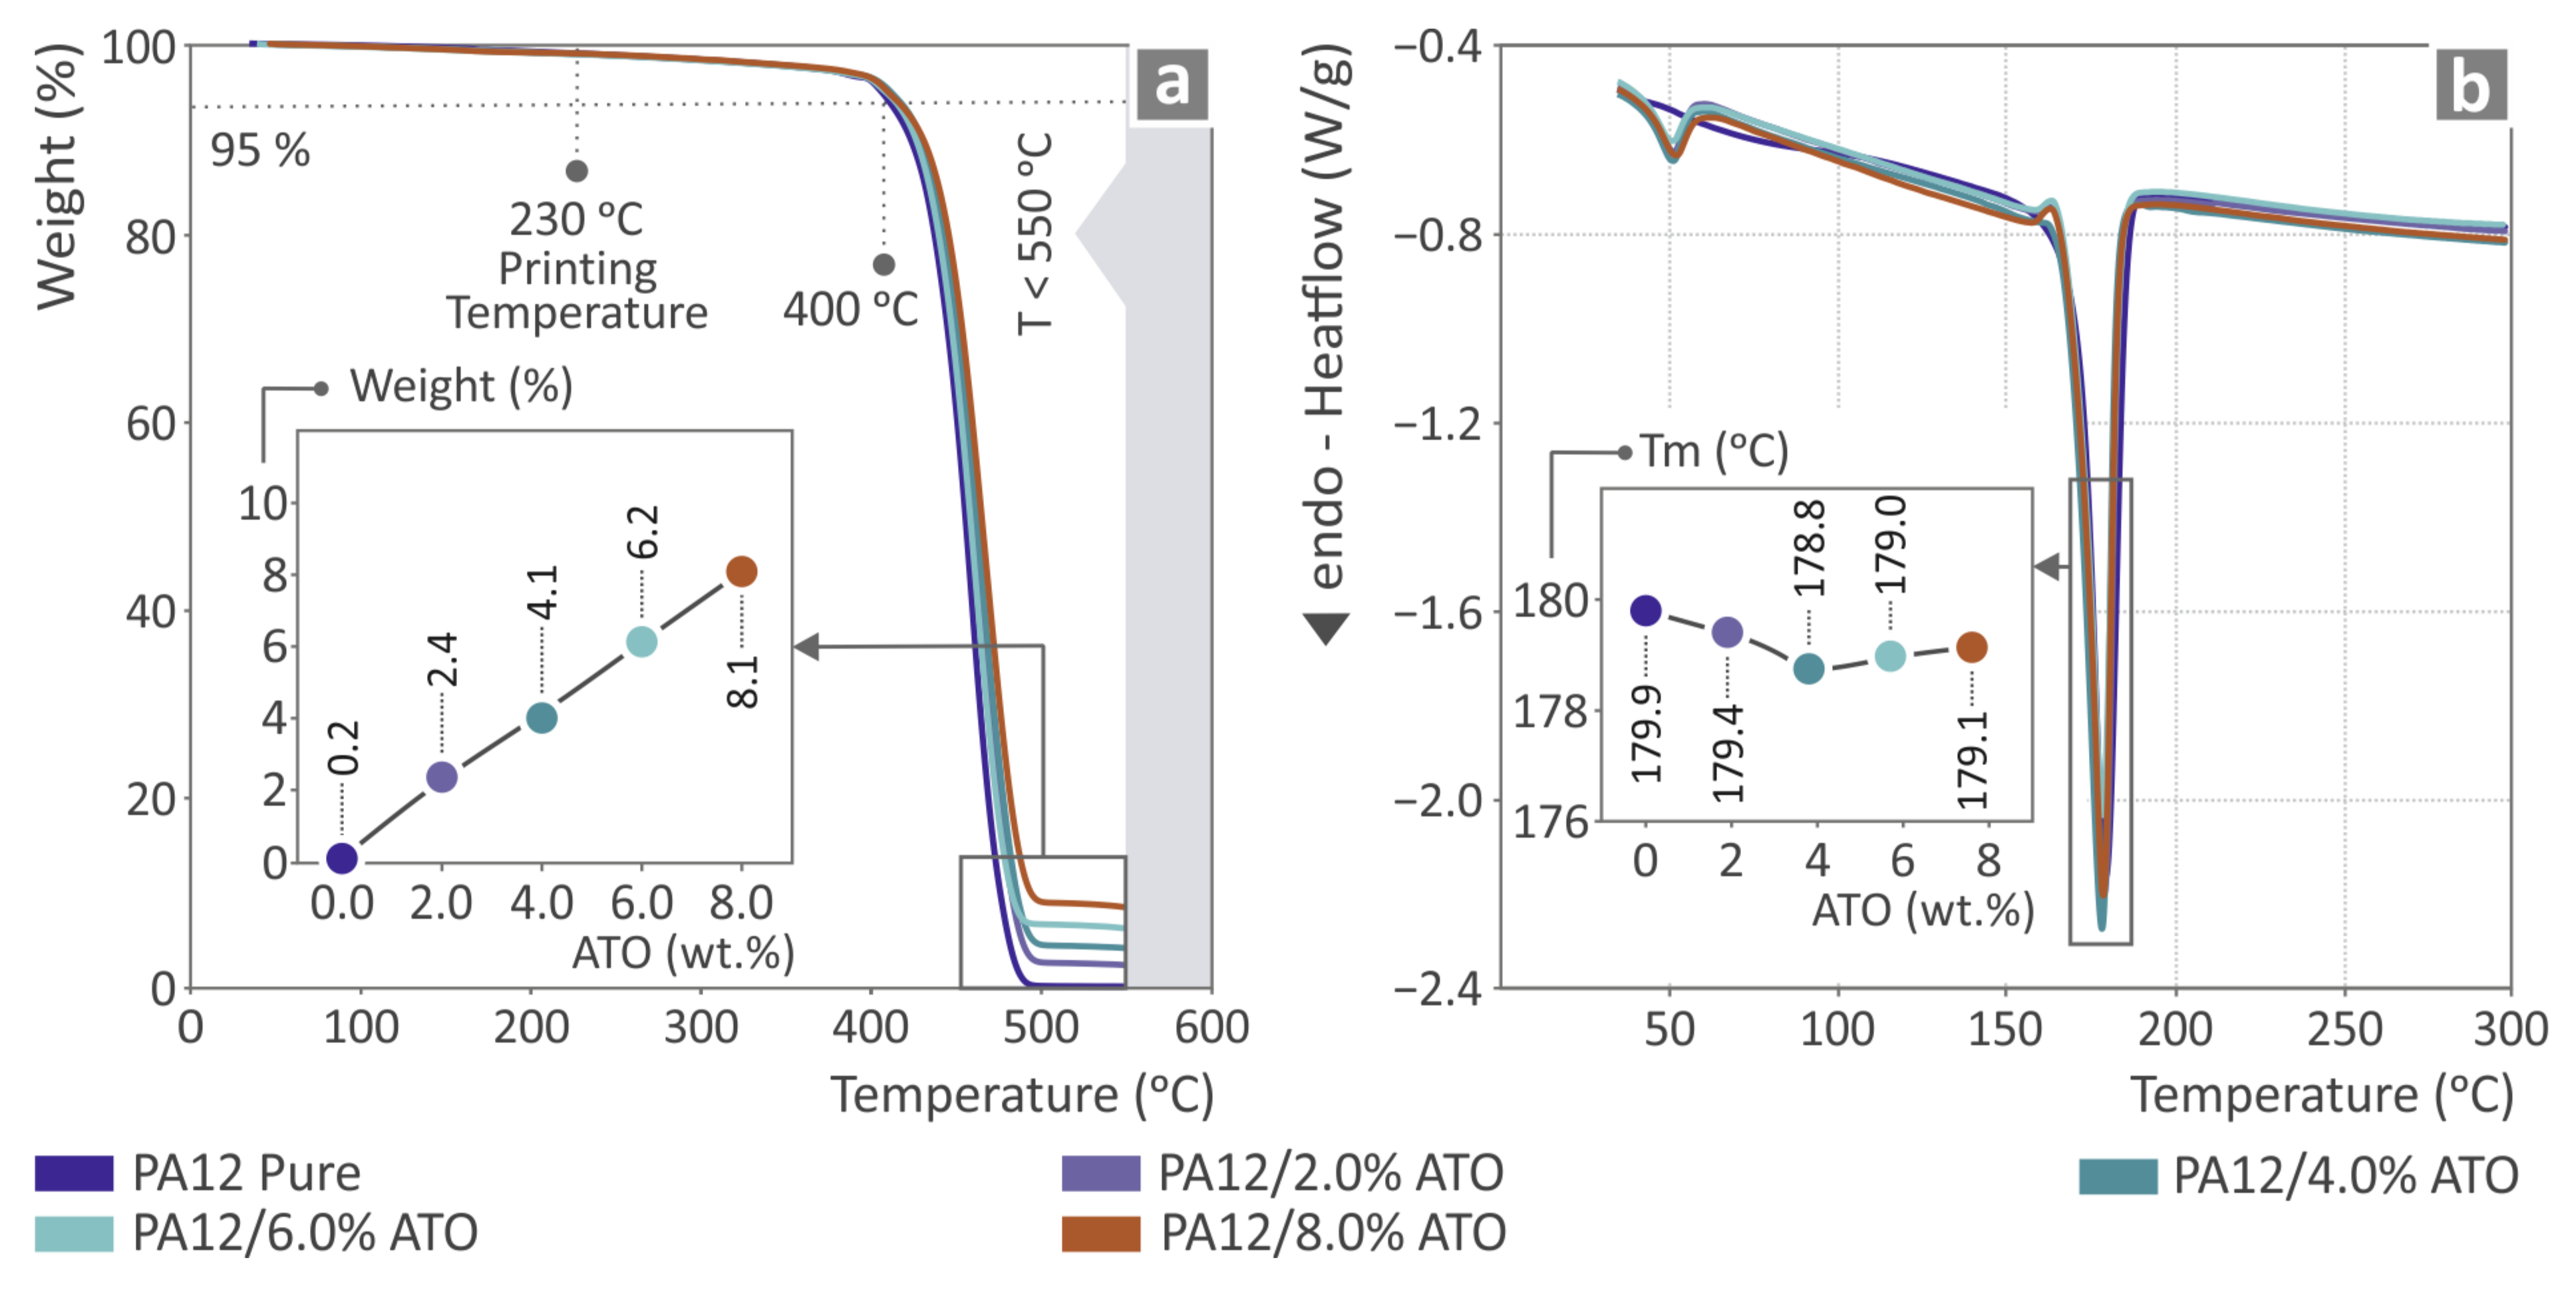
3.2. Thermal Investigation Results
3.3. Rheometric Results
3.4. Quality Assurance of the Prepared Filaments
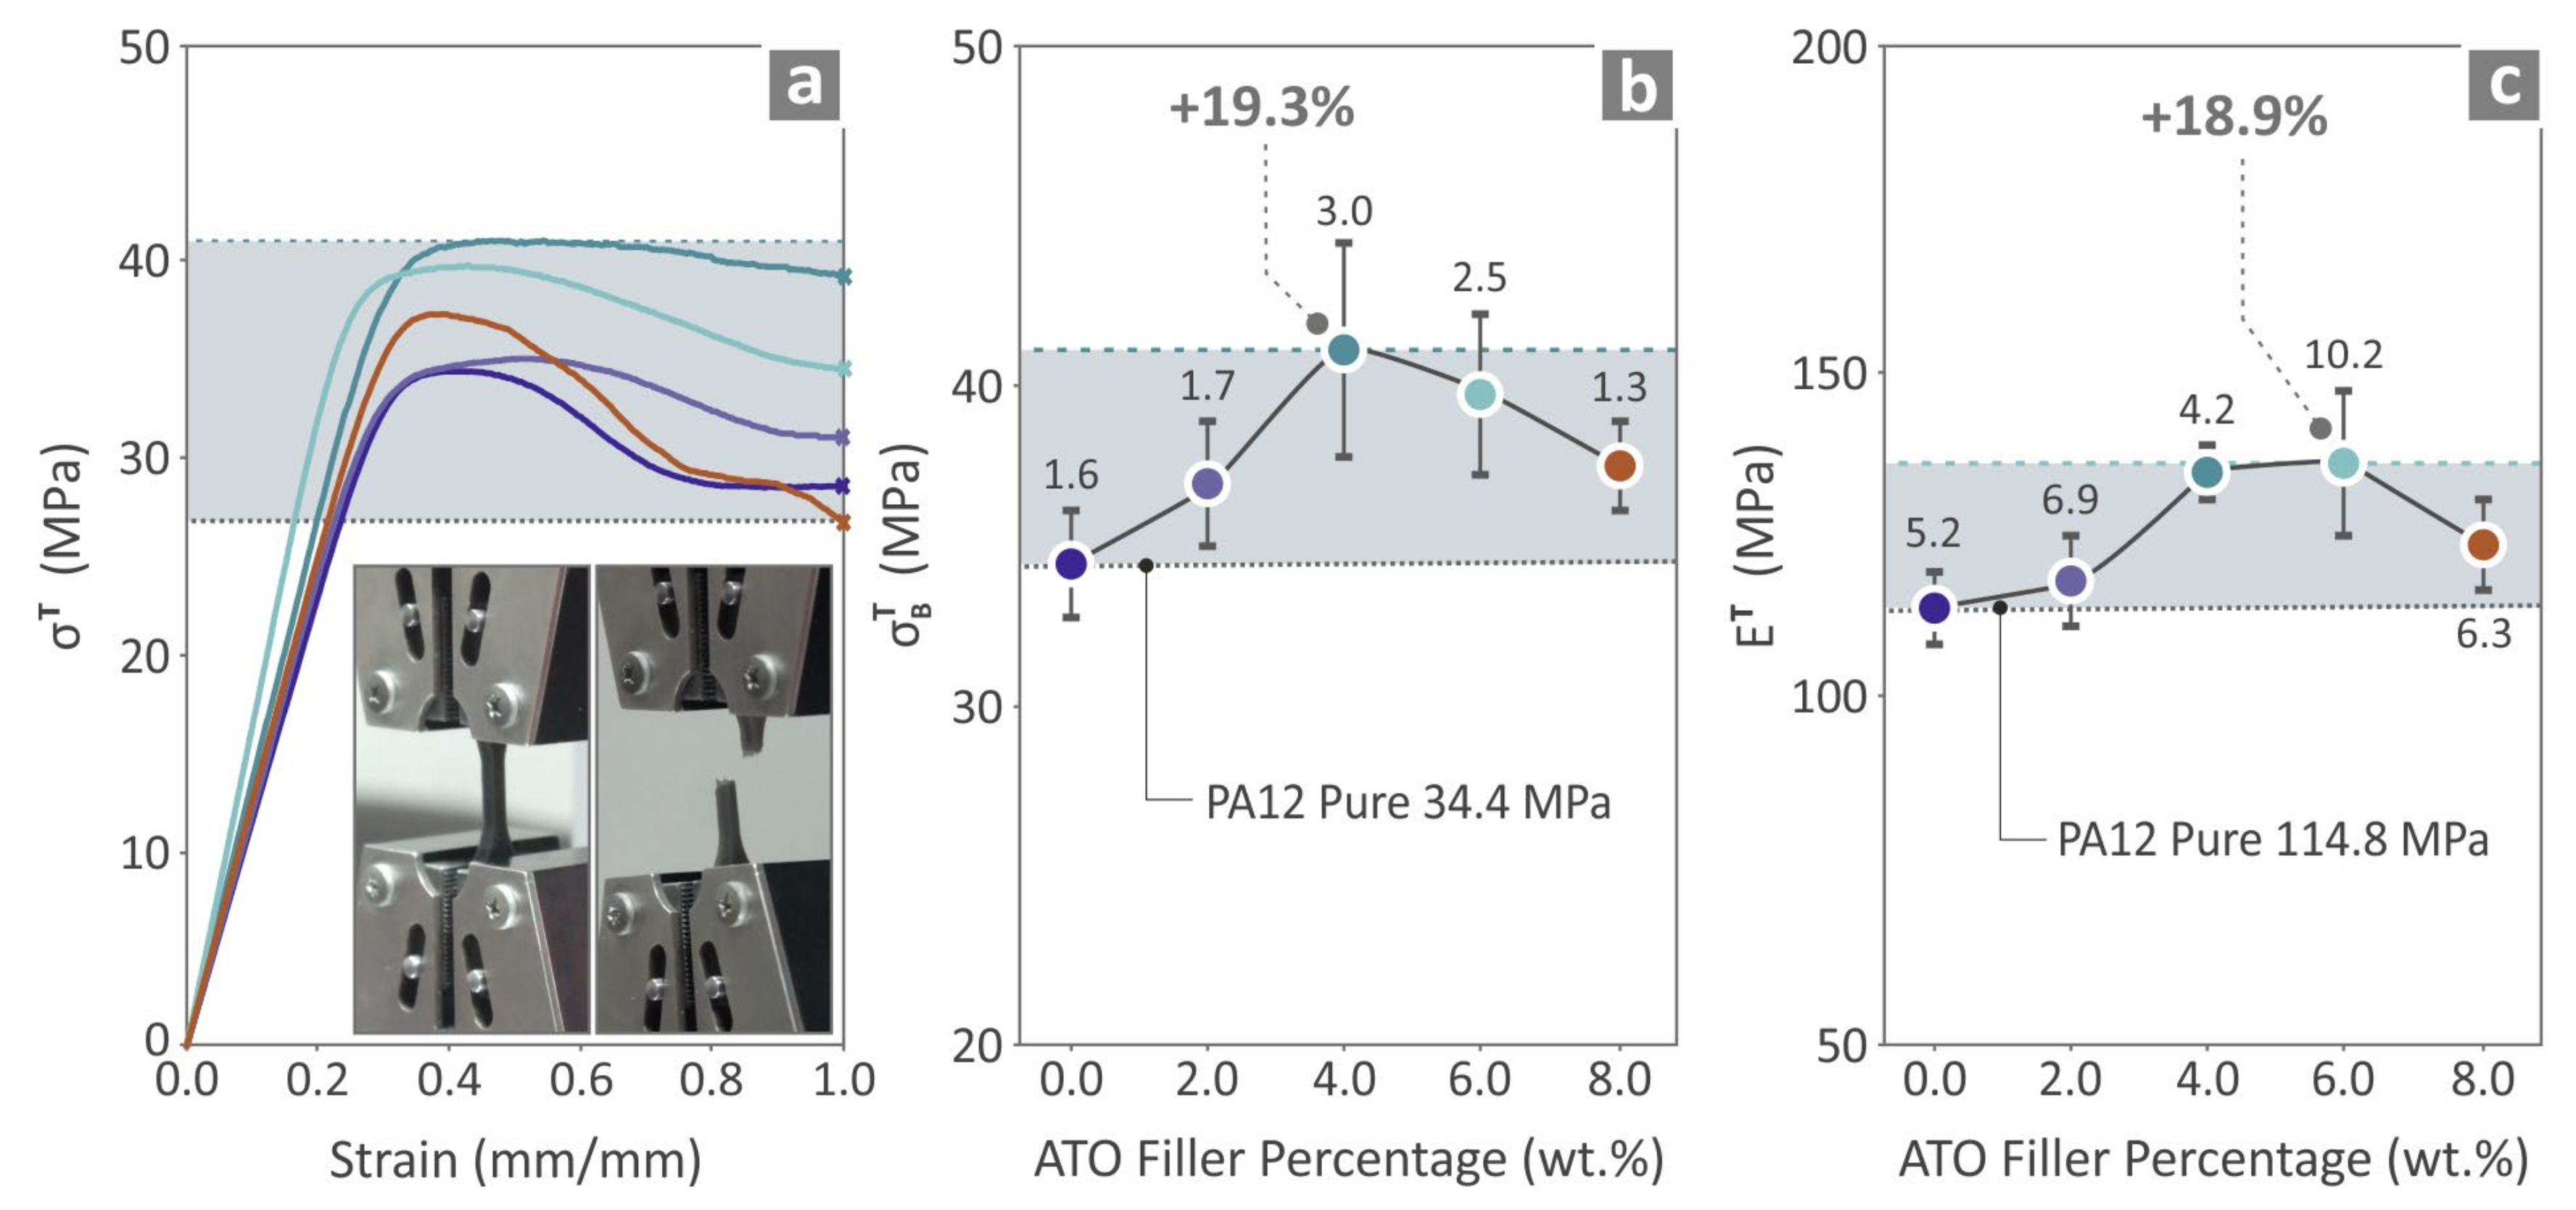
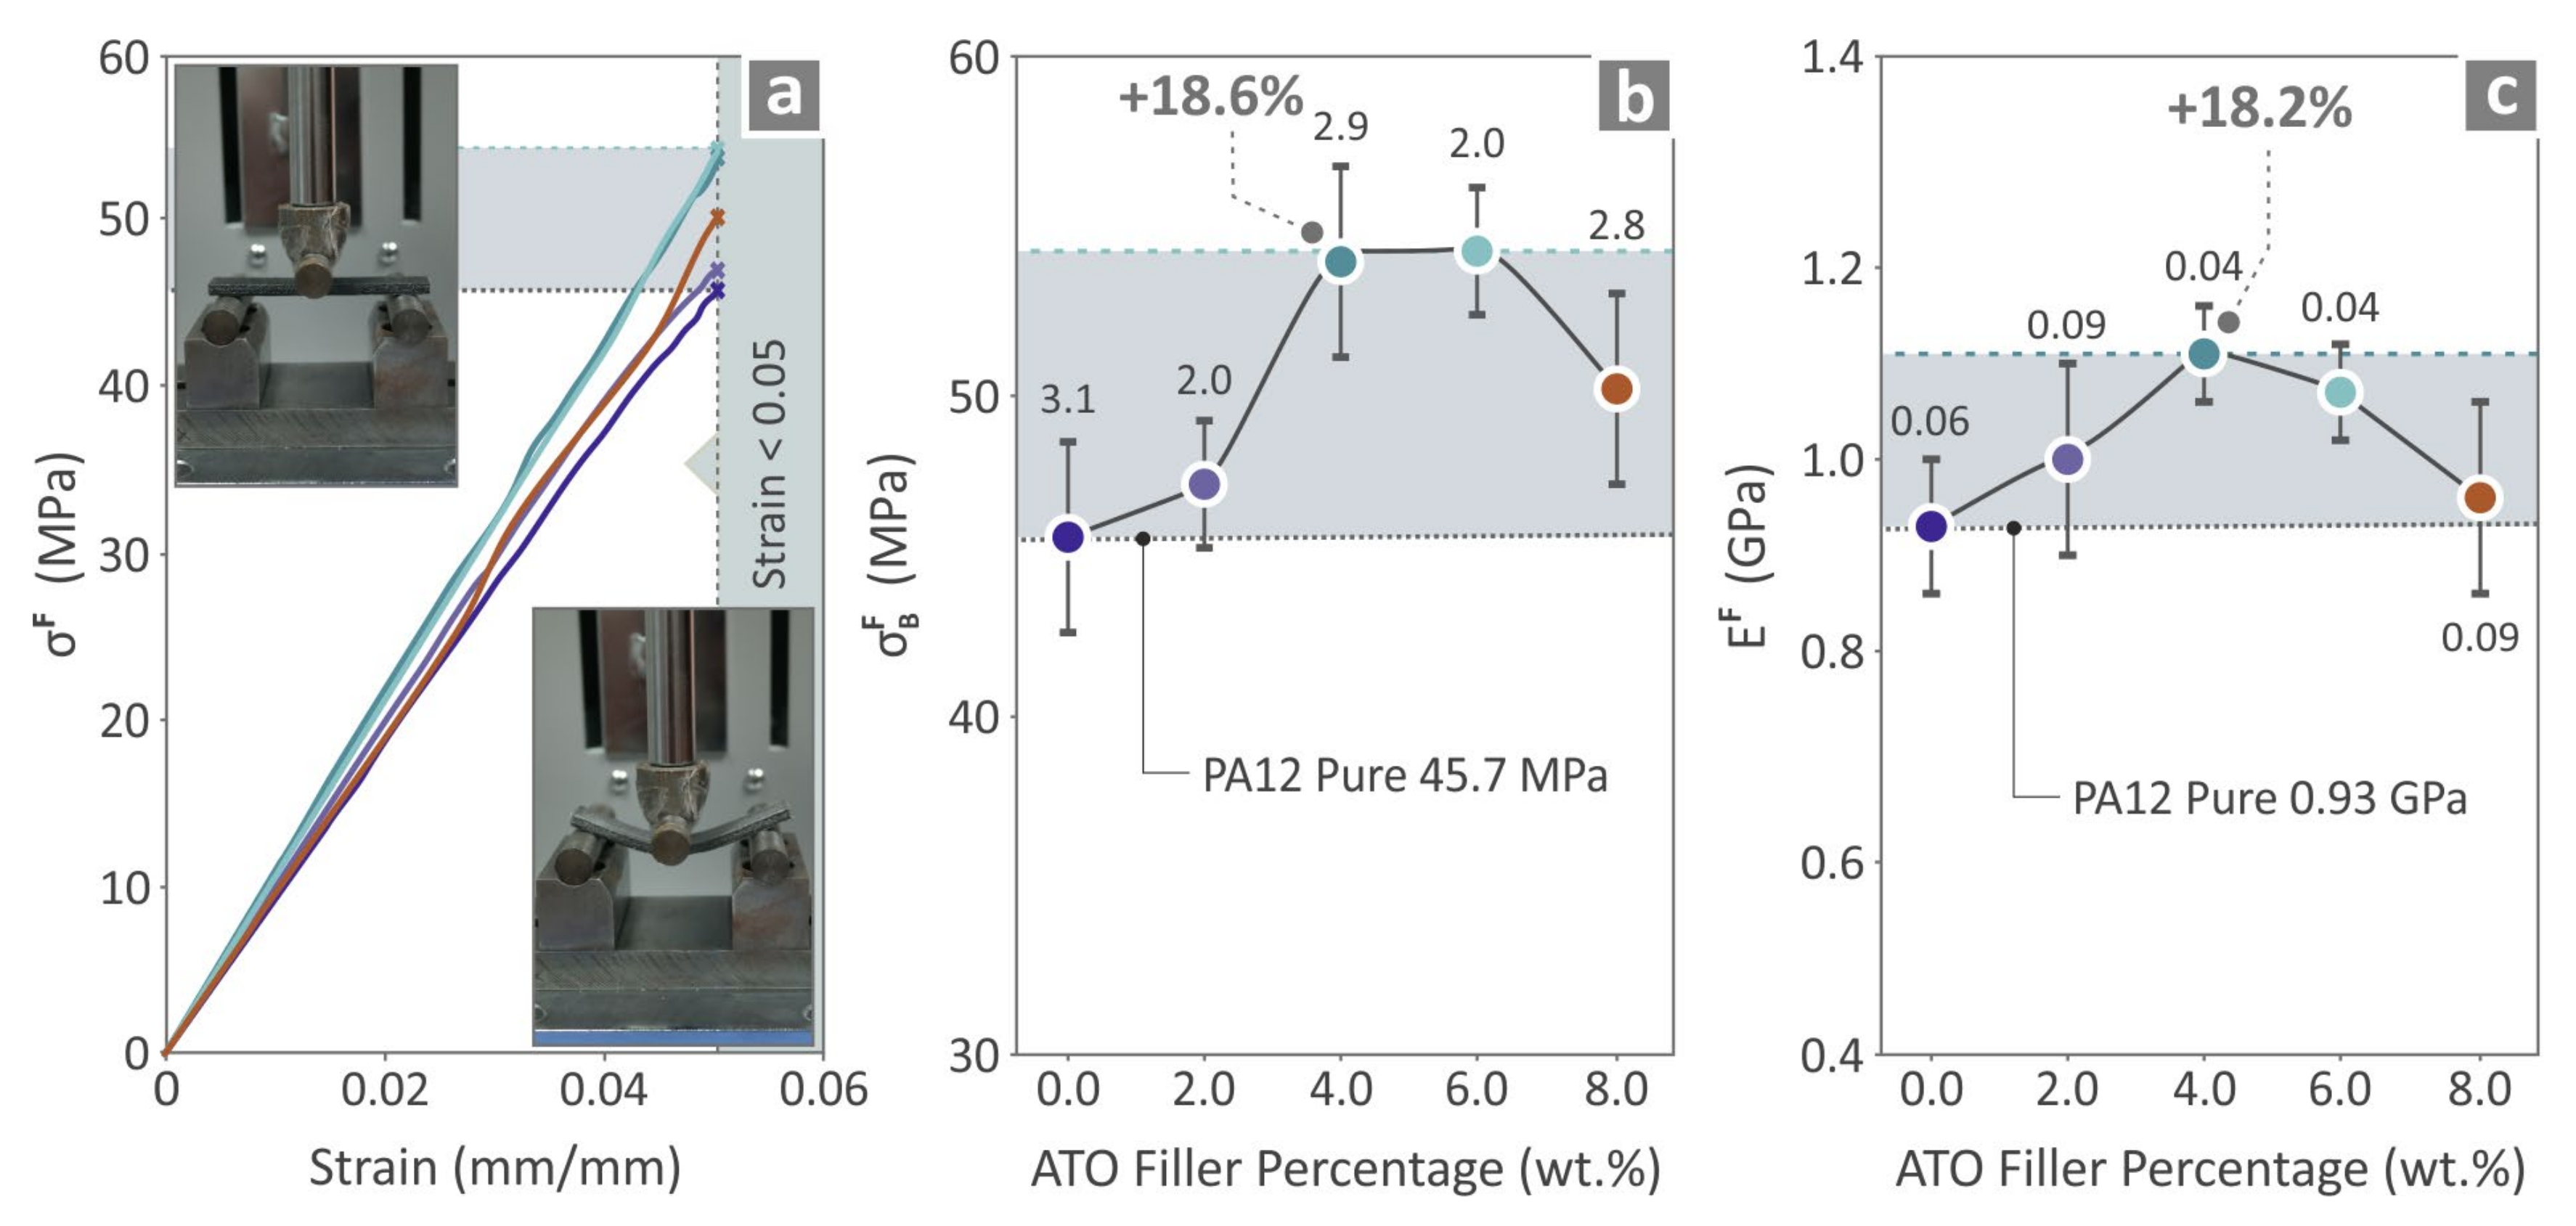
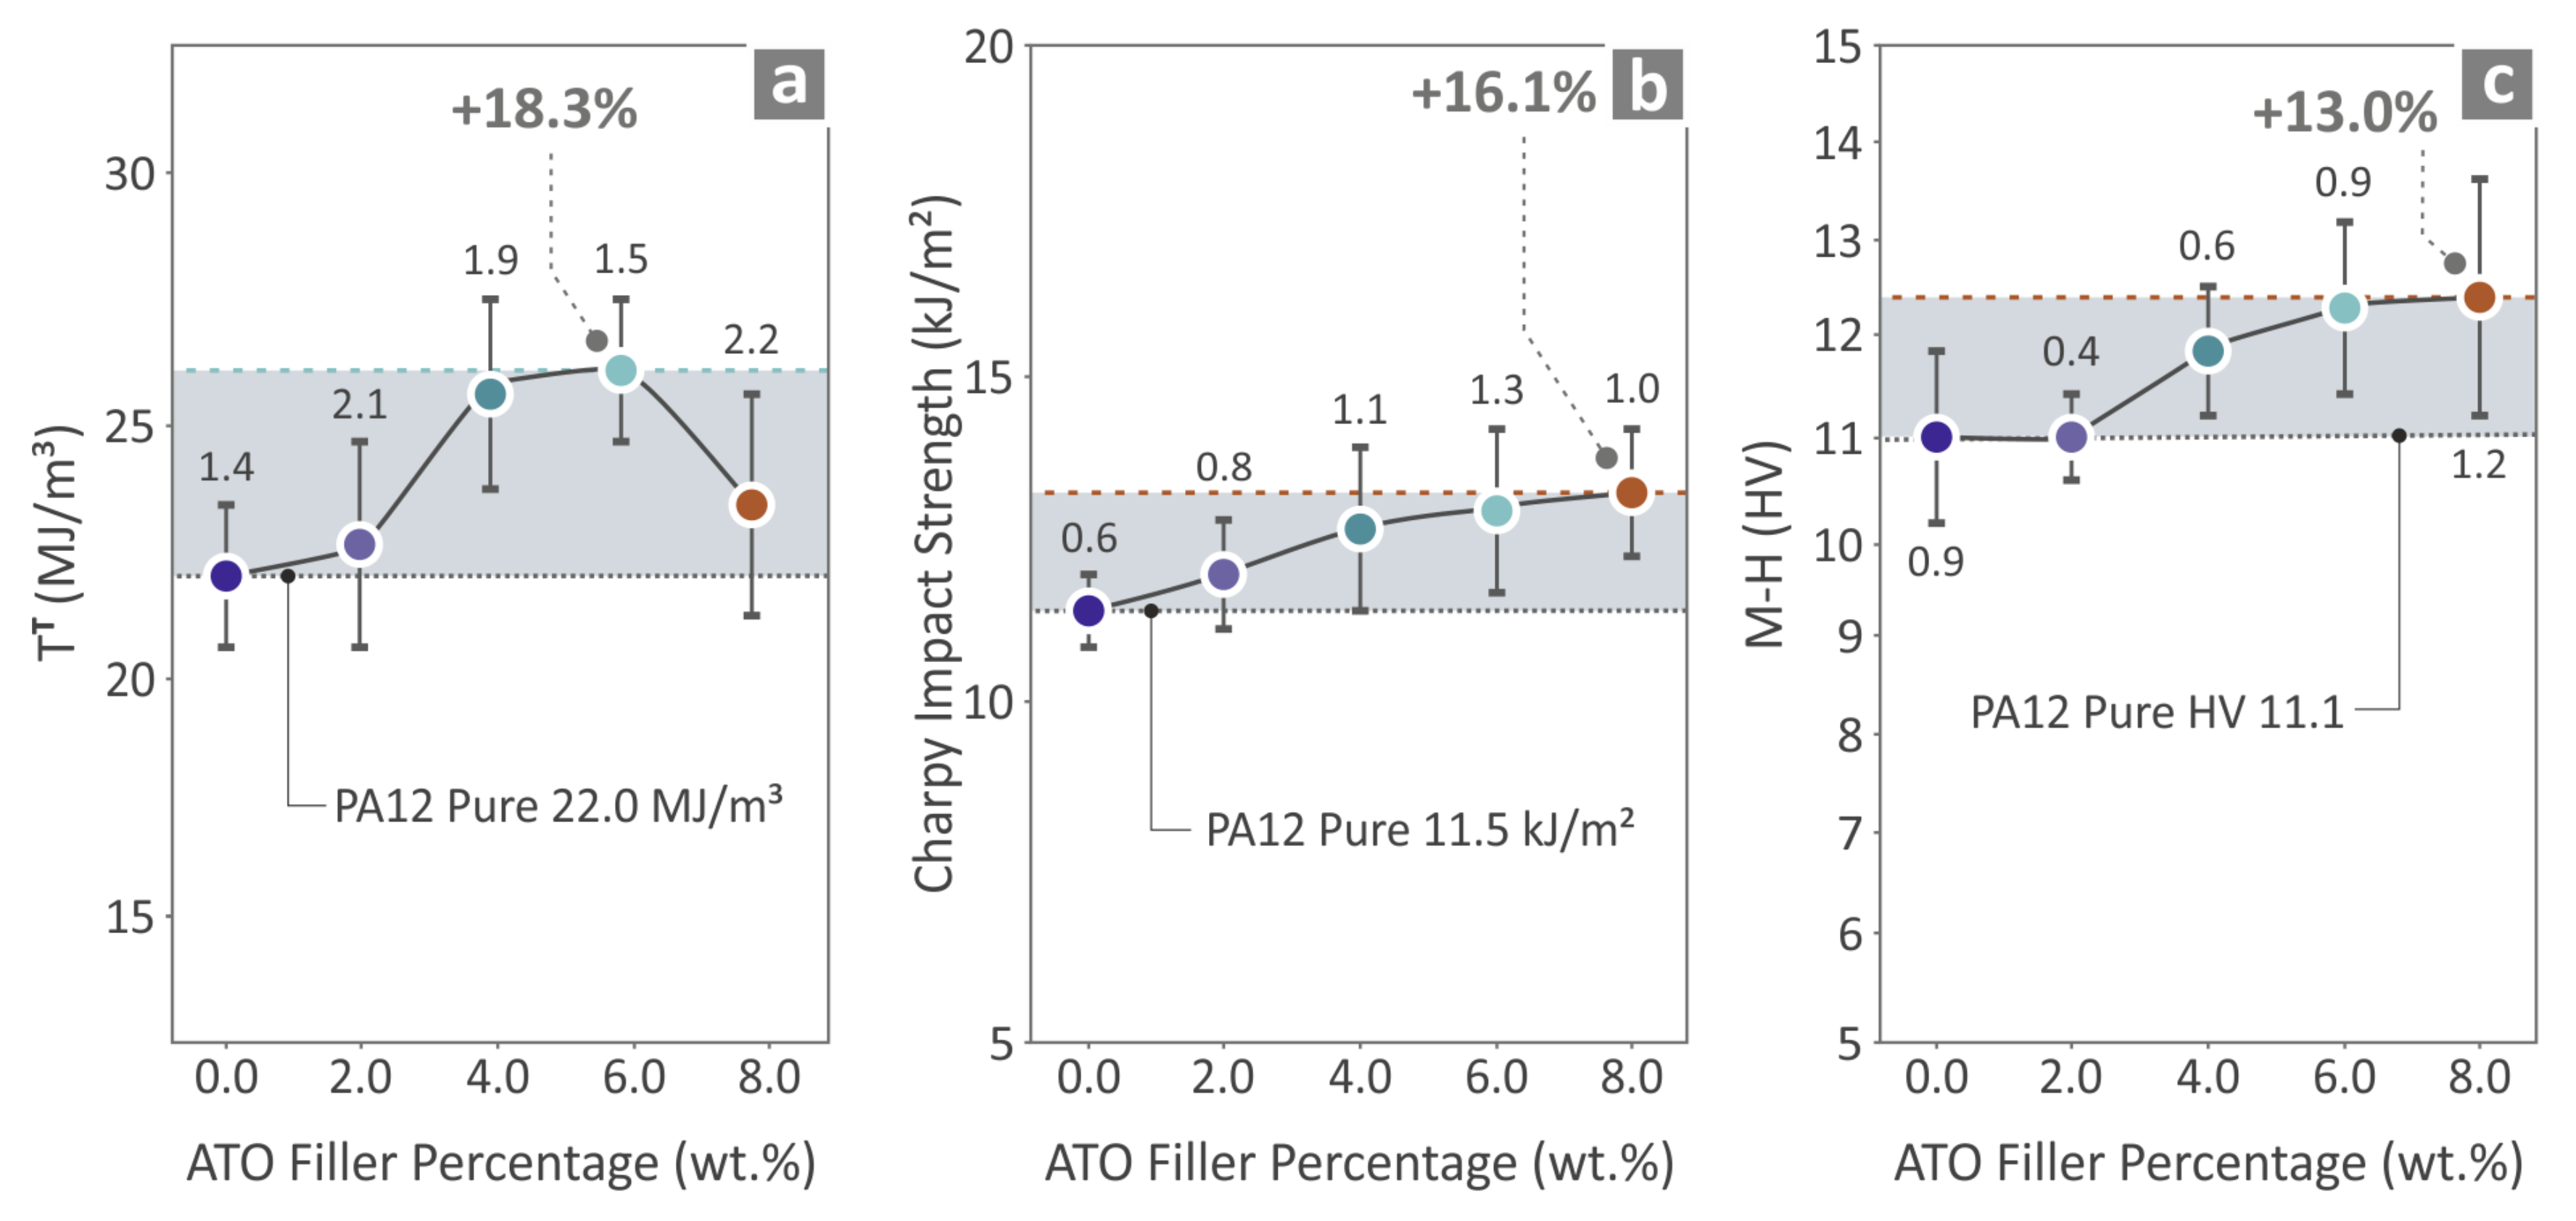
3.5. Mechanical Properties of the Produced Specimens
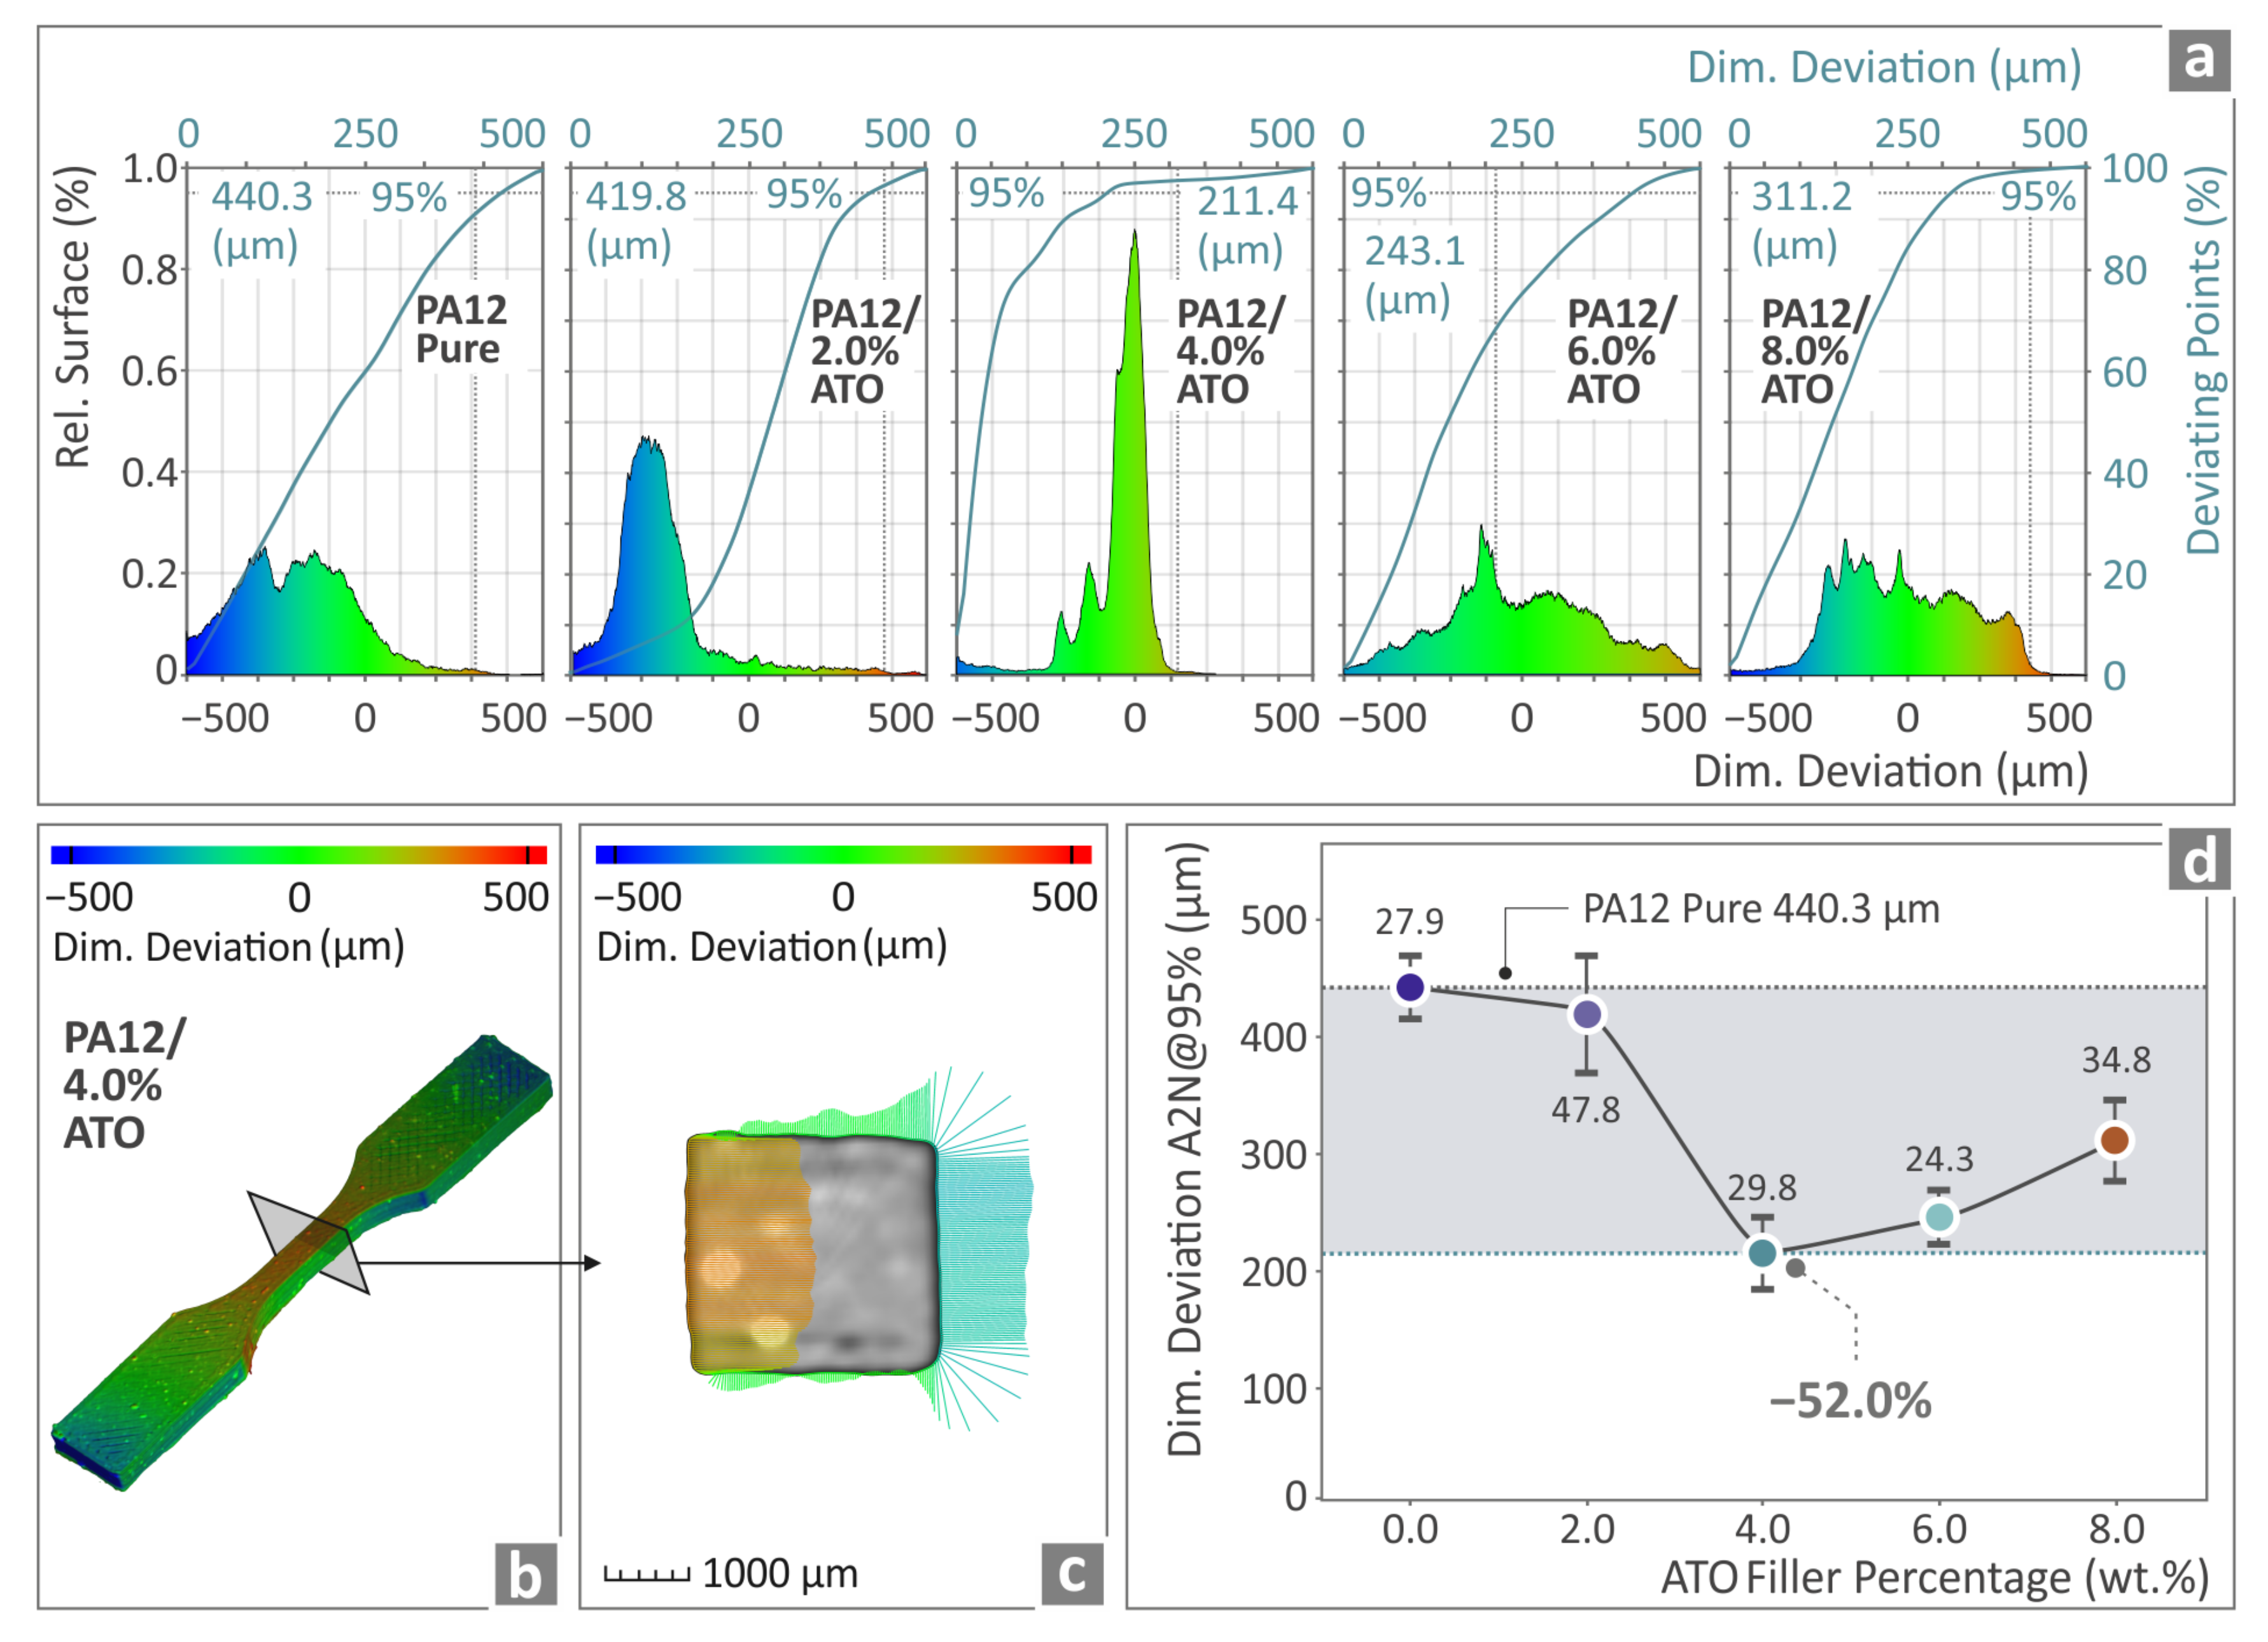
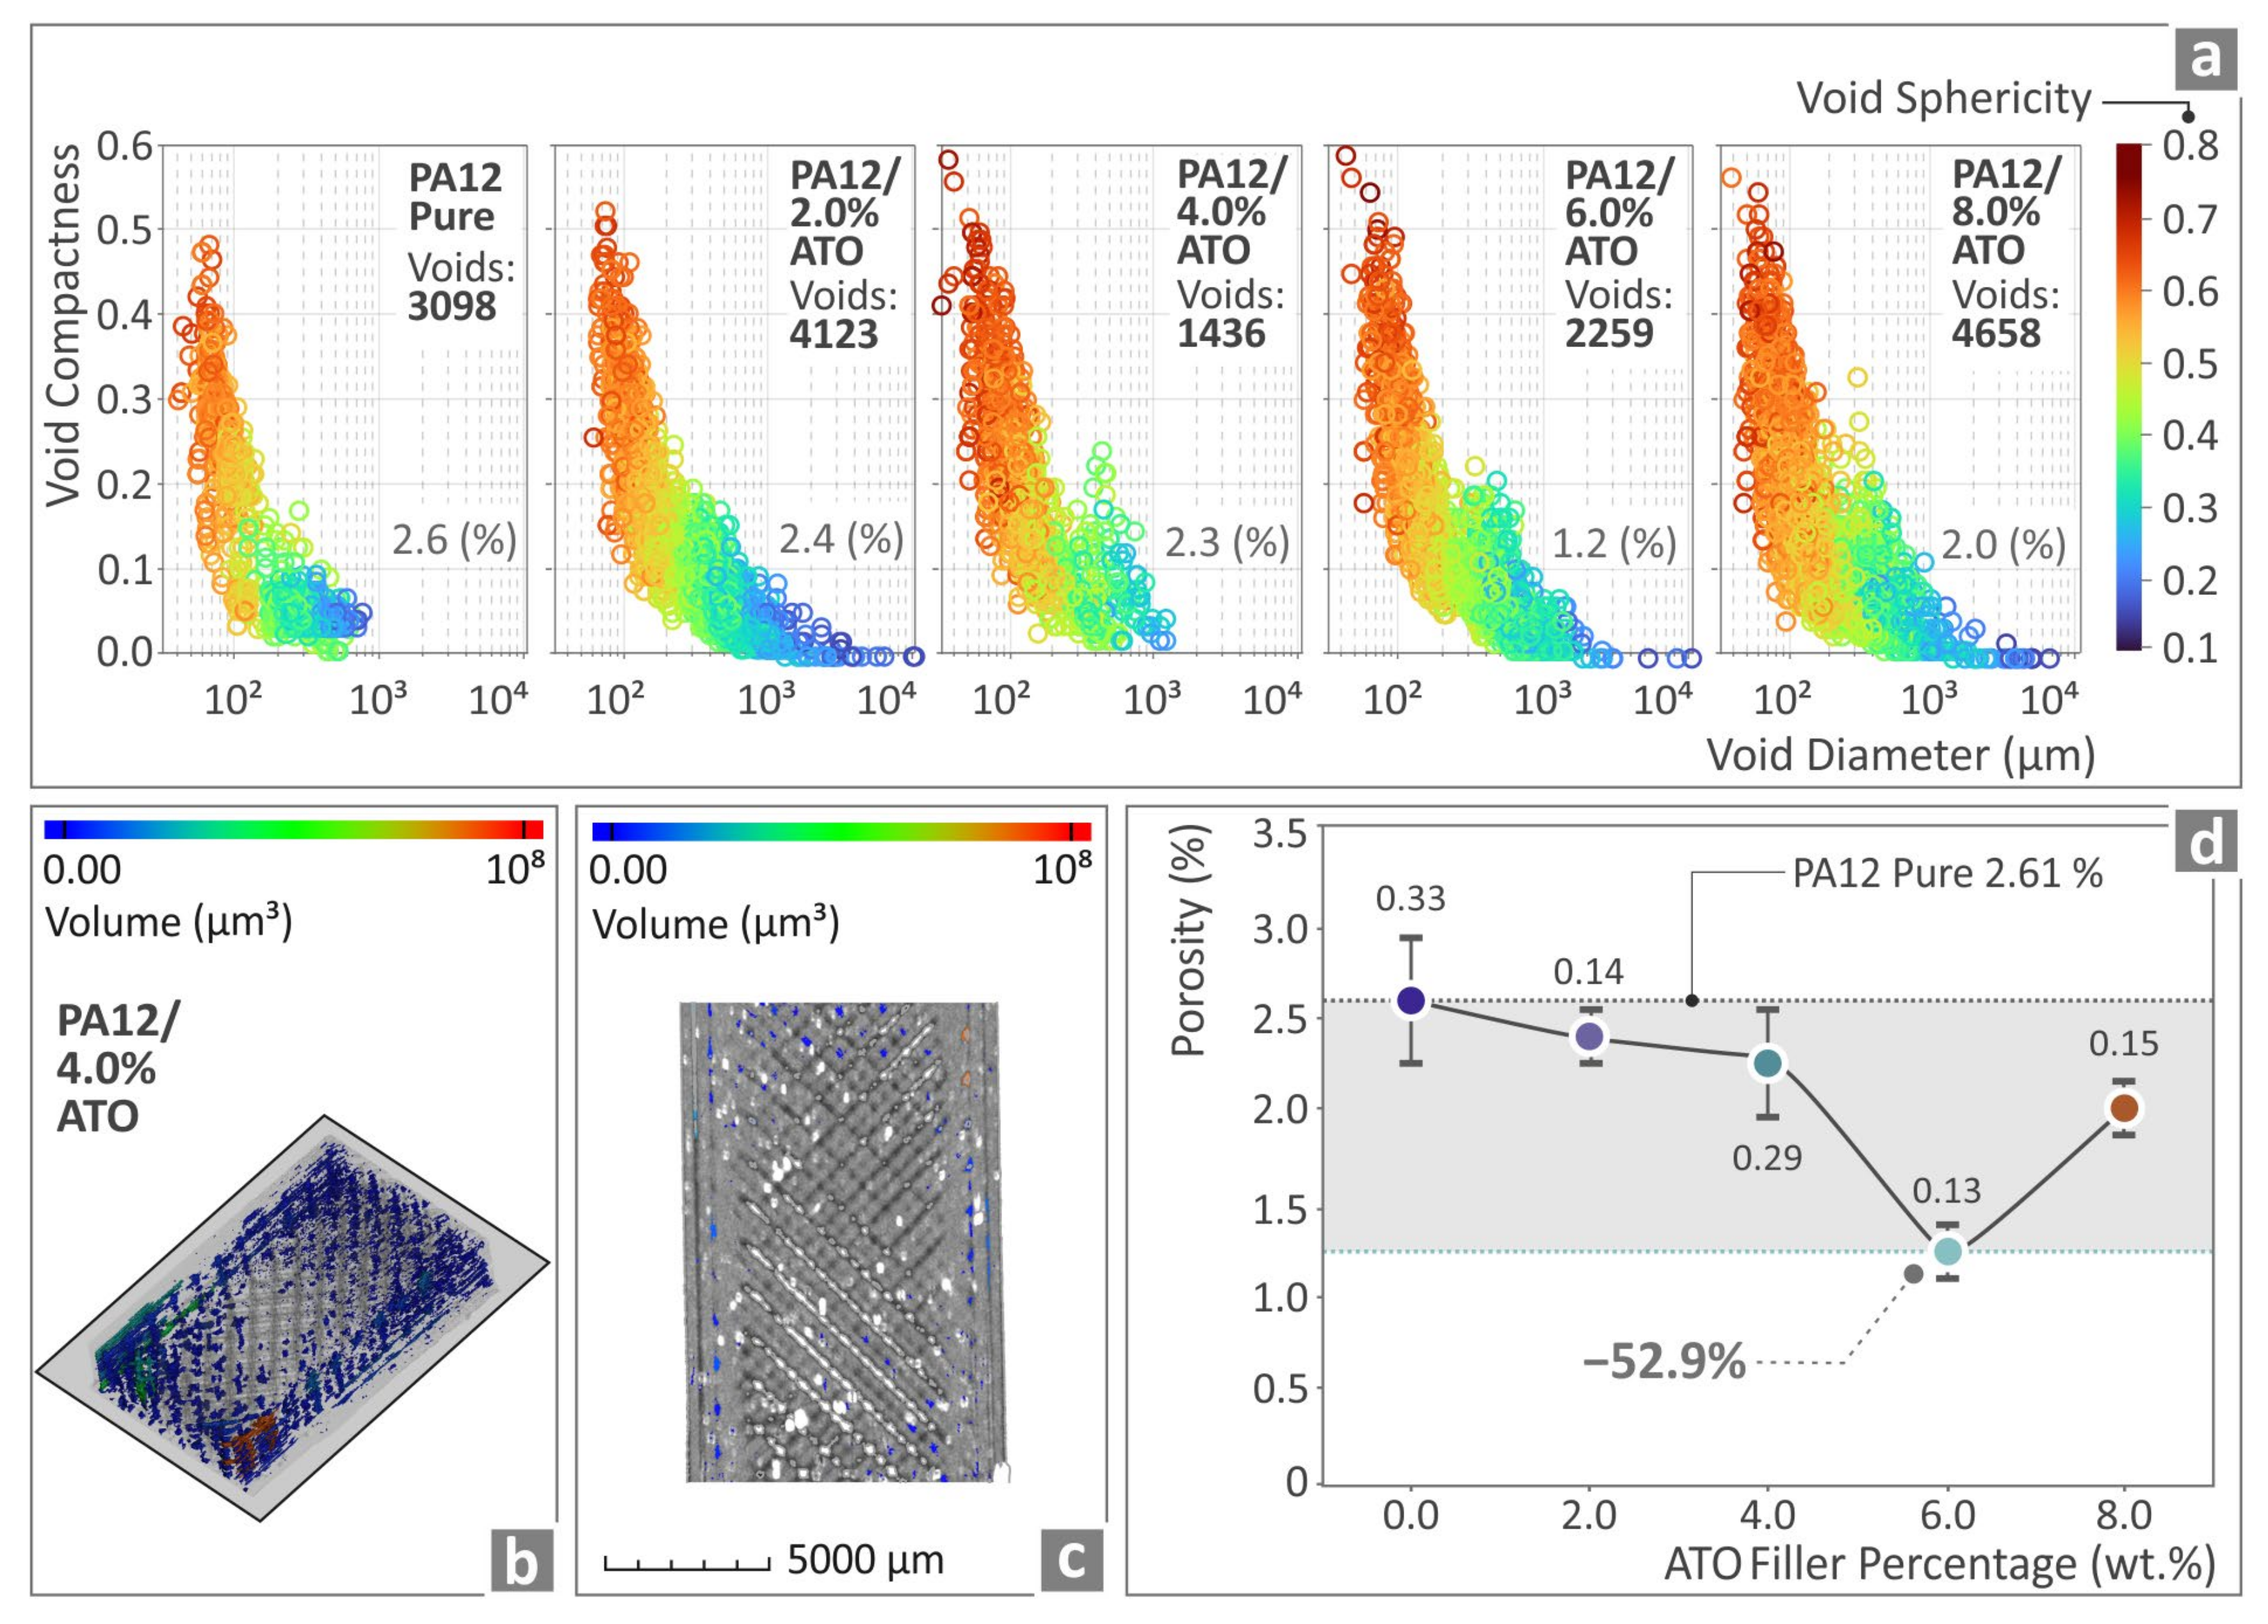
3.6. μ-Computed Tomography Results
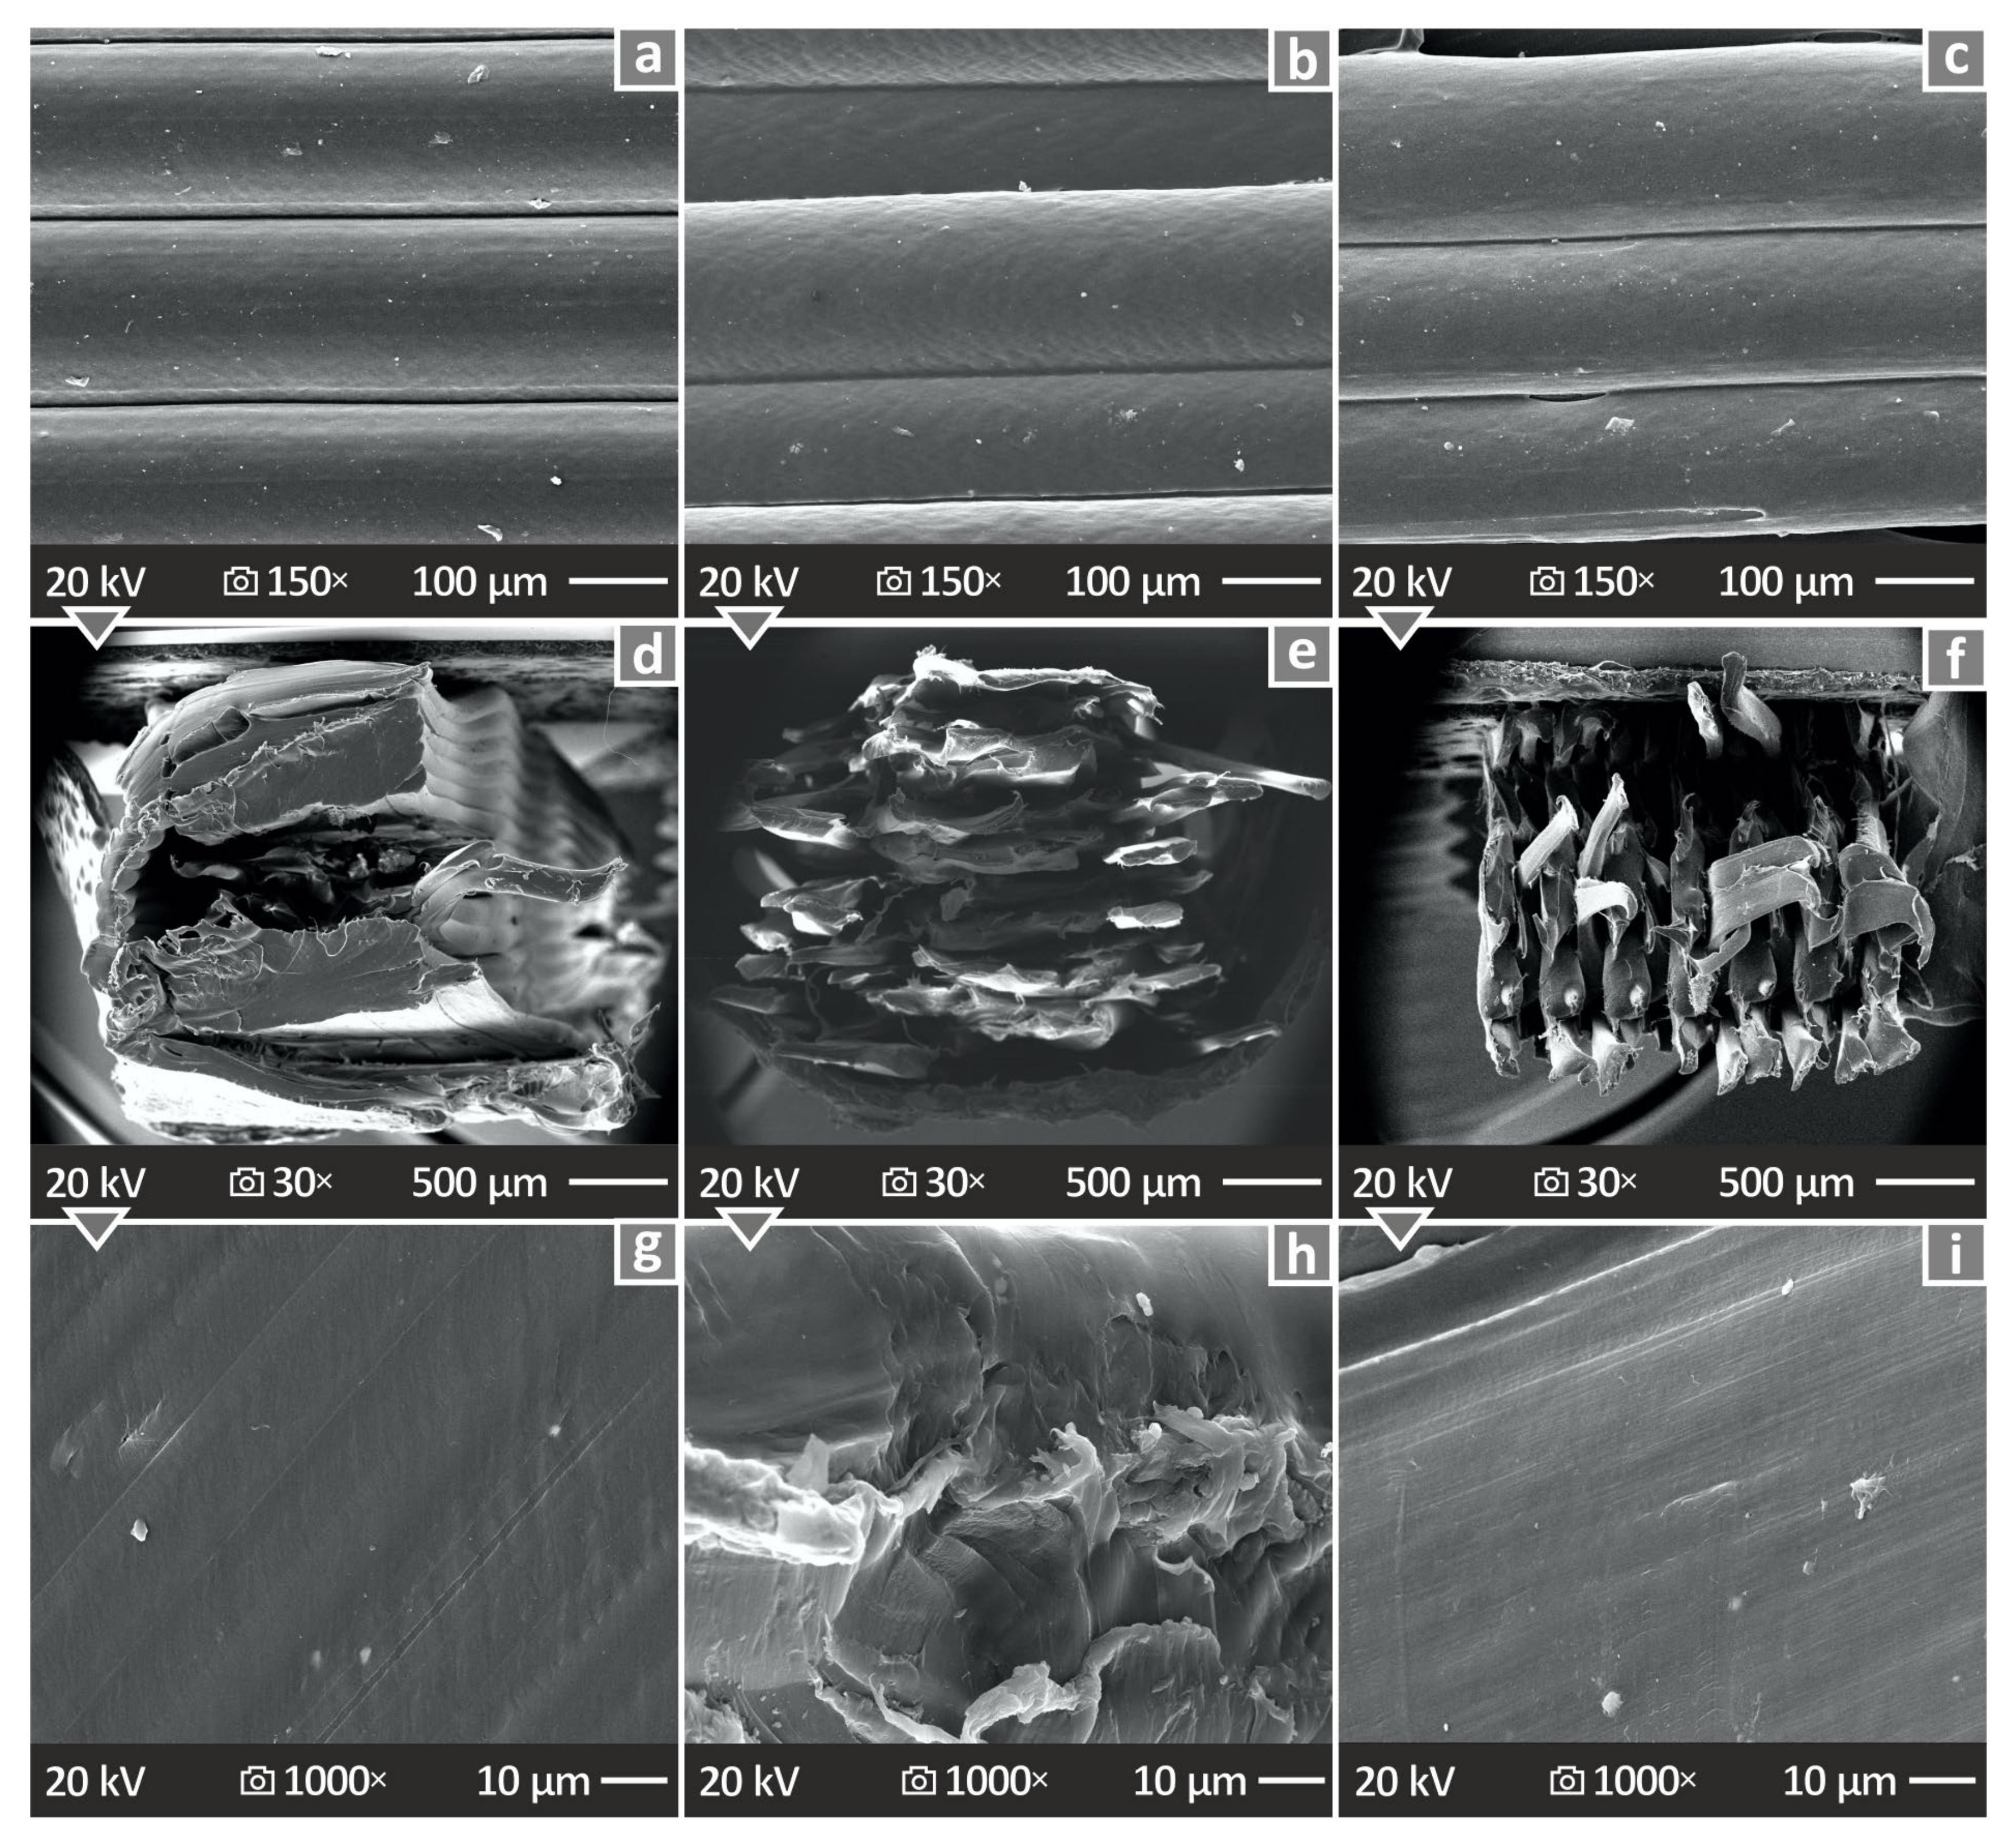
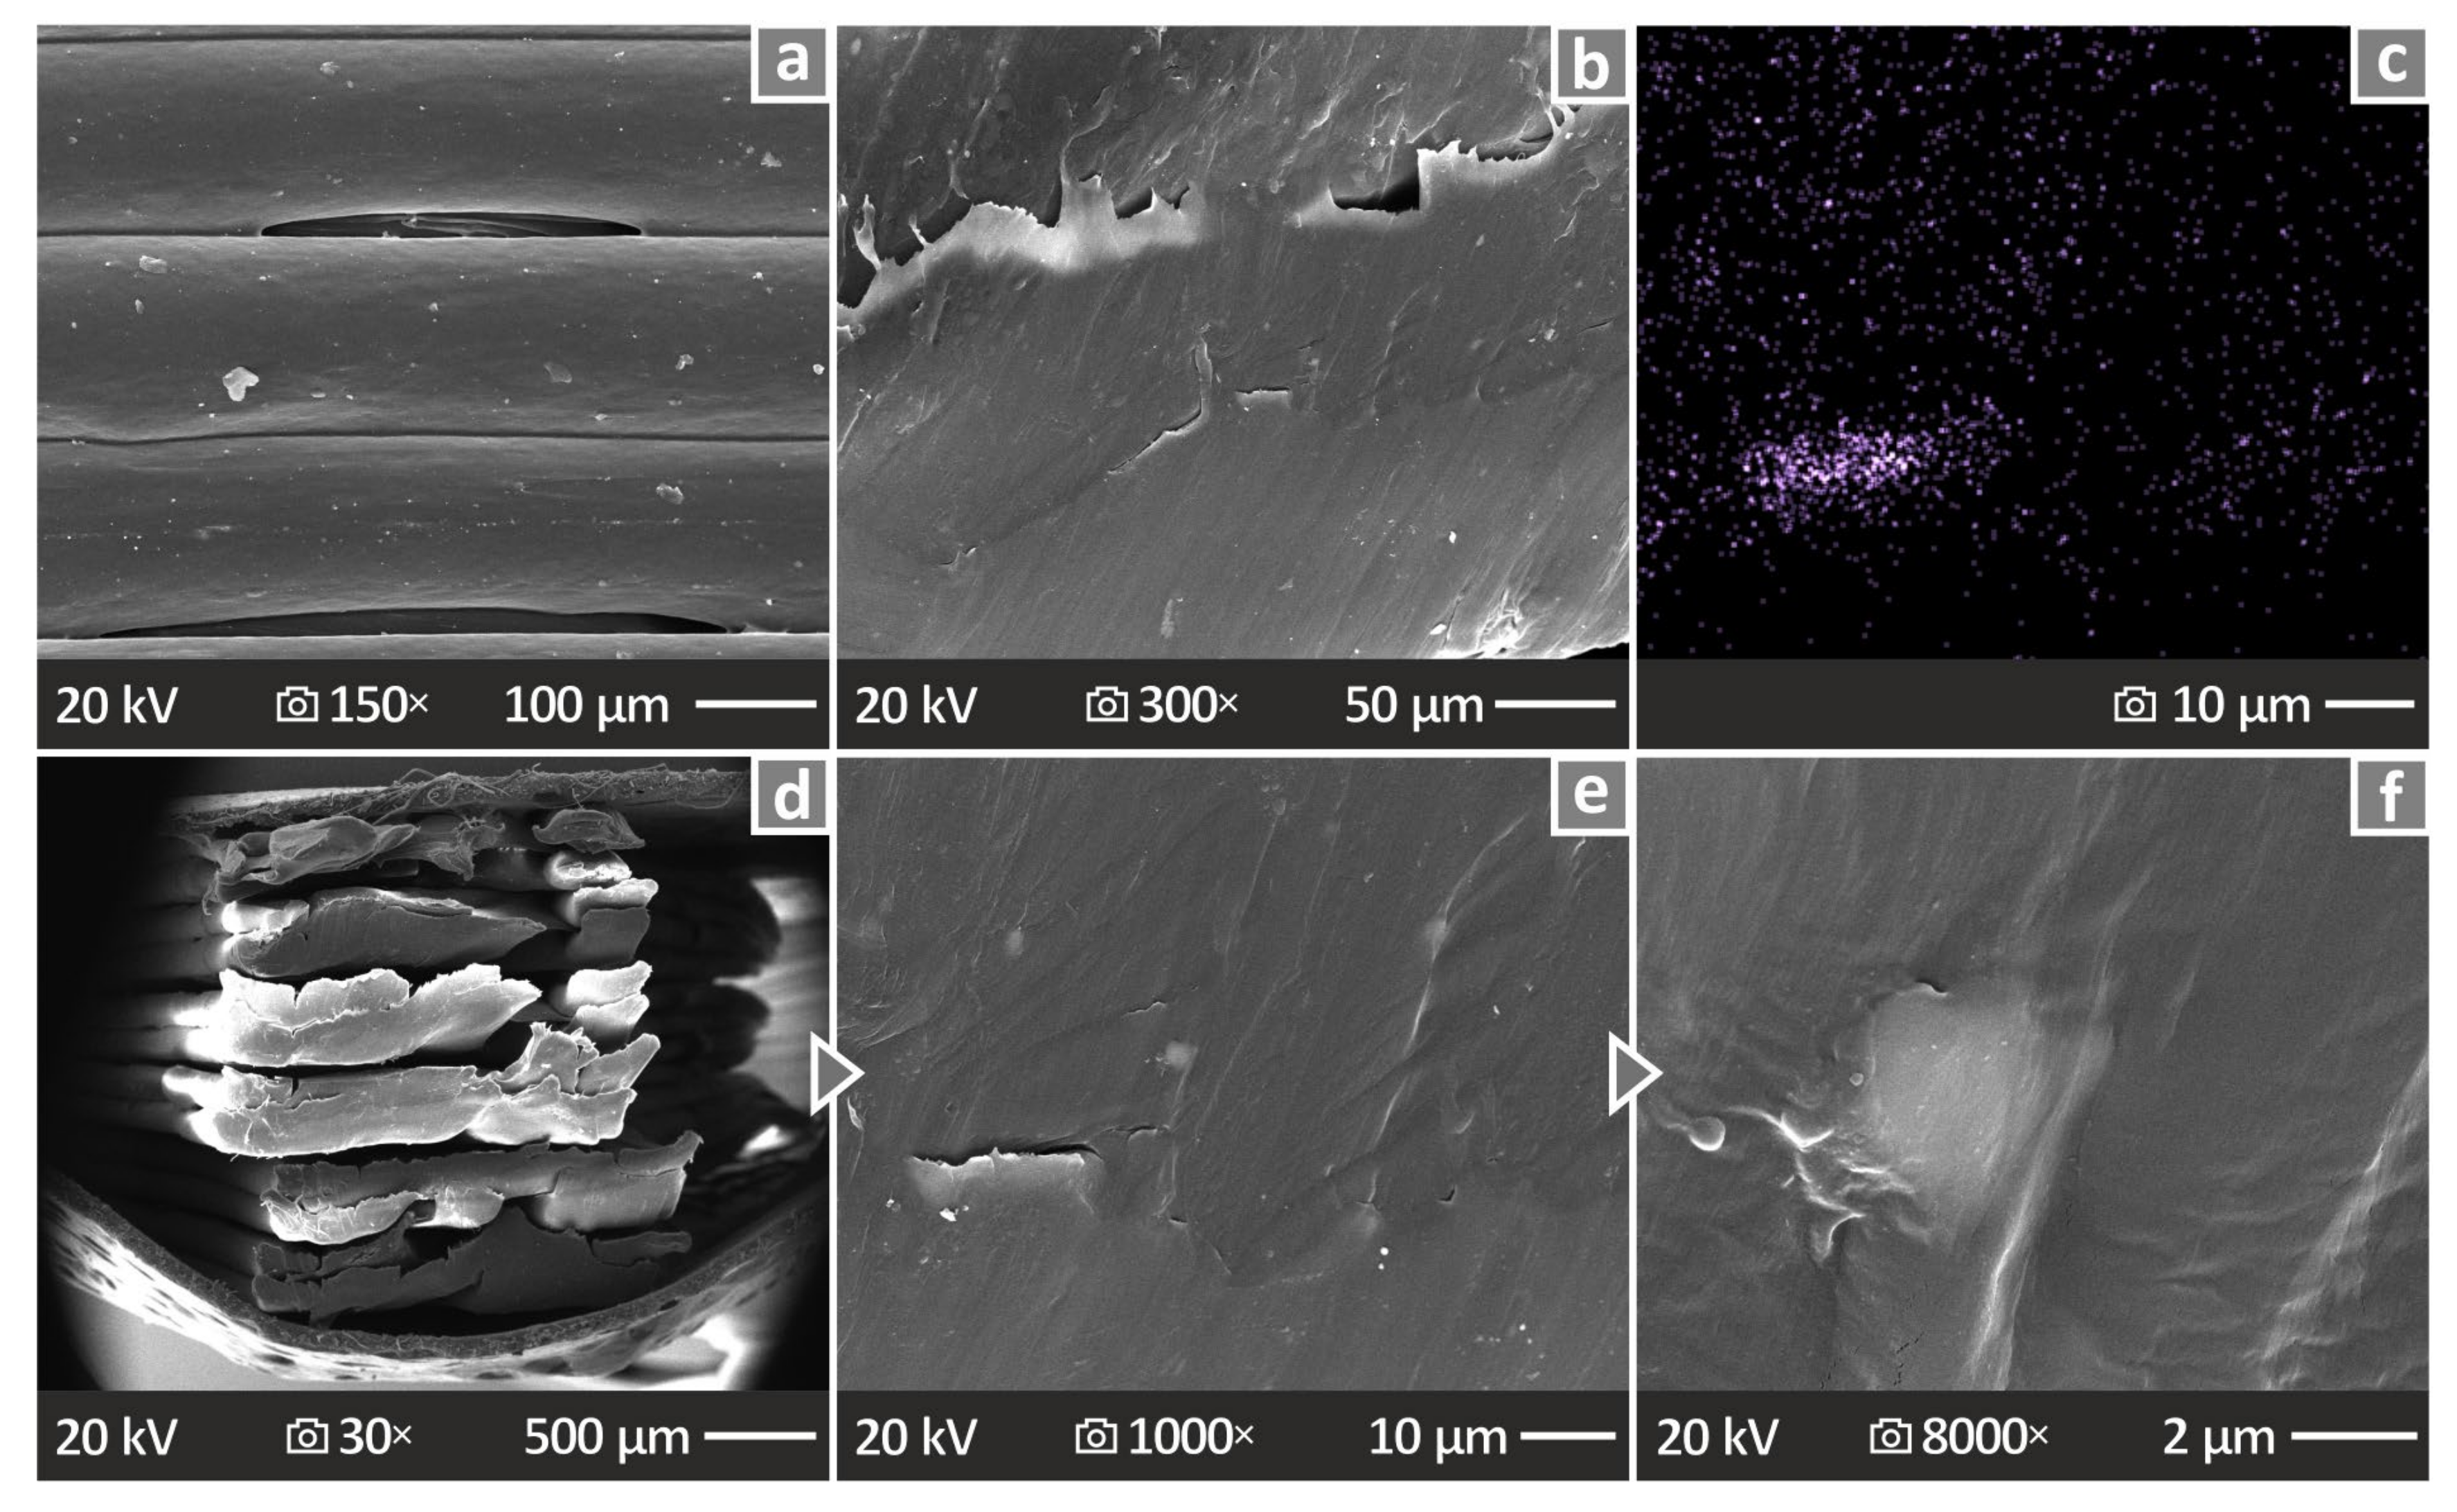
3.7. Morphological and Chemical Analysis Results of the 3D-P Samples
4. Discussion
5. Conclusions
- The ATO 4.0 wt.% content is considered the optimum filler content among the PA12/ATO nanocomposites prepared, with 19.3% and 18.6% increases in the tensile and flexural strength, respectively (vs. the control sample of the unfilled PA12).
- The thermal invariance of the PA12 polymer was maintained and somewhat enhanced by the ATO nanoparticles’ introduction in the matrix.
- The viscosity of the nanocomposites was slightly increased compared with the control sample (PA12 pure), while MFR constantly decreased while increasing the ATO content in the nanocomposites.
- The ATO nanoparticle’s introduction increased the quality metrics of the 3D-printed specimens. The dimensional deviation was improved (decreased), and the percentage of voids in the 3D printed structure was decreased, especially in the PA12/ATO 6 wt.% nanocomposite.
Supplementary Materials
Author Contributions
Funding
Data Availability Statement
Acknowledgments
Conflicts of Interest
References
- Mota, C.; Puppi, D.; Chiellini, F.; Chiellini, E. Additive Manufacturing Techniques for the Production of Tissue Engineering Constructs. J. Tissue Eng. Regen. Med. 2015, 9, 174–190. [Google Scholar] [CrossRef]
- Seo, H.; Heo, S.G.; Lee, H.; Yoon, H. Preparation of PEG Materials for Constructing Complex Structures by Stereolithographic 3D Printing. RSC Adv. 2017, 7, 28684–28688. [Google Scholar] [CrossRef]
- Waldbaur, A.; Rapp, H.; Länge, K.; Rapp, B.E. Let There Be Chip—Towards Rapid Prototyping of Microfluidic Devices: One-Step Manufacturing Processes. Anal. Methods 2011, 3, 2681–2716. [Google Scholar] [CrossRef]
- Waheed, S.; Cabot, J.M.; Macdonald, N.P.; Lewis, T.; Guijt, R.M.; Paull, B.; Breadmore, M.C. 3D Printed Microfluidic Devices: Enablers and Barriers. Lab Chip 2016, 16, 1993–2013. [Google Scholar] [CrossRef] [PubMed]
- Sachs, E.M.; Haggerty, J.S.; Cima, M.J.; Williams, P.A. Three-Dimensional Printing Techniques. U.S. Patent 5,204,055, 20 April 1993. [Google Scholar]
- Hutmacher, D.W.; Sittinger, M.; Risbud, M.V. Scaffold-Based Tissue Engineering: Rationale for Computer-Aided Design and Solid Free-Form Fabrication Systems. Trends Biotechnol. 2004, 22, 354–362. [Google Scholar] [CrossRef]
- Beaman, J.J.; Barlow, J.W.; Bourell, D.L.; Crawford, R.H.; Marcus, H.L.; McAlea, K.P. Solid Freeform Fabrication: A New Direction in Manufacturing with Research and Applications in Thermal Laser Processing; Kluwer Academic Publishers: Boston, MA, USA, 1997; pp. 25–49. [Google Scholar]
- Comb, J.W.; Priedeman, W.R.; Turley, P.W. FDM® Technology Process Improvements. In Proceedings of the 1994 International Solid Freeform Fabrication Symposium, Austin, TX, USA, 8–10 August 1994. [Google Scholar]
- Mazumder, J.; Schifferer, A.; Choi, J. Direct Materials Deposition: Designed Macro and Microstructure. Mater. Res. Innov. 1999, 3, 118–131. [Google Scholar] [CrossRef]
- Jacobs, P.F. Rapid Prototyping & Manufacturing: Fundamentals of Stereolithography, 1st ed.; Society of Manufacturing Engin: Dearborn, MI, USA, 1992. [Google Scholar]
- Feygin, M.; Hsieh, B. Laminaled Objecf Manufacturing (LOM): A Simpler Process. In Proceedings of the 1991 International Solid Freeform Fabrication Symposium, Austin, TX, USA, 12–14 August 1991. [Google Scholar]
- Jain, V.K. Advanced (Non-Traditional) Machining Processes. In Machining; Springer: London, UK, 2008; pp. 299–327. [Google Scholar]
- Ambrosi, A.; Pumera, M. 3D-Printing Technologies for Electrochemical Applications. Chem. Soc. Rev. 2016, 45, 2740–2755. [Google Scholar] [CrossRef]
- Thomas, C.L.; Gaffney, T.M.; Kaza, S.; Lee, C.H. Rapid Prototyping of Large Scale Aerospace Structures. In Proceedings of the 1996 IEEE Aerospace Applications Conference: Proceedings, Aspen, CO, USA, 10 February 1996; IEEE: New York, NY, USA, 1999; pp. 219–230. [Google Scholar]
- Bacciaglia, A.; Ceruti, A.; Liverani, A. Towards Large Parts Manufacturing in Additive Technologies for Aerospace and Automotive Applications. Procedia Comput. Sci. 2022, 200, 1113–1124. [Google Scholar] [CrossRef]
- Mohanavel, V.; Ashraff Ali, K.S.; Ranganathan, K.; Allen Jeffrey, J.; Ravikumar, M.M.; Rajkumar, S. The Roles and Applications of Additive Manufacturing in the Aerospace and Automobile Sector. Mater. Today Proc. 2021, 47, 405–409. [Google Scholar] [CrossRef]
- Najmon, J.C.; Raeisi, S.; Tovar, A. Review of Additive Manufacturing Technologies and Applications in the Aerospace Industry. In Additive Manufacturing for the Aerospace Industry; Elsevier: New York, NY, USA, 2019; pp. 7–31. [Google Scholar]
- Tepylo, N.; Huang, X.; Patnaik, P.C. Laser-Based Additive Manufacturing Technologies for Aerospace Applications. Adv. Eng. Mater. 2019, 21, 1900617. [Google Scholar] [CrossRef]
- de Leon, A.C.; Chen, Q.; Palaganas, N.B.; Palaganas, J.O.; Manapat, J.; Advincula, R.C. High Performance Polymer Nanocomposites for Additive Manufacturing Applications. React. Funct. Polym. 2016, 103, 141–155. [Google Scholar] [CrossRef]
- Campbell, I.; Bourell, D.; Gibson, I. Additive Manufacturing: Rapid Prototyping Comes of Age. Rapid Prototyp. J. 2012, 18, 255–258. [Google Scholar] [CrossRef]
- Ding, D.; Shen, C.; Pan, Z.; Cuiuri, D.; Li, H.; Larkin, N.; van Duin, S. Towards an Automated Robotic Arc-Welding-Based Additive Manufacturing System from CAD to Finished Part. Comput. Aided Des. 2016, 73, 66–75. [Google Scholar] [CrossRef]
- Raja, V.; Zhang, S.; Garside, J.; Ryall, C.; Wimpenny, D. Rapid and Cost-Effective Manufacturing of High-Integrity Aerospace Components. Int. J. Adv. Manuf. Technol. 2006, 27, 759–773. [Google Scholar] [CrossRef]
- Song, Y.; Yan, Y.; Zhang, R.; Xu, D.; Wang, F. Manufacture of the Die of an Automobile Deck Part Based on Rapid Prototyping and Rapid Tooling Technology. J. Mater. Process Technol. 2002, 120, 237–242. [Google Scholar] [CrossRef]
- Vasco, J.C. Additive Manufacturing for the Automotive Industry. In Additive Manufacturing; Elsevier: New York, NY, USA, 2021; pp. 505–530. [Google Scholar]
- Dhakshyani, R.; Nukman, Y.; Abu Osman, N.; Vijay, C. Preliminary Report: Rapid Prototyping Models for Dysplastic Hip Surgery. Open Med. 2011, 6, 266–270. [Google Scholar] [CrossRef]
- Liu, Q.; Leu, M.C.; Schmitt, S.M. Rapid Prototyping in Dentistry: Technology and Application. Int. J. Adv. Manuf. Technol. 2006, 29, 317–335. [Google Scholar] [CrossRef]
- Petzold, R.; Zeilhofer, H.-F.; Kalender, W.A. Rapid Prototyping Technology in Medicine—Basics and Applications. Comput. Med. Imaging Graph. 1999, 23, 277–284. [Google Scholar] [CrossRef] [PubMed]
- Mognol, P.; Lepicart, D.; Perry, N. Rapid Prototyping: Energy and Environment in the Spotlight. Rapid Prototyp. J. 2006, 12, 26–34. [Google Scholar] [CrossRef]
- Liu, Z.; Zhang, M.; Bhandari, B.; Wang, Y. 3D Printing: Printing Precision and Application in Food Sector. Trends Food Sci. Technol. 2017, 69, 83–94. [Google Scholar] [CrossRef]
- Luo, Y.; Ji, Z.; Leu, M.C.; Caudill, R. Environmental Performance Analysis of Solid Freedom Fabrication Processes. In Proceedings of the 1999 IEEE International Symposium on Electronics and the Environment (Cat. No.99CH36357), Danvers, MA, USA, 13 May 1999; IEEE: New York, NY, USA, 1999; pp. 1–6. [Google Scholar]
- Telenko, C.; Conner Seepersad, C. A Comparison of the Energy Efficiency of Selective Laser Sintering and Injection Molding of Nylon Parts. Rapid Prototyp. J. 2012, 18, 472–481. [Google Scholar] [CrossRef]
- Abdulhameed, O.; Al-Ahmari, A.; Ameen, W.; Mian, S.H. Additive Manufacturing: Challenges, Trends, and Applications. Adv. Mech. Eng. 2019, 11, 168781401882288. [Google Scholar] [CrossRef]
- Sun, C.; Wang, Y.; McMurtrey, M.D.; Jerred, N.D.; Liou, F.; Li, J. Additive Manufacturing for Energy: A Review. Appl. Energy 2021, 282, 116041. [Google Scholar] [CrossRef]
- Ning, F.; Cong, W.; Hu, Z.; Huang, K. Additive Manufacturing of Thermoplastic Matrix Composites Using Fused Deposition Modeling: A Comparison of Two Reinforcements. J. Compos. Mater. 2017, 51, 3733–3742. [Google Scholar] [CrossRef]
- Murphy, C.A.; Collins, M.N. Microcrystalline Cellulose Reinforced Polylactic Acid Biocomposite Filaments for 3D Printing. Polym. Compos. 2018, 39, 1311–1320. [Google Scholar] [CrossRef]
- Kam, M.; Saruhan, H.; Ipekci, A. Investigation the Effects of 3D Printer System Vibrations on Mechanical Properties of the Printed Products. Sigma J. Eng. Nat. Sci. 2018, 36, 655–666. [Google Scholar]
- Kam, M.; İpekçi, A.; Saruhan, H. Investigation of 3d Printing Filling Structures Effect on Mechanical Properties and Surface Roughness of PET-G Material Products. Gaziosmanpaşa Bilimsel Araştırma Derg. 2017, 6, 114–121. [Google Scholar]
- Petousis, M.; Vidakis, N.; Mountakis, N.; Papadakis, V.; Tzounis, L. Three-Dimensional Printed Polyamide 12 (PA12) and Polylactic Acid (PLA) Alumina (Al2O3) Nanocomposites with Significantly Enhanced Tensile, Flexural, and Impact Properties. Nanomaterials 2022, 12, 4292. [Google Scholar] [CrossRef] [PubMed]
- Tyuftin, A.A.; Kerry, J.P. Review of Surface Treatment Methods for Polyamide Films for Potential Application as Smart Packaging Materials: Surface Structure, Antimicrobial and Spectral Properties. Food Packag. Shelf Life 2020, 24, 100475. [Google Scholar] [CrossRef]
- Shao, S.; Zeng, F.; Long, L.; Zhu, X.; Peng, L.E.; Wang, F.; Yang, Z.; Tang, C.Y. Nanofiltration Membranes with Crumpled Polyamide Films: A Critical Review on Mechanisms, Performances, and Environmental Applications. Environ. Sci. Technol. 2022, 56, 12811–12827. [Google Scholar] [CrossRef]
- De Schoenmaker, B.; Van der Heijden, S.; De Baere, I.; Van Paepegem, W.; De Clerck, K. Effect of Electrospun Polyamide 6 Nanofibres on the Mechanical Properties of a Glass Fibre/Epoxy Composite. Polym. Test. 2013, 32, 1495–1501. [Google Scholar] [CrossRef]
- Supaphol, P.; Mit-Uppatham, C.; Nithitanakul, M. Ultrafine Electrospun Polyamide-6 Fibers: Effect of Emitting Electrode Polarity on Morphology and Average Fiber Diameter. J. Polym. Sci. B Polym. Phys. 2005, 43, 3699–3712. [Google Scholar] [CrossRef]
- Heikkilä, P.; Harlin, A. Parameter Study of Electrospinning of Polyamide-6. Eur. Polym. J. 2008, 44, 3067–3079. [Google Scholar] [CrossRef]
- Durkan, R.; Ayaz, E.A.; Bagis, B.; Gurbuz, A.; Ozturk, N.; Korkmaz, F.M. Comparative Effects of Denture Cleansers on Physical Properties of Polyamide and Polymethyl Methacrylate Base Polymers. Dent. Mater. J. 2013, 32, 367–375. [Google Scholar] [CrossRef] [PubMed]
- Soygun, K.; Bolayir, G.; Boztug, A. Mechanical and Thermal Properties of Polyamide versus Reinforced PMMA Denture Base Materials. J. Adv. Prosthodont. 2013, 5, 153–160. [Google Scholar] [CrossRef] [PubMed]
- Kim, J.H.; Choe, H.C.; Son, M.K. Evaluation of Adhesion of Reline Resins to the Thermoplastic Denture Base Resin for Non-Metal Clasp Denture. Dent. Mater. J. 2014, 33, 32–38. [Google Scholar] [CrossRef] [PubMed]
- Vidakis, N.; Petousis, M.; Ntintakis, I.; David, C.; Sagris, D.; Mountakis, N.; Moutsopoulou, A. Quantitative Insight into the Compressive Strain Rate Sensitivity of Polylactic Acid, Acrylonitrile Butadiene Styrene, Polyamide 12, and Polypropylene in Material Extrusion Additive Manufacturing. J. Dyn. Behav. Mater. 2024, 1–19. [Google Scholar] [CrossRef]
- Balabanov, S.V.; Makogon, A.I.; Sychev, M.M.; Evstratov, A.A.; Regazzi, A.; Lopez-Cuesta, J.M. 3D Printing and Mechanical Properties of Polyamide Products with Schwartz Primitive Topology. Tech. Phys. 2020, 65, 211–215. [Google Scholar] [CrossRef]
- Petousis, M.; Spiridaki, M.; Mountakis, N.; Moutsopoulou, A.; Maravelakis, E.; Vidakis, N. Box-Behnken Modeling to Optimize the Engineering Response and the Energy Expenditure in Material Extrusion Additive Manufacturing of Short Carbon Fiber Reinforced Polyamide 6. Int. J. Adv. Manuf. Technol. 2024, 132, 4399–4415. [Google Scholar] [CrossRef]
- Chowdhury, M.R.; Steffes, J.; Huey, B.D.; McCutcheon, J.R. 3D Printed Polyamide Membranes for Desalination. Science 2018, 361, 682–686. [Google Scholar] [CrossRef]
- Zhang, X.; Fan, W.; Liu, T. Fused Deposition Modeling 3D Printing of Polyamide-Based Composites and Its Applications. Compos. Commun. 2020, 21, 100413. [Google Scholar] [CrossRef]
- Vidakis, N.; Petousis, M.; Velidakis, E.; Mountakis, N.; Grammatikos, S.A.; Tzounis, L. Multi-Functional Medical Grade Polyamide12/Carbon Black Nanocomposites in Material Extrusion 3D Printing. Compos. Struct. 2023, 311, 116788. [Google Scholar] [CrossRef]
- Vidakis, N.; Petousis, M.; Michailidis, N.; Grammatikos, S.; David, C.N.; Mountakis, N.; Argyros, A.; Boura, O. Development and Optimization of Medical-Grade MultiFunctional Polyamide 12-Cuprous Oxide Nanocomposites with Superior Mechanical and Antibacterial Properties for Cost-Effective 3D Printing. Nanomaterials 2022, 12, 534. [Google Scholar] [CrossRef]
- Vidakis, N.; Petousis, M.; Mountakis, N.; Korlos, A.; Papadakis, V.; Moutsopoulou, A. Trilateral Multi-Functional Polyamide 12 Nanocomposites with Binary Inclusions for Medical Grade Material Extrusion 3D Printing: The Effect of Titanium Nitride in Mechanical Reinforcement and Copper/Cuprous Oxide as Antibacterial Agents. J. Funct. Biomater. 2022, 13, 115. [Google Scholar] [CrossRef] [PubMed]
- Vidakis, N.; Petousis, M.; Michailidis, N.; Mountakis, N.; Papadakis, V.; Argyros, A.; Charou, C. Polyethylene Glycol and Polyvinylpyrrolidone Reduction Agents for Medical Grade Polyamide 12/Silver Nanocomposites Development for Material Extrusion 3D Printing: Rheological, Thermomechanical, and Biocidal Performance. React. Funct. Polym. 2023, 190, 105623. [Google Scholar] [CrossRef]
- Vidakis, N.; Petousis, M.; Michailidis, N.; Mountakis, N.; Papadakis, V.; Argyros, A.; Charou, C. Medical Grade Polyamide 12 Silver Nanoparticle Filaments Fabricated with In-Situ Reactive Reduction Melt-Extrusion: Rheological, Thermomechanical, and Bactericidal Performance in MEX 3D Printing. Appl. Nanosci. 2023, 14, 69–88. [Google Scholar] [CrossRef]
- Hou, Y.; Panesar, A. Effect of Manufacture-Induced Interfaces on the Tensile Properties of 3D Printed Polyamide and Short Carbon Fibre-Reinforced Polyamide Composites. Polymers 2023, 15, 773. [Google Scholar] [CrossRef] [PubMed]
- Peng, Y.; Wu, Y.; Li, S.; Wang, K.; Yao, S.; Liu, Z.; Garmestani, H. Tailorable Rigidity and Energy-Absorption Capability of 3D Printed Continuous Carbon Fiber Reinforced Polyamide Composites. Compos. Sci. Technol. 2020, 199, 108337. [Google Scholar] [CrossRef]
- Beylergil, B.; Al-Nadhari, A.; Yildiz, M. Optimization of Charpy-Impact Strength of 3D-Printed Carbon Fiber/Polyamide Composites by Taguchi Method. Polym. Compos. 2023, 44, 2846–2859. [Google Scholar] [CrossRef]
- Egdell, R.G.; Flavell, W.R.; Tavener, P. Antimony-Doped Tin(IV) Oxide: Surface Composition and Electronic Structure. J. Solid. State Chem. 1984, 51, 345–354. [Google Scholar] [CrossRef]
- Hoflund, G.B.; Cox, D.F.; Woodson, G.L.; Laitinen, H.A. Surface Characteristics of Antimony-Doped Tin Oxide Films. Thin Solid. Film. 1981, 78, 357–363. [Google Scholar] [CrossRef]
- Vidakis, N.; Petousis, M.; Maniadi, A.; Koudoumas, E.; Liebscher, M.; Tzounis, L. Mechanical Properties of 3D-Printed Acrylonitrile–Butadiene–Styrene TiO2 and ATO Nanocomposites. Polymers 2020, 12, 1589. [Google Scholar] [CrossRef]
- Wu, M.; Zheng, H.; Li, X.; Yu, S. Highly Transparent Low Resistance ATO/AgNWs/ATO Flexible Transparent Conductive Thin Films. Ceram. Int. 2020, 46, 4344–4350. [Google Scholar] [CrossRef]
- Xiao, Y.; Tian, W.; Yu, L.; Chen, M.; Zheng, X.; Qin, G. Tunable Optical Properties of ATO-CuO Hybrid Nanofluids and the Application as Spectral Beam Splitters. Energy 2024, 289, 129964. [Google Scholar] [CrossRef]
- Yang, Z.; Zhang, M.; Zhao, X.; Guo, Z.; Zeb, S.; Jiang, W.; Liu, T.; Hu, R.; Jiang, X. Ammonia Induced Strong LSPR Effect of Chain-like ATO Nanocrystals for Hyperspectral Selective Energy-Saving Window Applications. Chem. Eng. J. 2024, 479, 147442. [Google Scholar] [CrossRef]
- Chopra, K.L.; Major, S.; Pandya, D.K. Transparent Conductors—A Status Review. Thin Solid. Films 1983, 102, 1–46. [Google Scholar] [CrossRef]
- Ginley, D.S.; Bright, C. Transparent Conducting Oxides. MRS Bull. 2000, 25, 15–18. [Google Scholar] [CrossRef]
- Gordon, R.G. Criteria for Choosing Transparent Conductors. MRS Bull. 2000, 25, 52–57. [Google Scholar] [CrossRef]
- Lewis, B.G.; Paine, D.C. Applications and Processing of Transparent Conducting Oxides. MRS Bull. 2000, 25, 22–27. [Google Scholar] [CrossRef]
- Vidakis, N.; Petousis, M.; Velidakis, E.; Mountakis, N.; Fischer-Griffiths, P.E.; Grammatikos, S.A.; Tzounis, L. Mechanical Reinforcement Course of 3D Printed Polypropylene—Antimony Doped Tin Oxide Nanocomposites versus Filler Loading. Adv. Compos. Mater. 2022, 31, 235–256. [Google Scholar] [CrossRef]
- Petousis, M.; Michailidis, N.; Saltas, V.; Papadakis, V.; Spiridaki, M.; Mountakis, N.; Argyros, A.; Valsamos, J.; Nasikas, N.K.; Vidakis, N. Mechanical and Electrical Properties of Polyethylene Terephthalate Glycol/Antimony Tin Oxide Nanocomposites in Material Extrusion 3D Printing. Nanomaterials 2024, 14, 761. [Google Scholar] [CrossRef]
- Wang, K.; Xie, G.; Xiang, J.; Li, T.; Peng, Y.; Wang, J.; Zhang, H. Materials Selection of 3D Printed Polyamide-Based Composites at Different Strain Rates: A Case Study of Automobile Front Bumpers. J. Manuf. Process 2022, 84, 1449–1462. [Google Scholar] [CrossRef]
- Zare, Y.; Rhee, K.Y.; Hui, D. Influences of Nanoparticles Aggregation/Agglomeration on the Interfacial/Interphase and Tensile Properties of Nanocomposites. Compos. B Eng. 2017, 122, 41–46. [Google Scholar] [CrossRef]
- Song, Y.; Zheng, Q. Concepts and Conflicts in Nanoparticles Reinforcement to Polymers beyond Hydrodynamics. Prog. Mater. Sci. 2016, 84, 1–58. [Google Scholar] [CrossRef]
- ASTM D638-02a; Standard Test Method for Tensile Properties of Plastics. American Society for Testing and Materials: West Conshohocken, PA, USA, 2017.
- ASTM D790-10; Standard Test Methods for Flexural Properties of Unreinforced and Reinforced Plastics and Electrical Insulating Materials. American Society for Testing and Materials: West Conshohocken, PA, USA, 2016.
- ASTM DD6110-04; Standard Test Method for Determining the Charpy Impact Resistance of Notched Specimens of Plastics. American Society for Testing and Materials: West Conshohocken, PA, USA, 2004.
- ASTM E384-17; Standard Test Method for Microindentation Hardness of Materials. American Society for Testing and Materials: West Conshohocken, PA, USA, 2022.
- ASTM D1238-13; Standard Test Method for Melt Flow Rates of Thermoplastics by Extrusion Plastometer. American Society for Testing and Materials: West Conshohocken, PA, USA, 2020.
- Stuart, B.H. Temperature Studies of Polycarbonate Using Fourier Transform Raman Spectroscopy. Polym. Bull. 1996, 36, 341–346. [Google Scholar] [CrossRef]
- Makarem, M.; Lee, C.M.; Kafle, K.; Huang, S.; Chae, I.; Yang, H.; Kubicki, J.D.; Kim, S.H. Probing Cellulose Structures with Vibrational Spectroscopy. Cellulose 2019, 26, 35–79. [Google Scholar] [CrossRef]
- Resta, V.; Quarta, G.; Lomascolo, M.; Maruccio, L.; Calcagnile, L. Raman and Photoluminescence Spectroscopy of Polycarbonate Matrices Irradiated with Different Energy 28Si+ Ions. Vacuum 2015, 116, 82–89. [Google Scholar] [CrossRef]
- Zimmerer, C.; Matulaitiene, I.; Niaura, G.; Reuter, U.; Janke, A.; Boldt, R.; Sablinskas, V.; Steiner, G. Nondestructive Characterization of the Polycarbonate-Octadecylamine Interface by Surface Enhanced Raman Spectroscopy. Polym. Test. 2019, 73, 152–158. [Google Scholar] [CrossRef]
- Luiz, B.K.M.; Amboni, R.D.M.C.; Prates, L.H.M.; Roberto Bertolino, J.; Pires, A.T.N. Influence of Drinks on Resin Composite: Evaluation of Degree of Cure and Color Change Parameters. Polym. Test. 2007, 26, 438–444. [Google Scholar] [CrossRef]
- Gatin, E.; Iordache, S.-M.; Matei, E.; Luculescu, C.-R.; Iordache, A.-M.; Grigorescu, C.E.; Ilici, R.R. Raman Spectroscopy as Spectral Tool for Assessing the Degree of Conversion after Curing of Two Resin-Based Materials Used in Restorative Dentistry. Diagnostics 2022, 12, 1993. [Google Scholar] [CrossRef]
- Peris-Díaz, M.D.; Łydżba-Kopczyńska, B.; Sentandreu, E. Raman Spectroscopy Coupled to Chemometrics to Discriminate Provenance and Geological Age of Amber. J. Raman Spectrosc. 2018, 49, 842–851. [Google Scholar] [CrossRef]
- Liu, X.; Zou, Y.; Li, W.; Cao, G.; Chen, W. Kinetics of Thermo-Oxidative and Thermal Degradation of Poly(d,l-Lactide) (PDLLA) at Processing Temperature. Polym. Degrad. Stab. 2006, 91, 3259–3265. [Google Scholar] [CrossRef]
- Subramaniam, M.P.; Arunachalam, G.; Kandasamy, R.; Veluswamy, P.; Hiroya, I. Effect of PH and Annealing Temperature on the Properties of Tin Oxide Nanoparticles Prepared by Sol–Gel Method. J. Mater. Sci. Mater. Electron. 2018, 29, 658–666. [Google Scholar] [CrossRef]
- Shrestha, S.; Wang, B.; Dutta, P. Nanoparticle Processing: Understanding and Controlling Aggregation. Adv. Colloid. Interface Sci. 2020, 279, 102162. [Google Scholar] [CrossRef]
- Wu, Y.; Wang, C.; Yang, T. Aggregation of Nanoparticles and Their Effect on Mechanical Properties of Carbon Nanotube Networks. Comput. Mater. Sci. 2022, 202, 110970. [Google Scholar] [CrossRef]
- Venkateshaiah, A.; Padil, V.V.T.; Nagalakshmaiah, M.; Waclawek, S.; Černík, M.; Varma, R.S. Microscopic Techniques for the Analysis of Micro and Nanostructures of Biopolymers and Their Derivatives. Polymers 2020, 12, 512. [Google Scholar] [CrossRef] [PubMed]
- Alqaheem, Y.; Alomair, A.A. Microscopy and Spectroscopy Techniques for Characterization of Polymeric Membranes. Membranes 2020, 10, 33. [Google Scholar] [CrossRef] [PubMed]
- Soliman, T.S.; Vshivkov, S.A.; Elkalashy, S.I. Structural, Linear and Nonlinear Optical Properties of Ni Nanoparticles–Polyvinyl Alcohol Nanocomposite Films for Optoelectronic Applications. Opt. Mater. 2020, 107, 110037. [Google Scholar] [CrossRef]
- Shan, L.; Tan, C.Y.; Shen, X.; Ramesh, S.; Zarei, M.S.; Kolahchi, R.; Hajmohammad, M.H. The Effects of Nano-Additives on the Mechanical, Impact, Vibration, and Buckling/Post-Buckling Properties of Composites: A Review. J. Mater. Res. Technol. 2023, 24, 7570–7598. [Google Scholar] [CrossRef]
- Da Costa, H.M.; Ramos, V.D.; de Oliveira, M.G. Degradation of Polypropylene (PP) during Multiple Extrusions: Thermal Analysis, Mechanical Properties and Analysis of Variance. Polym. Test. 2007, 26, 676–684. [Google Scholar] [CrossRef]
- Wu, Z.; Li, F.; Huang, L.; Shi, Y.; Jin, X.; Fang, S.; Chuang, K.; Lyon, R.E.; Harris, F.W.; Cheng, S.Z.D. The Thermal Degradation Mechanism and Thermal Mechanical Properties of Two High Performance Heterocyclic Polymer Fibers. J. Therm. Anal. Calorim. 2000, 59, 361–373. [Google Scholar] [CrossRef]
- Pliquet, M.; Rapeaux, M.; Delange, F.; Bussiere, P.O.; Therias, S.; Gardette, J.L. Multiscale Analysis of the Thermal Degradation of Polyamide 6,6: Correlating Chemical Structure to Mechanical Properties. Polym. Degrad. Stab. 2021, 185, 109496. [Google Scholar] [CrossRef]
- Plummer, C.J.G.; Rodlert, M.; Bucaille, J.-L.; Grünbauer, H.J.M.; Månson, J.-A.E. Correlating the Rheological and Mechanical Response of Polyurethane Nanocomposites Containing Hyperbranched Polymers. Polymer 2005, 46, 6543–6553. [Google Scholar] [CrossRef]
- Wang, X.; Zhao, L.; Fuh, J.Y.H.; Lee, H.P. Effect of Porosity on Mechanical Properties of 3D Printed Polymers: Experiments and Micromechanical Modeling Based on X-ray Computed Tomography Analysis. Polymers 2019, 11, 1154. [Google Scholar] [CrossRef] [PubMed]
- Al-Maharma, A.Y.; Patil, S.P.; Markert, B. Effects of Porosity on the Mechanical Properties of Additively Manufactured Components: A Critical Review. Mater. Res. Express 2020, 7, 122001. [Google Scholar] [CrossRef]


| 1000 | Drop | Strong Decrease |
|---|---|---|
| 1062 | Rise | Medium increase |
| 1106 | Rise | Strong increase |
| 1294 | Rise | Strong increase |
| 1435 | Rise | Strong increase |
| 1581 | Drop | Medium decrease |
| 1600 | Drop | Medium decrease |
| 2835 | Gradual drop | Small decrease |
| 2849 | Rise | Strong increase |
| 2883 | Rise | Strong increase |
| 2931 | Rise | Medium increase |
| 3052 | Drop | Significant decrease |
| IDT at 10% (°C) | IDT at 50% (°C) |
|---|---|
| 427.15 | 459.61 |
| 431.71 | 464.06 |
| 433.66 | 466.11 |
| 430.26 | 462.43 |
| 434.48 | 469.13 |
| 433.45 | 468.20 |
| Increase (%) | Current | PP [70] | PETG [71] | ABS [62] |
|---|---|---|---|---|
| Tensile strength | 19.3 | 7.0 | 21.0 | ~11.0 |
| Flexural strength | 18.6 | 8.0 | 14.4 | ~10.0 |
| Impact strength | 16.1 | 28.0 | 18.8 | - |
| microhardness | 13.0 | 5.0 | 25.1 | - |
Disclaimer/Publisher’s Note: The statements, opinions and data contained in all publications are solely those of the individual author(s) and contributor(s) and not of MDPI and/or the editor(s). MDPI and/or the editor(s) disclaim responsibility for any injury to people or property resulting from any ideas, methods, instructions or products referred to in the content. |
© 2024 by the authors. Licensee MDPI, Basel, Switzerland. This article is an open access article distributed under the terms and conditions of the Creative Commons Attribution (CC BY) license (https://creativecommons.org/licenses/by/4.0/).
Share and Cite
Nasikas, N.K.; Petousis, M.; Papadakis, V.; Argyros, A.; Valsamos, J.; Gkagkanatsiou, K.; Sagris, D.; David, C.; Michailidis, N.; Maravelakis, E.; et al. A Comprehensive Optimization Course of Antimony Tin Oxide Nanofiller Loading in Polyamide 12: Printability, Quality Assessment, and Engineering Response in Additive Manufacturing. Nanomaterials 2024, 14, 1285. https://doi.org/10.3390/nano14151285
Nasikas NK, Petousis M, Papadakis V, Argyros A, Valsamos J, Gkagkanatsiou K, Sagris D, David C, Michailidis N, Maravelakis E, et al. A Comprehensive Optimization Course of Antimony Tin Oxide Nanofiller Loading in Polyamide 12: Printability, Quality Assessment, and Engineering Response in Additive Manufacturing. Nanomaterials. 2024; 14(15):1285. https://doi.org/10.3390/nano14151285
Chicago/Turabian StyleNasikas, Nektarios K., Markos Petousis, Vassilis Papadakis, Apostolos Argyros, John Valsamos, Katerina Gkagkanatsiou, Dimitrios Sagris, Constantine David, Nikolaos Michailidis, Emmanuel Maravelakis, and et al. 2024. "A Comprehensive Optimization Course of Antimony Tin Oxide Nanofiller Loading in Polyamide 12: Printability, Quality Assessment, and Engineering Response in Additive Manufacturing" Nanomaterials 14, no. 15: 1285. https://doi.org/10.3390/nano14151285