Abstract
In this study, a new and simple glassy carbon electrode modified with carbon nanohorns (SWCNH/GCE) was used for the determination of Cr(VI) in aqueous matrices via adsorptive cathodic stripping voltammetry (AdCSV). The modified electrode was characterized via field emission scanning electron microscopy and cyclic voltammetry, which revealed a homogeneous distribution of spherical agglomerates of SWCNH on the electrode surface. The modification increased the electrochemically active area from 0.10 cm2 ± 0.01 (GCE) to 0.16 cm2 ± 0.01 (SWCNH/GCE). The optimized analytical conditions were as follows: a supporting electrolyte (0.15 mol L−1 HCl), an accumulation potential of 0.8 V versus Ag/AgCl, and an accumulation time of 240 s. Validation of the analytical methodology was performed, obtaining a linear range between 20 and 100 µg L−1, a limit of detection of 3.5 µg L−1, and a limit of quantification of 11.6 µg L−1 with good accuracy and precision. The method was applied to the analysis of spiked tap water samples, and the results were compared using a flame atomic absorption spectrophotometer (FAAS) with no significant statistical differences.
1. Introduction
During the last few decades, various anthropogenic and natural activities have caused an increase in the concentration of heavy metals in the environment. Some of them are toxic in all concentration ranges and others can accumulate and biomagnify along the food chain, which poses a serious problem for living organisms [1]. Chromium (Cr) is one of the most widely distributed heavy metals in the Earth’s crust [2], found mainly in trivalent (III) forms such as Cr(OH)2+ or Cr(OH)3 complexes and hexavalent (VI) forms such as oxo-compounds HCrO4−, CrO42−, and Cr2O72− depending on the pH of the medium [3,4]. Cr(III) at low concentrations is an essential trace element for the normal and healthy development of living organisms. On the contrary, Cr(VI) is highly toxic in biological systems due to its strongly oxidizing nature. It can also enter cells through non-selective membrane channels, reducing to Cr(III) and generating reactive oxygen species (ROS), which cause DNA damage [3,5]. This leads to prolonged exposure to Cr(VI) with toxic, mutagenic, and carcinogenic effects on humans [3,6,7], this being classified as one of the most dangerous heavy metals [8]. Industrialization (textile, metallurgical, chemical, etc.) has led to an increase in exposure to Cr(VI) due to water and air pollution [8], causing it to enter human bodies through the ingestion of contaminated food and tap water, inhalation, or dermal contact [3]. For this reason, various entities such as the World Health Organization (WHO), Environmental Protection Agency (EPA), and Food and Drug Administration (FDA) restrict the concentration of total chromium in tap water, bottled water, and groundwater to 0.05, 0.10, and 50 mg L−1, respectively [3,8], and in the case of food to 1000 µg kg−1 [9].
It is evident that due to the toxic effects of Cr(VI), it is very important to verify compliance with regulations. Therefore, it is essential to have techniques that allow for its rapid quantification at the trace and ultra-trace levels. Among the main techniques used for the determination of total Cr are flame atomic absorption spectroscopy (FAAS), graphite furnace atomic absorption spectroscopy (GF-AAS) [10,11], inductively coupled plasma optical emission (ICP-OES) or mass spectrometry detection (ICP-MS) [1,12,13] and ion chromatography (IC) [14]. Although these techniques are highly sensitive, reproducible, and capable of measuring low concentrations, they involve high instrumentation and analysis costs, require trained personnel, and require significant sample preparation, which complicates routine analysis [15]. Additionally, in these techniques, selective detection of Cr(VI) poses a significant challenge due to interferences from Cr(III) [16]. As an alternative, electroanalytical techniques such as adsorptive cathodic stripping voltammetry (AdCSV) [17] represent fast detection systems with different advantages: simplicity, sensitivity, selectivity, reproducibility, and cost-effectiveness for detecting Cr at the trace and ultra-trace levels. In order to improve the voltammetric response of this type of system, various modified electrodes have been developed and reported in the literature, including polymers [17,18], metals [7,19], and carbon nanomaterials [20,21,22], among others [23,24]. Regarding carbon nanomaterials, single-walled carbon nanohorns (SWCNHs) have multiple advantages for the development of electrodic surfaces in addition to their low cost and eco-friendly character. SWCNHs are graphene sheets with conical horn-shaped tips and one-dimensional (1-D) structures, with diameters ranging from 2.0 to 5.0 nm and lengths between 40.0 and 50.0 nm [25]. They can assemble through weak Van der Waals interactions, forming spherical structures. These materials exhibit high electrical conductivity, a large specific surface area, an internal nanoporous structure, and no metallic residues, making them highly attractive for use as electrode modifiers in the electrochemical determination of heavy metals [22,25].
Different electrochemical sensors have been employed for the detection of Cr(VI) using voltammetric techniques. For example, Kachoosangi et al. used a carbon paste electrode (CPE), which they mixed with polyethylene and on which they deposited a gold film, obtaining a linear range between 20 and 2000 μg L−1 with a detection limit (LOD) of 4.4 μg L−1 [26]. Xu et al. employed a more complex sensor based on gold nanoparticles (AuNPs) functionalized with pyridine and reduced graphene oxide (RGO) (AuNPs/3D RGO/GCE), reporting a linear range of 25 to 300 µg L−1 and an LOD of 1.2 µg L−1 [27]. Filik et al. modified a screen-printed electrode (SPCE) with multi-walled carbon nanotubes (MWNCTs), neutral red (NR), and Au nanoparticles (MWCNTs-NR-AuNPs/SPCE) prepared via complex synthesis, which gave them a linear range between 21 and 4160 µg L−1 with an LOD of 1.3 µg L−1 [28]. Finally, a sensor reported by Sadeghi et al. stands out, as they used two-step modification with carbon nanotubes and quercetin (QH2) (QH2/MWCNT-SPCE) to obtain a sensor with a linear range between 52 and 10,400 µg L−1 and an LOD of 15.6 µg L−1 [29]. The reported studies focus on the determination of Cr(VI) in samples of tap water, river water, wastewater, and mineral water. This literature review also revealed that to the best of our knowledge there are no studies using working electrodes modified with carbon nanohorns for the detection of Cr(VI). Furthermore, the reported studies suggest the use of a difficult fabrication process for sensors with multiple modification steps, or in some cases, complex synthesis of the modifying agents [17,27,28,29], or the use of sensors that are not environmentally friendly [24]. It is also been observed that some sensors based on carbon nanomaterials exhibit linear ranges that start above those reported in this work, or in some cases, show higher LODs [26,27,29], which could represent a serious disadvantage compared to those obtained in this work.
To the best of our knowledge, the use of carbon nanohorns for chromium determination has not been previously reported. In this work, a simple, low-cost, and fast analytical methodology was developed for the direct determination of Cr(VI) in aqueous matrices using AdCSV with SWCNH/GCE. The sensor was characterized via cyclic voltammetry (CV) and field emission scanning electron microscopy (FE-SEM). Chemical and electrochemical parameters (HCl concentration, volume of the SWCNH suspension, Eacc, and tacc) were optimized to achieve the best reduction in the voltammetric signal for Cr(VI). With the optimized parameters, the methodology was validated, demonstrating an excellent linear range and a low LOD, in contrast to those of other sensors fabricated from carbon nanomaterials. Finally, the methodology was successfully applied for the determination of Cr(VI) in tap water samples, yielding statistically comparable results to those obtained using atomic absorption spectroscopy.
2. Materials and Methods
2.1. Materials and Solutions
All reagents used were of analytical grade, including single-walled carbon nanohorns (SWCNH), N,N-Dimethylformamide (DMF), hydrochloric acid (HCl), potassium chloride (KCl), potassium ferricyanide trihydrate (K3[Fe(CN)6]·3H2O), potassium ferrocyanide trihydrate (K4[Fe(CN)6]·3H2O), potassium chloride (KCl) from Merck (Darmstadt, Germany), and potassium chromate (K2CrO4) from Fluka Analytical (Neu-Ulm, Germany). Solutions were prepared using ultrapure water obtained from a Milli-Q system (Burlington, MA, USA).
2.2. Apparatus
AdCSV and CV measurements were performed on a CH instruments 619E potentiostat (Austin, TX, USA). The measurements utilized a three-electrode system, with a modified glassy carbon electrode (SWCNH/GCE) as the working electrode, Ag/AgCl (3.0 mol L−1 KCl) as the reference electrode, and a Pt wire as the auxiliary electrode. Scanning electron microscopy (SEM) images were obtained using FE-SEM (ThermoFisher, Waltham, MA, USA, Quanta FEG 250). FAAS studies were performed on Analytik Jena (novAA 350, Jena, Germany).
2.3. Methods
2.3.1. Preparation of SWCNH/GCE
A GCE was polished on a porous surface with 0.05 µm alumina and ultra-pure water. From a suspension of SWCNH (1.0 mg L−1) prepared in DMF and sonicated for 45 min, a 6.0 µL aliquot was taken and drop-casted on the electrode surface. The solvent was evaporated using infrared light for 60 min, and then the electrode was used to perform the corresponding measurements. The SWCNH/GCE surface was characterized via FE-SEM and CV using a redox probe (1.0 mmol L−1 [Fe(CN)6]3−/4−).
2.3.2. Analytical Procedure for the Determination of Cr(VI)
The square-wave AdCSV technique was used for the determination of Cr(VI). Solutions of Cr(VI) were prepared in 0.15 mol L−1 of HCl as the supporting electrolyte. An accumulation potential (Eacc) of 0.8 V was applied with an accumulation time (tacc) of 240 s. Cathodic scanning was performed in a potential range from 0.8 V to 0 V using the following parameters: potential increments of 4 mV, an amplitude of 25 mV, and a frequency of 15 Hz. All measurements were conducted at room temperature using SWCNH/GCE.
2.4. Sample Treatment
The tap water sample was collected in Santiago, Chile. It was filtered and spiked with 0.30 mg L−1 of Cr(VI) in 0.15 mol L−1 of HCl and used to prepare solutions that were measured in triplicate via the AdCSV technique using SWCNH/GCE. In addition, the spiked tap water samples were analyzed via FAAS.
3. Results and Discussion
3.1. Characterization of SWCNH and GC/SWCNH by SEM
Figure 1A shows the characteristic spherical assembly of SWCNH with an average diameter of 87 nm (Figure S1). The elemental analysis (from EDX) (Figure 1B) shows the predominant presence of C, without metallic impurities, since its synthesis was performed in the absence of metallic catalysts. SWCNH/GCE is presented in Figure 1C, showing the incorporation of SWCNH on the GC electrode surface with a relatively uniform distribution. As in the previous case, the EDX study showed that the incorporation of the nanomaterial is carried out without contaminating the electrode surface.
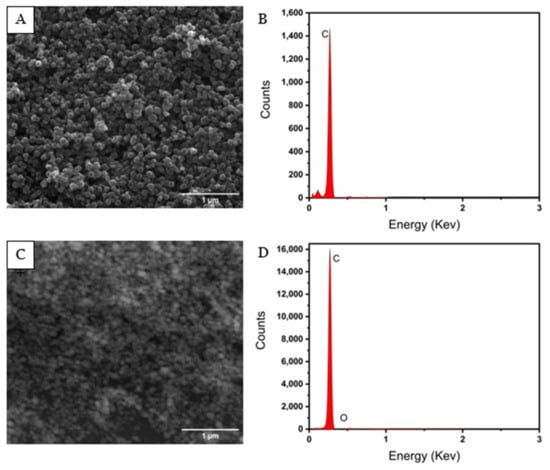
Figure 1.
FE-SEM images of (A) SWCNH and (C) SWCNH/GCE. EDX images of (B) SWCNH and (D) SWCNH/GCE.
3.2. Electrochemical Characterization of the GCE and SWCNH/GCE
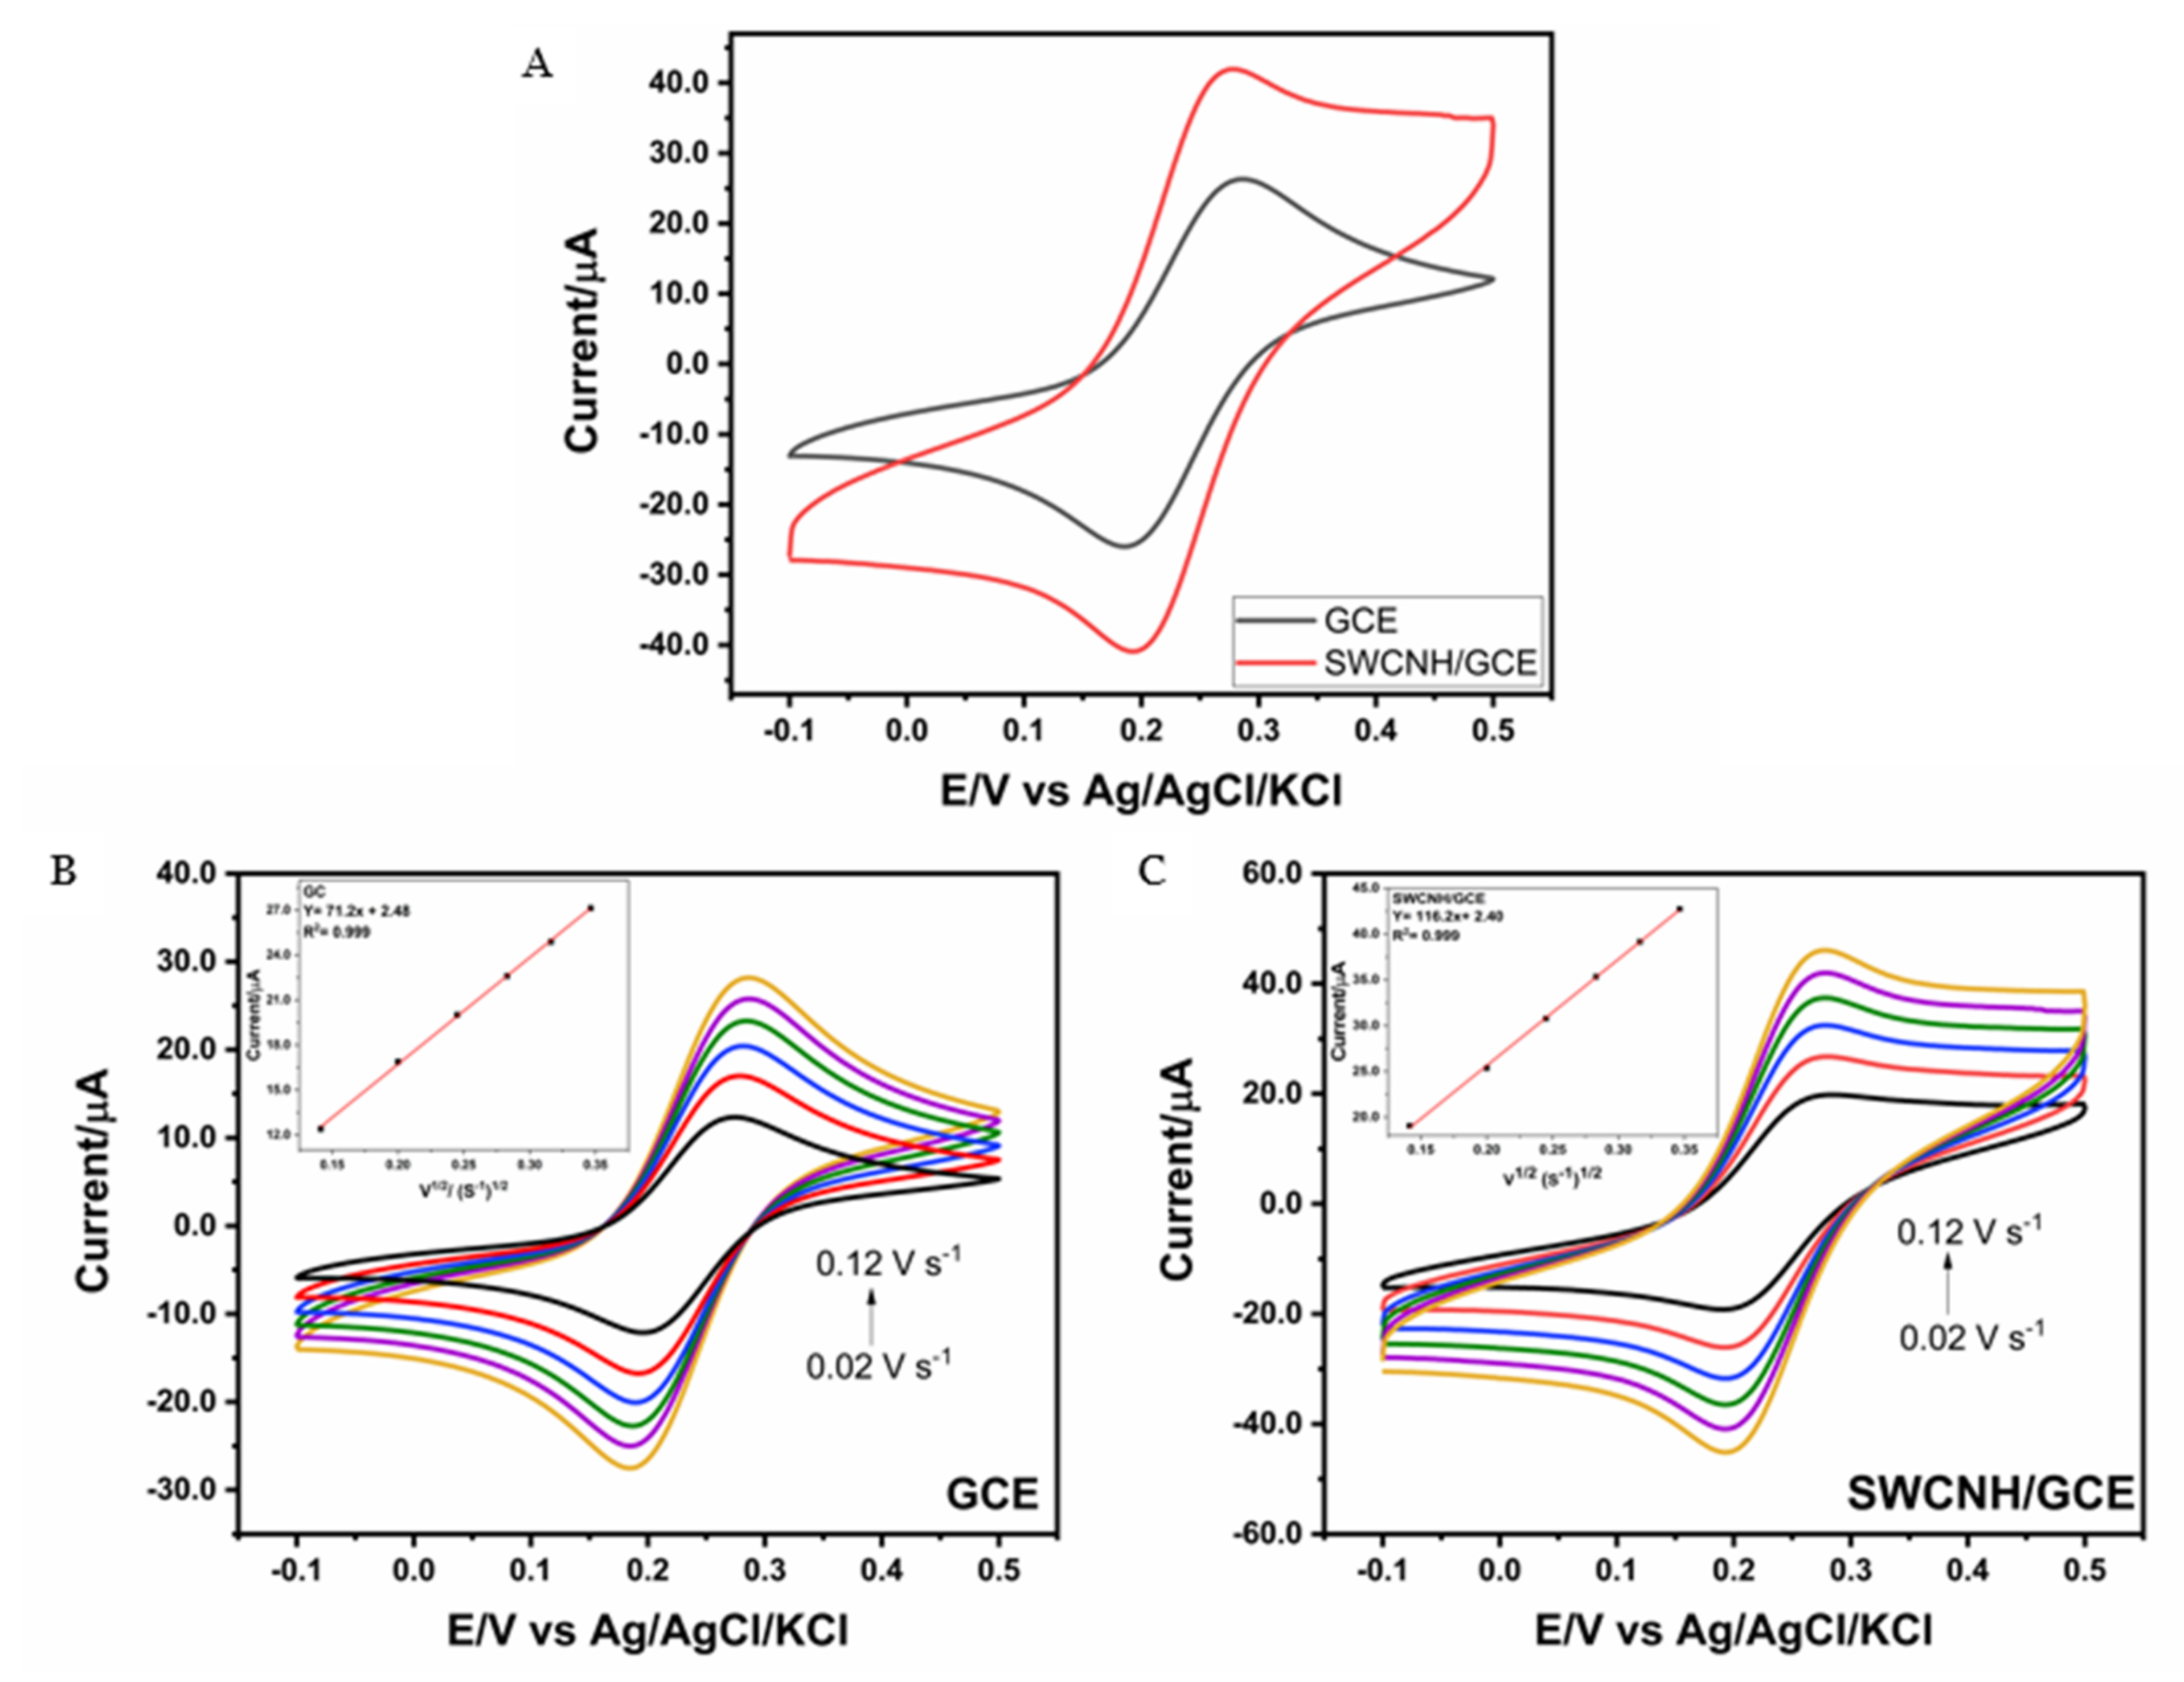
Figure 2A shows the CVs obtained by using 1.0 mmol L−1 of an [Fe(CN)6]3−/4− redox probe at a scan rate of 0.1 V s−1 in a potential range from 0.5 to −0.1 V for GCE and SWCNH/GCE. A 1.5-fold increase in the cathodic and anodic peak currents was observed when using SWCNH/GCE as compared to those of GCE, which can be attributed to the increase in the number of active sites. Additionally, Figure 2 shows the CVs for GCE (Figure 2B) and SWCNH/GCE (Figure 2C) in 1.0 mmol L−1 of [Fe(CN)6]3−/4− at different scan rates (from 0.02 to 0.12 V s−1). In the inset, the curves of current versus the square root of the scan rate (ν1/2) are displayed, which present linear behavior (R2 > 0.999), indicating that the process is controlled by diffusion. In this way, from the slope of these curves, it is possible to determine the electroactive area (A) using the Randles–Sevcik equation, Equation (1) [30], where D is the diffusion coefficient (7.6 × 10⁻⁶ cm2 s−1), Co is the concentration of the redox probe (1.0 μmol mL−1), n is the number of electrons transferred (n = 1), and ν is the scan rate:
Ip = 2.69 × 10⁵ nAC0 D1/2 ν1/2

Figure 2.
(A) Cyclic voltammograms of GCE and SWCNH/GCE in presence of 1.0 mmol L−1 [Fe(CN)6]3−/4− at 0.1 V s−1. (B,C) Cyclic voltammograms of GCE and SWCNH/GCE at different scan rates (0.02–0.12 V s−1) in [Fe(CN)6]3−/4− (1.0 mmol L−1) (inset: current vs. square root of scan rate).
Using (1), the electroactive area for both electrodes was calculated using three replicates. Values of 0.10 ± 0.01 cm2 for GCE and 0.16 ± 0.01 cm2 for SWCNH/GCE were obtained. This increase in the electroactive area is attributed to the presence of SWCNHs, which possess a large surface area and, therefore, improve the electroactivity of the modified electrode.
3.3. Electrochemical Determination of Cr(VI)
3.3.1. Supporting Electrolyte Study
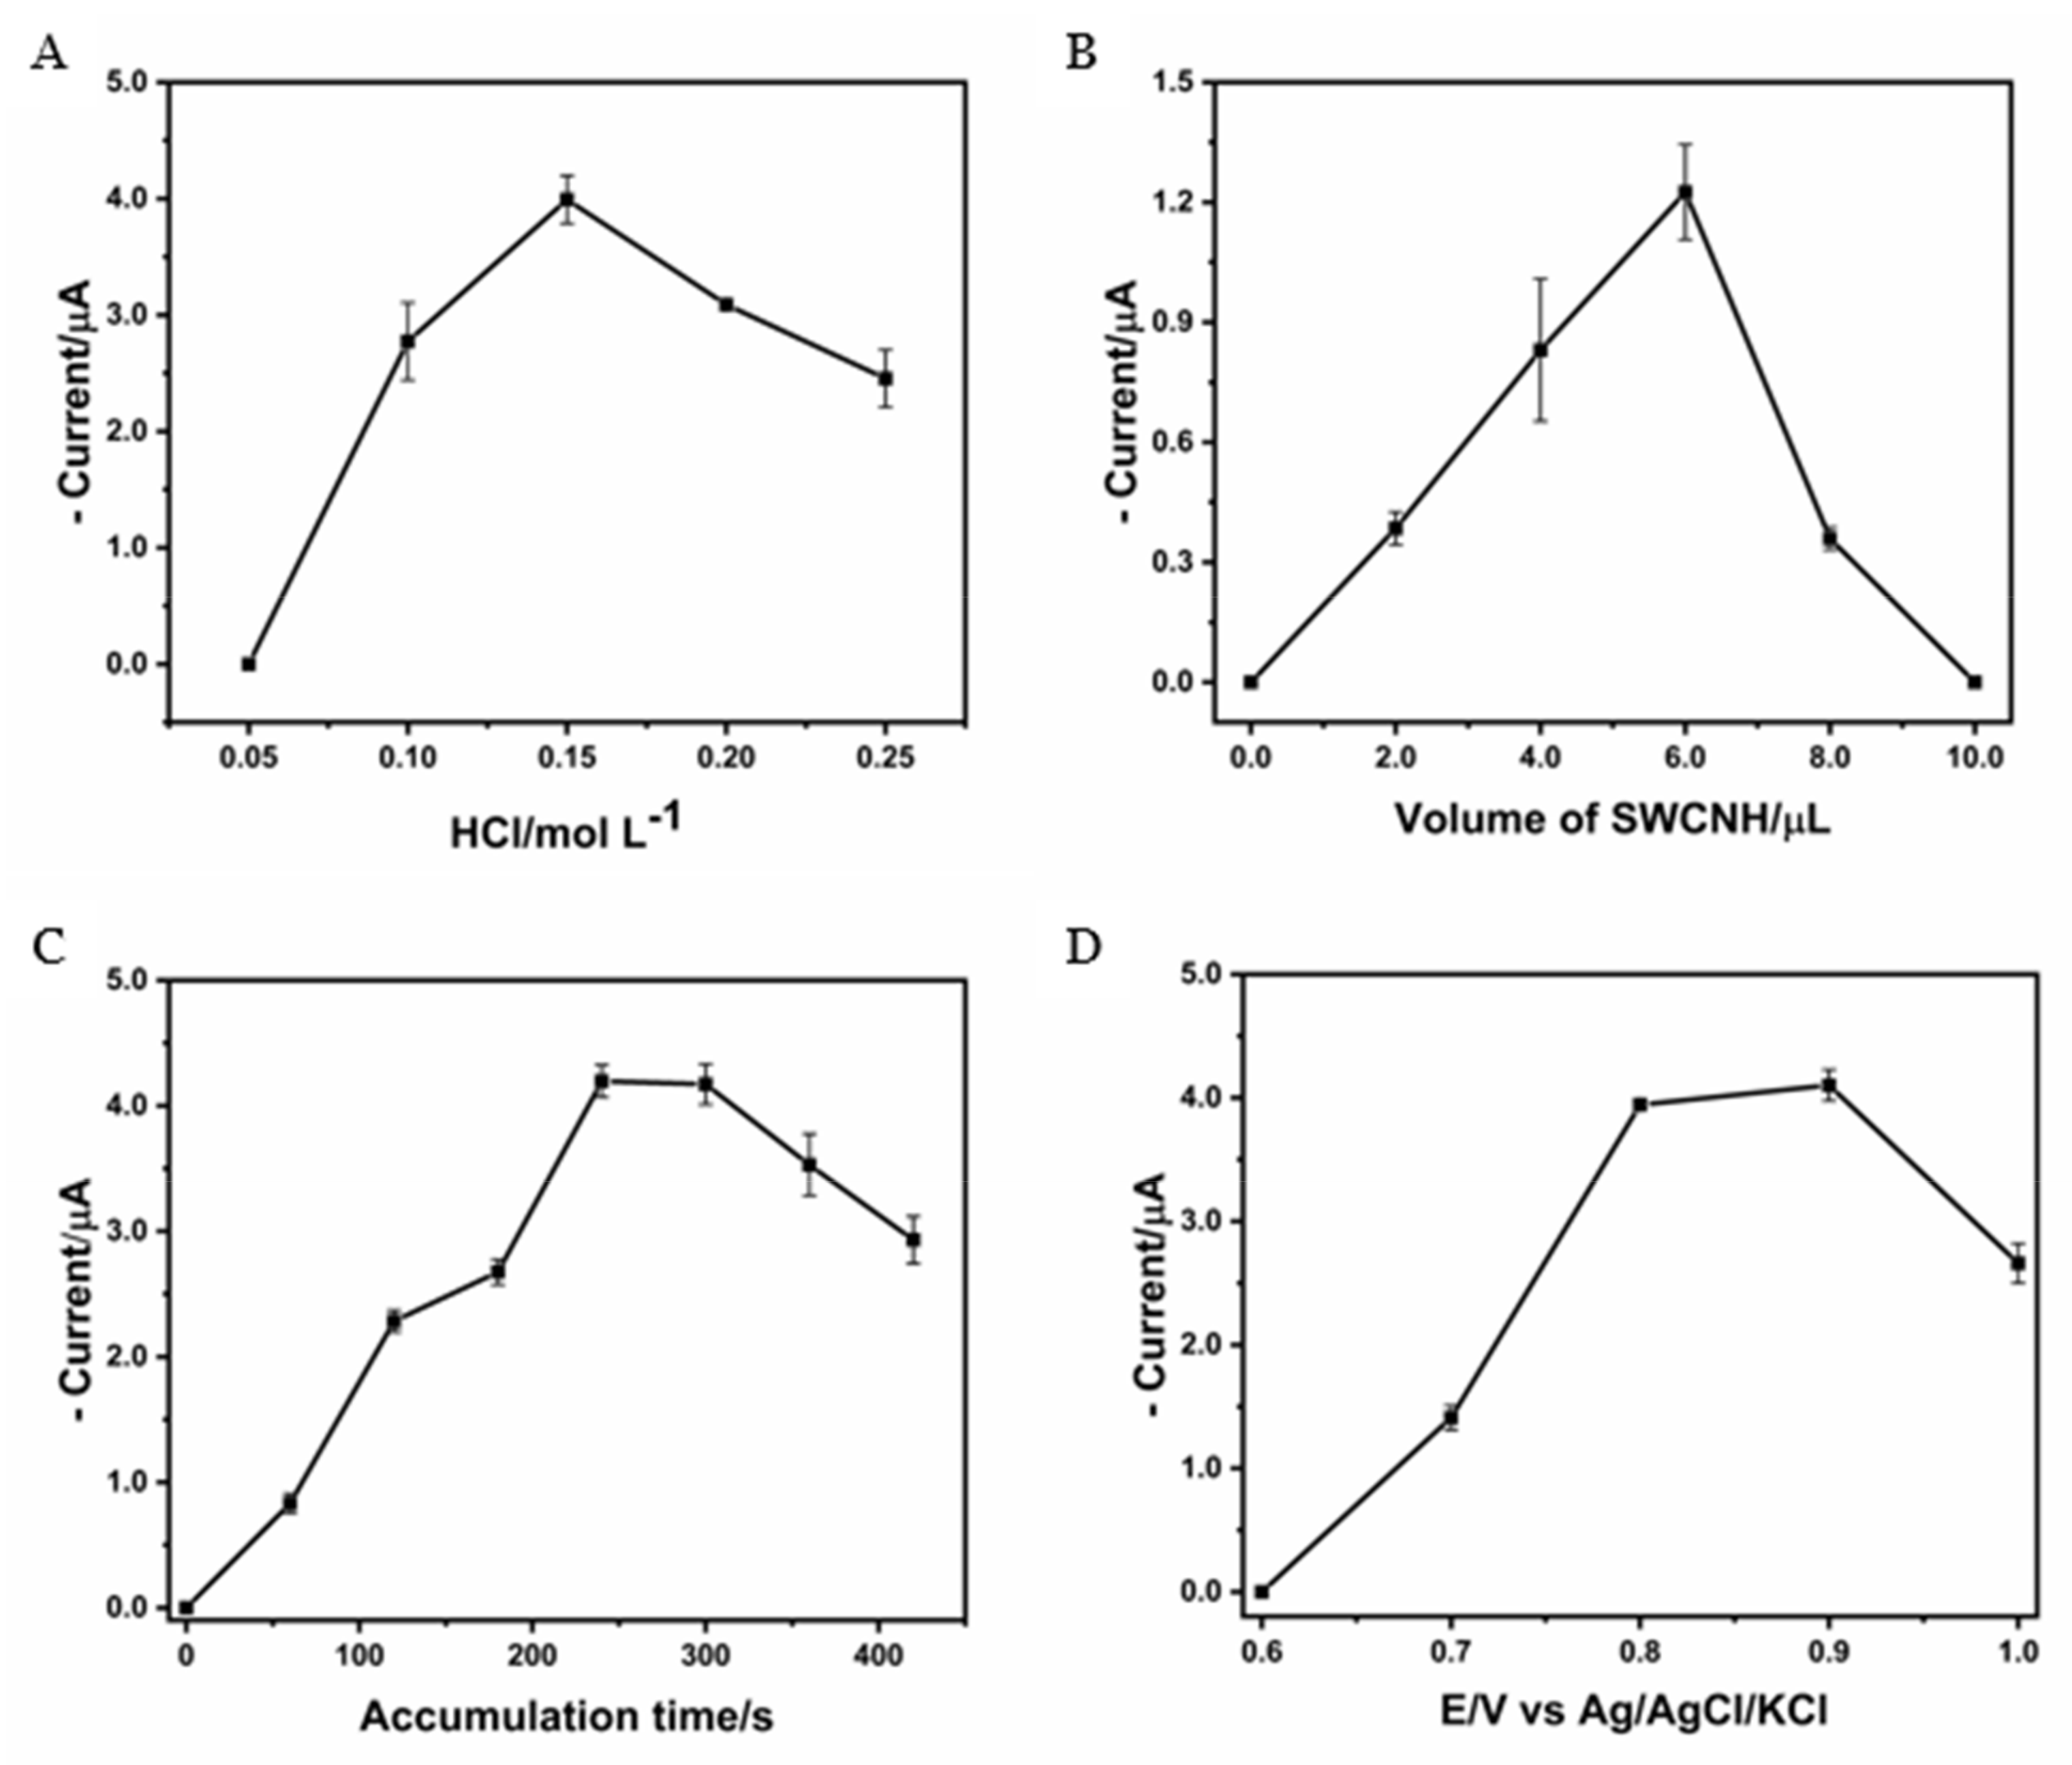
The chemical equilibrium of Cr(VI) is dependent upon the pH of the medium. At low Cr concentrations and at an acidic pH, the dominant species are HCrO4− and Cr2O72−, of which the electrochemically active species is the HCrO4− anion [31]. Sasithorn [17], Chavez-Lara [32], and Sadeghi [29], among others, have reported the use of HCl as a supporting electrolyte for the determination of Cr(VI). The use of HCl results in the formation of both HCrO4− and CrO3Cl− complexes. The latter has no electrochemical activity, and thus it is crucial to assess the impact of varying HCl concentrations on the formation of HCrO4−. The effect of HCl concentration on the current intensity obtained for a reduction of 100 µg L−1 Cr(VI) was evaluated in the range of 0.05 to 0.25 mol L−1 with Eacc 0.8 V and tacc 240 s (Figure 3A). An increase in current was observed as the HCl concentration increased up to 0.15 mol L−1, gradually decreasing at higher concentrations. When the HCl concentration was 0.15 mol L−1 the dominant species in the solution was HCrO4−, forming less than 10% of the chromium chloride complexes [31]. Accordingly, 0.15 mol L−1 of HCl was selected as the optimal concentration for subsequent investigation.

Figure 3.
Current plots as a function of (A) HCl concentration, (B) SWCNH suspension volume, (C) accumulation time, and (D) accumulation potential, using SWCNH/GCE.
3.3.2. Effect of the Volume of SWCNH Suspension
The effect of the aliquot volume of the SWCNH suspension (1.0 mg mL−1) for the modification of the GCE on the cathodic peak current was evaluated using 100 µg L−1 of Cr (VI) and aliquot volumes between 0 and 10.0 µL of the SWCNH suspension (Eacc 0.8 V, tacc 120 s) (Figure 3B). An increase in cathodic current was observed with the increasing SWCNH aliquot volume, reaching a maximum at 6.0 µL and decreasing at higher volumes. When using an aliquot of 6.0 µL of SWCNH, better coating of the GCE surface was achieved, causing an increase in the active sites, whereas at higher volumes, multilayers were generated on the electrode surface, hindering electronic transfer and decreasing the current response. For this reason, an aliquot of 6.0 µL of the SWCNH suspension was used to fabricate the SWCNH/GCE.
3.3.3. Effect of Potential and Time of Accumulation
The effect of tacc on the cathodic peak current using 100 µg L−1 of Cr (VI) is shown in Figure 3C, with tacc ranging from 0 to 420 s and an Eacc of 0.8 V, as previously reported [17,32]. An increase in the reduction current was observed as the tacc increases, reaching a maximum at 240 s. After this time, no further increase was observed, which is attributed to the saturation of the active sites. The optimal tacc was selected to be 240 s to measure concentrations lower than 100 µg L−1 of Cr.
The Eacc was evaluated between 0.6 and 1.0 V using 100 µg L−1 of Cr(VI) and a tacc of 240 s (Figure 3D). An increase in the reduction current was observed as the Eacc increased from 0.6 V to 0.8 V and decreased thereafter. Different authors such as Chavez-Lara et al. [32] and Phetlada Sanchayanukun et al. [17] explain that at 0.8 V (vs. Ag/AgCl), Cr(VI) adsorption occurs without electrochemical reduction, and upon the application of cathodic scanning, Cr(VI) to Cr(III) reduction occurs, as shown in (2) [32]. Therefore, 0.8 V was chosen as the optimum Eacc.
3.3.4. Voltammetric Response of Cr(VI)
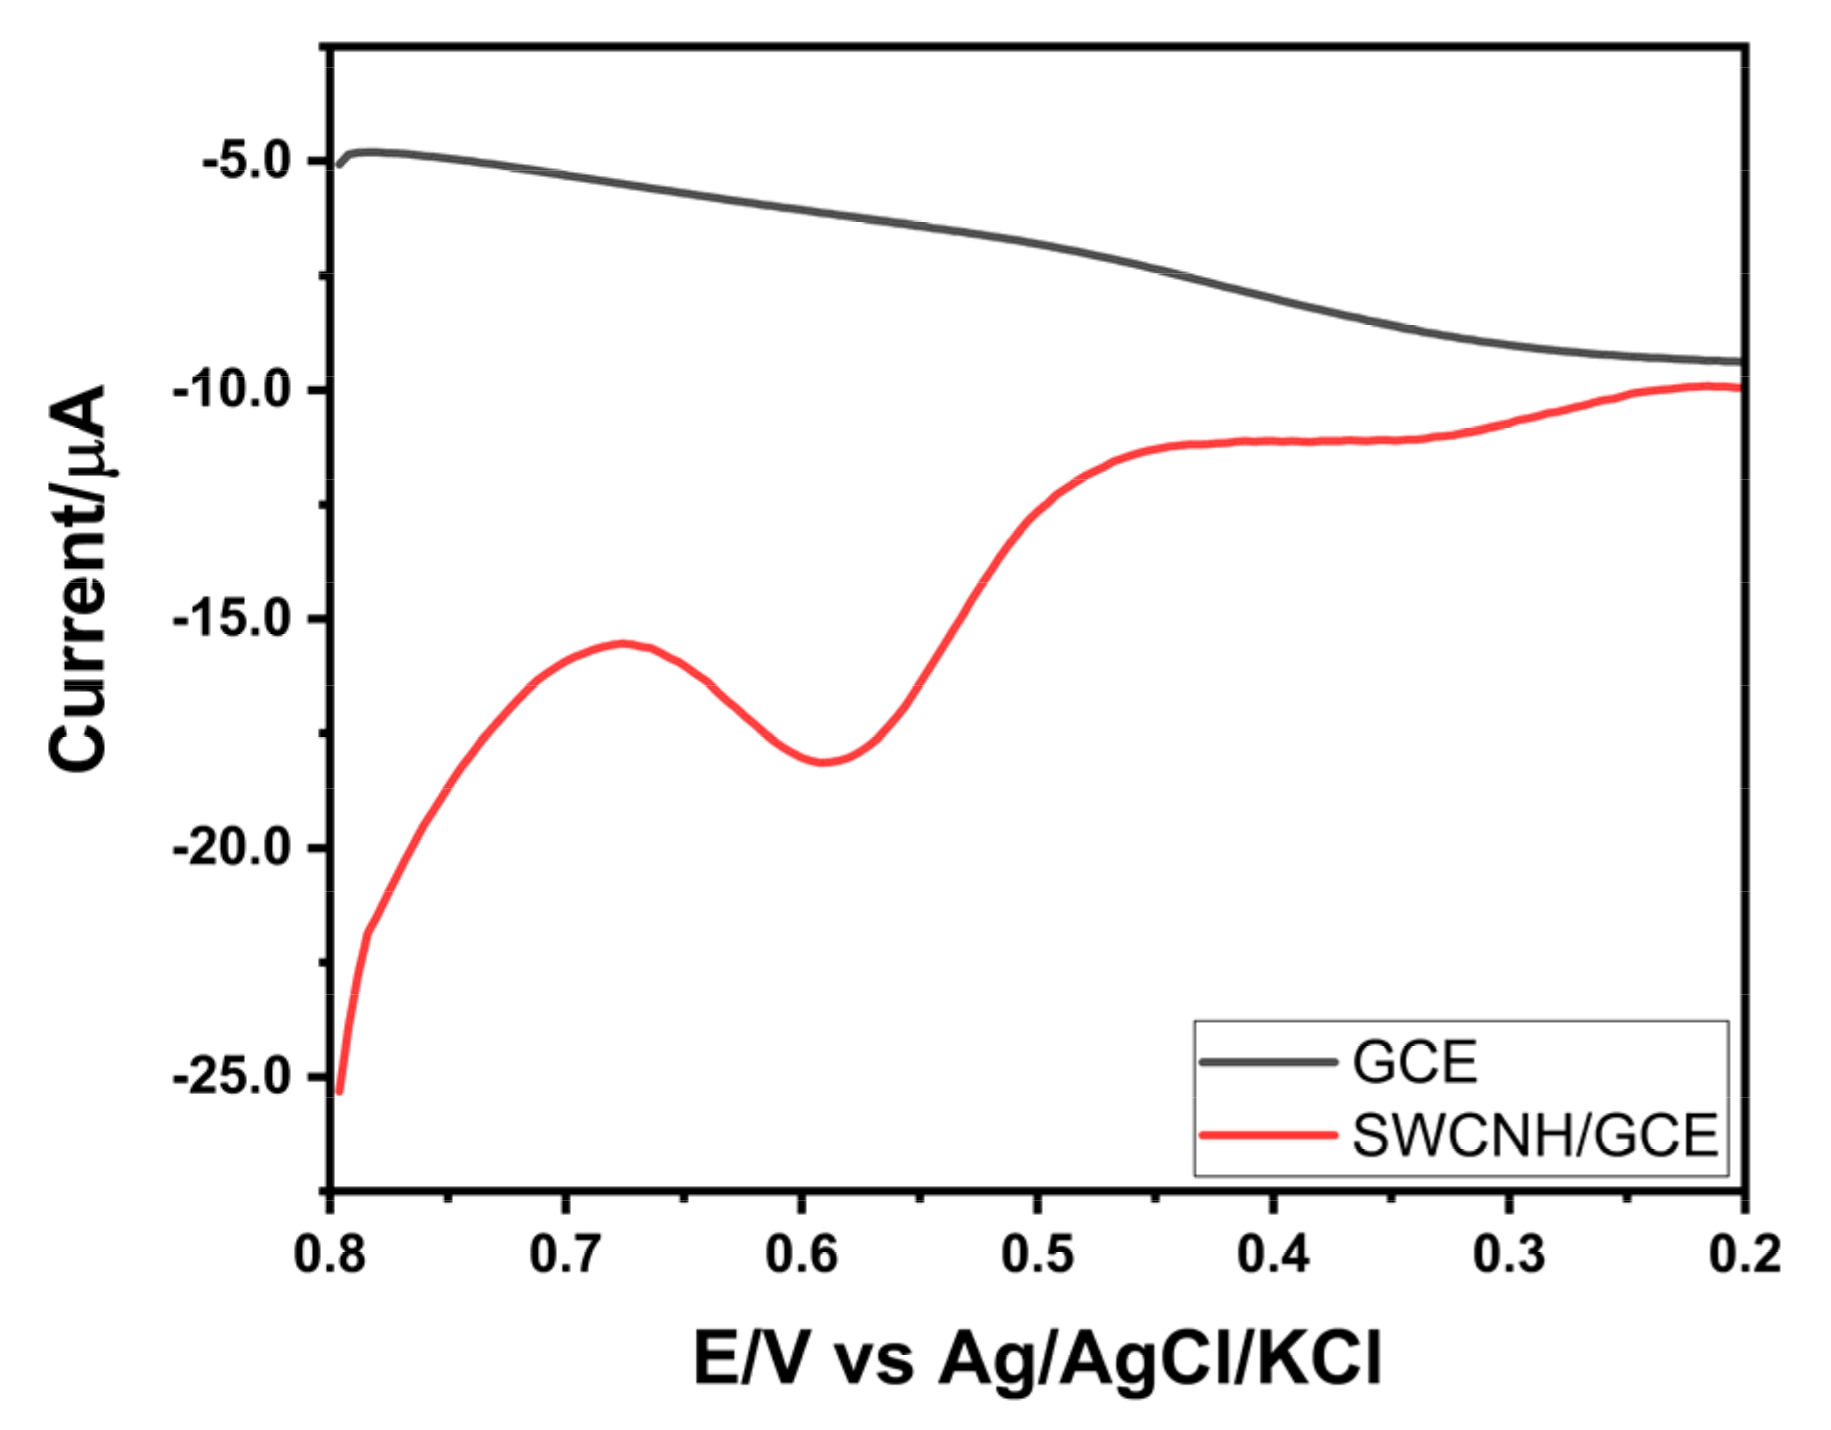
Using the optimal parameters, the voltammetric response of 100 µg L−1 of Cr(VI) solution obtained using SWCNH/GCE was compared with that of the GCE using AdCSV (Figure 4). The results indicate that the SWCNH/GCE provides a current signal of −4.40 µA in response to the presence of Cr(VI) at 0.590 V, while no signal is observed with the bare GCE.

Figure 4.
Electrochemical behavior of 100 µg L−1 of Cr(VI) in GCE and SWCNH/GCE, using the optimized parameters (HCl 0.15 mol L−1, Eacc 0.8 V, and tacc 240 s).
3.4. Analytical Validation and Applications
3.4.1. Calibration Curve, Limit of Detection, and Quantification
The analytical methodology was validated through a study of the linear range, the limit of detection and quantification (LOD and LOQ), reproducibility, repeatability, selectivity, and accuracy, using the SWCNH/GCE at the optimal parameters: HCl 0.15 mol L−1, Eacc 0.8 V, and tacc 240 s. Once validated, the method was applied for the determination of Cr(VI) in tap water samples.
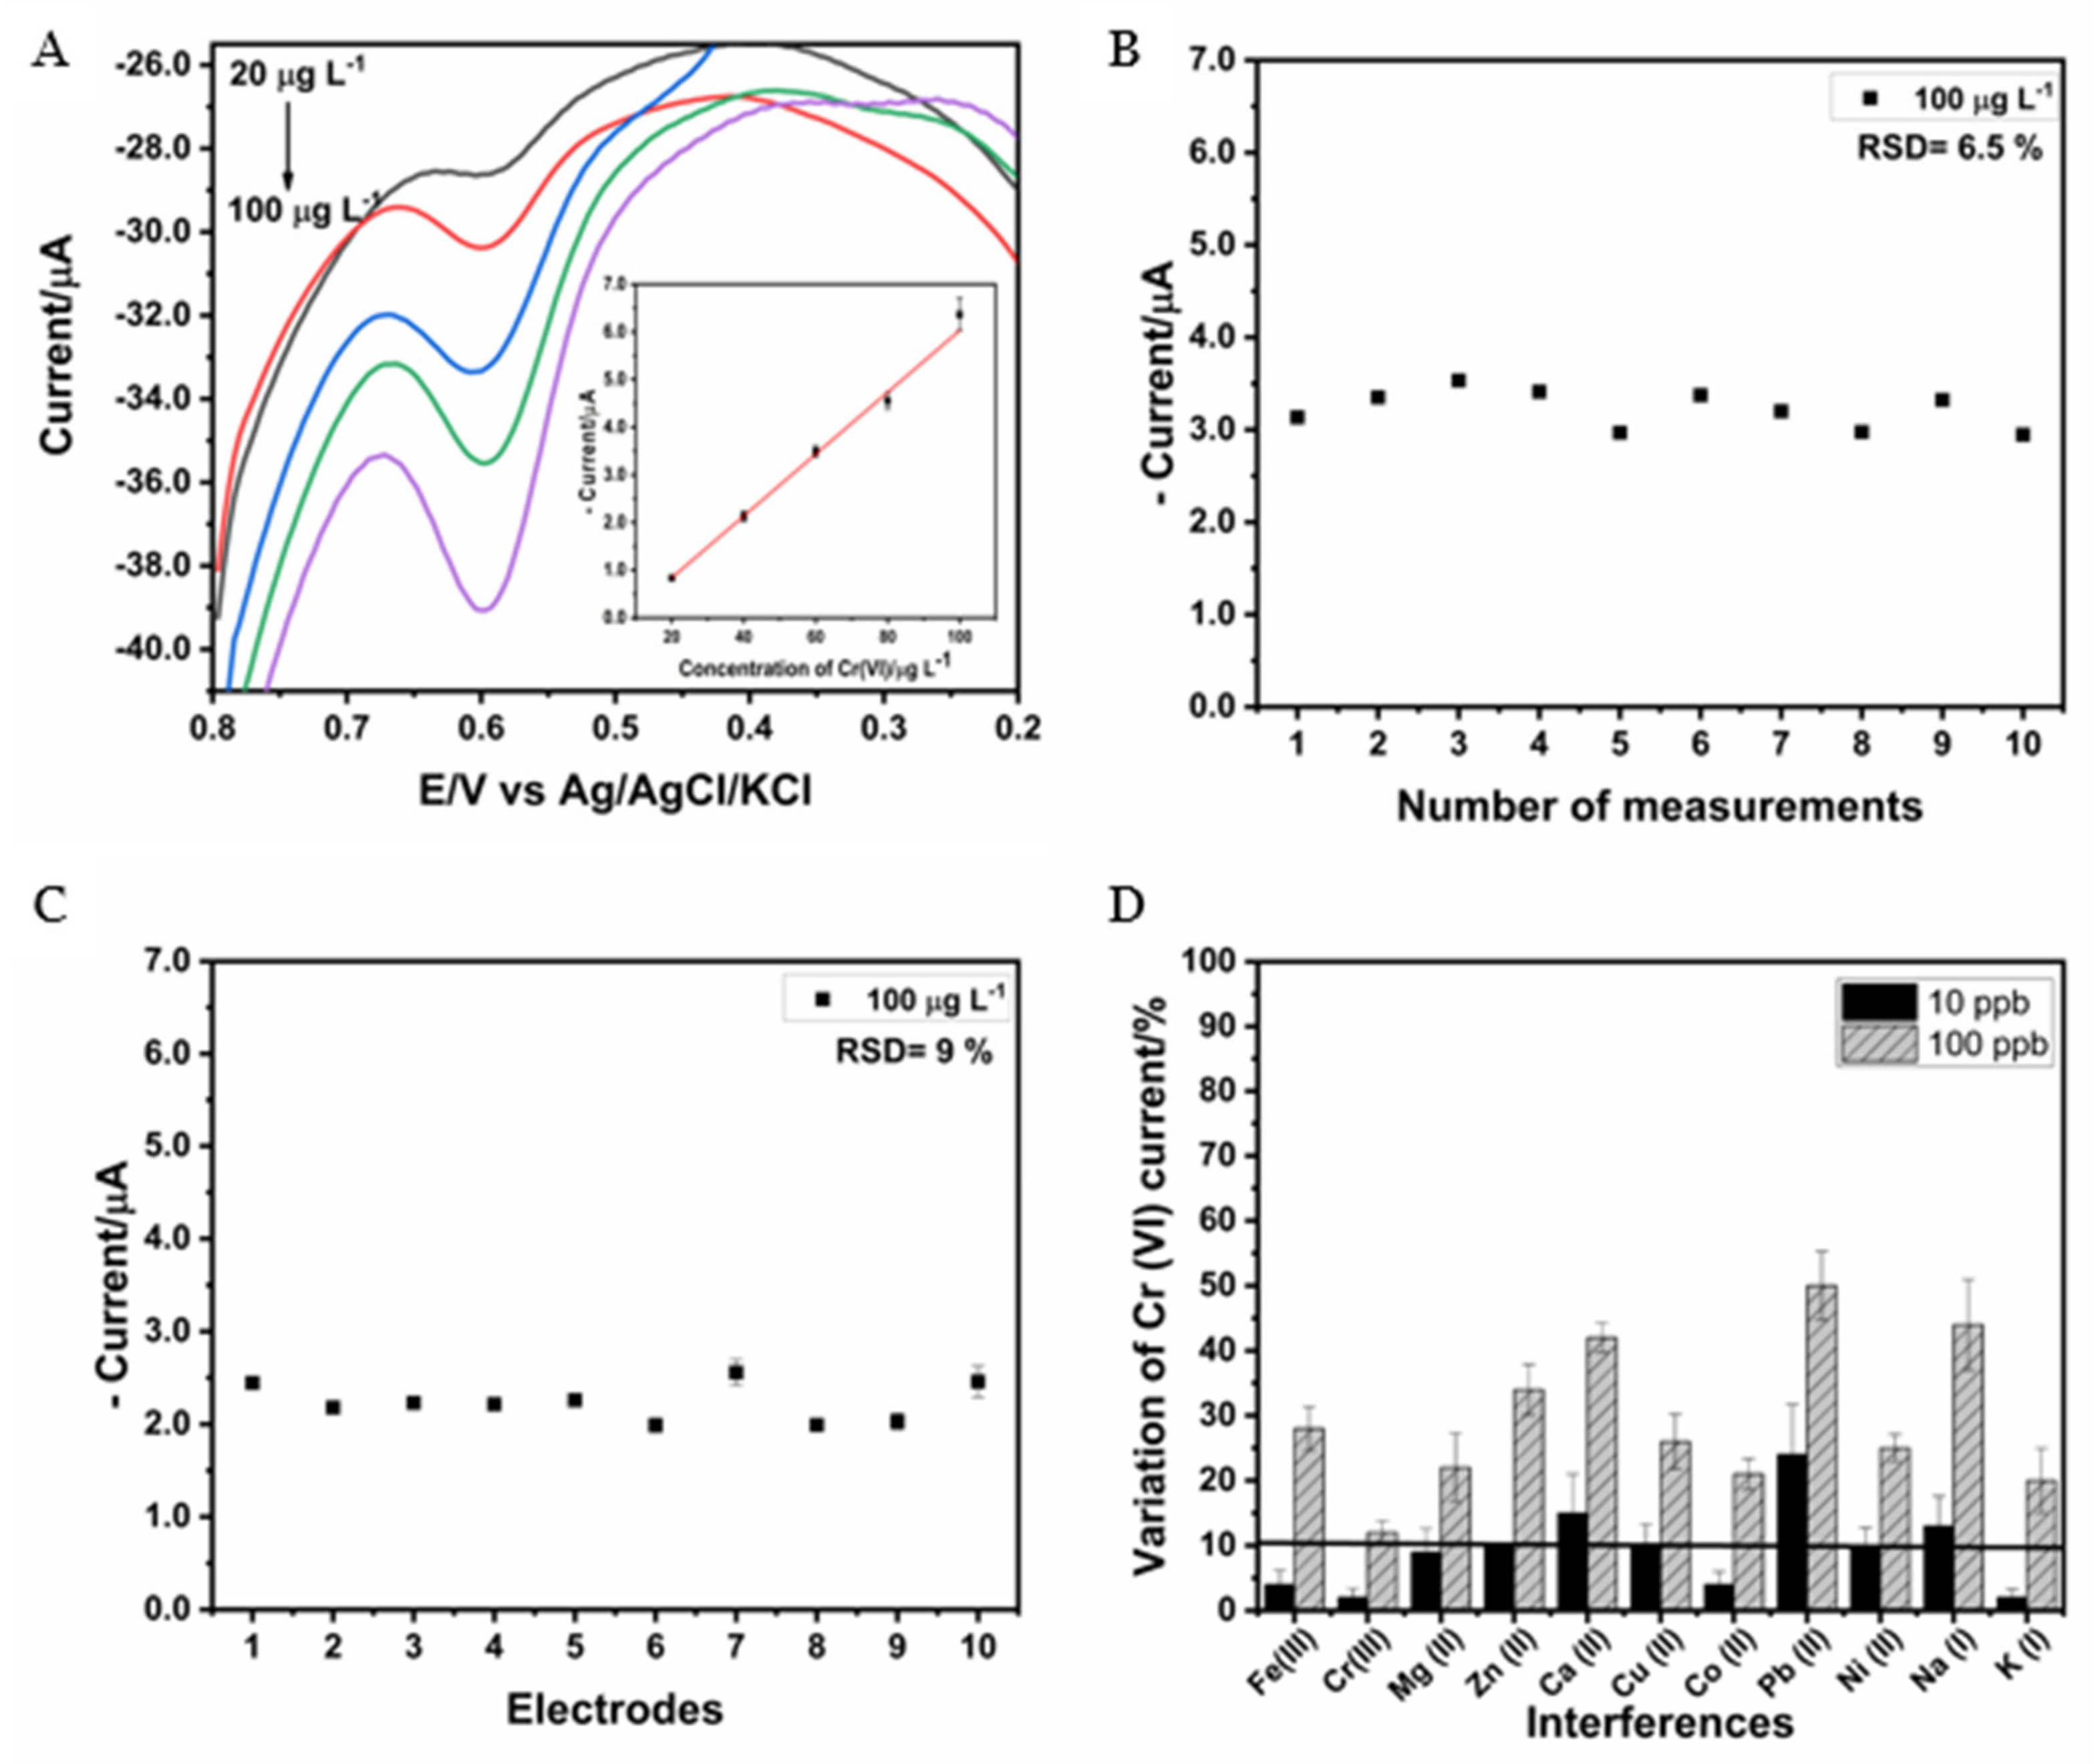
Figure 5A presents voltammograms and a calibration curve, which shows a linear increase in the cathodic peak current with increasing Cr(VI) concentration. A linear range between 20 and 100 µg L−1 Cr(VI) was obtained, with a straight-line equation of y = 0.0649x − 0.461 and a correlation coefficient of 0.999. The LOD and LOQ were calculated to be 3 and 10 times the standard deviation of the calibration curve from the slope [33,34], giving values of 3.5 µg L−1 and 11.6 µg L−1, respectively.
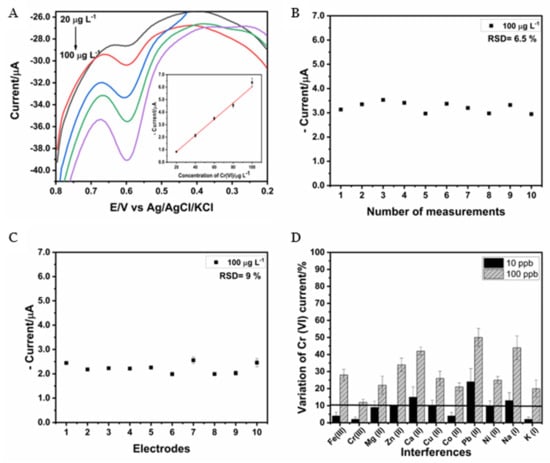
Figure 5.
(A) Voltammograms and calibration curve for Cr(VI), (B) repeatability study, (C) reproducibility analysis, and (D) effect of interferents using SWCNH/GCE under optimized conditions. HCl 0.15 mol L−1, Eacc 0.8 V, and tacc 240 s.
Table 1 presents the linear ranges and LODs from some of the reported works using carbon-nanomaterial-modified working electrodes for the determination of Cr(VI) using different voltammetric techniques. In most of the cases, complex electrode fabrication with several modification steps or the use of complex syntheses to obtain the modifier [27,28,29,32,35] is reported, where these proposed modifications do not provide linear ranges and/or LODs [26,27,28,29,36] better than those obtained in this work. In this context, it is possible to indicate that the SWCNH/GCE is highly competitive due to the simplicity of its fabrication, with analysis and LOD ranges similar to those obtained with electrodes based on carbon materials of more complex fabrication.

Table 1.
Comparison of the analytical performance of the SWCNH/GCE with some of the electrodes reported in the literature modified with carbon nanocomposites for the detection of Cr(VI) using electrochemical techniques.
3.4.2. Repeatability, Reproducibility, and Effect of Interferents
Repeatability was evaluated by studying the current intensity obtained with the same electrode when analyzing 10 times the current of the reduction peak for 100 µg L−1 of Cr(VI), obtaining a relative standard deviation (RSD) of 6.5%, which indicates that the electrode is stable in the range of the measurements performed (Figure 5B). The reproducibility was studied by means of the evaluation of the current intensity obtained for 10 different electrodes. These measurements present an RSD of 9.0%, which indicates that the developed sensor presents good reproducibility (Figure 5C). The findings suggest that the SWCNH/GCE can be utilized for a minimum of 10 consecutive times without compromising the intensity of the current obtained, and it is reproducible for the determination of Cr(VI).
On the other hand, in order to investigate whether other species present in a solution affect the intensity of the cathodic peak obtained for the determination of Cr(VI), selectivity was evaluated. The possible interference of some cations was studied individually via the addition of 10 and 100 µg L−1 of Fe(III), Cr(III), Mg(II), Zn(II), Ca(II), Cu(II), Co(II), Pb(II), Ni(II), Na(I), and K(I) to a solution of 50 µg L−1 of Cr(VI). The effect of the interferents was evaluated by calculating the variation in the current intensity, defining an error less than or equal to 10% as the tolerance limit [17]. Figure 5D shows that, for most of the cases, at low concentrations of the interferents (10 µg L−1), the signal obtained for Cr(VI) was not significantly modified, with a variation in the current greater than 10% only when Ca, Pb, and Na were used. However, when a concentration of 100 µg L−1 was used, a variation in the current greater than 10% was observed in all cases. The effect of the interferents on the Cr(VI) signal could be attributed to the competition for active sites, as a decrease in current intensity was observed. Cr(VI) quantification can be performed using the standard addition method, so the effect on the Cr(VI) signal caused by the presence of the different cations studied will be compensated for by successive additions of Cr(VI) standards, allowing its quantification even in the presence of interfering species [17,20].
3.4.3. Accuracy
The accuracy of the method was evaluated by determining the amount of Cr(VI) in the spiked tap water samples using the standard addition method. The tap water sample was spiked with a known concentration of the Cr(VI) standard, from which 10 mL of a solution of 20.0 μg L−1 and 30.0 μg L−1 of Cr(VI) in 0.15 mol L−1 of HCl was prepared. Three independent analyses (n = 3) of both spiked tap water samples were performed using three SWCNH/GCE, obtaining recovery percentages of 105% and 110%, respectively, as shown in Table 2. According to Association of Official Analytical Chemists International (AOAC International) criteria, the proposed methodology is considered accurate for the determination of Cr(VI) in tap water samples, and it is possible to indicate that the signal obtained for Cr(VI) does not experience significant interferences due to the matrix effect.
Table 2.
Determination of Cr(VI) in tap water samples (n = 3) via AdCSV technique according to optimized methodology.
Therefore, the validation of the proposed analytical methodology indicates that the SWCNH/GCE can be used for the determination of Cr(VI) in real water samples.
3.4.4. Real Sample Analysis
Tap water samples were analyzed via AdCSV using the SWCNH/GCE and FAAS. In both techniques, the presence of Cr(VI) was not detected, probably because its concentration was below the LOD; therefore, the spiked tap water samples were analyzed. AdCSV analysis was performed in triplicate, using a different SWCNH/GCE each time and employing the standard addition method with optimized parameters (HCl 0.15 mol L−1, Eacc 0.8 V, and tacc 240 s). The results obtained were compared with those obtained using the FAAS technique.
In the analysis of the spiked tap water sample via AdCSV using the SWCNH/GCE and FAAS, concentrations of 33.0 ± 2.4 μg L−1 and 31.4 ± 0.7 μg L−1 of Cr(VI) were detected, respectively (Table 3). The analysis of the results using Student’s t-test [17,37] (for the comparison of replicate measurements) shows that there is no significant statistical difference between the measurements obtained via both methods since the calculated t-value was less than the critical t-value (4.3) for two degrees of freedom (p = 0.05). This allows us to conclude that it is possible to use the SWCNH/GCE in AdCSV technique for the accurate determination of the amount of Cr(VI) in water samples and that there is no significant interference of the matrix effect when analyzing the samples. The results obtained indicate that the developed method is accurate and reliable for the determination of Cr(VI) in real water samples.
Table 3.
Determination of Cr(VI) in spiked tap water (n = 3) via FAAS and AdCSV.
The developed method proposes the use of a sensitive electrode of simple manufacture, without the need to use complexing substances for the detection of Cr(VI), obtaining competitive detection limits comparable to those reported in other works (Table 1).
4. Conclusions
In this work, it was possible to successfully implement a validated methodology for the determination of Cr(VI) via AdCSV in tap water samples, using a working electrode fabricated in a simple way using the drop coating technique. The SWCNH/GCE surface was characterized via SEM, showing the uniform incorporation of the nanomaterial on the electrode surface and the characteristic spherical assembly of SWCNH. In addition, the calculation of the electroactive area via CV showed an increase of 60% as compared to that of the GCE. The electrochemical parameters were optimized, obtaining a better current response when using 0.15 mol L−1 of HCl as the supporting electrolyte and Eacc and tacc values of 0.8 V and 240 s, respectively. Finally, validation of the analytical methodology was performed, obtaining a linear range between 20 and 100 µg L−1, an LOD of 3.5 µg L−1, and an LOQ of 11.6 µg L−1 with good accuracy (105 and 110% recovery). Real samples were analyzed using AdCSV with the optimal parameters via standard addition method, and the results were compared with those of FASS, obtaining statistically comparable results. Thus, it was demonstrated that the SWCNH/GCE could be applied in the determination of the amount of Cr(VI) via AdCSV in real samples in a precise and accurate way.
Supplementary Materials
The following supporting information can be downloaded at https://www.mdpi.com/article/10.3390/nano14171465/s1: Figure S1: Particle size histograms for SWCNHs (n = 470) obtained from Figure 1A.
Author Contributions
Conceptualization, F.L., M.J.A. and R.S.; methodology, F.L.; validation, F.L.; formal analysis, F.L.; investigation, F.L., B.P., A.P.d.l.V. and J.P. (Johisner Penagos); resources, F.L., R.S. and J.M.D.-C.; data curation, F.L.; writing—original draft preparation, F.L.; writing—review and editing, J.P. (Jaime Pizarro), N.S., J.M.D.-C., M.J.A. and R.S.; visualization, F.L. and A.P.d.l.V.; supervision, N.S., J.M.D.-C., M.J.A. and R.S.; project administration, F.L. and R.S.; funding acquisition, F.L. and R.S. All authors have read and agreed to the published version of the manuscript.
Funding
This research was funded by FONDECYT grant project 1230628 and ANID (2019-21191331).
Data Availability Statement
The data are presented within the article.
Acknowledgments
We thank USA2055_DICYT of USACH, FONDECYT 1230628 (R.S.) and Scholarship Program/Doctorado becas Nacionales 2019—21191331 (F.L.) for their financial support. Millennium Institute on Green Ammonia as Energy Vector—MIGA (ICN2021_023) is supported by the Millennium Scientific Initiative of the Ministry of Science, Technology, Knowledge, and Innovation (Chile) (M.J.A. and J.P.). FONDECYT INICIACION N° 11230219, ANID Subvención a la Instalación en la Academia 2022 (SIA85220089) (J.P.). PID2022-136709OB-C22 is funded by AEI/10.13039/501100011033/Unión Europea Next GenerationEU/PRTR and the Generalitat of Catalunya (project 2021 SGR 00006) (J.M.D.-C. and N.S.).
Conflicts of Interest
The authors declare no conflicts of interest.
References
- Kravkaz Kuşçu, İ.S.; Kılıç Bayraktar, M.; Tunçer, B. Determination of Heavy Metal (Cr, Co, and Ni) Accumulation in Selected Vegetables Depending on Traffic Density. Water Air Soil Pollut. 2022, 233, 224. [Google Scholar] [CrossRef]
- Shin, D.Y.; Lee, S.M.; Jang, Y.; Lee, J.; Lee, C.M.; Cho, E.-M.; Seo, Y.R. Adverse Human Health Effects of Chromium by Exposure Route: A Comprehensive Review Based on Toxicogenomic Approach. Int. J. Mol. Sci. 2023, 24, 3410. [Google Scholar] [CrossRef] [PubMed]
- Briffa, J.; Sinagra, E.; Blundell, R. Heavy metal pollution in the environment and their toxicological effects on humans. Heliyon 2020, 6, e04691. [Google Scholar] [CrossRef] [PubMed]
- Pađan, J.; Marcinek, S.; Cindrić, A.-M.; Layglon, N.; Lenoble, V.; Salaün, P.; Garnier, C.; Omanović, D. Improved voltammetric methodology for chromium redox speciation in estuarine waters. Anal. Chim. Acta 2019, 1089, 40–47. [Google Scholar] [CrossRef] [PubMed]
- Nik, V.M.; Konoz, E.; Feizbakhsh, A.; Sharif, A.A.M. Simultaneous extraction of chromium and cadmium from bean samples by SrFe12O19@CTAB magnetic nanoparticles and determination by ETAAS: An experimental design methodology. Microchem. J. 2020, 159, 105588. [Google Scholar] [CrossRef]
- Barakat, M.A. New trends in removing heavy metals from industrial wastewater. Arab. J. Chem. 2011, 4, 361–377. [Google Scholar] [CrossRef]
- Tu, J.; Gan, Y.; Liang, T.; Wan, H.; Wang, P. A miniaturized electrochemical system for high sensitive determination of chromium(VI) by screen-printed carbon electrode with gold nanoparticles modification. Sens. Actuators B Chem. 2018, 272, 582–588. [Google Scholar] [CrossRef]
- Azeez, N.A.; Dash, S.S.; Gummadi, S.N.; Deepa, V.S. Nano-remediation of toxic heavy metal contamination: Hexavalent chromium [Cr(VI)]. Chemosphere 2021, 266, 129204. [Google Scholar] [CrossRef]
- Tuzen, M.; Elik, A.; Altunay, N. Ultrasound-assisted supramolecular solvent dispersive liquid-liquid microextraction for preconcentration and determination of Cr(VI) in waters and total chromium in beverages and vegetables. J. Mol. Liq. 2021, 329, 115556. [Google Scholar] [CrossRef]
- Askari, M.S.; Alamdari, P.; Chahardoli, S.; Afshari, A. Quantification of heavy metal pollution for environmental assessment of soil condition. Environ. Monit. Assess. 2020, 192, 162. [Google Scholar] [CrossRef]
- Ghorbani, Y.A.; Ghoreishi, S.M.; Ghani, M. Derived N-doped carbon through core-shell structured metal-organic frameworks as a novel sorbent for dispersive solid phase extraction of Cr(III) and Pb(II) from water samples followed by quantitation through flame atomic absorption spectrometry. Microchem. J. 2020, 155, 104786. [Google Scholar] [CrossRef]
- Li, K.; Yang, H.; Yuan, X.; Zhang, M. Recent developments of heavy metals detection in traditional Chinese medicine by atomic spectrometry. Microchem. J. 2021, 160, 105726. [Google Scholar] [CrossRef]
- Jiang, Y.; Li, C.; Song, H.; Wang, W. Deep learning model based on urban multi-source data for predicting heavy metals (Cu, Zn, Ni, Cr) in industrial sewer networks. J. Hazard. Mater. 2022, 432, 128732. [Google Scholar] [CrossRef] [PubMed]
- EPA. SW-846 Test Method 7199: Determination of Hexavalent Chromium in Drinking Water, Groundwater, and Industrial Wastewater Effluents by Ion Chromatography; Environmental Protection Agency (EPA): Washington, DC, USA, 1996. [Google Scholar]
- Berrabah, S.E.; Benchettara, A.; Smaili, F.; Tabti, S.; Benchettara, A. Electrodeposition of zinc hydroxide on carbon graphite electrode for electrochemical determination of trace copper in water samples using square wave anodic stripping voltammetry. Mater. Chem. Phys. 2022, 278, 125670. [Google Scholar] [CrossRef]
- Ouyang, R.; Zhang, W.; Zhou, S.; Xue, Z.-L.; Xu, L.; Gu, Y.; Miao, Y. Improved Bi film wrapped single walled carbon nanotubes for ultrasensitive electrochemical detection of trace Cr(VI). Electrochim. Acta 2013, 113, 686–693. [Google Scholar] [CrossRef]
- Sanchayanukun, P.; Muncharoen, S. Chitosan coated magnetite nanoparticle as a working electrode for determination of Cr(VI) using square wave adsorptive cathodic stripping voltammetry. Talanta 2020, 217, 121027. [Google Scholar] [CrossRef] [PubMed]
- Izadyar, A.; Al-Amoody, F.; Arachchige, D.R. Ion transfer stripping voltammetry to detect nanomolar concentrations of Cr (VI) in drinking water. J. Electroanal. Chem. 2016, 782, 43–49. [Google Scholar] [CrossRef]
- Thị Hue, N.; Van Hop, N.; Thai Long, H.; Hai Phong, N.; Uyen, T.H.; Quoc Hung, L.; Nhi Phuong, N. Determination of Chromium in Natural Water by Adsorptive Stripping Voltammetry Using In Situ Bismuth Film Electrode. J. Environ. Public Health 2020, 2020, 1347836. [Google Scholar] [CrossRef]
- Liendo, F.; de la Vega, A.P.; Jesus Aguirre, M.; Godoy, F.; Martí, A.A.; Flores, E.; Pizarro, J.; Segura, R. A simple graphene modified electrode for the determination of antimony(III) in edible plants and beverage. Food Chem. 2022, 367, 130676. [Google Scholar] [CrossRef]
- Hai, T.L.; Hung, L.C.; Phuong, T.T.B.; Ha, B.T.T.; Nguyen, B.-S.; Hai, T.D.; Nguyen, V.-H. Multiwall carbon nanotube modified by antimony oxide (Sb2O3/MWCNTs) paste electrode for the simultaneous electrochemical detection of cadmium and lead ions. Microchem. J. 2020, 153, 104456. [Google Scholar] [CrossRef]
- Yao, Y.; Wu, H.; Ping, J. Simultaneous determination of Cd(II) and Pb(II) ions in honey and milk samples using a single-walled carbon nanohorns modified screen-printed electrochemical sensor. Food Chem. 2019, 274, 8–15. [Google Scholar] [CrossRef] [PubMed]
- Dali, M.; Zinoubi, K.; Chrouda, A.; Abderrahmane, S.; Cherrad, S.; Jaffrezic-Renault, N. A biosensor based on fungal soil biomass for electrochemical detection of lead (II) and cadmium (II) by differential pulse anodic stripping voltammetry. J. Electroanal. Chem. 2018, 813, 9–19. [Google Scholar] [CrossRef]
- Abbasi, S.; Bahiraei, A. Ultra trace quantification of chromium(VI) in food and water samples by highly sensitive catalytic adsorptive stripping voltammetry with rubeanic acid. Food Chem. 2012, 133, 1075–1080. [Google Scholar] [CrossRef]
- Liu, X.; Ying, Y.; Ping, J. Structure, synthesis, and sensing applications of single-walled carbon nanohorns. Biosens. Bioelectron. 2020, 167, 112495. [Google Scholar] [CrossRef]
- Kachoosangi, R.T.; Compton, R.G. Voltammetric determination of Chromium(VI) using a gold film modified carbon composite electrode. Sens. Actuators B Chem. 2013, 178, 555–562. [Google Scholar] [CrossRef]
- Xu, Y.; Zhang, W.; Huang, X.; Shi, J.; Zou, X.; Li, Z.; Cui, X. Adsorptive stripping voltammetry determination of hexavalent chromium by a pyridine functionalized gold nanoparticles/three-dimensional graphene electrode. Microchem. J. 2019, 149, 104022. [Google Scholar] [CrossRef]
- Filik, H.; Aslıhan Avan, A. Neutral red interlinked gold nanoparticles/multiwalled carbon nanotubes modified electrochemical sensor for simultaneous speciation and detection of chromium (VI) and vanadium (V) in water samples. Microchem. J. 2020, 158, 105242. [Google Scholar] [CrossRef]
- Sadeghi, S.; Garmroodi, A. A highly sensitive and selective electrochemical sensor for determination of Cr(VI) in the presence of Cr(III) using modified multi-walled carbon nanotubes/quercetin screen-printed electrode. Mater. Sci. Eng. C 2013, 33, 4972–4977. [Google Scholar] [CrossRef]
- Han, X.; Meng, Z.; Zhang, H.; Zheng, J. Fullerene-based anodic stripping voltammetry for simultaneous determination of Hg(II), Cu(II), Pb(II) and Cd(II) in foodstuff. Microchim. Acta 2018, 185, 274. [Google Scholar] [CrossRef]
- Welch, C.M.; Nekrassova, O.; Compton, R.G. Reduction of hexavalent chromium at solid electrodes in acidic media: Reaction mechanism and analytical applications. Talanta 2005, 65, 74–80. [Google Scholar] [CrossRef]
- Chávez-Lara, J.; Galicia, M.; Carrasco-Urrutia, K.; Torres-Pérez, J. Sensitive detection of chromium (VI) using Au-NPs/MWCNT/chitosan composite via electrochemical approach. Int. J. Electrochem. Sci. 2023, 18, 100161. [Google Scholar] [CrossRef]
- Chaisiwamongkhol, K.; Batchelor-McAuley, C.; Sokolov, S.V.; Holter, J.; Young, N.P.; Compton, R.G. Optimising carbon electrode materials for adsorptive stripping voltammetry. Appl. Mater. Today 2017, 7, 60–66. [Google Scholar] [CrossRef]
- da Conceição, E.; Buffon, E.; Stradiotto, N.R. Lead signal enhancement in anodic stripping voltammetry using graphene oxide and pectin as electrode modifying agents for biofuel analysis. Fuel 2022, 325, 124906. [Google Scholar] [CrossRef]
- Sahoo, S.; Satpati, A.K. Fabrication of rGO/NiS/AuNCs ternary nanocomposite modified electrode for electrochemical sensing of Cr(VI) at utra-trace level. Surf. Interfaces 2021, 24, 101096. [Google Scholar] [CrossRef]
- Jayaraman, N.; Palani, Y.; Jonnalagadda, R.R.; Shanmugam, E. Covalently dual functionalized graphene oxide-based multiplex electrochemical sensor for Hg(II) and Cr(VI) detection. Sens. Actuators B Chem. 2022, 367, 132165. [Google Scholar] [CrossRef]
- Pizarro, J.; Segura, R.; Tapia, D.; Navarro, F.; Fuenzalida, F.; Jesús Aguirre, M. Inexpensive and green electrochemical sensor for the determination of Cd(II) and Pb(II) by square wave anodic stripping voltammetry in bivalve mollusks. Food Chem. 2020, 321, 126682. [Google Scholar] [CrossRef]

Disclaimer/Publisher’s Note: The statements, opinions and data contained in all publications are solely those of the individual author(s) and contributor(s) and not of MDPI and/or the editor(s). MDPI and/or the editor(s) disclaim responsibility for any injury to people or property resulting from any ideas, methods, instructions or products referred to in the content. |
© 2024 by the authors. Licensee MDPI, Basel, Switzerland. This article is an open access article distributed under the terms and conditions of the Creative Commons Attribution (CC BY) license (https://creativecommons.org/licenses/by/4.0/).