

Comparison In Vitro Study on the Interface between Skin and Bone Cell Cultures and Microporous Titanium Samples Manufactured with 3D Printing Technology Versus Sintered Samples

 ,
,
Abstract
:1. Introduction
2. Materials and Methods
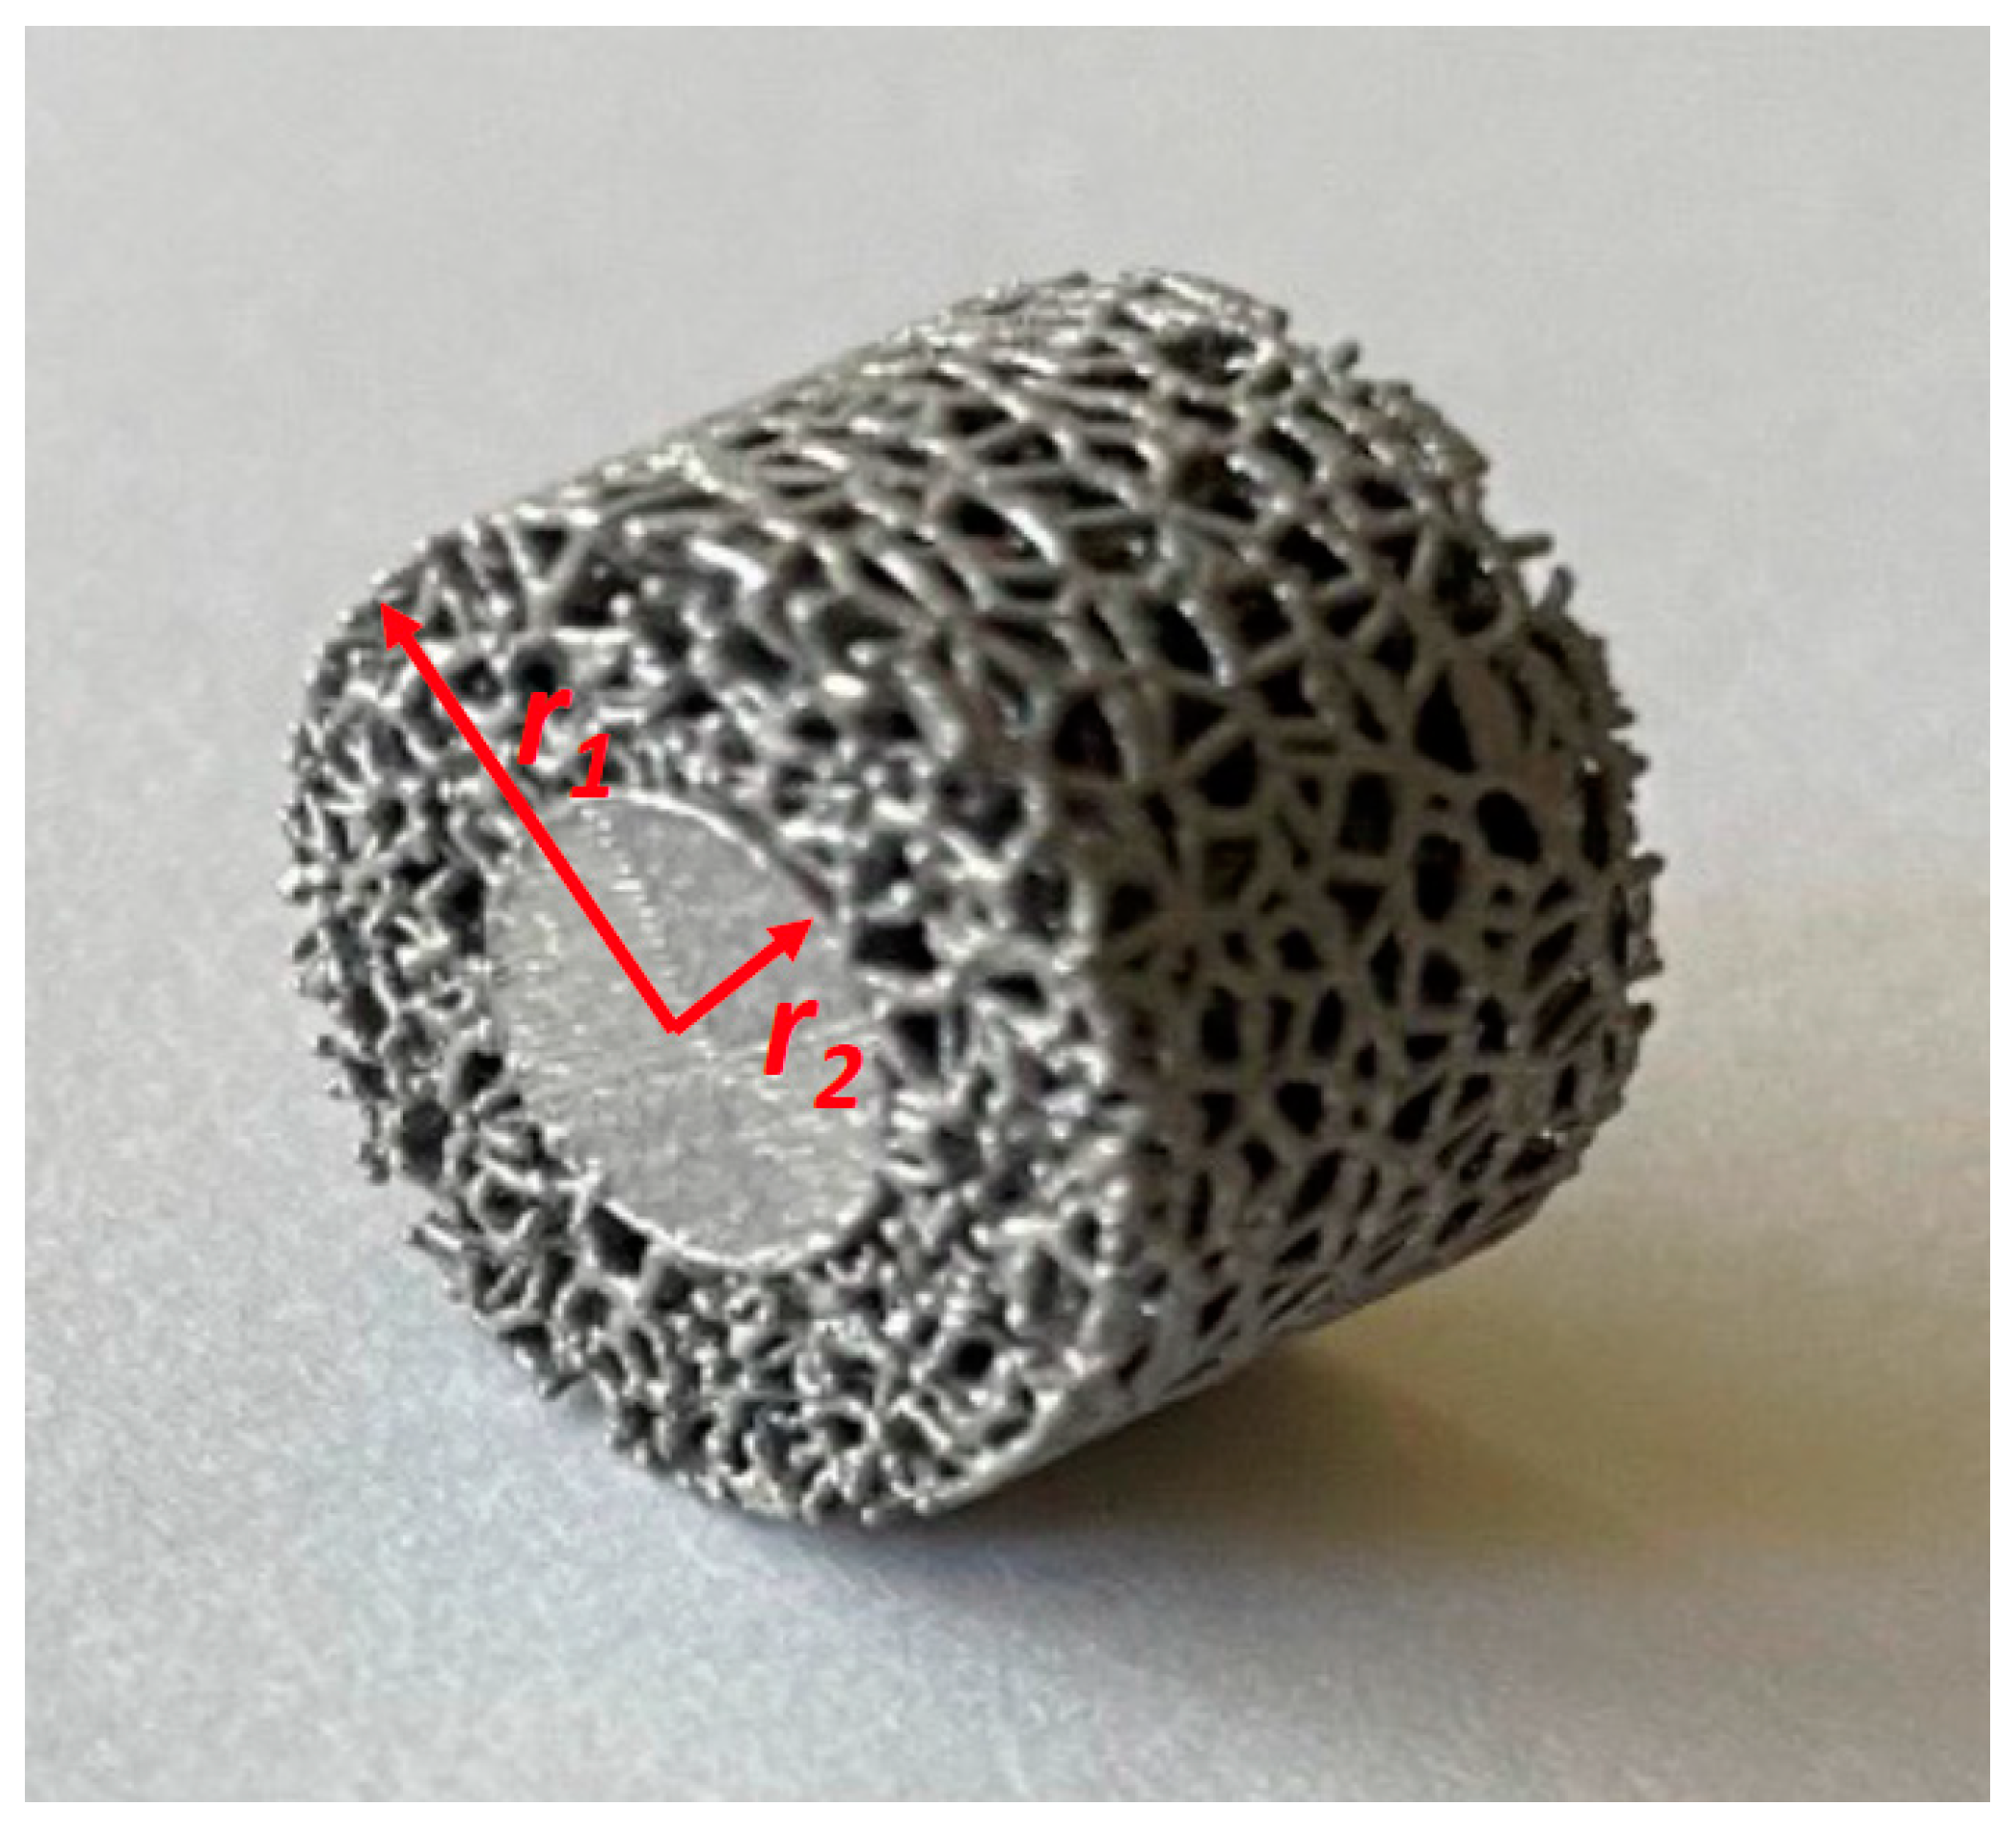
2.1. Samples for the Current Study

| Sample Identifier | % Solid | % Porous | Strut Diameter (µm) | Average Pore Diameter (µm) |
|---|---|---|---|---|
| S1 | 28.6 | 71.4 | 270 | 1000 |
| S2 | 32.7 | 67.3 | 270 | 890 |
| S3 | 37.3 | 62.7 | 270 | 770 |
| S4 | 43.2 | 56.8 | 260 | 690 |
| S5 | 50.0 | 50.0 | 270 | 590 |
| S6 | 58.7 | 41.3 | 270 | 500 |
| S7 | 78.8 | 21.2 | 250 | 420 |
| S8 | 68.9 | 31.1 | 250 | 310 |
| S9 | 80.5 | 19.5 | 230 | 210 |
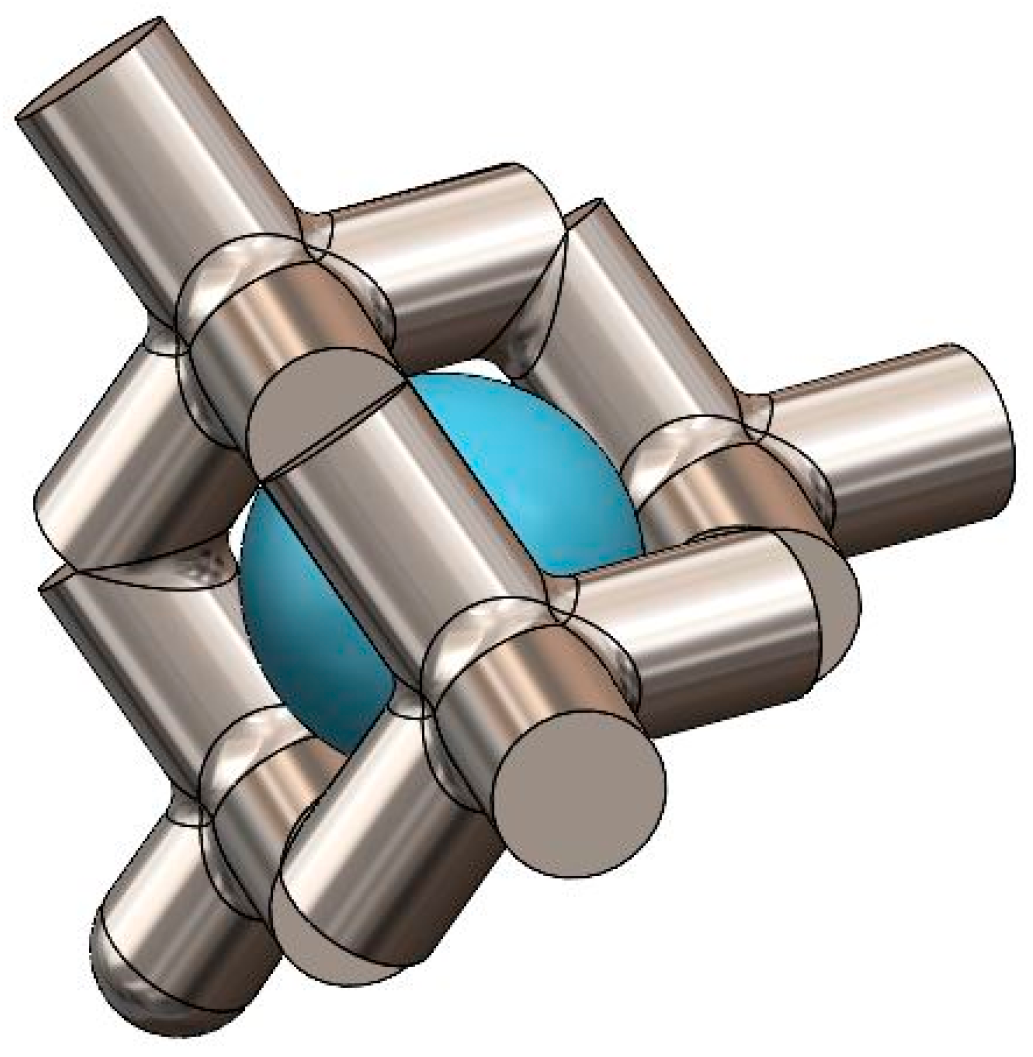
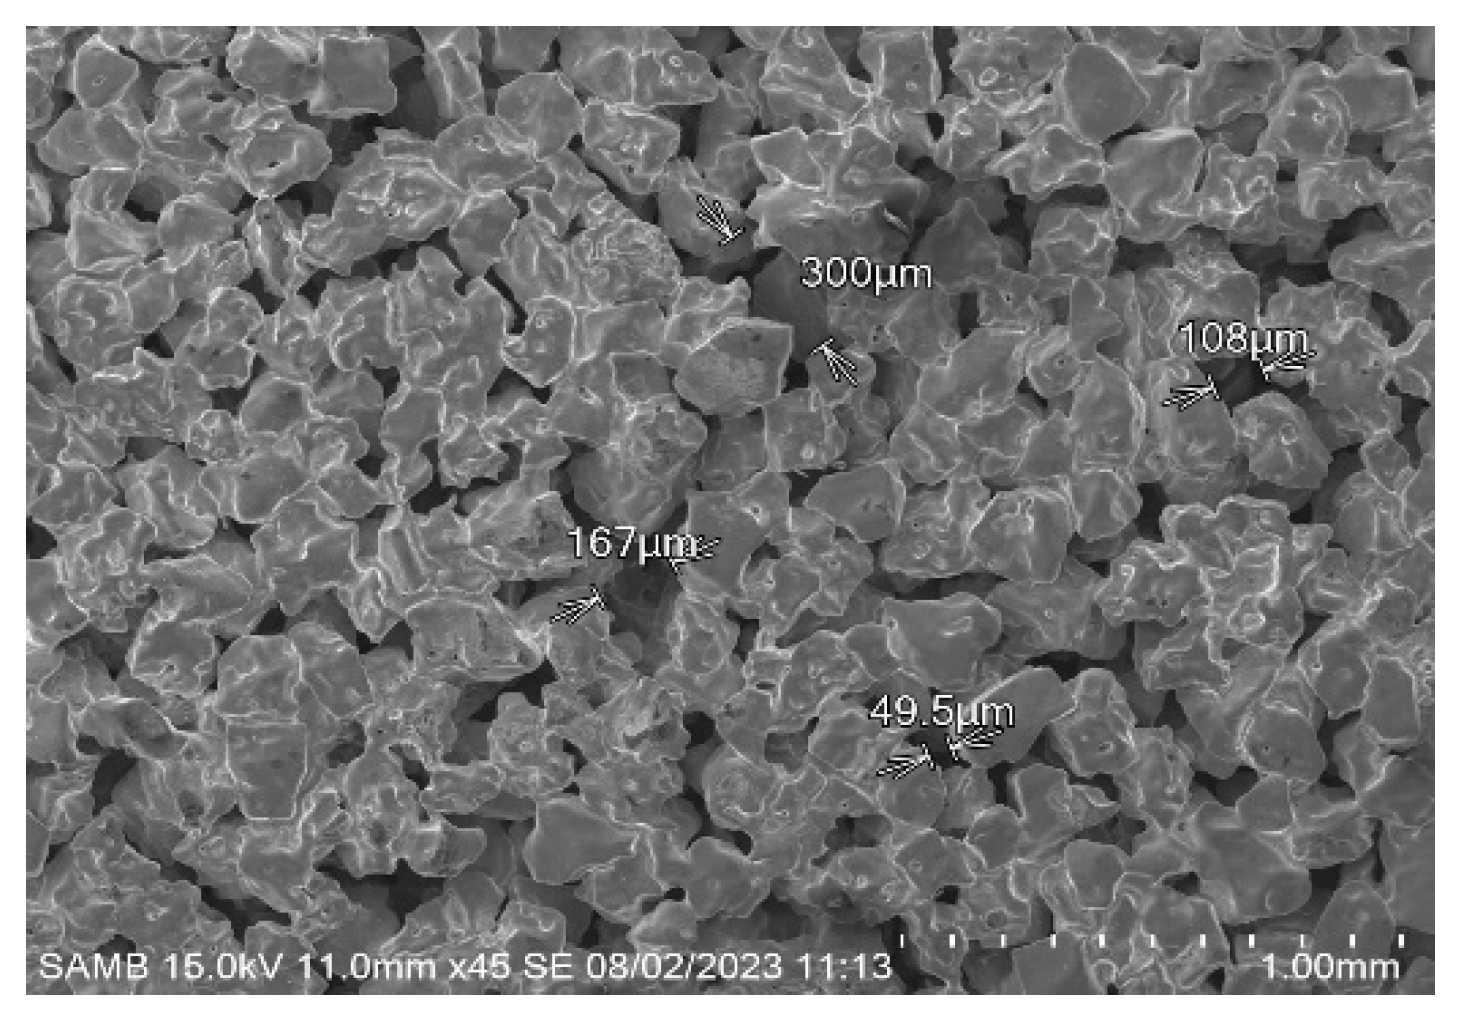
2.2. Specifics of 3D Printing Fabrication
2.3. Cell Culture
2.4. Cell Proliferation Assay
2.5. Quantitative Real-Time PCR
2.6. Statistics
3. Results
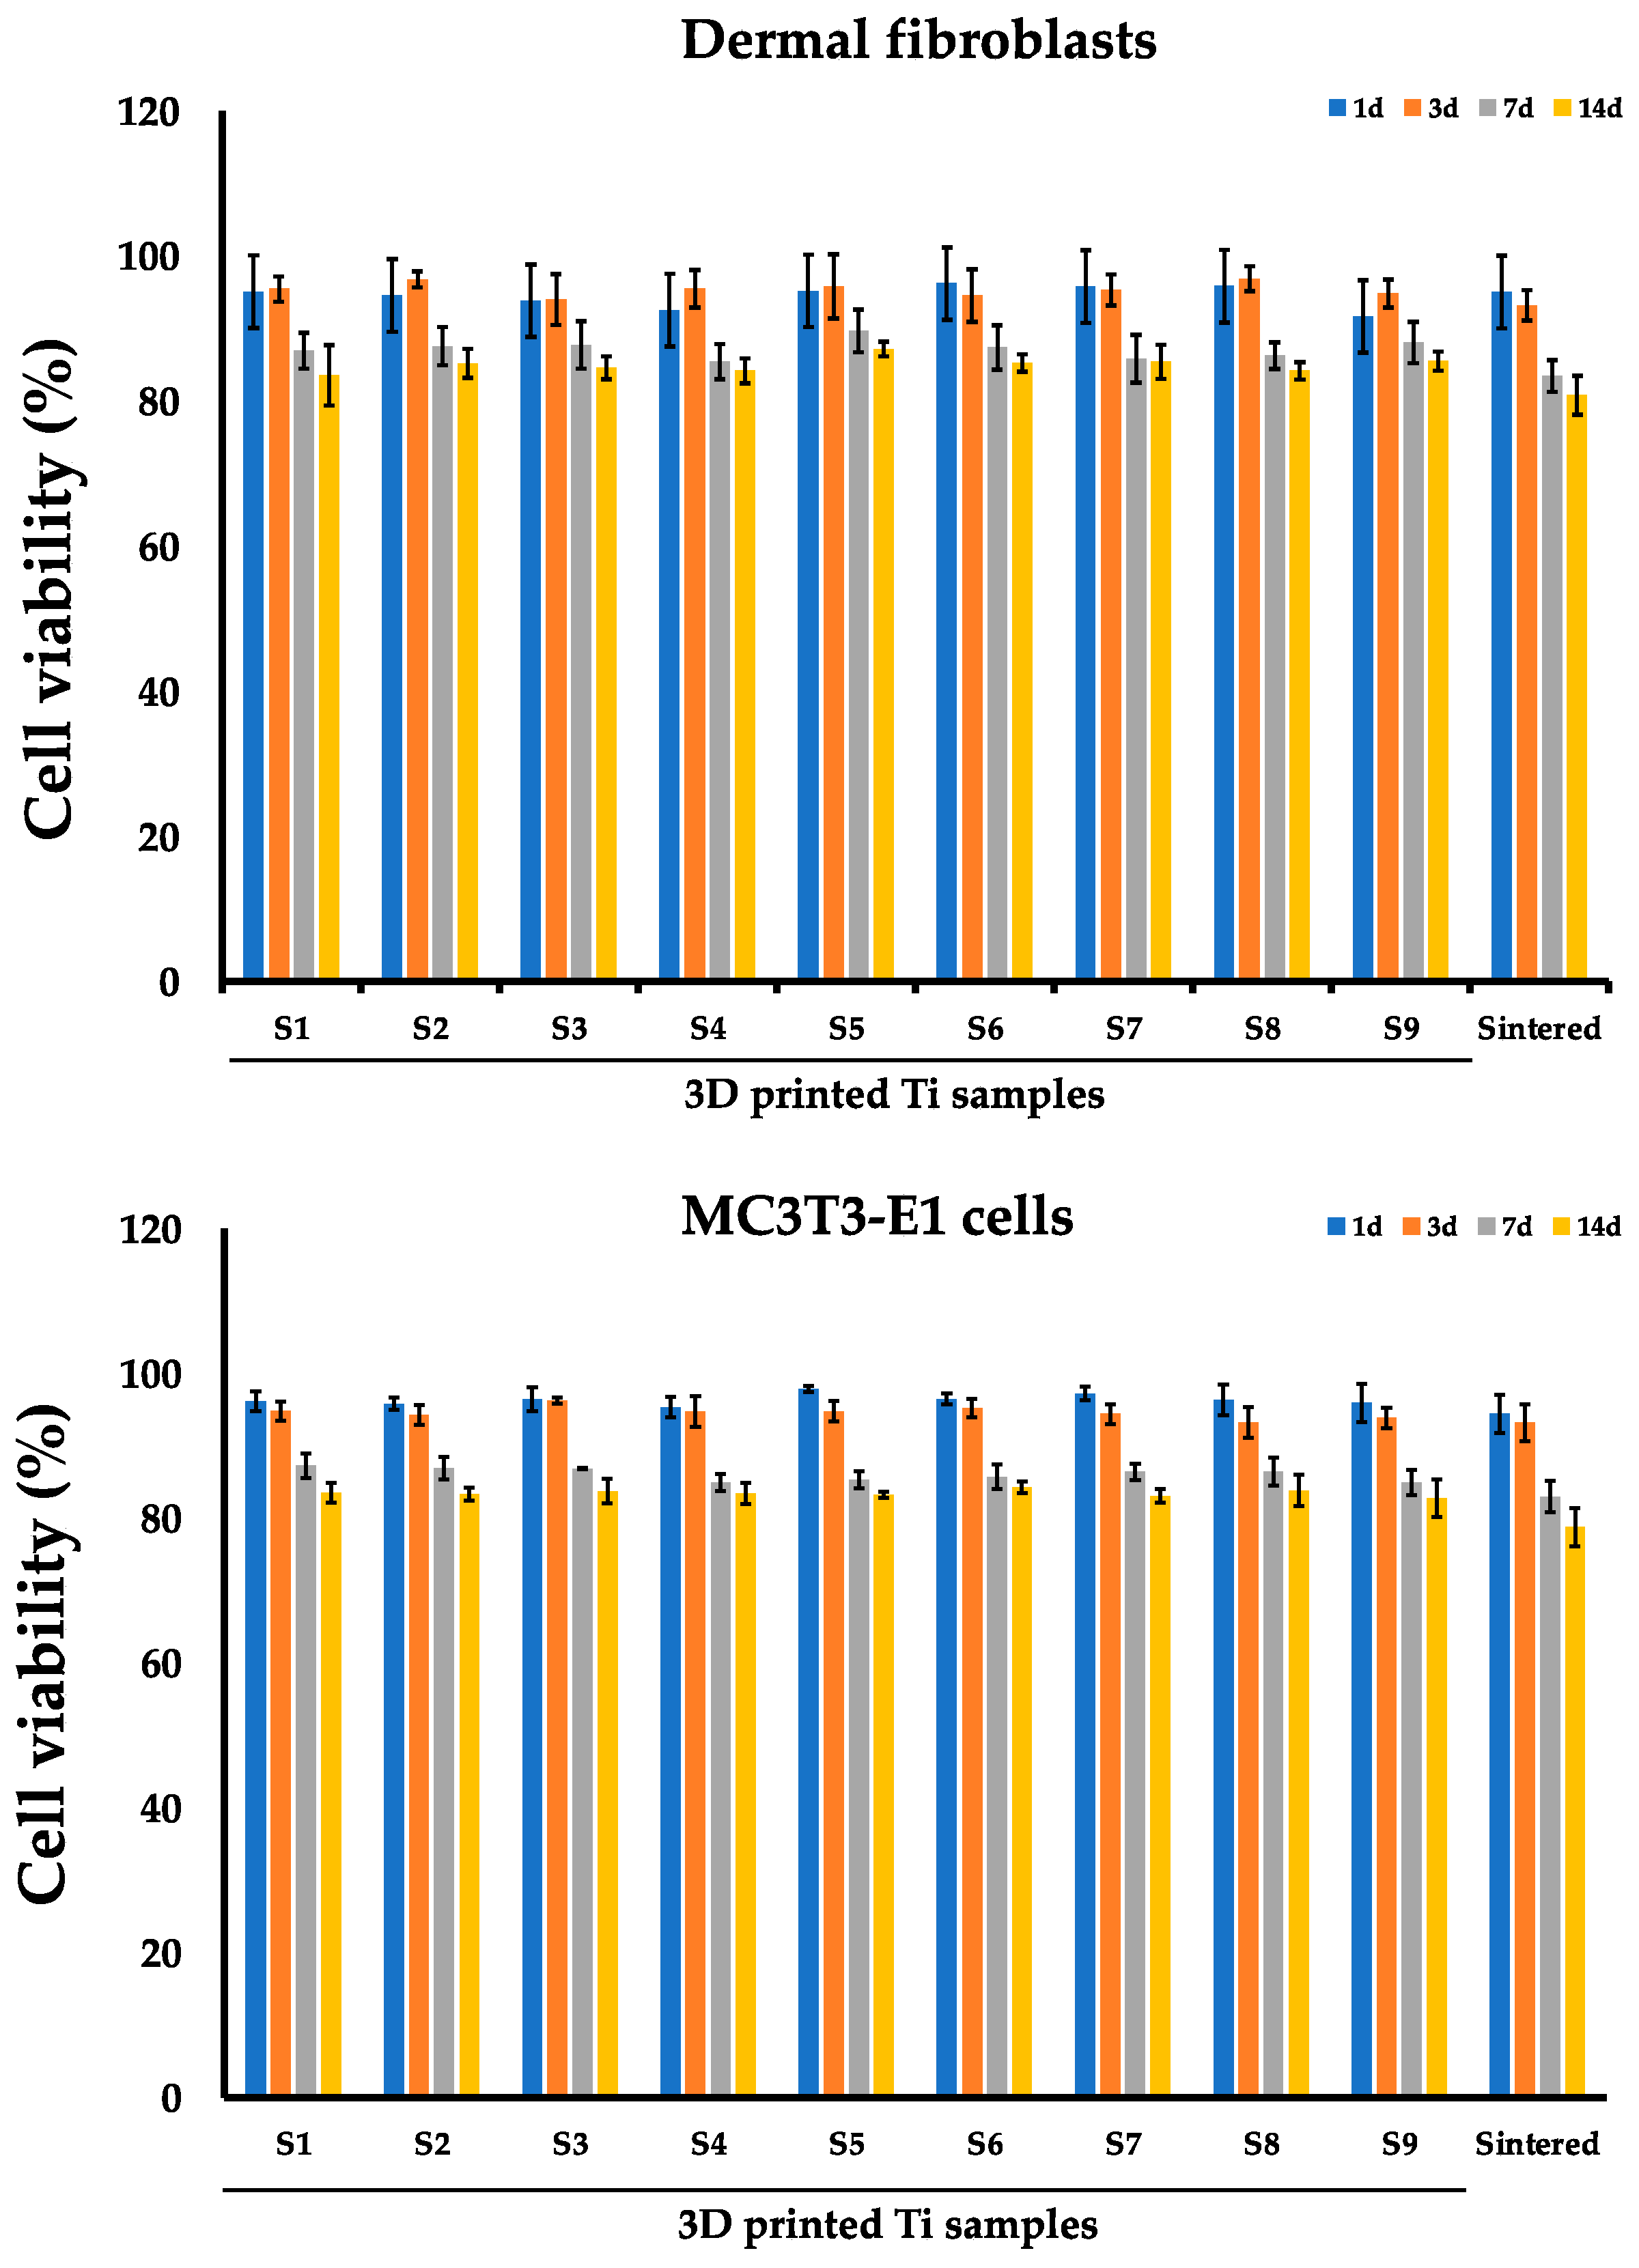
3.1. Evaluation of the Fibroblasts and MC3T3-E1 Viability on the Sintered and 3D Printed Ti Discs
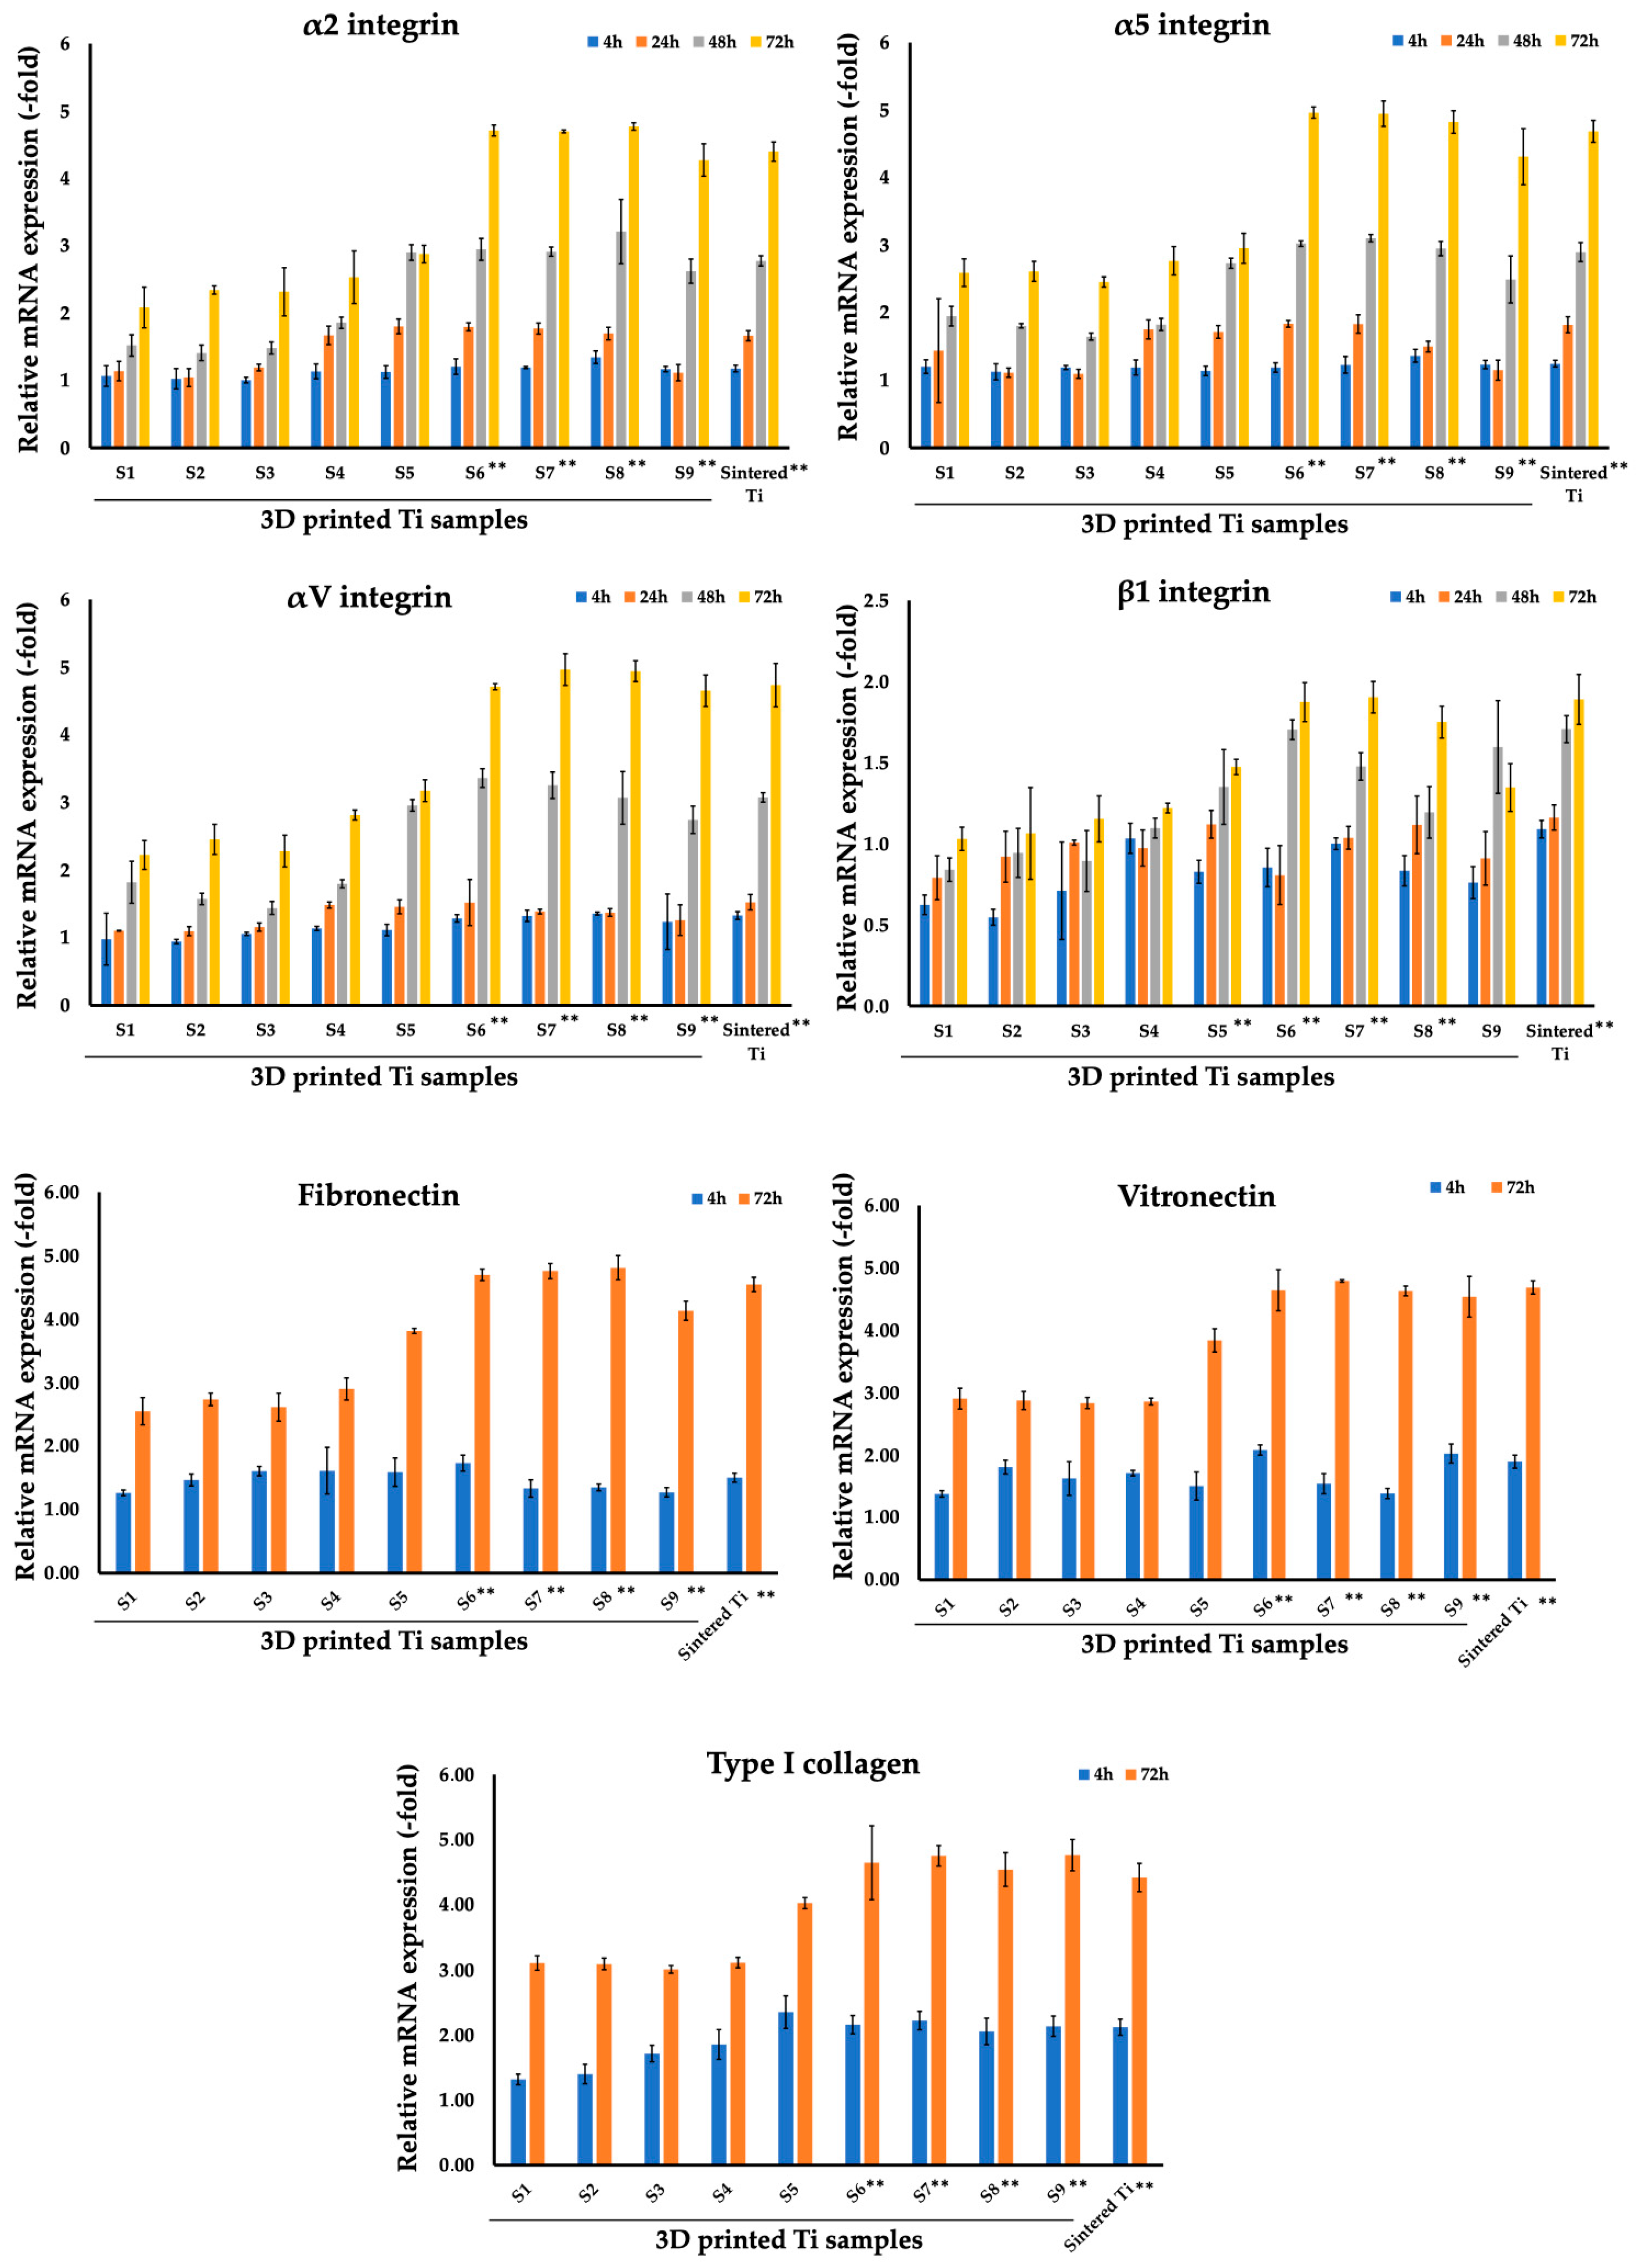
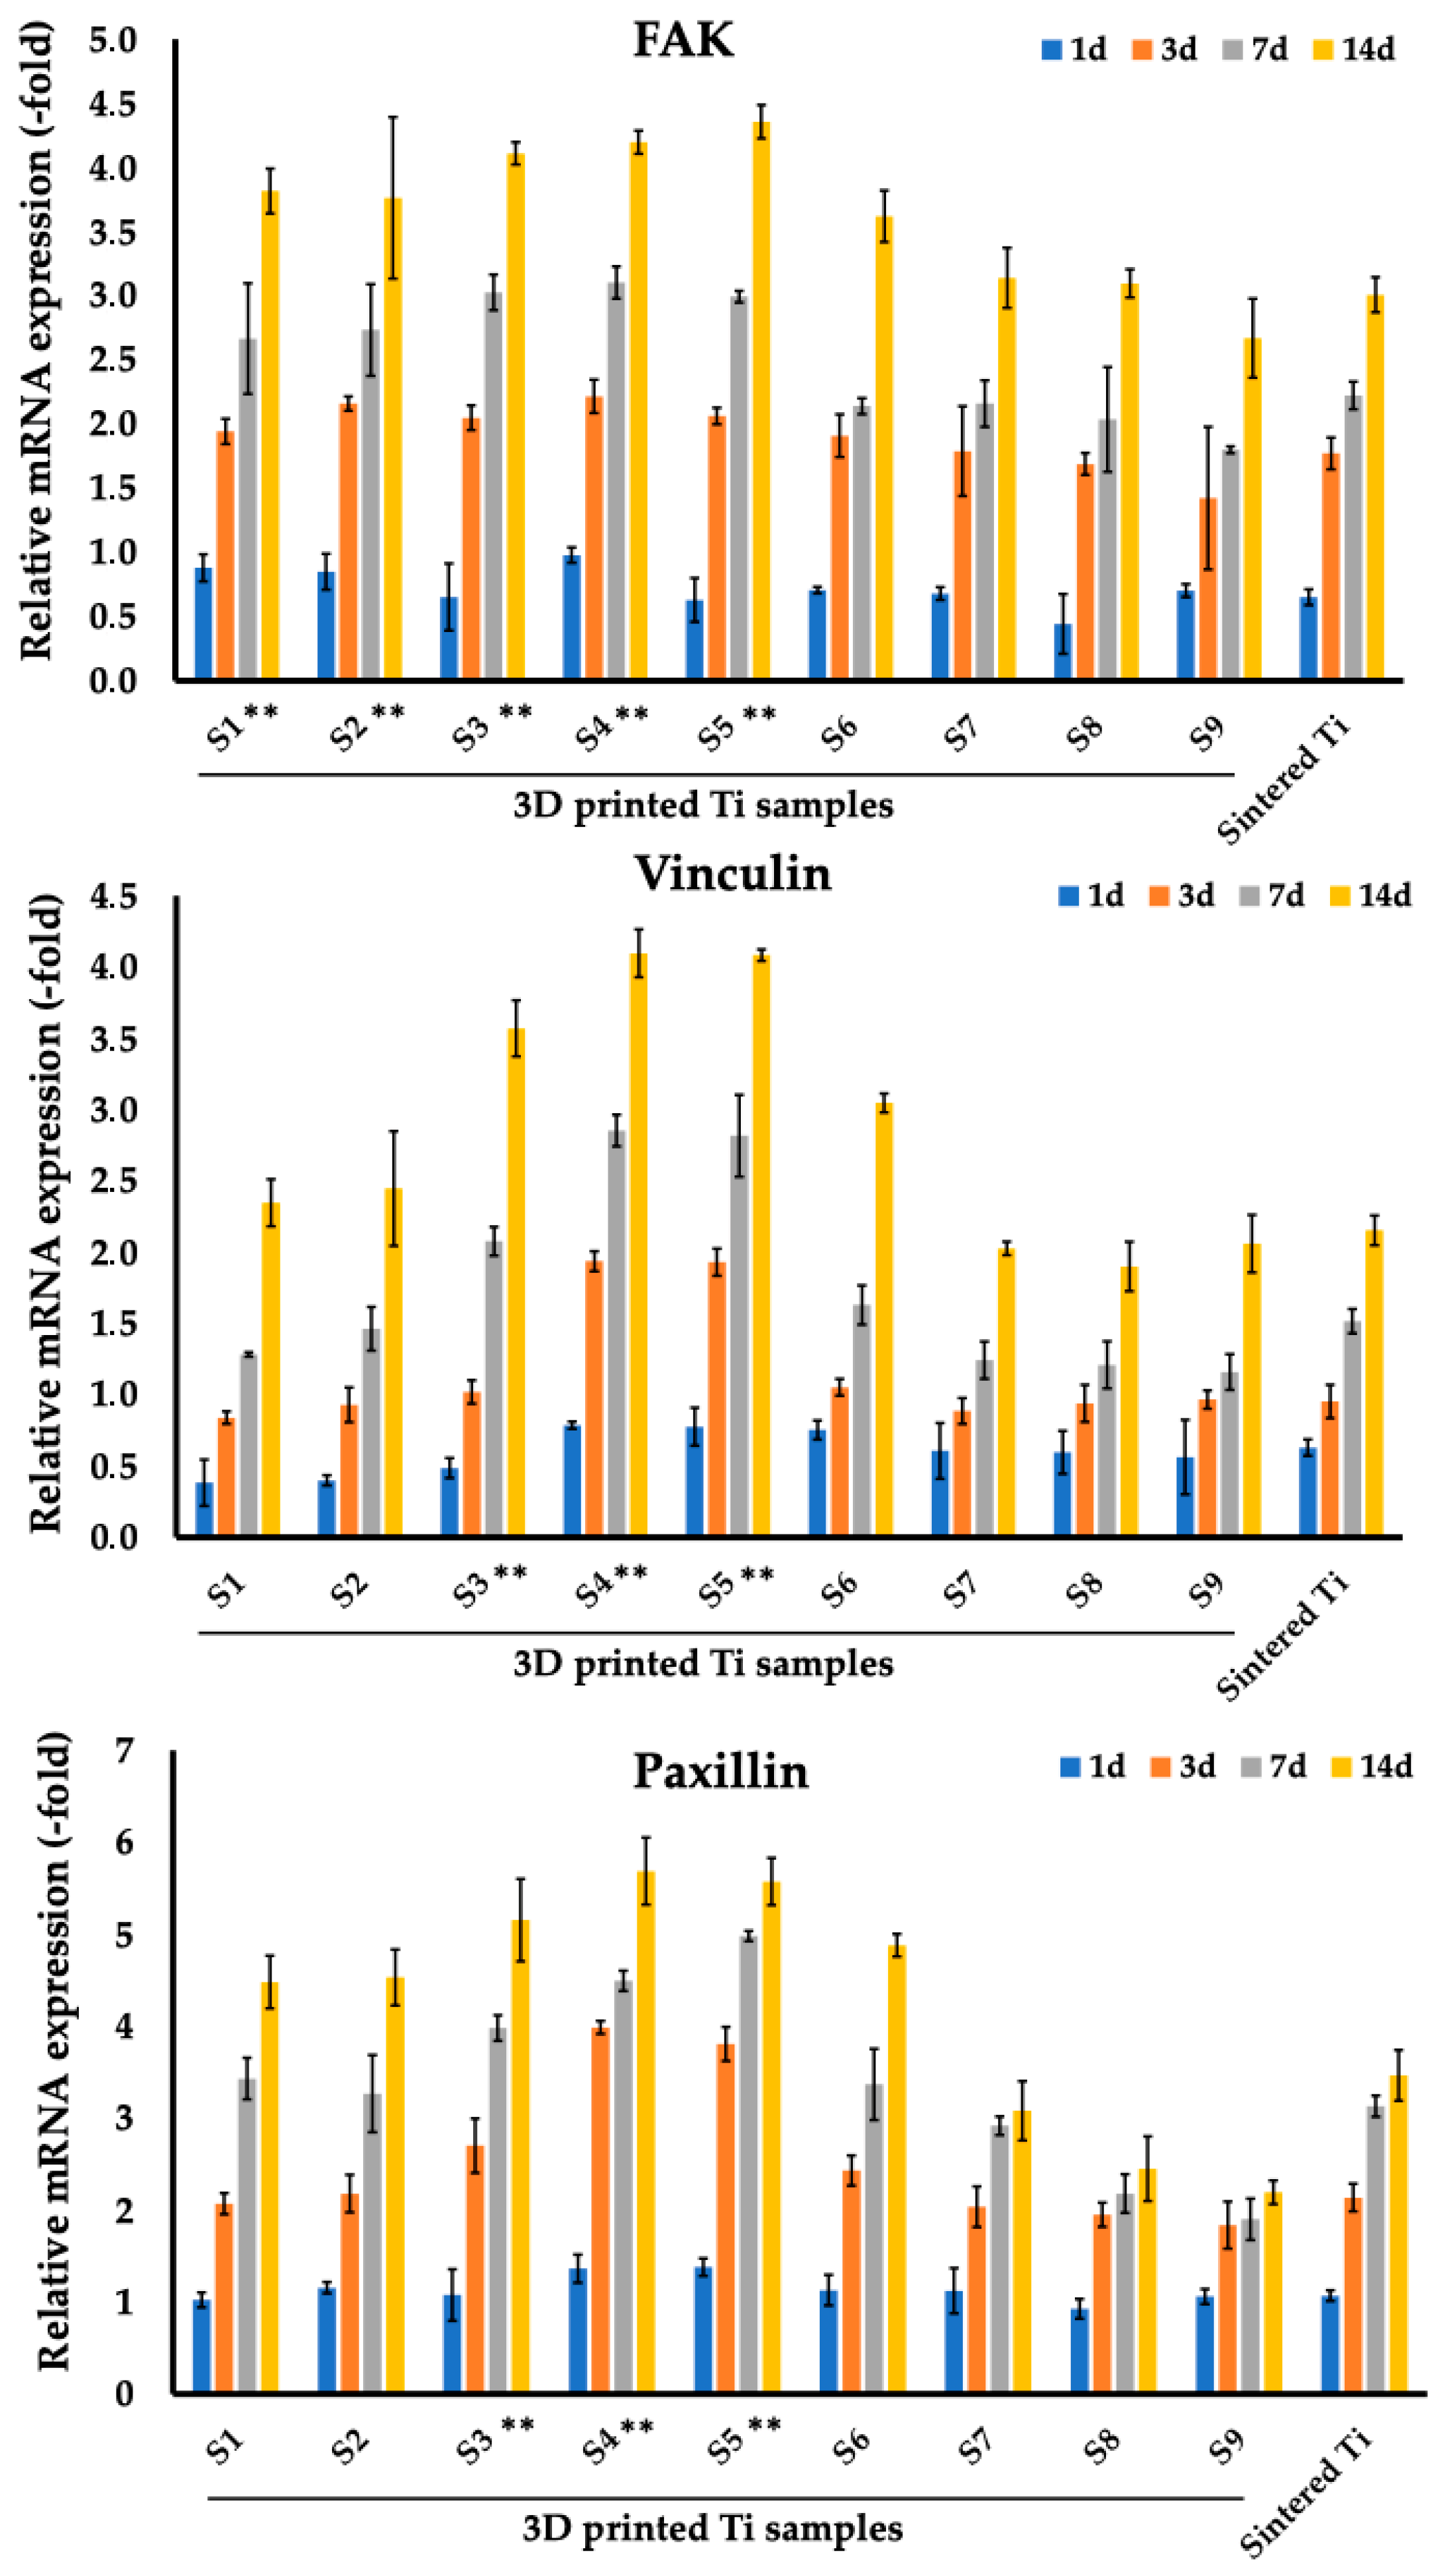
3.2. Analysis of Focal Adhesion Markers of Fibroblasts and Osteoblasts Cultured on Sintered and 3D Printed Ti Discs
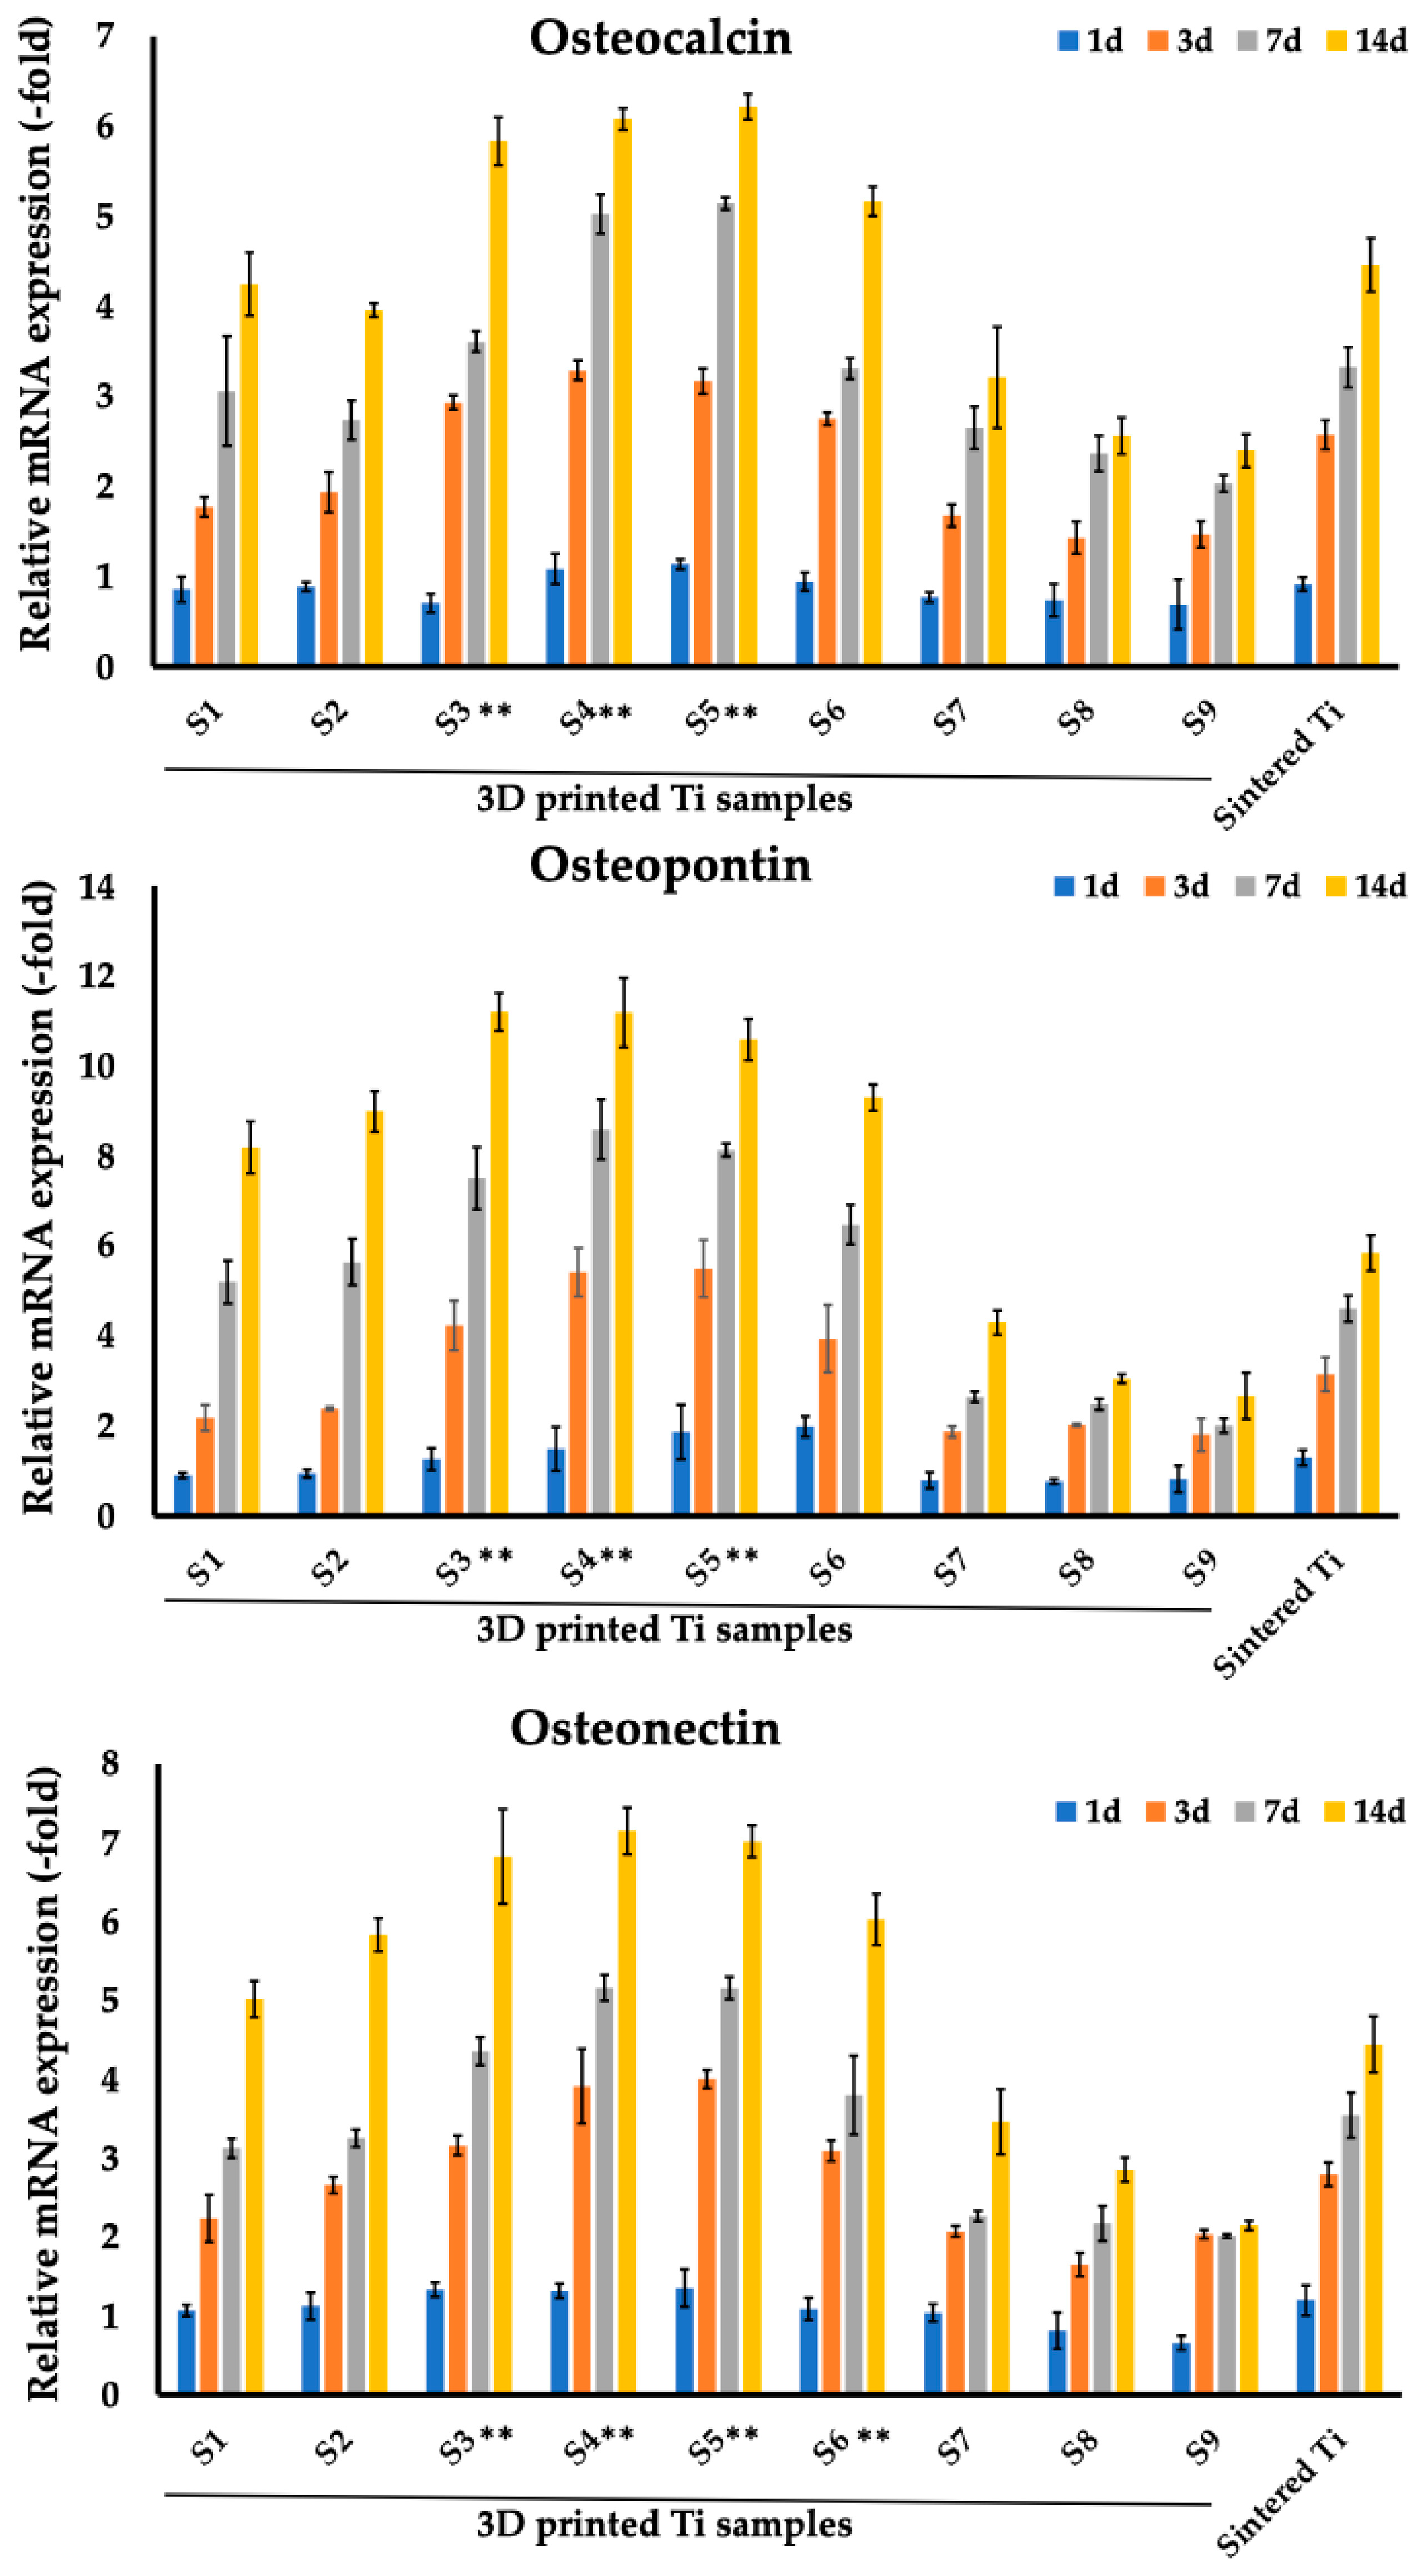
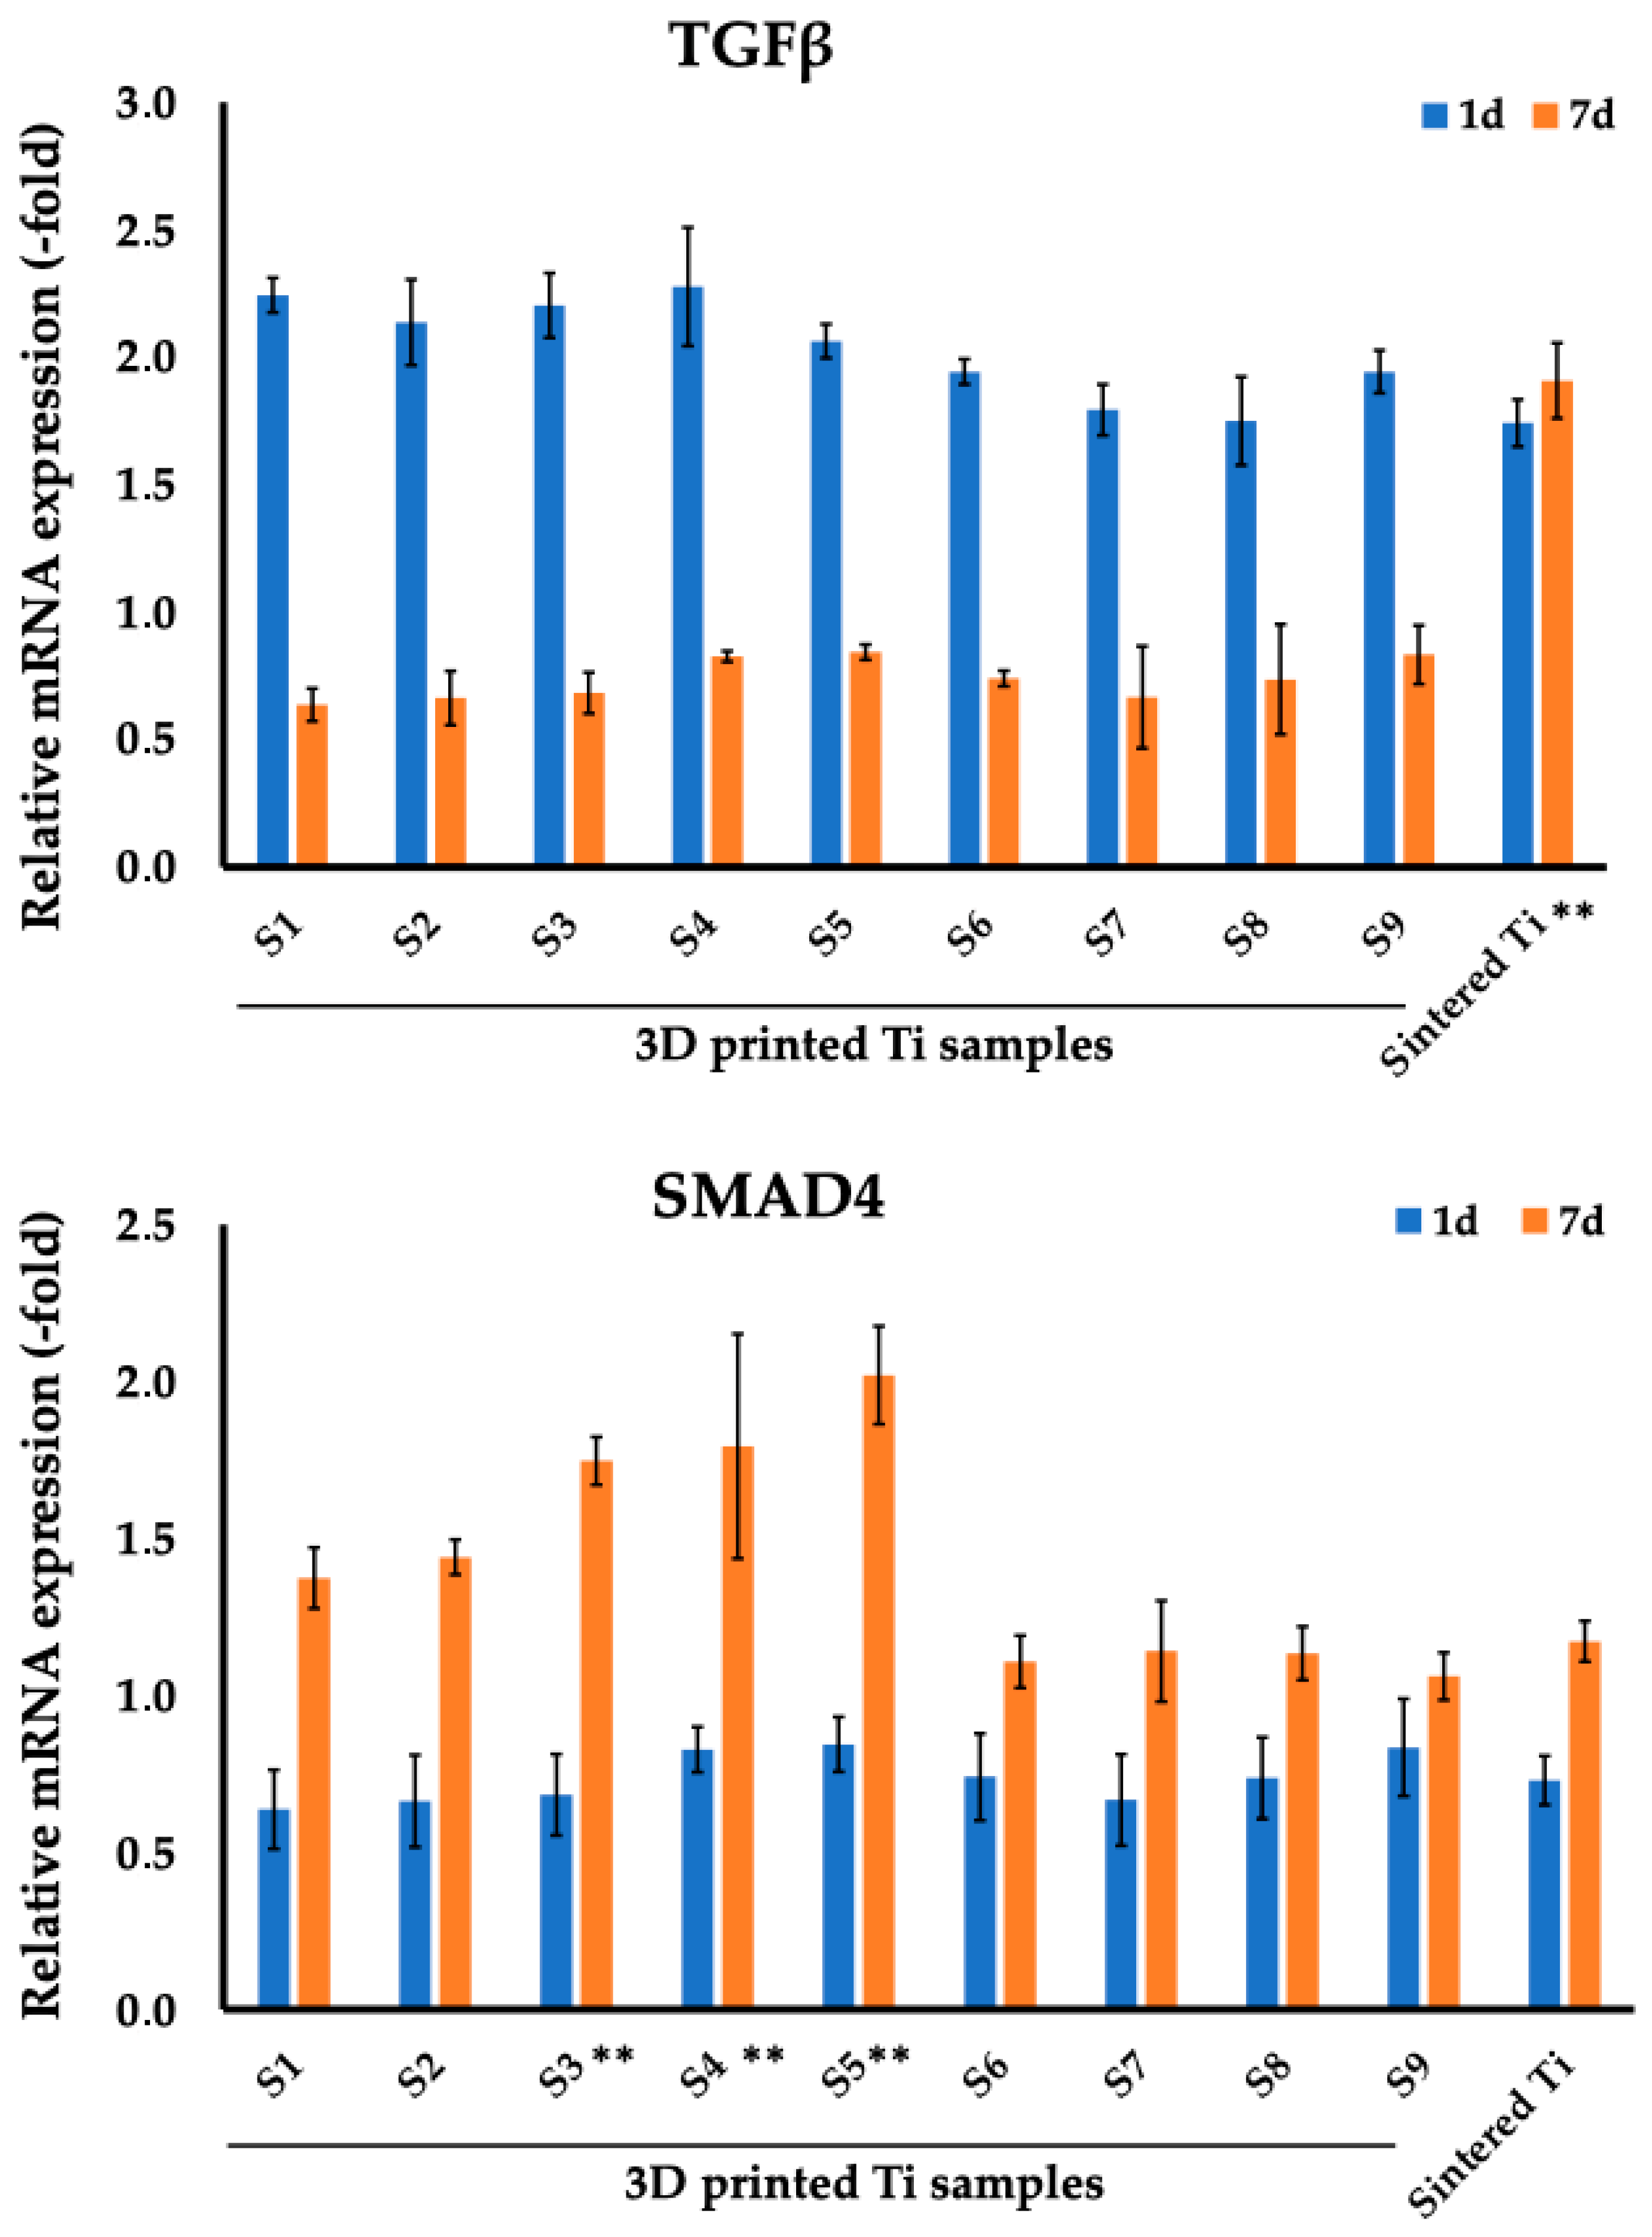
3.3. Analysis of Osteogenic Markers of MC3T3-E1 Cells Cultured on Sintered and 3D-Printed Ti Samples
4. Discussion
5. Conclusions
Author Contributions
Funding
Data Availability Statement
Conflicts of Interest
Abbreviations
| BMD | bone mineral density |
| BMP | bone mineral density |
| CaP | calcium phosphate |
| EBM | electron beam melting |
| FAK | Focal adhesion kinase |
| HA | hydroxyapatite |
| ML-ALD | molecular layering of atomic layer deposition |
| RT-PCR | Real Time Polymerase Chain Reaction |
| SBIP | Skin and Bone Integrated Pylon |
| SLM | selective laser melting |
| SMAD4 | SMAD family member 4, Mothers against decapentaplegic homolog 4 |
| TGF-β1 | Transforming growth factor beta |
References
- Kunutsor, S.; Gillatt, D.; Blom, A. Systematic review of the safety and efficacy of osseointegration prosthesis after limb amputation. Br. J. Surg. 2018, 105, 1731–1741. [Google Scholar] [CrossRef] [PubMed]
- Overmann, A.L.; Forsberg, J.A. The state of the art of osseointegration for limb prosthesis. Biomed. Eng. Lett. 2020, 10, 5–16. [Google Scholar] [CrossRef] [PubMed]
- Gerzina, C.; Potter, E.; Haleem, A.M.; Dabash, S. The future of the amputees with osseointegration: A systematic review of literature. J. Clin. Orthop. Trauma 2020, 11, S142–S148. [Google Scholar] [CrossRef] [PubMed]
- Hebert, J.S.; Rehani, M.; Stiegelmar, R. Osseointegration for Lower-Limb Amputation: A Systematic Review of Clinical Outcomes. JBJS Rev. 2017, 5, e10. [Google Scholar] [CrossRef] [PubMed]
- Sartori, M.; Borsari, V.; Maglio, M.; Brogini, S.; Bragonzoni, L.; Zaffagnini, S.; Fini, M. Skin adhesion to the percutaneous component of direct bone anchored systems: Systematic review on preclinical approaches and biomaterials. Biomater. Sci. 2021, 9, 7008–7023. [Google Scholar] [CrossRef]
- Jeyapalina, S.; Beck, J.P.; Agarwal, J.; Bachus, K.N. A 24-month evaluation of a percutaneous osseointegrated limb-skin interface in an ovine amputation model. J. Mater. Sci. Mater. Med. 2017, 28, 179. [Google Scholar] [CrossRef]
- Pendegrass, C.J.; Goodship, A.E.; Blunn, G.W. Development of a soft tissue seal around bone-anchored transcutaneous amputation prostheses. Biomaterials 2006, 27, 4183–4191. [Google Scholar] [CrossRef]
- Jeyapalina, S.; Beck, J.P.; Bachus, K.N.; Williams, D.L.; Bloebaum, R.D. Efficacy of a porous-structured titanium subdermal barrier for preventing infection in percutaneous osseointegrated prostheses. J. Orthop. Res. 2012, 30, 1304–1311. [Google Scholar] [CrossRef]
- Souza, J.C.M.; Sordi, M.B.; Kanazawa, M.; Ravindran, S.; Henriques, B.; Silva, F.S.; Aparicio, C.; Cooper, L.F. Nano-scale modification of titanium implant surfaces to enhance osseointegration. Acta Biomater. 2019, 94, 112–131. [Google Scholar] [CrossRef]
- Pitkin, M.; Raykhtsaum, G. Skin Integrated Device. U.S. Patent 8257435, 4 September 2012. Available online: http://www.google.com/patents/US8257435 (accessed on 1 July 2024).
- Pitkin, M. In-Bone Implantable Shaft for Prosthetic Joints or for Direct Skeletal Attachment of External Limb Prostheses and Method of Its Installation. U.S. Patent No. 8992615, 31 March 2015. Available online: https://patents.google.com/patent/US8992615B2/en (accessed on 1 July 2024).
- Shevtsov, M.; Gavrilov, D.; Yudintceva, N.; Zemtsova, E.; Arbenin, A.; Smirnov, V.; Voronkina, I.; Adamova, P.; Blinova, M.; Mikhailova, N.; et al. Protecting the skin-implant interface with transcutaneous silver-coated skin-and-bone-intergrated-pylon (SBIP) in pig and rabbit dorsum models. J. Biomed. Mater. Res. B Appl. Biomater. 2021, 109, 584–595. [Google Scholar] [CrossRef]
- Klishko, A.; Hangue, P.; Grinda, G.; Zhang, C.; Oh, K.; Herrin, K.; Dalton, J.; Pitkin, M.; Prilutsky, B. Stimulation of residual sensory nerve modulates walking mechanics in the cat with bone-anchored transtibial prosthesis. In Proceedings of the American Society of Biomechanics Annual Conference, Atlanta, GA, USA, 4–7 August 2020. [Google Scholar]
- Shevtsov, M.A.; Yudintceva, N.M.; Blinova, M.I.; Voronkina, I.V.; Suslov, D.N.; Galibin, O.V.; Gavrilov, D.V.; Akkaoui, M.; Raykhtsaum, G.; Albul, A.V.; et al. Evaluation of the temporary effect of physical vapor deposition silver coating on resistance to infection in transdermal skin and bone integrated pylon with deep porosity. J. Biomed. Mater. Res. B Appl. Biomater. 2019, 107, 169–177. [Google Scholar] [CrossRef] [PubMed] [PubMed Central]
- Prilutsky, B.; Park, H.; Oh, K.; Dalton IV, J.P.; DeWeerth, S.P.; Pitkin, M.; Klishko, A. Bidirectional Control of a Sensing Powered Transtibial Prosthesis during Walking in the Cat. In Proceedings of the Society for Neuroscience Octobre Meeting, Chicago, IL, USA, 19–23 October 2019. [Google Scholar]
- Pitkin, M.; Cassidy, C.; Shevtsov, M.; Jarrell, J.; Park, H.; Farrell, B.; Dalton, J.; Childers, W.L.; Temenoff, J.; Oh, K.; et al. Animal studies of the Skin and Bone Integrated Pylon with deep porosity for bone-anchored limb prosthetics with and without neural interface. In Proceedings of the Military Health System Research Symposium MHSRS-19-00758, Kissime, FL, USA, 19 August 2019; p. 44. [Google Scholar]
- Park, H.; Prilutsky, B.; Pitkin, M.; Raykhtsaum, G. Osseointegrated powered prosthetic foot with bi-directional neural intuitive control and sensation. Tufts University School of Medicine, Boston, MA, USA. 2021; U.S. Patent Pending. [Google Scholar]
- Jarrell, J.R.; Farrell, B.J.; Kistenberg, R.S.; Dalton, J.F.t.; Pitkin, M.; Prilutsky, B.I. Kinetics of individual limbs during level and slope walking with a unilateral transtibial bone-anchored prosthesis in the cat. J. Biomech. 2018, 76, 74–83. [Google Scholar] [CrossRef]
- Shevtsov, M.; Yudintceva, N.; Blinova, M.; Voronkina, I.; Akkaoui, M.; Raykhtsaum, G.; Pitkin, M. In-vitro and in-vivo evaluation of the effect of PVD silver coating on resistance to infection in transdermal SBIP implants with deep porosity. In Proceedings of the First World Congress on Innovations in Amputation Surgery and Prosthetic Technologies, Chicago, IL, USA, 12–13 May 2016. [Google Scholar]
- Shevtsov, M.A.; Yudintceva, N.; Blinova, M.; Pinaev, G.; Galibin, O.; Potokin, I.; Popat, K.C.; Pitkin, M. Application of the skin and bone integrated pylon with titanium oxide nanotubes and seeded with dermal fibroblasts. Prosthet. Orthot. Int. 2015, 39, 477–486. [Google Scholar] [CrossRef] [PubMed] [PubMed Central]
- Pitkin, M. Design features of the implants for direct skeletal attachment addressing anisotropy of tissues regeneration. In Proceedings of the ISPO World Congress, Lyon, France, 22–25 June 2015. [Google Scholar]
- Pitkin, M. Addressing anisotropy of tissues regeneration in the implants design. In Proceedings of the Int. Conference on Biomechanics and Implant Design, Orlando, FL, USA, 27–29 July 2015. [Google Scholar]
- Shevtsov, M.; Galibin, O.; Yudintceva, N.; Blinova, M.; Pinaev, G.; Ivanova, A.; Savchenko, O.; Suslov, D.; Potokin, I.; Pitkin, E.; et al. Two-stage implantation of the skin and bone integrated pylon (SBIP) seeded with autologous fibroblasts induced into osteoblast differentiation for direct skeletal attachment of limb prostheses. J. Biomed. Mater. Res. Part A 2014, 102, 3033–3048. [Google Scholar] [CrossRef] [PubMed]
- Shevtsov, M.; Galibin, O.; Yudintceva, N.; Ivanova, A.; Potokin, I.; Blinova, M.; Pitkin, M. Skin and bone integrated pylon (SBIP) seeded with autologous fibroblasts or mesenchymal stem cells (MSCs) for direct skeletal attachment of limb prostheses. In Proceedings of the 7th World Congress of Biomechanics, Boston, MA, USA, 6–11 July 2014. [Google Scholar]
- Jarrell, J.; Farrell, B.; Kistenberg, R.; Dalton, J.; Pitkin, M.; Prilutsky, B. Hindlimb kinetics of upslope and downslope walking in the cat with a trans-tibial osseointegrated prosthesis. In Proceedings of the 7th World Congress of Biomechanics, Boston, MA, USA, 6–11 July 2014. [Google Scholar]
- Farrell, B.J.; Prilutsky, B.I.; Ritter, J.M.; Kelley, S.; Popat, K.; Pitkin, M. Effects of pore size, implantation time, and nano-surface properties on rat skin ingrowth into percutaneous porous titanium implants. J. Biomed. Mater. Res. A 2014, 102, 1305–1315. [Google Scholar] [CrossRef] [PubMed]
- Farrell, B.; Prilutsky, B.; Kistenberg, R.; Dalton, J.; Strong, A.; Pitkin, M. An animal model to study skin-implant-bone integration and prosthetic gait with limb prostheses directly attached to the residual limb. Clin. Biomech. 2014, 29, 336–349. Available online: http://www.ncbi.nlm.nih.gov/pubmed/24405567 (accessed on 1 July 2024). [CrossRef]
- Pitkin, M.; Cassidy, C.; Muppavarapu, R.; Raymond, J.; Shevtsov, M.; Galibin, O.; Rousselle, S.D. New method of fixation of in-bone implanted prosthesis. J. Rehabil. Res. Dev. 2013, 50, 709–722. [Google Scholar] [CrossRef]
- Pitkin, M.; Pilling, J.; Raykhtsaum, G. Mechanical properties of totally permeable titanium composite pylon for direct skeletal attachment. J. Biomed. Mater. Res. Part B Appl. Biomater. 2012, 100B, 993–999. [Google Scholar] [CrossRef]
- Pitkin, M.; Cassidy, C.; Muppavarapu, R.; Edell, D. Recording of Electric Signal Passing Through a Pylon in Direct Skeletal Attachment of Leg Prostheses with Neuromuscular Control. IEEE Trans. Bio-Med. Eng. 2012, 59, 1349–1353. [Google Scholar] [CrossRef]
- Pitkin, M.; Raykhtsaum, G.; Pilling, J.; Shukeylo, Y.; Moxson, V.; Duz, V.; Lewandowski, J.; Connolly, R.; Kistenberg, R.; Dalton, J.; et al. Mathematical modeling and mechanical and histopathological testing of porous prosthetic pylon for direct skeletal attachment. J. Rehabil. Res. Dev. 2009, 46, 315–330. [Google Scholar] [CrossRef]
- Pitkin, M. On the way to total integration of prosthetic pylon with residuum. J. Rehabil. Res. Dev. 2009, 46, 345–360. [Google Scholar] [CrossRef] [PubMed]
- Pitkin, M. One lesson from arthroplasty to osseointegration in a search for better fixation of in-bone implanted prosthesis. J. Rehabil. Res. Dev. 2008, 45, vii–xiv. [Google Scholar] [PubMed]
- Pitkin, M.; Raykhtsaum, G.; Pilling, J.; Galibin, O.; Protasov, M.; Chihovskaya, J.; Belyaeva, I.; Blinova, M.; Yudintseva, M.; Potokin, I.; et al. Porous composite prosthetic pylon for integration with skin and bone. J. Rehabil. Res. Dev. 2007, 44, 723–738. [Google Scholar] [CrossRef] [PubMed]
- Pitkin, M.; Raykhtsaum, G.; Galibin, O.; Protasov, M.; Chihovskaya, J.; Belyaeva, I. Skin and bone integrated prosthetic pylon: A pilot animal study. J. Rehabil. Res. Dev. 2006, 43, 573–580. [Google Scholar] [CrossRef]
- Pitkin, M. Design features of the implants for direct skeletal attachment of limb prostheses. J. Biomed. Mater. Res. Part A 2013, 101, 3339–3348. [Google Scholar] [CrossRef] [PubMed Central]
- Pitkin, M.; Cassidy, C.; Shevtsov, M.A.; Jarrell, J.R.; Park, H.; Farrell, B.J.; Dalton, J.F.; Childers, W.L.; Kistenberg, R.S.; Oh, K.; et al. Recent Progress in Animal Studies of the Skin- and Bone-integrated Pylon With Deep Porosity for Bone-Anchored Limb Prosthetics With and Without Neural Interface. Mil. Med. 2021, 186, 688–695. [Google Scholar] [CrossRef]
- Wang, Y.; Tan, Q.; Pu, F.; Boone, D.; Zhang, M. A review of the application of additive manufacturing in prosthetic and orthotic clinics from a biomechanical perspective. Engineering 2020, 6, 1258–1266. [Google Scholar] [CrossRef]
- de la Rosa, S.; Mayuet, P.F.; Silva, C.S.; Sampaio, Á.M.; Rodríguez-Parada, L. Design and characterization of 3D-printed TPU-based lattice structures. Application to methodology for the design of personalized therapeutic products. Rapid Prototyp. J. 2024, 30, 72–86. [Google Scholar] [CrossRef]
- Oladapo, B.I.; Omigbodun, F.T.; Olawumi, M.A. Medical additive manufacturing then, now, and will. Med. Addit. Manuf. 2024, 381–400. [Google Scholar]
- Chen, Y. Cutting-Edge Additive Manufacturing Technology for Titanium-Based Alloys. Highlights Sci. Eng. Technol. 2024, 84, 92–98. [Google Scholar] [CrossRef]
- Li, G.; Wang, L.; Pan, W.; Yang, F.; Jiang, W.; Wu, X.; Kong, X.; Dai, K.; Hao, Y. In vitro and in vivo study of additive manufactured porous Ti6Al4V scaffolds for repairing bone defects. Sci. Rep. 2016, 6, 34072. [Google Scholar]
- Altankov, G.; Grinnell, F.; Groth, T. Studies on the biocompatibility of materials: Fibroblast reorganization of substratum-bound fibronectin on surfaces varying in wettability. J. Biomed. Mater. Res. 1996, 30, 385–391. [Google Scholar] [CrossRef]
- Bacakova, L.; Filova, E.; Parizek, M.; Ruml, T.; Svorcik, V. Modulation of cell adhesion, proliferation and differentiation on materials designed for body implants. Biotechnol. Adv. 2011, 29, 739–767. [Google Scholar] [CrossRef] [PubMed]
- Wilson, C.J.; Clegg, R.E.; Leavesley, D.I.; Pearcy, M.J. Mediation of biomaterial-cell interactions by adsorbed proteins: A review. Tissue Eng. 2005, 11, 1–18. [Google Scholar] [CrossRef] [PubMed]
- dos Santos, E.A.; Farina, M.; Soares, G.A.; Anselme, K. Surface energy of hydroxyapatite and beta-tricalcium phosphate ceramics driving serum protein adsorption and osteoblast adhesion. J. Mater. Sci. Mater. Med. 2008, 19, 2307–2316. [Google Scholar] [CrossRef]
- Khan, S.N.; Bostrom, M.P.; Lane, J.M. Bone growth factors. Orthop. Clin. N. Am. 2000, 31, 375–388. [Google Scholar] [CrossRef]
- Zhang, X.F.; Wang, Z.X.; Zhang, B.W.; Huang, K.P.; Ren, T.X.; Wang, T.; Cheng, X.; Hu, P.; Xu, W.H.; Li, J.; et al. TGF-β1-triggered BMI1 and SMAD2 cooperatively regulate miR-191 to modulate bone formation. Mol. Ther. Nucleic Acids 2024, 35, 102164. [Google Scholar] [CrossRef]
- Jann, J.; Gascon, S.; Roux, S.; Faucheux, N. Influence of the TGF-β Superfamily on Osteoclasts/Osteoblasts Balance in Physiological and Pathological Bone Conditions. Int. J. Mol. Sci. 2020, 21, 7597. [Google Scholar] [CrossRef]
- Moon, Y.J.; Yun, C.Y.; Choi, H.; Ka, S.O.; Kim, J.R.; Park, B.H.; Cho, E.S. Smad4 controls bone homeostasis through regulation of osteoblast/osteocyte viability. Exp. Mol. Med. 2016, 48, e256. [Google Scholar] [CrossRef]
- Blinova, M.; Yudintzeva, N.; Nikolaenko, N.; Potokin, I.; Raykhtsaum, G.; Pitkin, M.; Pinaev, G. Cell Cultivation on Porous Titanium Implants with Various Structures. Cell Tissue Biol. 2010, 4, 572–579. [Google Scholar] [CrossRef]
- Farrell, B.; Pitkin, M.; Popat, K.; Prilutsky, B. Effect of pore size, implantation time and nano-surface properties on rat skin ingrowth into porous titanium. In Proceedings of the 4th International Conference Advances in Orthopaedic Osseointegration, UCSF, San Francisco, CA, USA, 10–12 February 2012; p. 13. [Google Scholar]
- Liang, W.; Zhou, C.; Bai, J.; Zhang, H.; Long, H.; Jiang, B.; Dai, H.; Wang, J.; Zhang, H.; Zhao, J. Current developments and future perspectives of nanotechnology in orthopedic implants: An updated review. Front. Bioeng. Biotechnol. 2024, 12, 1342340. [Google Scholar] [CrossRef] [PubMed]
- Abaszadeh, F.; Ashoub, M.H.; Khajouie, G.; Amiri, M. Nanotechnology development in surgical applications: Recent trends and developments. Eur. J. Med. Res. 2023, 28, 537. [Google Scholar] [CrossRef] [PubMed]
- Chen, L.; Zhou, C.; Jiang, C.; Huang, X.; Liu, Z.; Zhang, H.; Liang, W.; Zhao, J. Translation of nanotechnology-based implants for orthopedic applications: Current barriers and future perspective. Front. Bioeng. Biotechnol. 2023, 11, 1206806. [Google Scholar] [CrossRef] [PubMed]
- Lekhavadhani, S.; Shanmugavadivu, A.; Selvamurugan, N. Role and architectural significance of porous chitosan-based scaffolds in bone tissue engineering. Int. J. Biol. Macromol. 2023, 251, 126238. [Google Scholar] [CrossRef]
- Distefano, F.; Pasta, S.; Epasto, G. Titanium Lattice Structures Produced via Additive Manufacturing for a Bone Scaffold: A Review. J. Funct. Biomater. 2023, 14, 125. [Google Scholar] [CrossRef]
- Flores-Jiménez, M.S.; Garcia-Gonzalez, A.; Fuentes-Aguilar, R.Q. Review on Porous Scaffolds Generation Process: A Tissue Engineering Approach. ACS Appl. Bio Mater. 2023, 6, 1–23. [Google Scholar] [CrossRef]
- Zhang, Z.Z.; Jiang, D.; Ding, J.X.; Wang, S.J.; Zhang, L.; Zhang, J.Y.; Qi, Y.S.; Chen, X.S.; Yu, J.K. Role of scaffold mean pore size in meniscus regeneration. Acta Biomater. 2016, 43, 314–326. [Google Scholar] [CrossRef]
- Prananingrum, W.; Naito, Y.; Galli, S.; Bae, J.; Sekine, K.; Hamada, K.; Tomotake, Y.; Wennerberg, A.; Jimbo, R.; Ichikawa, T. Bone ingrowth of various porous titanium scaffolds produced by a moldless and space holder technique: An in vivo study in rabbits. Biomed. Mater. 2016, 11, 015012. [Google Scholar] [CrossRef]
- Wang, X.; Xu, S.; Zhou, S.; Xu, W.; Leary, M.; Choong, P.; Qian, M.; Brandt, M.; Xie, Y.M. Topological design and additive manufacturing of porous metals for bone scaffolds and orthopaedic implants: A review. Biomaterials 2016, 83, 127–141. [Google Scholar] [CrossRef]
- Van Bael, S.; Chai, Y.C.; Truscello, S.; Moesen, M.; Kerckhofs, G.; Van Oosterwyck, H.; Kruth, J.P.; Schrooten, J. The effect of pore geometry on the in vitro biological behavior of human periosteum-derived cells seeded on selective laser-melted Ti6Al4V bone scaffolds. Acta Biomater. 2012, 8, 2824–2834. [Google Scholar] [CrossRef]
- Chen, Z.; Yan, X.; Yin, S.; Liu, L.; Liu, X.; Zhao, G.; Ma, W.; Qi, W.; Ren, Z.; Liao, H.; et al. Influence of the pore size and porosity of selective laser melted Ti6Al4V ELI porous scaffold on cell proliferation, osteogenesis and bone ingrowth. Mater. Sci. Eng. C Mater. Biol. Appl. 2020, 106, 110289. [Google Scholar] [CrossRef] [PubMed]
- Ouyang, P.; Dong, H.; He, X.; Cai, X.; Wang, Y.; Li, J.; Li, H.; Jin, Z. Hydromechanical mechanism behind the effect of pore size of porous titanium scaffolds on osteoblast response and bone ingrowth. Mater. Des. 2019, 183, 108151. [Google Scholar] [CrossRef]
- Luan, H.; Wang, L.; Ren, W.; Chu, Z.; Huang, Y.; Lu, C.; Fan, Y. The effect of pore size and porosity of Ti6Al4V scaffolds on MC3T3-E1 cells and tissue in rabbits. Sci. China Technol. Sci. 2019, 62, 1160–1168. [Google Scholar] [CrossRef]
- Ran, Q.; Yang, W.; Hu, Y.; Shen, X.; Yu, Y.; Xiang, Y.; Cai, K. Osteogenesis of 3D printed porous Ti6Al4V implants with different pore sizes. J. Mech. Behav. Biomed. Mater. 2018, 84, 1–11. [Google Scholar] [CrossRef] [PubMed]
- Taniguchi, N.; Fujibayashi, S.; Takemoto, M.; Sasaki, K.; Otsuki, B.; Nakamura, T.; Matsushita, T.; Kokubo, T.; Matsuda, S. Effect of pore size on bone ingrowth into porous titanium implants fabricated by additive manufacturing: An in vivo experiment. Mater. Sci. Eng. C Mater. Biol. Appl. 2016, 59, 690–701. [Google Scholar] [CrossRef]
- Parisien, A.; ElSayed, M.S.A.; Frei, H. Mechanoregulation modelling of stretching versus bending dominated periodic cellular solids. Mater. Today Commun. 2022, 33, 104315. [Google Scholar] [CrossRef]
- Shalabi, M.M.; Gortemaker, A.; Van’t Hof, M.A.; Jansen, J.A.; Creugers, N.H. Implant surface roughness and bone healing: A systematic review. J. Dent. Res. 2006, 85, 496–500. [Google Scholar] [CrossRef]
- Feller, L.; Chandran, R.; Khammissa, R.A.; Meyerov, R.; Jadwat, Y.; Bouckaert, M.; Schechter, I.; Lemmer, J. Osseointegration: Biological events in relation to characteristics of the implant surface. SADJ 2014, 69, 112–117. [Google Scholar]
- Im, J.S.; Choi, H.; An, H.W.; Kwon, T.Y.; Hong, M.H. Effects of Surface Treatment Method Forming New Nano/Micro Hierarchical Structures on Attachment and Proliferation of Osteoblast-like Cells. Materials 2023, 16, 5717. [Google Scholar] [CrossRef]
- Wang, S.; Zhao, X.; Hsu, Y.; He, Y.; Wang, F.; Yang, F.; Yan, F.; Xia, D.; Liu, Y. Surface modification of titanium implants with Mg-containing coatings to promote osseointegration. Acta Biomater. 2023, 169, 19–44. [Google Scholar] [CrossRef]
- Zemtsova, E.G.; Yudintceva, N.M.; Morozov, P.E.; Valiev, R.Z.; Smirnov, V.M.; Shevtsov, M.A. Improved osseointegration properties of hierarchical microtopographic/nanotopographic coatings fabricated on titanium implants. Int. J. Nanomed. 2018, 13, 2175–2188. [Google Scholar] [CrossRef] [PubMed]
- Berger, M.B.; Slosar, P.; Schwartz, Z.; Cohen, D.J.; Goodman, S.B.; Anderson, P.A.; Boyan, B.D. A Review of Biomimetic Topographies and Their Role in Promoting Bone Formation and Osseointegration: Implications for Clinical Use. Biomimetics 2022, 7, 46. [Google Scholar] [CrossRef] [PubMed]
- Ren, B.; Wan, Y.; Liu, C.; Wang, H.; Yu, M.; Zhang, X.; Huang, Y. Improved osseointegration of 3D printed Ti-6Al-4V implant with a hierarchical micro/nano surface topography: An in vitro and in vivo study. Mater. Sci. Eng. C Mater. Biol. Appl. 2021, 118, 111505. [Google Scholar] [CrossRef] [PubMed]
- Shu, T.; Zhang, Y.; Sun, G.; Pan, Y.; He, G.; Cheng, Y.; Li, A.; Pei, D. Enhanced Osseointegration by the Hierarchical Micro-Nano Topography on Selective Laser Melting Ti-6Al-4V Dental Implants. Front. Bioeng. Biotechnol. 2020, 8, 621601. [Google Scholar] [CrossRef] [PubMed]
- Calazans Neto, J.V.; Reis, A.C.D.; Valente, M. Osseointegration in additive-manufactured titanium implants: A systematic review of animal studies on the need for surface treatment. Heliyon 2023, 9, e17105. [Google Scholar] [CrossRef]
- Wieding, J.; Lindner, T.; Bergschmidt, P.; Bader, R. Biomechanical stability of novel mechanically adapted open-porous titanium scaffolds in metatarsal bone defects of sheep. Biomaterials 2015, 46, 35–47. [Google Scholar] [CrossRef]
- Bittredge, O.; Hassanin, H.; El-Sayed, M.A.; Eldessouky, H.M.; Alsaleh, N.A.; Alrasheedi, N.H.; Essa, K.; Ahmadein, M. Fabrication and Optimisation of Ti-6Al-4V Lattice-Structured Total Shoulder Implants Using Laser Additive Manufacturing. Materials 2022, 15, 3095. [Google Scholar] [CrossRef]
- Naghavi, S.A.; Tamaddon, M.; Garcia-Souto, P.; Moazen, M.; Taylor, S.; Hua, J.; Liu, C. A novel hybrid design and modelling of a customised graded Ti-6Al-4V porous hip implant to reduce stress-shielding: An experimental and numerical analysis. Front. Bioeng. Biotechnol. 2023, 11, 1092361. [Google Scholar] [CrossRef]
- Goto, M.; Matsumine, A.; Yamaguchi, S.; Takahashi, H.; Akeda, K.; Nakamura, T.; Asanuma, K.; Matsushita, T.; Kokubo, T.; Sudo, A. Osteoconductivity of bioactive Ti-6Al-4V implants with lattice-shaped interconnected large pores fabricated by electron beam melting. J. Biomater. Appl. 2021, 35, 1153–1167. [Google Scholar] [CrossRef]
- Alagar Boopathy, L.R.; Jacob-Tomas, S.; Alecki, C.; Vera, M. Mechanisms tailoring the expression of heat shock proteins to proteostasis challenges. J. Biol. Chem. 2022, 298, 101796. [Google Scholar] [CrossRef]
- Lewis, V.A.; Hynes, G.M.; Zheng, D.; Saibil, H.; Willison, K. T-complex polypeptide-1 is a subunit of a heteromeric particle in the eukaryotic cytosol. Nature 1992, 358, 249–252. [Google Scholar] [CrossRef] [PubMed]
- Deng, H.; Dutta, P.; Liu, J. Stochastic modeling of nanoparticle internalization and expulsion through receptor-mediated transcytosis. Nanoscale 2019, 11, 11227–11235. [Google Scholar] [CrossRef] [PubMed]
- Borrelli, M.J.; Lepock, J.R.; Frey, H.E.; Lee, Y.J.; Corry, P.M. Excess protein in nuclei isolated from heat-shocked cells results from a reduced extractability of nuclear proteins. J. Cell. Physiol. 1996, 167, 369–379. [Google Scholar] [CrossRef]
- Chimutengwende-Gordon, M.; Dowling, R.; Pendegrass, C.; Blunn, G. Determining the porous structure for optimal soft-tissue ingrowth: An in vivo histological study. PLoS ONE 2018, 13, e0206228. [Google Scholar] [CrossRef] [PubMed]
- Pura, J.A.; Bobyn, J.D.; Tanzer, M. Implant-delivered Alendronate Causes a Dose-dependent Response on Net Bone Formation Around Porous Titanium Implants in Canines. Clin. Orthop. Relat. Res. 2016, 474, 1224–1233. [Google Scholar] [CrossRef] [PubMed]
- Markel, D.C.; Dietz, P.; Provenzano, G.; Bou-Akl, T.; Ren, W.P. Attachment and Growth of Fibroblasts and Tenocytes Within a Porous Titanium Scaffold: A Bioreactor Approach. Arthroplast. Today 2022, 14, 231–236.e1. [Google Scholar] [CrossRef]
- Guo, T.; Gulati, K.; Arora, H.; Han, P.; Fournier, B.; Ivanovski, S. Orchestrating soft tissue integration at the transmucosal region of titanium implants. Acta Biomater. 2021, 124, 33–49. [Google Scholar] [CrossRef]
- Nazarov, D.; Ezhov, I.; Yudintceva, N.; Shevtsov, M.; Rudakova, A.; Kalganov, V.; Tolmachev, V.; Zharova, Y.; Lutakov, O.; Kraeva, L.; et al. Antibacterial and Osteogenic Properties of Ag Nanoparticles and Ag/TiO(2) Nanostructures Prepared by Atomic Layer Deposition. J. Funct. Biomater. 2022, 13, 62. [Google Scholar] [CrossRef]
- Junker, R.; Dimakis, A.; Thoneick, M.; Jansen, J.A. Effects of implant surface coatings and composition on bone integration: A systematic review. Clin. Oral Implant. Res. 2009, 20 (Suppl. S4), 185–206. [Google Scholar] [CrossRef]
- Alghamdi, H.S.; van Oirschot, B.A.; Bosco, R.; van den Beucken, J.J.; Aldosari, A.A.; Anil, S.; Jansen, J.A. Biological response to titanium implants coated with nanocrystals calcium phosphate or type 1 collagen in a dog model. Clin. Oral Implant. Res. 2013, 24, 475–483. [Google Scholar] [CrossRef]
- Lee, S.W.; Hahn, B.D.; Kang, T.Y.; Lee, M.J.; Choi, J.Y.; Kim, M.K.; Kim, S.G. Hydroxyapatite and collagen combination-coated dental implants display better bone formation in the peri-implant area than the same combination plus bone morphogenetic protein-2-coated implants, hydroxyapatite only coated implants, and uncoated implants. J. Oral Maxillofac. Surg. 2014, 72, 53–60. [Google Scholar] [CrossRef] [PubMed]
- Haimov, H.; Yosupov, N.; Pinchasov, G.; Juodzbalys, G. Bone Morphogenetic Protein Coating on Titanium Implant Surface: A Systematic Review. J. Oral Maxillofac. Res. 2017, 8, e1. [Google Scholar] [CrossRef] [PubMed]
- Ramazanoglu, M.; Lutz, R.; Rusche, P.; Trabzon, L.; Kose, G.T.; Prechtl, C.; Schlegel, K.A. Bone response to biomimetic implants delivering BMP-2 and VEGF: An immunohistochemical study. J. Craniomaxillofac. Surg. 2013, 41, 826–835. [Google Scholar] [CrossRef] [PubMed]
- Bouyer, M.; Guillot, R.; Lavaud, J.; Plettinx, C.; Olivier, C.; Curry, V.; Boutonnat, J.; Coll, J.L.; Peyrin, F.; Josserand, V.; et al. Surface delivery of tunable doses of BMP-2 from an adaptable polymeric scaffold induces volumetric bone regeneration. Biomaterials 2016, 104, 168–181. [Google Scholar] [CrossRef] [PubMed]
- Jiang, Q.H.; Liu, L.; Peel, S.; Yang, G.L.; Zhao, S.F.; He, F.M. Bone response to the multilayer BMP-2 gene coated porous titanium implant surface. Clin. Oral Implant. Res. 2013, 24, 853–861. [Google Scholar] [CrossRef]
- Kim, S.E.; Kim, C.S.; Yun, Y.P.; Yang, D.H.; Park, K.; Kim, S.E.; Jeong, C.M.; Huh, J.B. Improving osteoblast functions and bone formation upon BMP-2 immobilization on titanium modified with heparin. Carbohydr. Polym. 2014, 114, 123–132. [Google Scholar] [CrossRef]

| Gene | Primers (5′-3′) | Product Length (bp) |
|---|---|---|
| Fibronectin | Fwd TGCAGTGGCTGAAGTCGCAAGG Rev GGGCTCCCCGTTTGAATTGCCA | 119 |
| Vitronectin | Fwd TGTTGATGCAGCGTTCGCCCT Rev TCCTGGCTGGGTTGCTGCTGAA | 114 |
| Type I collagen | Fwd CTCCTGACGCATGGCCAAGAA Rev TCAAGCATACCTCGGGTTTCCA | 100 |
| α2 integrin | Fwd AAGTGCCCTGTGGACCTACCCA Rev TGGTGAGGGTCAATCCCAGGCT | 119 |
| α5 integrin | Fwd ACCACCTGCAGAAACGAGAGGC Rev TGGCCCAAACTCACAGCGCA | 111 |
| αV integrin | Fwd TCCCACCGCAGGCTGACTTCAT Rev TCGGGTTTCCAAGGTCGCACAC | 121 |
| β1 integrin | Fwd TTCAGACTTCCGCATTGGCT Rev AATGGGCTGGTGCAGTTTTG | 122 |
| FAK | Fwd AGCACCTGGCCACCTAAGCAAC Rev CATTGGACCGGTCAAGGTTGGCA | 125 |
| Paxillin | Fwd AGGGCCTGGAACAGAGAGTGGA Rev AGCTGCTCCCAGTTTTCCCCTG | 129 |
| Vinculin | Fwd TCAAGCTGTTGGCAGTAGCCGC Rev TCTCTGCTGTGGCTCCAAGCCT | 120 |
| Osteocalcin | Fwd AGCAGGAGGGCAATAAGGTAGT Rev TCGTCACAAGCAGGGTTAAGC | 118 |
| Osteopontin | Fwd TGATTCTGGCAGCTCAGAGGA Rev CATTCTGTGGCGCAAGGAGATT | 110 |
| Osteonectin | Fwd ATGTCCTGGTCACCTTGTACGA Rev TCCAGGCGCTTCTCATTCTCAT | 103 |
| TGF-β1 | Fwd ACCCGCGTGCTAATGGTGGA Rev GGGCACTGCTTCCCGAATGTCT | 111 |
| SMAD4 | Fwd AGCCAGGACAGCAGCAGAATGGA Rev ATGGCCGTTTTGGTGGTGAGGC | 128 |
| S1 | S2 | S3 | S4 | S5 | S6 | S7 | S8 | S9 | Sintered Ti | |
|---|---|---|---|---|---|---|---|---|---|---|
| Day 1 | 95.10 (1.05) | 94.57 (2.29) | 93.83 (1.90) | 92.53 (2.20) | 95.20 (3.87) | 96.20 (1.11) | 95.80 (4.24) | 95.83 (1.48) | 91.67 (1.97) | 95.02 (2.14) |
| Day 3 | 95.43 (1.76) | 96.77 (1.10) | 94.00 (3.48) | 95.47 (2.58) | 95.80 (4.42) | 94.53 (3.65) | 95.30 (2.15) | 96.87 (1.71) | 94.83 (1.91) | 93.20 (2.08) |
| Day 7 | 86.93 (2.48) | 87.57 (2.63) | 87.73 (3.29) | 85.43 (2.43) | 89.67 (2.97) | 87.40 (3.04) | 85.83 (3.31) | 86.27 (1.83) | 88.07 (2.84) | 83.46 (2.19) |
| Day 14 | 83.57 (4.15) | 85.20 (2.00) | 84.60 (1.57) | 84.17 (1.71) | 87.20 (1.01) | 85.27 (1.18) | 85.43 (2.35) | 84.17 (1.22) | 85.50 (1.30) | 80.79 (2.69) |
| S1 | S2 | S3 | S4 | S5 | S6 | S7 | S8 | S9 | Sintered Ti | |
|---|---|---|---|---|---|---|---|---|---|---|
| Day 1 | 96.20 (1.35) | 95.83 (0.87) | 96.47 (1.66) | 95.37 (1.46) | 97.87 (0.45) | 96.50 (0.79) | 97.27 (0.95) | 96.37 (2.14) | 95.93 (2.59) | 94.41 (2.62) |
| Day 3 | 94.80 (1.31) | 94.27 (1.35) | 96.27 (0.45) | 94.77 (2.14) | 94.77 (1.42) | 95.20 (1.30) | 94.40 (1.37) | 93.27 (2.10) | 93.87 (1.42) | 93.23 (2.55) |
| Day 7 | 87.30 (1.71) | 86.93 (1.58) | 86.90 (0.10) | 84.93 (1.21) | 85.33 (1.18) | 85.77 (1.71) | 86.43 (1.12) | 86.47 (1.96) | 84.93 (1.76) | 83.02 (2.18) |
| Day 14 | 83.53 (0.78) | 83.33 (1.59) | 83.77 (1.69) | 83.47 (1.63) | 83.23 (2.30) | 84.30 (1.31) | 83.10 (0.98) | 83.87 (1.53) | 82.77 (1.42) | 78.90 (2.98) |
| α2 Integrin | ||||||||||
| S1 | S2 | S3 | S4 | S5 | S6 | S7 | S8 | S9 | Sintered Ti | |
| 4 h | 1.07 (0.15) | 1.03 (0.15) | 1.01 (0.04) | 1.14 (0.11) | 1.13 (0.09) | 1.21 (0.12) | 1.19 (0.02) | 1.35 (0.09) | 1.17 (0.04) | 1.18 (0.05) |
| 24 h | 1.14 (0.14) | 1.04 (0.13) | 1.19 (0.05) | 1.67 (0.14) | 1.80 (0.11) | 1.80 (0.06) | 1.77 (0.08) | 1.70 (0.09) | 1.12 (0.12) | 1.67 (0.08) |
| 48 h | 1.52 (0.16) | 1.41 (0.12) | 1.48 (0.09) | 1.86 (0.08) | 2.90 (0.12) | 2.95 (0.16) | 2.91 (0.07) | 3.21 (0.48) | 2.62 (0.18) | 2.78 (0.07) |
| 72 h | 2.08 (0.30) | 2.34 (0.06) | 2.32 (0.36) | 2.53 (0.39) | 2.88 (0.13) | 4.71 (0.08) | 4.70 (0.02) | 4.77 (0.06) | 4.27 (0.24) | 4.40 (0.14) |
| α5 Integrin | ||||||||||
| S1 | S2 | S3 | S4 | S5 | S6 | S7 | S8 | S9 | Sintered Ti | |
| 4 h | 1.20 (0.10) | 1.13 (0.12) | 1.19 (0.03) | 1.19 (0.11) | 1.14 (0.07) | 1.19 (0.07) | 1.23 (0.12) | 1.36 (0.09) | 1.23 (0.06) | 1.25 (0.05) |
| 24 h | 1.44 (0.77) | 1.11 (0.07) | 1.10 (0.07) | 1.75 (0.14) | 1.72 (0.09) | 1.84 (0.05) | 1.83 (0.14) | 1.50 (0.08) | 1.15 (0.15) | 1.82 (0.12) |
| 48 h | 1.95 (0.15) | 1.81 (0.03) | 1.65 (0.05) | 1.83 (0.09) | 2.73 (0.08) | 3.02 (0.04) | 3.10 (0.06) | 2.95 (0.11) | 2.49 (0.35) | 2.90 (0.14) |
| 72 h | 2.59 (0.20) | 2.61 (0.15) | 2.46 (0.08) | 2.77 (0.21) | 2.95 (0.22) | 4.96 (0.08) | 4.95 (0.19) | 4.82 (0.17) | 4.31 (0.42) | 4.69 (0.16) |
| αV Integrin | ||||||||||
| S1 | S2 | S3 | S4 | S5 | S6 | S7 | S8 | S9 | Sintered Ti | |
| 4 h | 0.98 (0.38) | 0.94 (0.03) | 1.06 (0.02) | 1.14 (0.03) | 1.11 (0.09) | 1.29 (0.06) | 1.32 (0.08) | 1.36 (0.02) | 1.24 (0.41) | 1.33 (0.06) |
| 24 h | 1.10 (0.01) | 1.10 (0.07) | 1.16 (0.06) | 1.48 (0.05) | 1.46 (0.10) | 1.52 (0.34) | 1.39 (0.04) | 1.37 (0.06) | 1.26 (0.23) | 1.53 (0.11) |
| 48 h | 1.82 (0.31) | 1.57 (0.09) | 1.44 (0.10) | 1.80 (0.06) | 2.96 (0.09) | 3.36 (0.14) | 3.25 (0.20) | 3.07 (0.39) | 2.74 (0.20) | 3.07 (0.07) |
| 72 h | 2.22 (0.21) | 2.45 (0.22) | 2.28 (0.24) | 2.81 (0.07) | 3.17 (0.16) | 4.71 (0.05) | 4.96 (0.23) | 4.94 (0.15) | 4.65 (0.23) | 4.73 (0.32) |
| β1 Integrin | ||||||||||
| S1 | S2 | S3 | S4 | S5 | S6 | S7 | S8 | S9 | Sintered Ti | |
| 4 h | 0.62 (0.06) | 0.55 (0.05) | 0.71 (0.30) | 1.03 (0.09) | 0.83 (0.07) | 0.85 (0.12) | 1.00 (0.04) | 0.83 (0.09) | 0.76 (0.10) | 1.09 (0.05) |
| 24 h | 0.79 (0.14) | 0.92 (0.16) | 1.01 (0.02) | 0.97 (0.11) | 1.12 (0.09) | 0.81 (0.18) | 1.04 (0.07) | 1.12 (0.18) | 0.91 (0.17) | 1.16 (0.08) |
| 48 h | 0.84 (0.07) | 0.94 (0.15) | 0.89 (0.19) | 1.10 (0.06) | 1.35 (0.23) | 1.70 (0.06) | 1.48 (0.09) | 1.19 (0.16) | 1.60 (0.29) | 1.71 (0.08) |
| 72 h | 1.03 (0.07) | 1.06 (0.28) | 1.15 (0.14) | 1.22 (0.03) | 1.47 (0.05) | 1.87 (0.12) | 1.90 (0.10) | 1.75 (0.10) | 1.35 (0.15) | 1.89 (0.15) |
| Fibronectin | ||||||||||
| S1 | S2 | S3 | S4 | S5 | S6 | S7 | S8 | S9 | Sintered Ti | |
| 4 h | 1.26 (0.05) | 1.47 (0.09) | 1.61 (0.07) | 1.61 (0.37) | 1.59 (0.22) | 1.73 (0.13) | 1.33 (0.14) | 1.35 (0.05) | 1.27 (0.07) | 1.50 (0.07) |
| 72 h | 2.55 (0.22) | 2.74 (0.10) | 2.61 (0.22) | 2.90 (0.17) | 3.81 (0.04) | 4.70 (0.09) | 4.76 (0.12) | 4.81 (0.19) | 4.13 (0.15) | 4.55 (0.11) |
| Vitronectin | ||||||||||
| S1 | S2 | S3 | S4 | S5 | S6 | S7 | S8 | S9 | Sintered Ti | |
| 4 h | 1.38 (0.05) | 1.81 (0.11) | 1.62 (0.27) | 1.71 (0.04) | 1.50 (0.23) | 2.08 (0.08) | 1.54 (0.16) | 1.38 (0.08) | 2.02 (0.15) | 1.89 (0.10) |
| 72 h | 2.90 (0.17) | 2.87 (0.15) | 2.83 (0.09) | 2.86 (0.06) | 3.84 (0.19) | 4.64 (0.33) | 4.79 (0.02) | 4.63 (0.08) | 4.54 (0.33) | 4.69 (0.10) |
| Type I Collagen | ||||||||||
| S1 | S2 | S3 | S4 | S5 | S6 | S7 | S8 | S9 | Sintered Ti | |
| 4 h | 1.32 (0.08) | 1.40 (0.15) | 1.71 (0.13) | 1.85 (0.23) | 2.35 (0.25) | 2.16 (0.14) | 2.22 (0.14) | 2.05 (0.20) | 2.13 (0.16) | 2.12 (0.12) |
| 72 h | 3.10 (0.11) | 3.09 (0.09) | 3.01 (0.06) | 3.11 (0.08) | 4.02 (0.09) | 4.64 (0.57) | 4.75 (0.16) | 4.54 (0.26) | 4.76 (0.24) | 4.42 (0.22) |
| FAK | Vincullin | Paxillin | ||||||||||
|---|---|---|---|---|---|---|---|---|---|---|---|---|
| Samples | Day 1 | Day 3 | Day 7 | Day 14 | Day 1 | Day 3 | Day 7 | Day 14 | Day 1 | Day 3 | Day 7 | Day 14 |
| S1 | 0.88 (0.11) | 1.94 (0.1) | 2.67 (0.43) | 3.82 (0.17) | 0.38 (0.16) | 0.84 (0.04) | 1.28 (0.02) | 2.35 (0.17) | 1.02 (0.08) | 2.07 (0.12) | 3.43 (0.23) | 4.48 (0.29) |
| S2 | 0.85 (0.14) | 2.16 (0.06) | 2.73 (0.36) | 3.76 (0.63) | 0.4 (0.04) | 0.93 (0.12) | 1.46 (0.15) | 2.45 (0.4) | 1.16 (0.06) | 2.18 (0.2) | 3.27 (0.42) | 4.53 (0.3) |
| S3 | 0.65 (0.26) | 2.05 (0.1) | 3.03 (0.14) | 4.11 (0.09) | 0.49 (0.07) | 1.02 (0.08) | 2.08 (0.1) | 3.57 (0.2) | 1.08 (0.28) | 2.7 (0.3) | 3.98 (0.14) | 5.15 (0.45) |
| S4 | 0.98 (0.06) | 2.22 (0.13) | 3.1 (0.13) | 4.2 (0.09) | 0.79 (0.03) | 1.94 (0.07) | 2.85 (0.11) | 4.1 (0.17) | 1.36 (0.15) | 3.99 (0.07) | 4.49 (0.11) | 5.69 (0.37) |
| S5 | 0.63 (0.17) | 2.06 (0.06) | 2.99 (0.05) | 4.36 (0.13) | 0.78 (0.13) | 1.93 (0.1) | 2.82 (0.29) | 4.08 (0.04) | 1.38 (0.1) | 3.81 (0.19) | 4.98 (0.06) | 5.57 (0.26) |
| S6 | 0.71 (0.03) | 1.91 (0.17) | 2.14 (0.06) | 3.62 (0.2) | 0.75 (0.07) | 1.05 (0.06) | 1.63 (0.14) | 3.05 (0.07) | 1.13 (0.17) | 2.43 (0.16) | 3.37 (0.39) | 4.88 (0.12) |
| S7 | 0.68 (0.05) | 1.79 (0.35) | 2.16 (0.18) | 3.14 (0.23) | 0.61 (0.2) | 0.89 (0.09) | 1.24 (0.13) | 2.03 (0.05) | 1.12 (0.25) | 2.04 (0.22) | 2.92 (0.1) | 3.08 (0.32) |
| S8 | 0.44 (0.23) | 1.69 (0.09) | 2.04 (0.41) | 3.1 (0.11) | 0.6 (0.15) | 0.94 (0.13) | 1.21 (0.17) | 1.9 (0.17) | 0.93 (0.11) | 1.95 (0.13) | 2.18 (0.21) | 2.45 (0.35) |
| S9 | 0.7 (0.05) | 1.42 (0.56) | 1.8 (0.03) | 2.67 (0.31) | 0.56 (0.26) | 0.97 (0.06) | 1.16 (0.13) | 2.06 (0.2) | 1.06 (0.08) | 1.84 (0.26) | 1.9 (0.23) | 2.19 (0.13) |
| Sintered Ti | 0.65 (0.06) | 1.77 (0.12) | 2.22 (0.11) | 3.01 (0.14) | 0.63 (0.06) | 0.95 (0.12) | 1.52 (0.09) | 2.15 (0.1) | 1.07 (0.06) | 2.14 (0.15) | 3.13 (0.12) | 3.47 (0.28) |
| Osteocalcin | Osteopontin | Osteonectin | ||||||||||
|---|---|---|---|---|---|---|---|---|---|---|---|---|
| Samples | Day 1 | Day 3 | Day 7 | Day 14 | Day 1 | Day 3 | Day 7 | Day 14 | Day 1 | Day 3 | Day 7 | Day 14 |
| S1 | 0.86 (0.14) | 1.78 (0.11) | 3.06 (0.61) | 4.25 (0.35) | 0.9 (0.06) | 2.18 (0.29) | 5.2 (0.47) | 8.19 (0.58) | 1.07 (0.07) | 2.24 (0.3) | 3.13 (0.12) | 5.02 (0.23) |
| S2 | 0.89 (0.05) | 1.94 (0.22) | 2.74 (0.22) | 3.96 (0.08) | 0.94 (0.09) | 2.39 (0.04) | 5.64 (0.52) | 8.99 (0.45) | 1.12 (0.17) | 2.66 (0.1) | 3.26 (0.11) | 5.84 (0.21) |
| S3 | 0.71 (0.1) | 2.94 (0.08) | 3.61 (0.11) | 5.83 (0.27) | 1.26 (0.25) | 4.23 (0.55) | 7.5 (0.69) | 11.2 (0.42) | 1.33 (0.09) | 3.16 (0.13) | 4.36 (0.18) | 6.83 (0.6) |
| S4 | 1.09 (0.17) | 3.29 (0.11) | 5.02 (0.22) | 6.08 (0.12) | 1.49 (0.49) | 5.42 (0.54) | 8.59 (0.66) | 11.19 (0.77) | 1.32 (0.09) | 3.92 (0.48) | 5.17 (0.17) | 7.15 (0.29) |
| S5 | 1.14 (0.06) | 3.17 (0.14) | 5.14 (0.07) | 6.22 (0.14) | 1.87 (0.61) | 5.5 (0.63) | 8.13 (0.14) | 10.59 (0.46) | 1.35 (0.24) | 4.01 (0.12) | 5.16 (0.14) | 7.02 (0.2) |
| S6 | 0.95 (0.1) | 2.76 (0.07) | 3.31 (0.12) | 5.17 (0.16) | 1.99 (0.22) | 3.94 (0.75) | 6.48 (0.44) | 9.3 (0.29) | 1.09 (0.14) | 3.1 (0.13) | 3.8 (0.5) | 6.03 (0.32) |
| S7 | 0.77 (0.06) | 1.68 (0.12) | 2.65 (0.23) | 3.21 (0.56) | 0.79 (0.18) | 1.87 (0.12) | 2.64 (0.12) | 4.3 (0.27) | 1.04 (0.11) | 2.07 (0.07) | 2.27 (0.07) | 3.46 (0.41) |
| S8 | 0.74 (0.18) | 1.43 (0.18) | 2.37 (0.2) | 2.57 (0.2) | 0.77 (0.05) | 2.02 (0.03) | 2.48 (0.12) | 3.05 (0.1) | 0.81 (0.23) | 1.65 (0.15) | 2.17 (0.22) | 2.86 (0.16) |
| S9 | 0.69 (0.28) | 1.47 (0.15) | 2.04 (0.09) | 2.4 (0.18) | 0.82 (0.29) | 1.81 (0.36) | 2.01 (0.17) | 2.67 (0.51) | 0.66 (0.09) | 2.04 (0.06) | 2.01 (0.03) | 2.15 (0.06) |
| Sintered Ti | 0.92 (0.08) | 2.58 (0.16) | 3.33 (0.22) | 4.46 (0.3) | 1.3 (0.17) | 3.15 (0.38) | 4.61 (0.29) | 5.85 (0.4) | 1.2 (0.19) | 2.8 (0.15) | 3.55 (0.29) | 4.45 (0.36) |
| TGF-β1 | ||||||||||
| S1 | S2 | S3 | S4 | S5 | S6 | S7 | S8 | S9 | Sintered Ti | |
| Day 1 | 2.24 (0.07) | 2.14 (0.17) | 2.20 (0.13) | 2.28 (0.23) | 2.06 (0.07) | 1.94 (0.05) | 1.79 (0.10) | 1.75 (0.17) | 1.94 (0.08) | 1.74 (0.09) |
| Day 7 | 0.64 (0.06) | 0.66 (0.11) | 0.68 (0.08) | 0.83 (0.02) | 0.84 (0.03) | 0.74 (0.03) | 0.67 (0.20) | 0.74 (0.22) | 0.83 (0.12) | 1.91 (0.15) |
| SMAD4 | ||||||||||
| S1 | S2 | S3 | S4 | S5 | S6 | S7 | S8 | S9 | Sintered Ti | |
| Day 1 | 0.64 (0.13) | 0.66 (0.15) | 0.68 (0.13) | 0.83 (0.07) | 0.84 (0.09) | 0.74 (0.14) | 0.67 (0.14) | 0.74 (0.13) | 0.83 (0.16) | 0.73 (0.09) |
| Day 7 | 1.37 (0.10) | 1.44 (0.06) | 1.75 (0.07) | 1.79 (0.36) | 2.02 (0.16) | 1.11 (0.08) | 1.14 (0.16) | 1.13 (0.09) | 1.06 (0.08) | 1.17 (0.06) |
Disclaimer/Publisher’s Note: The statements, opinions and data contained in all publications are solely those of the individual author(s) and contributor(s) and not of MDPI and/or the editor(s). MDPI and/or the editor(s) disclaim responsibility for any injury to people or property resulting from any ideas, methods, instructions or products referred to in the content. |
© 2024 by the authors. Licensee MDPI, Basel, Switzerland. This article is an open access article distributed under the terms and conditions of the Creative Commons Attribution (CC BY) license (https://creativecommons.org/licenses/by/4.0/).
Share and Cite
Shevtsov, M.; Pitkin, E.; Combs, S.E.; Meulen, G.V.D.; Preucil, C.; Pitkin, M. Comparison In Vitro Study on the Interface between Skin and Bone Cell Cultures and Microporous Titanium Samples Manufactured with 3D Printing Technology Versus Sintered Samples. Nanomaterials 2024, 14, 1484. https://doi.org/10.3390/nano14181484
Shevtsov M, Pitkin E, Combs SE, Meulen GVD, Preucil C, Pitkin M. Comparison In Vitro Study on the Interface between Skin and Bone Cell Cultures and Microporous Titanium Samples Manufactured with 3D Printing Technology Versus Sintered Samples. Nanomaterials. 2024; 14(18):1484. https://doi.org/10.3390/nano14181484
Chicago/Turabian StyleShevtsov, Maxim, Emil Pitkin, Stephanie E. Combs, Greg Van Der Meulen, Chris Preucil, and Mark Pitkin. 2024. "Comparison In Vitro Study on the Interface between Skin and Bone Cell Cultures and Microporous Titanium Samples Manufactured with 3D Printing Technology Versus Sintered Samples" Nanomaterials 14, no. 18: 1484. https://doi.org/10.3390/nano14181484