Article

Sustainable Scalable Mechanochemical Synthesis of CdS/Bi2S3 Nanocomposites for Efficient Hydrogen Evolution

1
Department of General and Inorganic Chemistry, Al-Farabi Kazakh National University, Almaty 050040, Kazakhstan
2
National Laboratory Astana, Nazarbayev University, Astana 010000, Kazakhstan
3
Institute of Geotechnics, Slovak Academy of Sciences, 04001 Kosice, Slovakia
*
Author to whom correspondence should be addressed.
Nanomaterials 2024, 14(22), 1785; https://doi.org/10.3390/nano14221785
Submission received: 3 September 2024 / Revised: 16 October 2024 / Accepted: 17 October 2024 / Published: 6 November 2024

Abstract

:
In the present study, a green, scalable, and environmentally friendly approach was developed for the fabrication of Bi2S3-decorated CdS nanoparticles with an efficient hydrogen generation ability from the water. As a sulfur source, thiourea was used. The process was completed in two stages: mechanical activation and thermal annealing. The presence of spherical CdS nanoparticles and Bi2S3 nanorods in the CdS/Bi2S3 nanocomposite was confirmed and proved by XRD, Raman spectroscopy, SEM-EDS, and TEM. The synthesized CdS/Bi2S3 nanocomposites were evaluated for their photocatalytic hydrogen evolution capabilities. The CdS/Bi2S3 photocatalyst exhibited 25% higher photocatalytic activity compared to CdS, reaching a hydrogen evolution rate of 996.68 μmol h−1g−1 (AQE 0.87%) after 3.5 h under solar-light irradiation.

1. Introduction

The production of hydrogen has recently garnered considerable attention due to its potential as a clean and sustainable energy source. As the global community strives to address the challenges posed by climate change and reduce reliance on fossil fuels, hydrogen emerges as a promising alternative [1,2]. Its versatility and high energy content, as well as our capacity to produce it from a range of renewable sources, underscore its significance in achieving a low-carbon future [3].
Hydrogen generation can be achieved through various methods, including steam methane reforming [4], electrolysis [5], thermochemical water splitting [6], biological processes [7,8], and photocatalytic water splitting [9]. Each method presents unique advantages and challenges, with ongoing research focused on improving efficiency, reducing costs, and minimizing environmental impacts [10]. Photocatalytic water splitting, in particular, offers a promising approach by using sunlight and semiconductor materials to directly produce hydrogen from water [11].
Semiconductor nanomaterials are promising photocatalysts for hydrogen generation due to their unique properties, such as high surface area, efficient light absorption, suitable bandgap, and catalytic activity [12]. These nanomaterials, such as TiO2, ZnO, g-C3N4, CdS, and their binary [13,14] and ternary composites [15,16], are designed to absorb sunlight and facilitate the separation of water molecules into hydrogen and oxygen [17]. Among them, cadmium sulfide (CdS) is of particular interest due to its optimal bandgap energy and visible-light absorption, making it a highly effective material for hydrogen production [18,19]. However, its efficiency is limited by rapid electron–hole recombination and photocorrosion. To address these issues, CdS can be decorated with metal sulfides such as ZnS, CuS, NiS, MoS2, Bi2S3, etc. [20]. This approach leverages synergistic effects between different semiconductors, such as improved charge-separation efficiency, expanded light-absorption range, and enhanced catalytic activity [21]. Among the above-mentioned co-catalysts, Bi2S3 attracts particular interest due to its narrow bandgap, high absorption coefficient, and excellent photocatalytic properties [22]. The incorporation of Bi2S3 into CdS nanoparticles not only improves the light absorption capacity but also facilitates better charge separation and transfer. This results in reduced recombination rates of photogenerated electron–hole pairs, significantly enhancing the photocatalytic efficiency [23,24]. Furthermore, CdS/Bi2S3 photocatalysts present notable advantages, including enhanced stability, elevated catalytic activity, adjustable band structure, and cost-effectiveness [24,25]. These attributes render them highly appealing for a spectrum of photocatalytic applications, spanning from environmental remediation to renewable energy generation [26]. However, the CdS/Bi2S3 system has notable limitations, including photocorrosion, poor stability, rapid charge recombination, and inefficient charge transfer. Other challenges involve scalability issues, limited light absorption, Bi2S3 degradation, and suboptimal photoelectrochemical performance, all hindering practical applicability [27]. Addressing the limitations of the CdS/Bi2S3 system involves surface modification for stability, heterojunction engineering and co-catalyst decoration for improved charge separation, cadmium substitution to reduce toxicity, bandgap tuning for broader absorption, optimized synthesis for scalability, and nanostructuring to enhance photoelectrochemical performance [27,28].
The literature contains several papers demonstrating that CdS/Bi2S3 can generate hydrogen through water splitting. To illustrate this point, in the work [29], Yang et al. synthesized 2D Bi2S3/CdS nanosheet arrays through a three-step complex process and utilized them as photoanodes, achieving improved photoelectrochemical hydrogen evolution. Another CdS/Bi2S3 was prepared via a one-step solvothermal method and exhibited an exceptional photocatalytic hydrogen production performance [30]. Lately, binary CdS/Bi2S3 heterostructures were fabricated using ZnO/Bi2S3 as active intermediates. The highest photocatalytic hydrogen evolution reaction rate was 3.85 mmol∙g−1∙h−1 [31].
In addition to the abovementioned approaches, CdS/Bi2S3 nanocomposites can be synthesized also through techniques such as sonochemistry [23], hydrothermal [32], wet-chemistry approach [33], ion exchange [34,35], one-pot controlled synthesis [36], in situ fabrication [37], sol–gel [38], the SILAR method [39], chemical-bath deposition [40], and mechanochemical [41,42] in order to be employed in various applications. Nevertheless, the prevailing synthesis techniques, including sol–gel, hydrothermal, and chemical-bath deposition, are encumbered by considerable limitations [43]. These include the utilization of toxic solvents, intricate reaction conditions, and scalability challenges. In contrast, mechanochemical synthesis offers a solvent-free, environmentally friendly, and scalable alternative [44,45]. By employing mechanical energy to propel the reaction, our methodology obviates the necessity for deleterious solvents, streamlines the process, and permits synthesis under ambient conditions [42]. Moreover, the ball-milling process fosters superior contact between CdS and Bi2S3, thereby enhancing charge separation and augmenting photocatalytic efficacy.
This study aims to develop a cost-effective, solvent-free, and scalable method for synthesizing Bi2S3-decorated CdS nanoparticles with enhanced photocatalytic hydrogen generation capabilities. We hypothesize that the mechanochemical approach, in conjunction with thermal annealing, will improve charge separation and minimize electron–hole recombination, thereby enhancing hydrogen-evolution performance. To the best of our knowledge, this is the first time that the mechanochemical route is applied to the solid-state production of CdS/Bi2S3 nanocomposites.

2. Experimental Part

2.1. Materials

Cd(NO3)2 4H2O (99.9%, Sigma, St. Louis, MO, USA), Bi(NO3)3∙5H2O (97.5%, Sigma), CS(NH2)2 (99.0%, Sigma), NaOH (95.0%, Sigma), and PtCl2 (98.0%, Sigma) were used without further purification. Deionized water was used in all experiments.

2.2. Mechanochemical Synthesis of CdS Nanoparticles

The ball-milling preparation of cadmium sulfide (CdS) nanoparticles was conducted following the methodology previously outlined in [42]. In a typical mechanosynthesis, the requisite stoichiometric quantities of cadmium nitrate, thiourea, and sodium hydroxide were homogenized and transferred to the milling jar (45 mL, ZrO2) of the Pulverisette 7 classic line ball mill (Fritsch, Idar-Oberstein, Germany). The experimental parameters were as follows: milling duration of 10 min, rotational speed of 400 rpm, a ball-to-powder ratio of 35, and an air milling atmosphere. These parameters were found to be optimum in previous work [42] by adjusting the synthesis time, ball-to-powder ratio, and rotation speeds of the milling chamber to achieve effective size reduction while minimizing particle agglomeration and heat generation. The final product was washed three times with water and one time with ethanol.

2.3. Preparation of Bi2S3 NPs via Mechanical Activation with Further Annealing

Bismuth sulfide nanocrystals were prepared by combining two approaches: mechanochemical and thermal synthesis [46]. Some experimental conditions of the thermal method were modified with the aim of simplification of the selected method. First of all, the necessary amounts of Bi(NO3)3∙5H2O and CS(NH2)2 in a 1:6 ratio were milled for 10 min at 400 rpm, under an air atmosphere. The milling equipment was the same as that used above. After that, the resulting powder mix was annealed at 275 °C for 2 h in a muffle furnace, in an air atmosphere.

2.4. Fabrication of CdS/Bi2S3 Nanocomposite

The Bi2S3-decorated CdS nanocomposite was synthesized by employing a combination of the aforementioned approaches (Figure 1). Firstly, 1 g of the as-synthesized dry CdS nanoparticle powder was transferred to the 45 mL ZrO2 ball-mill jar. Subsequently, the precursors of bismuth sulfide (Bi(NO3)3∙5H₂O and CS(NH2)2) in a stoichiometric amount were also introduced to the milling jar. CdS nanoparticles were decorated with Bi2S3 nanoparticles at three different mass fractions: 2.5 wt.%, 5 wt.%, and 10 wt.%. Following homogenization, the mixture was milled for 10 min at 400 rpm, under an air atmosphere, and identical conditions to those as mentioned above. The resulting mixture was then transferred to a porcelain crucible and annealed at 275 °C for 2 h in a muffle furnace. The obtained final powder was used without further washing.

2.5. Photocatalytic Hydrogen Evolution Test

In a three-necked round bottom flask, 250 mL, a mixture was created by adding 30 mg of photocatalyst powder to a 90 mL of water, 10 mL of glycerol, and 0.3 mL of H2[PtCl4], which contains 0.3 mg. The mixture was sonicated for 5 min, and then the reactor was hermetically sealed, and a flow of pure argon Ar (99.99%) was introduced at a rate of 100 mL/min. The gas exiting the reactor was directed to a gas chromatograph (GC system 8890 Agilent with PAC analytical control, Agilent, Santa Clara, CA, USA) for online measurement of gas concentrations. In this setup, pure argon was used as the carrier gas. During the first hour of the experiment, the reaction system remained in darkness, allowing the carrier gas to purge dissolved oxygen from the aqueous alcohol solution. After one hour of argon saturation, the system was irradiated with light, causing the reduced hydrogen to be transported to the gas chromatograph alongside the argon flow. A 300 W solar-simulated lamp (Osram Vita-lux, Munich, Germany) with an intensity of 30 mW/cm2 was used to irradiate the mixture. Hydrogen generation was monitored every 30 min. By knowing the flow rate of the outgoing gas, the volumetric concentration of hydrogen, and the laboratory temperature and pressure, we calculated the hydrogen evaluation rate (HER). This allowed us to determine the amount of hydrogen that could be reduced on the surface of 1 g of photocatalyst per hour under these conditions. The generated hydrogen was detected every 30 min. The apparent quantum efficiency (AQE) was calculated by using the provided Equation (1) [47]:
A Q E = n × Δ G W × S × t × 100 %
where n is the number of H2 molecules evolved in the photocatalytic process, ΔG is the energy needed for splitting one water molecule into H2 and O2 (237 kJ × mol−1), W is the lamp power, S is the irradiated area, and t is the reaction time.

2.6. Instruments and Characterization

The phase composition of the samples was examined using X-ray diffraction (XRD) on a Rigaku MiniFlex 600 X-ray diffractometer (Rigaku, Tokyo, Japan), employing copper CuKα radiation (λ = 0.15405 nm, 40 kV, 15 mA). The XRD patterns were recorded in the 2 theta region, 20–60°, using a step size of 0.1° and step time of 5 s. The Rietveld refinement of XRD data was performed using TOPAS Academic Version 6 software [48,49]. Raman spectroscopy was performed with a LabRAM HR Evolution spectrometer from Horiba Scientific (Irvine, CA, USA) utilizing a 532 nm laser light for excitation. The functional group composition and structure of the samples were assessed via Fourier-transform infrared spectroscopy (FTIR) using a Nicolet iS10 FTIR spectrometer (Thermo Fisher Scientific, Waltham, MA, USA). The absorption properties of the samples and their bandgap energy were examined using UV-Vis absorption spectroscopy, recorded with a Shimadzu 2600i spectrophotometer (Shimadzu, Kyoto, Japan). The morphology and size of the samples were analyzed using scanning electron microscopy (SEM) on a JEOL JSM-IT800 (JEOL Ltd., Tokyo, Japan) and transmission electron microscopy (TEM) on a JEOL JEM-1400 Plus. Elemental distribution within the samples was investigated using SEM X-ray energy-dispersive spectroscopy (EDS) with a ZEISS Crossbeam 540 (ZEISS, Oberkochen, Germany) equipped with an X-ray EDS detector (energy resolution approximately 130 eV). High-resolution TEM (HR-TEM) was performed on a Cs-corrected scanning transmission electron microscope (JEOL JEM-ARM200F) to determine the interplanar spacing in the crystal structure.

3. Results and Discussions

3.1. XRD Analysis

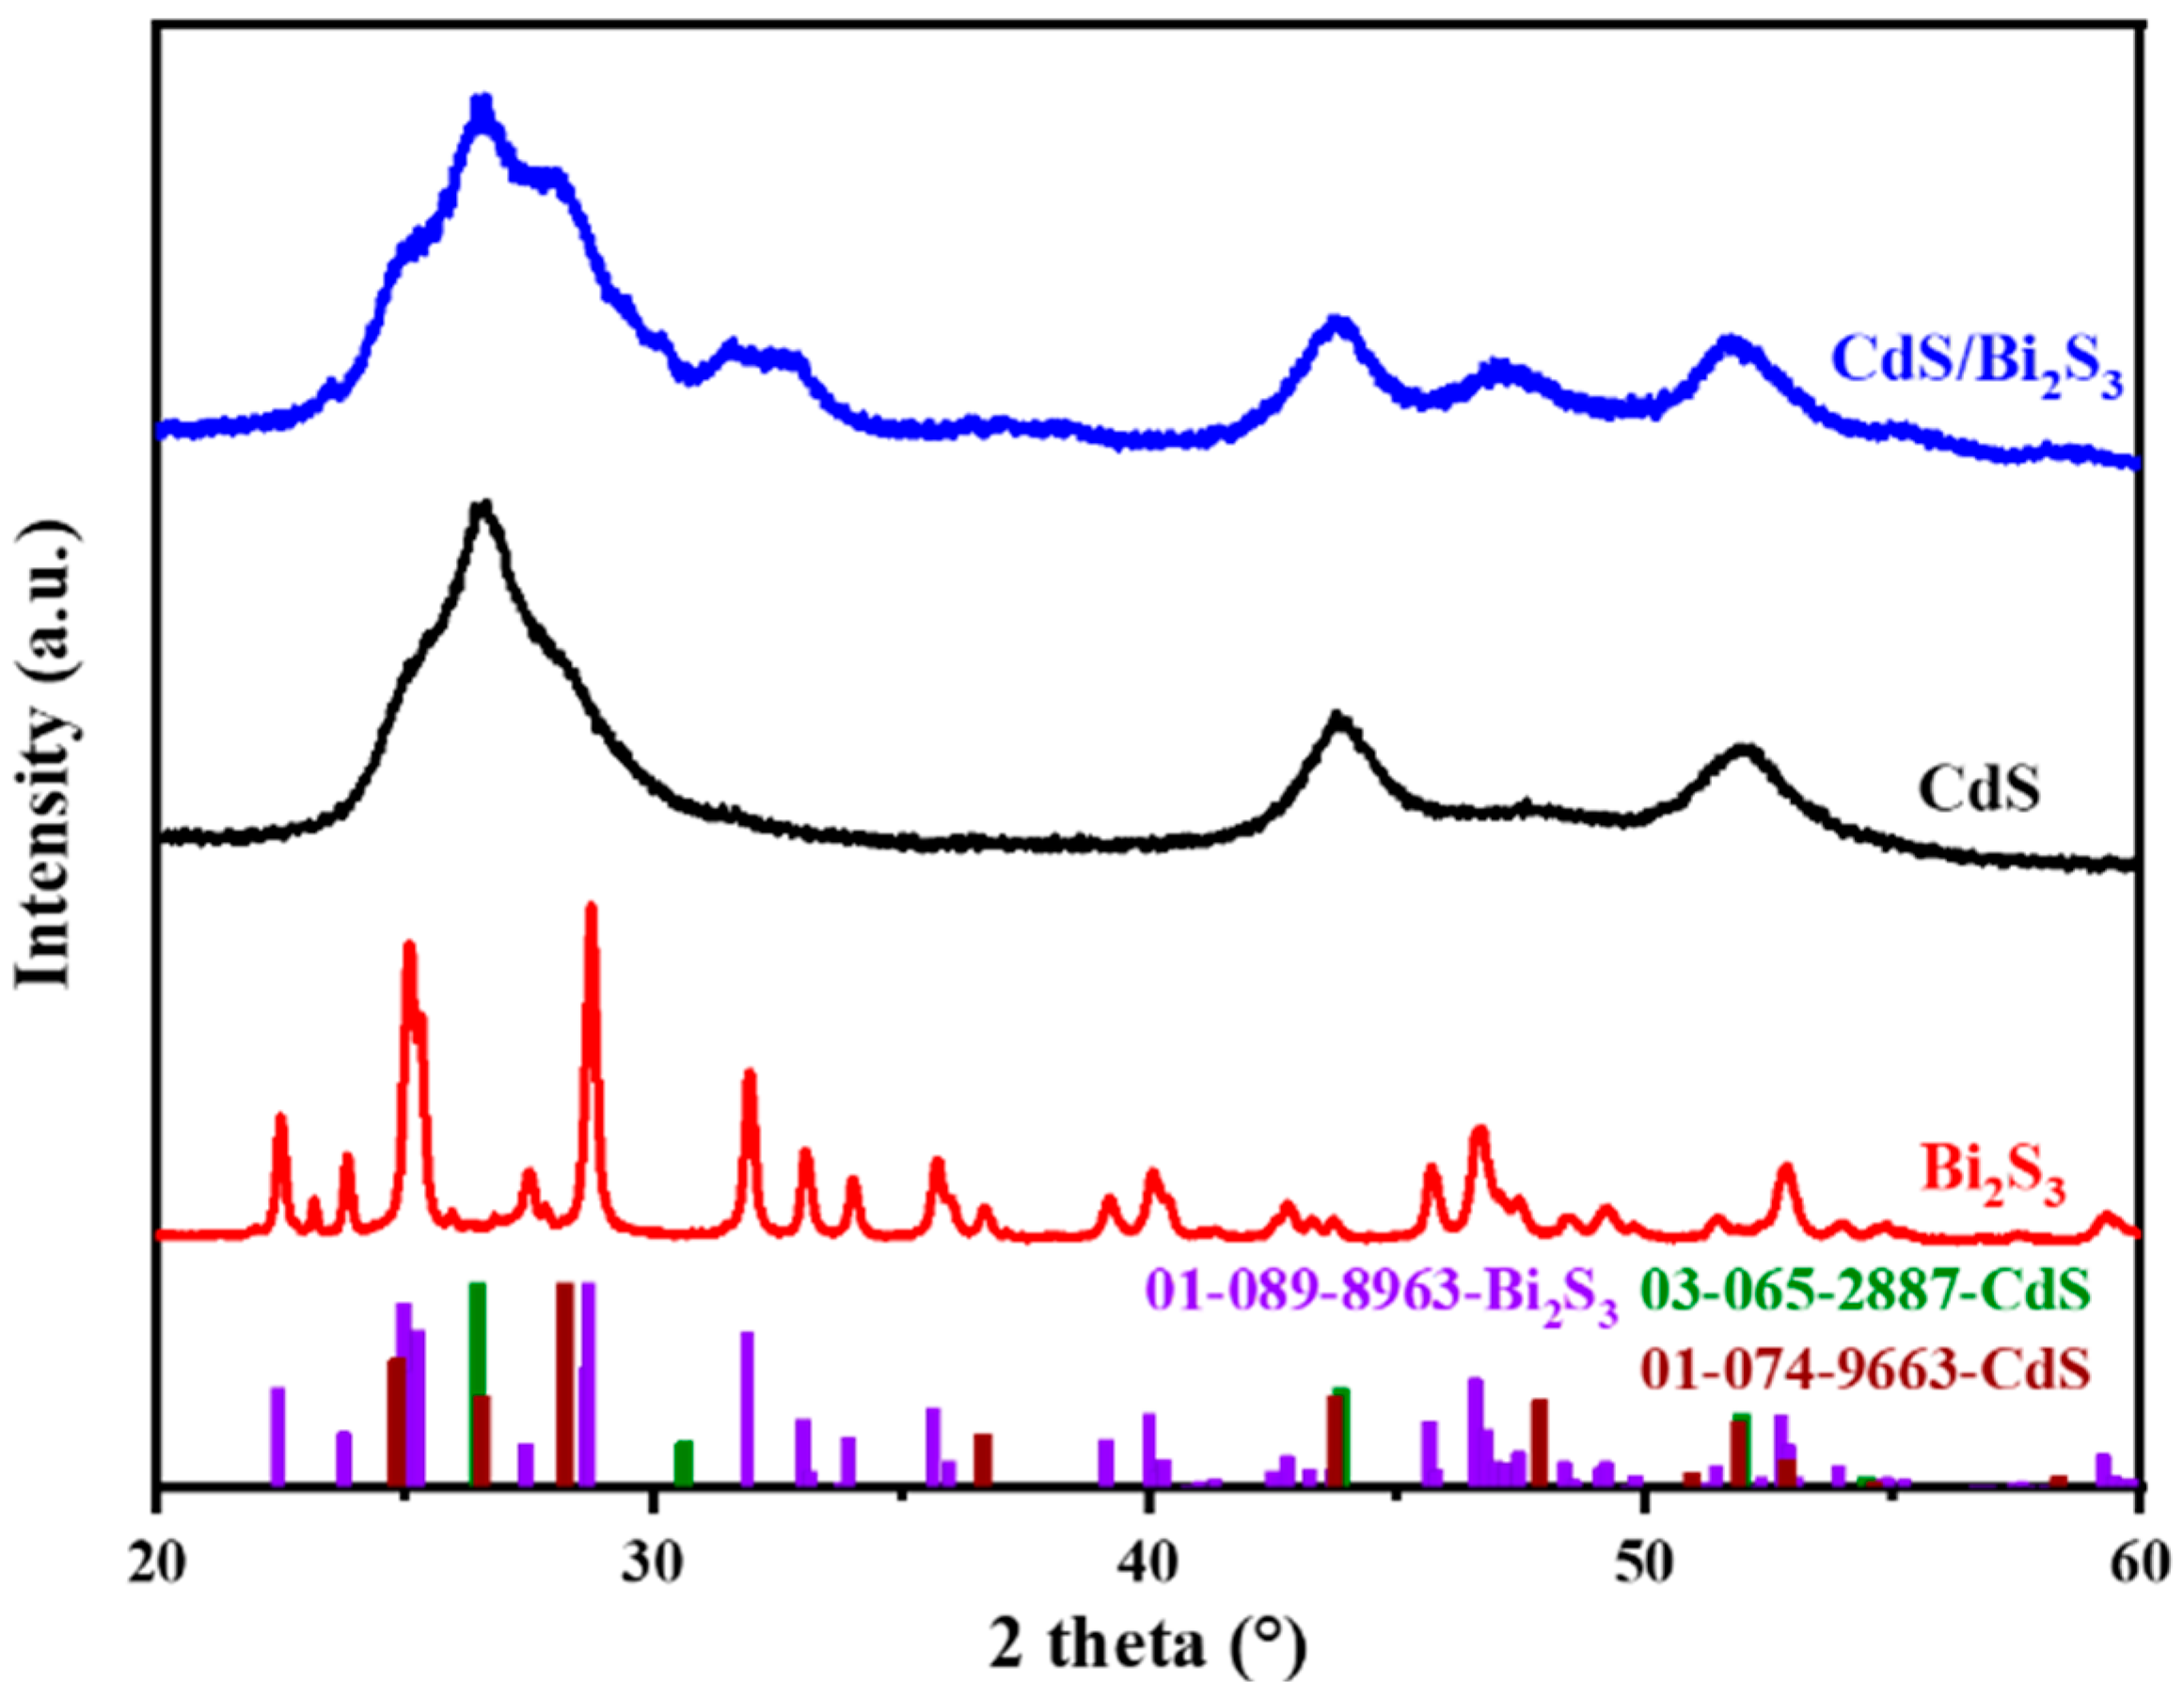
The XRD patterns of CdS, Bi2S3, and Bi2S3-decorated CdS nanoparticles (CdS/Bi2S3) are presented in Figure 2. The XRD pattern shows a mixture of the cubic hawleyite phase of CdS (PDF card no. 03-065-2887) and a hexagonal modification of CdS (greenockite, PDF card no. 01-074-9663). Regarding the peaks of the cubic phase, the peak with the greatest intensity at 2θ = 26.4° is associated with the (111) interlayer stacking, whereas the diffraction peaks with lower intensities at 43.8° and 52° are attributed to the (220) and (311) lattice planes, respectively [41,42]. According to the Rietveld refinement, the estimated content of hexagonal and cubic CdS in the sample is 56 ± 2% and 44 ± 2%. The broad nature of these diffraction peaks suggests that the CdS nanoparticles have very small dimensions, and this was also confirmed by the Rietveld refinement: the estimated crystallite size of cubic CdS was 5.2 ± 0.1 nm, and the one of hexagonal modification was 6.0 ± 0.3 nm. In the latter case, a microstrain of 3.2 ± 0.4% also contributes to peak broadening.
Figure 2 also illustrates the XRD pattern of bare Bi2S3. Apart from a few minor peaks, the observed diffraction peaks could be well-matched to an orthorhombic phase of Bi2S3 (bismuthinite, PDF card no. 01-089-8963). The estimated crystallite size was 70 ± 4 nm, so Bi2S3 nanocrystals are much larger than that of CdS. This is corroborated by a narrower character of the diffraction peaks compared to CdS. Also, a microstrain of 0.34 ± 0.02% was found to contribute to peak broadening. The intensities and positions of the identified peaks correspond well with those reported in the literature for Bi2S3 [50,51].
For the CdS/Bi2S3 sample, the XRD pattern displays prominent peaks at 26.4°, 43.8°, and 51.6°, corresponding to the (111), (220), and (311) planes of cubic CdS, respectively. The content of the hexagonal phase is higher than detected for the bare CdS sample, as confirmed by Rietveld refinement (the content of hexagonal CdS is 75 ± 2%, whereas that of the cubic phase is only 25 ± 2%). The absence of intense and sharp peaks attributable to Bi2S3 suggests a low Bi2S3 content, and it is below the detection limit of X-ray diffraction. The estimated crystallite size of the cubic CdS was even finer than in the bare CdS, namely 2.5 ± 0.04 nm. On the other hand, the crystallite size of hexagonal CdS was larger, namely 20 ± 4 nm. In this case, a microstrain of 3.3 ± 0.1% was also evidenced.

3.2. Raman Spectroscopy

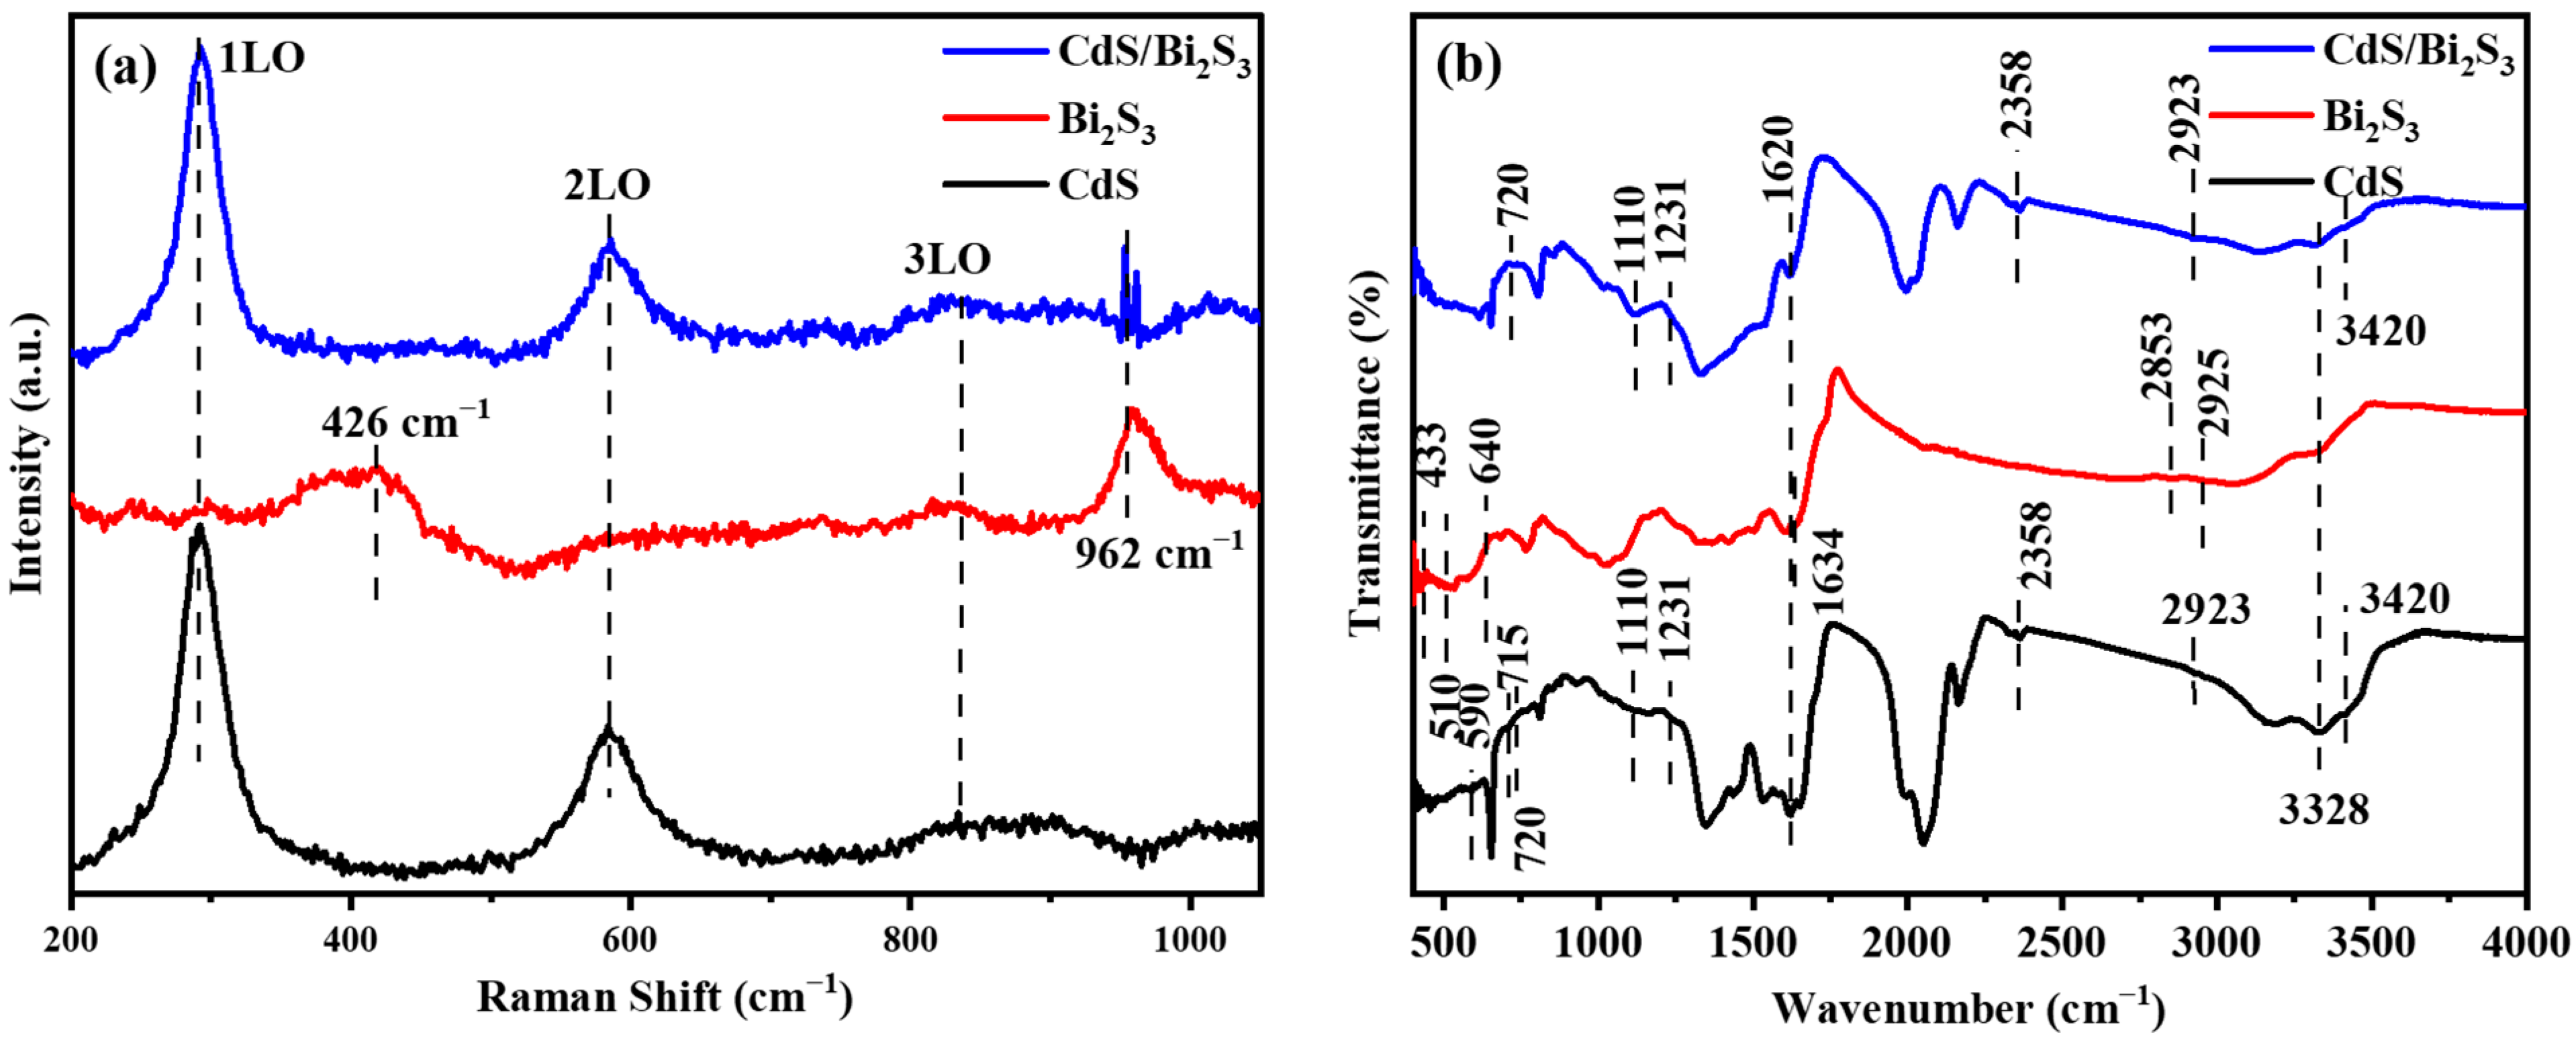
To confirm the preparation of the cadmium sulfide and bismuth sulfide complex without structural defects, it was additionally studied with Raman spectroscopy (Figure 3a). In the CdS sample, three pronounced and broad peaks were observed, which can be attributed to the optical vibrational Raman active modes at 293 cm−1, 589 cm−1, and approximately 840 cm−1. As is known, these modes are attributed to the fundamental optical phonon mode (LO), the first overtone mode (2LO), and the second overtone (3LO) of CdS, respectively [52]. In the present case, the intensity of the 3LO overtone is notably low. It has been reported that the peak at 293 cm−1 can be shifted by grinding to a nanometer size [53,54,55]. Furthermore, alterations to the peak may result in asymmetries and a shift towards lower frequencies [56]. The observed position of the Raman scattering peak of LO microspheres has a cubic zinc blende structure. The Bi2S3 sample exhibits scattering bands at 426 and 962 cm−1, which are noted by the published literature’s data for crystalline Bi2S3 [57]. Other minor peaks are obscured by the background noise. As is widely acknowledged, these peaks are indicative of the optical phonon modes and surface phonon modes [58,59,60]. The final sample exhibits unambiguous evidence of CdS modes and an intense peak at 962 cm−1, which can be attributed to the modes of crystalline Bi2S3. It is also noteworthy that no evidence of an amorphous phase was observed in the complex. The Raman spectra demonstrate the structural integrity of the CdS/Bi2S3 composites.

3.3. FTIR Spectroscopy

Fourier-transform infrared (FTIR) spectroscopy was employed to investigate the vibrational characteristics and functional groups associated with the synthesized CdS/Bi2S3 composite, as well as the individual peaks of CdS and Bi2S3 samples (Figure 3b). In the case of bare CdS and CdS/Bi2S3 composite, a moderately intense absorption peak at 655 cm−1 was detected, corresponding to the Cd–S stretching vibration [25]. In the Bi2S3 sample, the weak peaks observed within the 500–1000 cm−1 range are attributed to the stretching vibration of the Bi–S bond. Similar findings have been reported by Boughdachi et al. [61]. The weak absorption peak at 875 cm−1 is ascribed to the out-of-plane bending vibration of the O–H bond within water molecules. The absorption bands at 1018 cm−1 and 1117 cm−1 are attributed to the C–N stretching vibration and the C=S bond of thiourea, respectively. The peak observed at 1350 cm−1 is attributed to the C–N stretching of tris-amine, which is also associated with C–O stretching. Furthermore, the peaks at 2051 cm−1 and 2161 cm−1 also correspond to the N=C stretch, which is indicative of isothiocyanate (–NCS). This is a consequence of the hydrolysis of thiourea that occurred during the synthesis [62]. The absorption bands observed at 1622 cm−1 and 3333 cm−1, characterized by medium intensity and broadening, were attributed to the O–H stretching vibration of water molecules, as inferred from their spectral properties [63]. These vibrations were detected due to the residual moisture within the final products that remains even after thermal annealing in the case of Bi2S3 and the CdS/Bi2S3 composite.

3.4. UV–Visible Spectroscopy

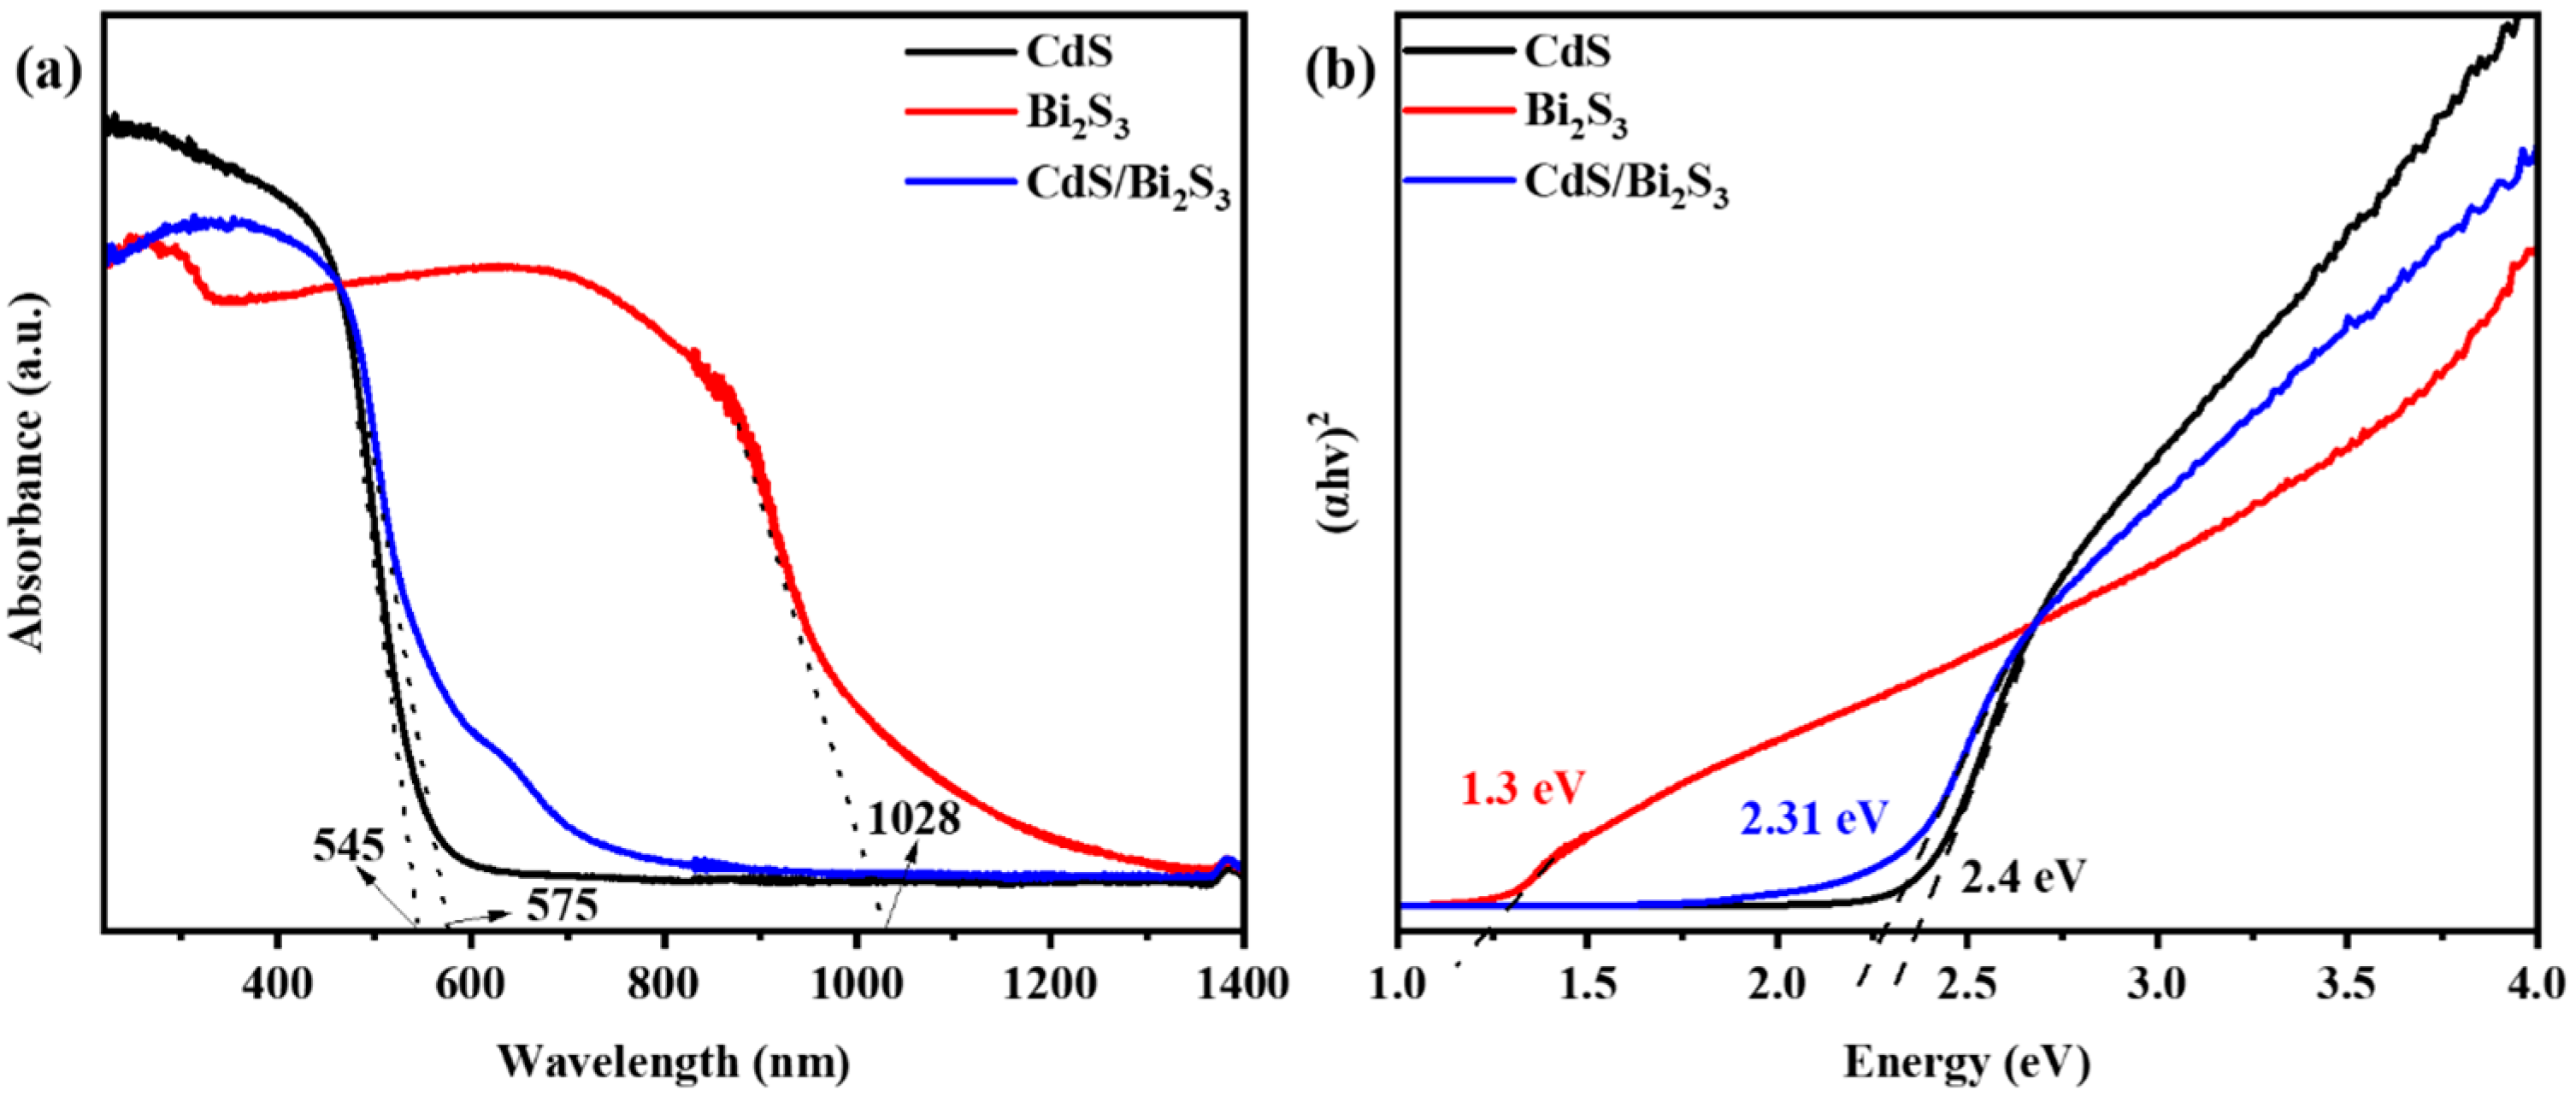
The ultraviolet–visible diffuse reflectance spectroscopy (UV-Vis DRS) technique was employed to characterize the light-absorption properties of pure cadmium sulfide (CdS), bismuth sulfide (Bi2S3), and CdS/Bi2S3 composite materials. As illustrated in the accompanying Figure 4a, pure CdS exhibits a visible absorption peak at 545 nm, while Bi2S3 displays the broadest absorption at 1028 nm. The CdS/Bi2S3 composite, situated in the middle of the spectrum, exhibits an absorption peak at 575 nm. In comparison to pure CdS, the CdS/Bi2S3 composite exhibits a shift from green to yellow visible light. This shift is likely to affect its visible-light absorption, leading to the formation of photogenerated hole–electron pairs under solar illumination. Tauc’s equation, (αhv)n = B(hv-Eg), was employed to obtain the value of the bandgap energy [64].
In this formula, α—absorption coefficients; v—frequency of light; B—edge width parameter; Eg—gap energy; and n is 2 for direct semiconductor and ½ for indirect semiconductor. For pure Bi2S3 and CdS, the value of n will be 2 for the allowed direct transition [24,30,65].
Figure 4b shows a plot of (αhv) 2 versus hv photon energy for synthesized samples that was used to calculate the bandgap energy of them. The straight line to (αhv) 2 = 0 was extrapolated, and the corresponding gaps (Eg) were found to be 1.3 eV for pure Bi2S3, 2.4 eV for CdS, and 2.31 eV for CdS/Bi2S3. The increase in the bandgap of the CdS/Bi2S3 composite compared to pure Bi2S3 and the slight reduction relative to CdS indicate an optimization of optical properties, which contributes to enhanced photocatalytic efficiency.

3.5. XPS Analysis

X-ray photoelectron spectroscopy (XPS) was employed to examine the elemental composition of the CdS and Bi2S3 nanoparticles, thereby facilitating the determination of the chemical states of the elements. The results demonstrated the presence of cadmium, bismuth, and sulfur on the surface of the samples. Figure 5a illustrates that the peaks at 404.48 eV and 411.38 eV correspond to the surface Cd [66], while the two intense peaks at 405.88 eV and 412.68 eV are related to the valence orbitals of Cd 3d5/2 and Cd 3d3/2 [67]. Furthermore, Figure 5b illustrates the S 2p peaks, which exhibit a weak peak at 161.97 eV and a prominent peak at 163.98 eV [67]. Figure 5c depicts the peaks for bismuth in bismuth sulfide, specifically Bi 4f, which are located at 157.98 eV and 163.08 eV. These peaks exhibit two intense peaks caused by spin–orbit splitting and correspond to Bi 4f7/2 and Bi 4f5/2, respectively. Similarly, the plot displays weak sulfur peaks at 160.88 eV and 162.08 eV, corresponding to S 2p3/2 and S 2p1/2. Notably, the peak at 160.88 eV is particularly weak and exhibits an overlap with other signals. The X-ray diffraction (XRD) and IR spectroscopy results confirm the presence of sulfur in the structure. Due to the quantum effect of spin–orbit interaction, the energy level is split into two closely spaced peaks. Therefore, in Bi2S3, sulfur has an oxidation degree of −2 (S2−), and the two peaks are divided at the 2p-orbitals, leading us to the conclusion that one of the peaks is overlapped. The XPS results corroborate the presence of cadmium, bismuth, and sulfur in the composite, which is to the anticipated structure of the material. Figure 5d depicts the XPS valence-band spectra, the maximum value of the tangent intersection, and the minimum value of the tangent intersection of Bi2S3 and CdS. The valence-band energy (Ev) was calculated using the following formula:
E V = E H e   I   e x c . Δ E
In this instance, the excitation energy of He I is represented by the symbol (He I exc.) and is equal to 21.22 eV. The binding energy of the secondary cut-off threshold is represented as ΔE, which is the difference between the minimum value of the tangent intersection and the width of the He I XPS spectrum. The Ev values CdS and Bi2S3 were determined to be 5.82 eV and 6.02 eV, respectively. The results obtained were used to calculate the conduction-band energy using the Eg.
E C = E V E g
In this context, the term Ev refers to the energy associated with the valence band, and Eg denotes the bandgap energy. The Ec values were determined to be 4.52 eV and 3.62 eV. The following methods were employed to ascertain the energy levels of Bi2S3 and CdS about the NHE (normal hydrogen electrode) potential. In this context, Ev is used to denote the upper boundary of the valence band (VB), while Ec is used to denote the lower boundary of the conduction band (CB). To ascertain the potential of the valence band relative to the NHE, the value of Ev was subtracted from the Fermi energy (4.44 eV).
V B = E V 4.44   e V
The VB values CdS and Bi2S3 were determined to be 1.38 eV and 1.58 eV, respectively. To ascertain the conduction band potential of the NHE standard, the Ec value was subtracted from the Fermi energy, which was determined to be 4.44 eV.
C B = E C 4.44   e V
The CB values CdS and Bi2S3 were determined to be 0.08 eV and −0.82 eV, respectively.
The XRD analysis (Figure 2) revealed the presence of two distinct crystal structures of CdS in our samples, namely the cubic (hawleyite) and hexagonal (greenockite) phases. These polymorphs display disparate electronic properties, notably in their conduction-band minimum (CBM) and valence-band maximum (VBM). The hexagonal CdS phase typically exhibits a higher CBM and a more negative VBM in comparison to the cubic phase [68]. Although these discrepancies are relatively minor, typically within a few tenths of an electronvolt, they can impact photocatalytic behavior, particularly with regard to bandgap and charge-separation efficiency [69].
In the context of the CdS/Bi2S3 composite, both CdS phases contribute to the overall photocatalytic activity. The coupling with Bi2S3 is anticipated to facilitate charge transfer, thereby mitigating any potential adverse effects resulting from the differences in band positions between the two CdS polymorphs. Furthermore, the enhanced stability of hexagonal CdS, as indicated by the Rietveld refinement results, suggests its favorable role in forming heterojunctions, which can improve charge-separation efficiency and, consequently, the overall photocatalytic performance of the composite system [70,71].

3.6. SEM Analysis

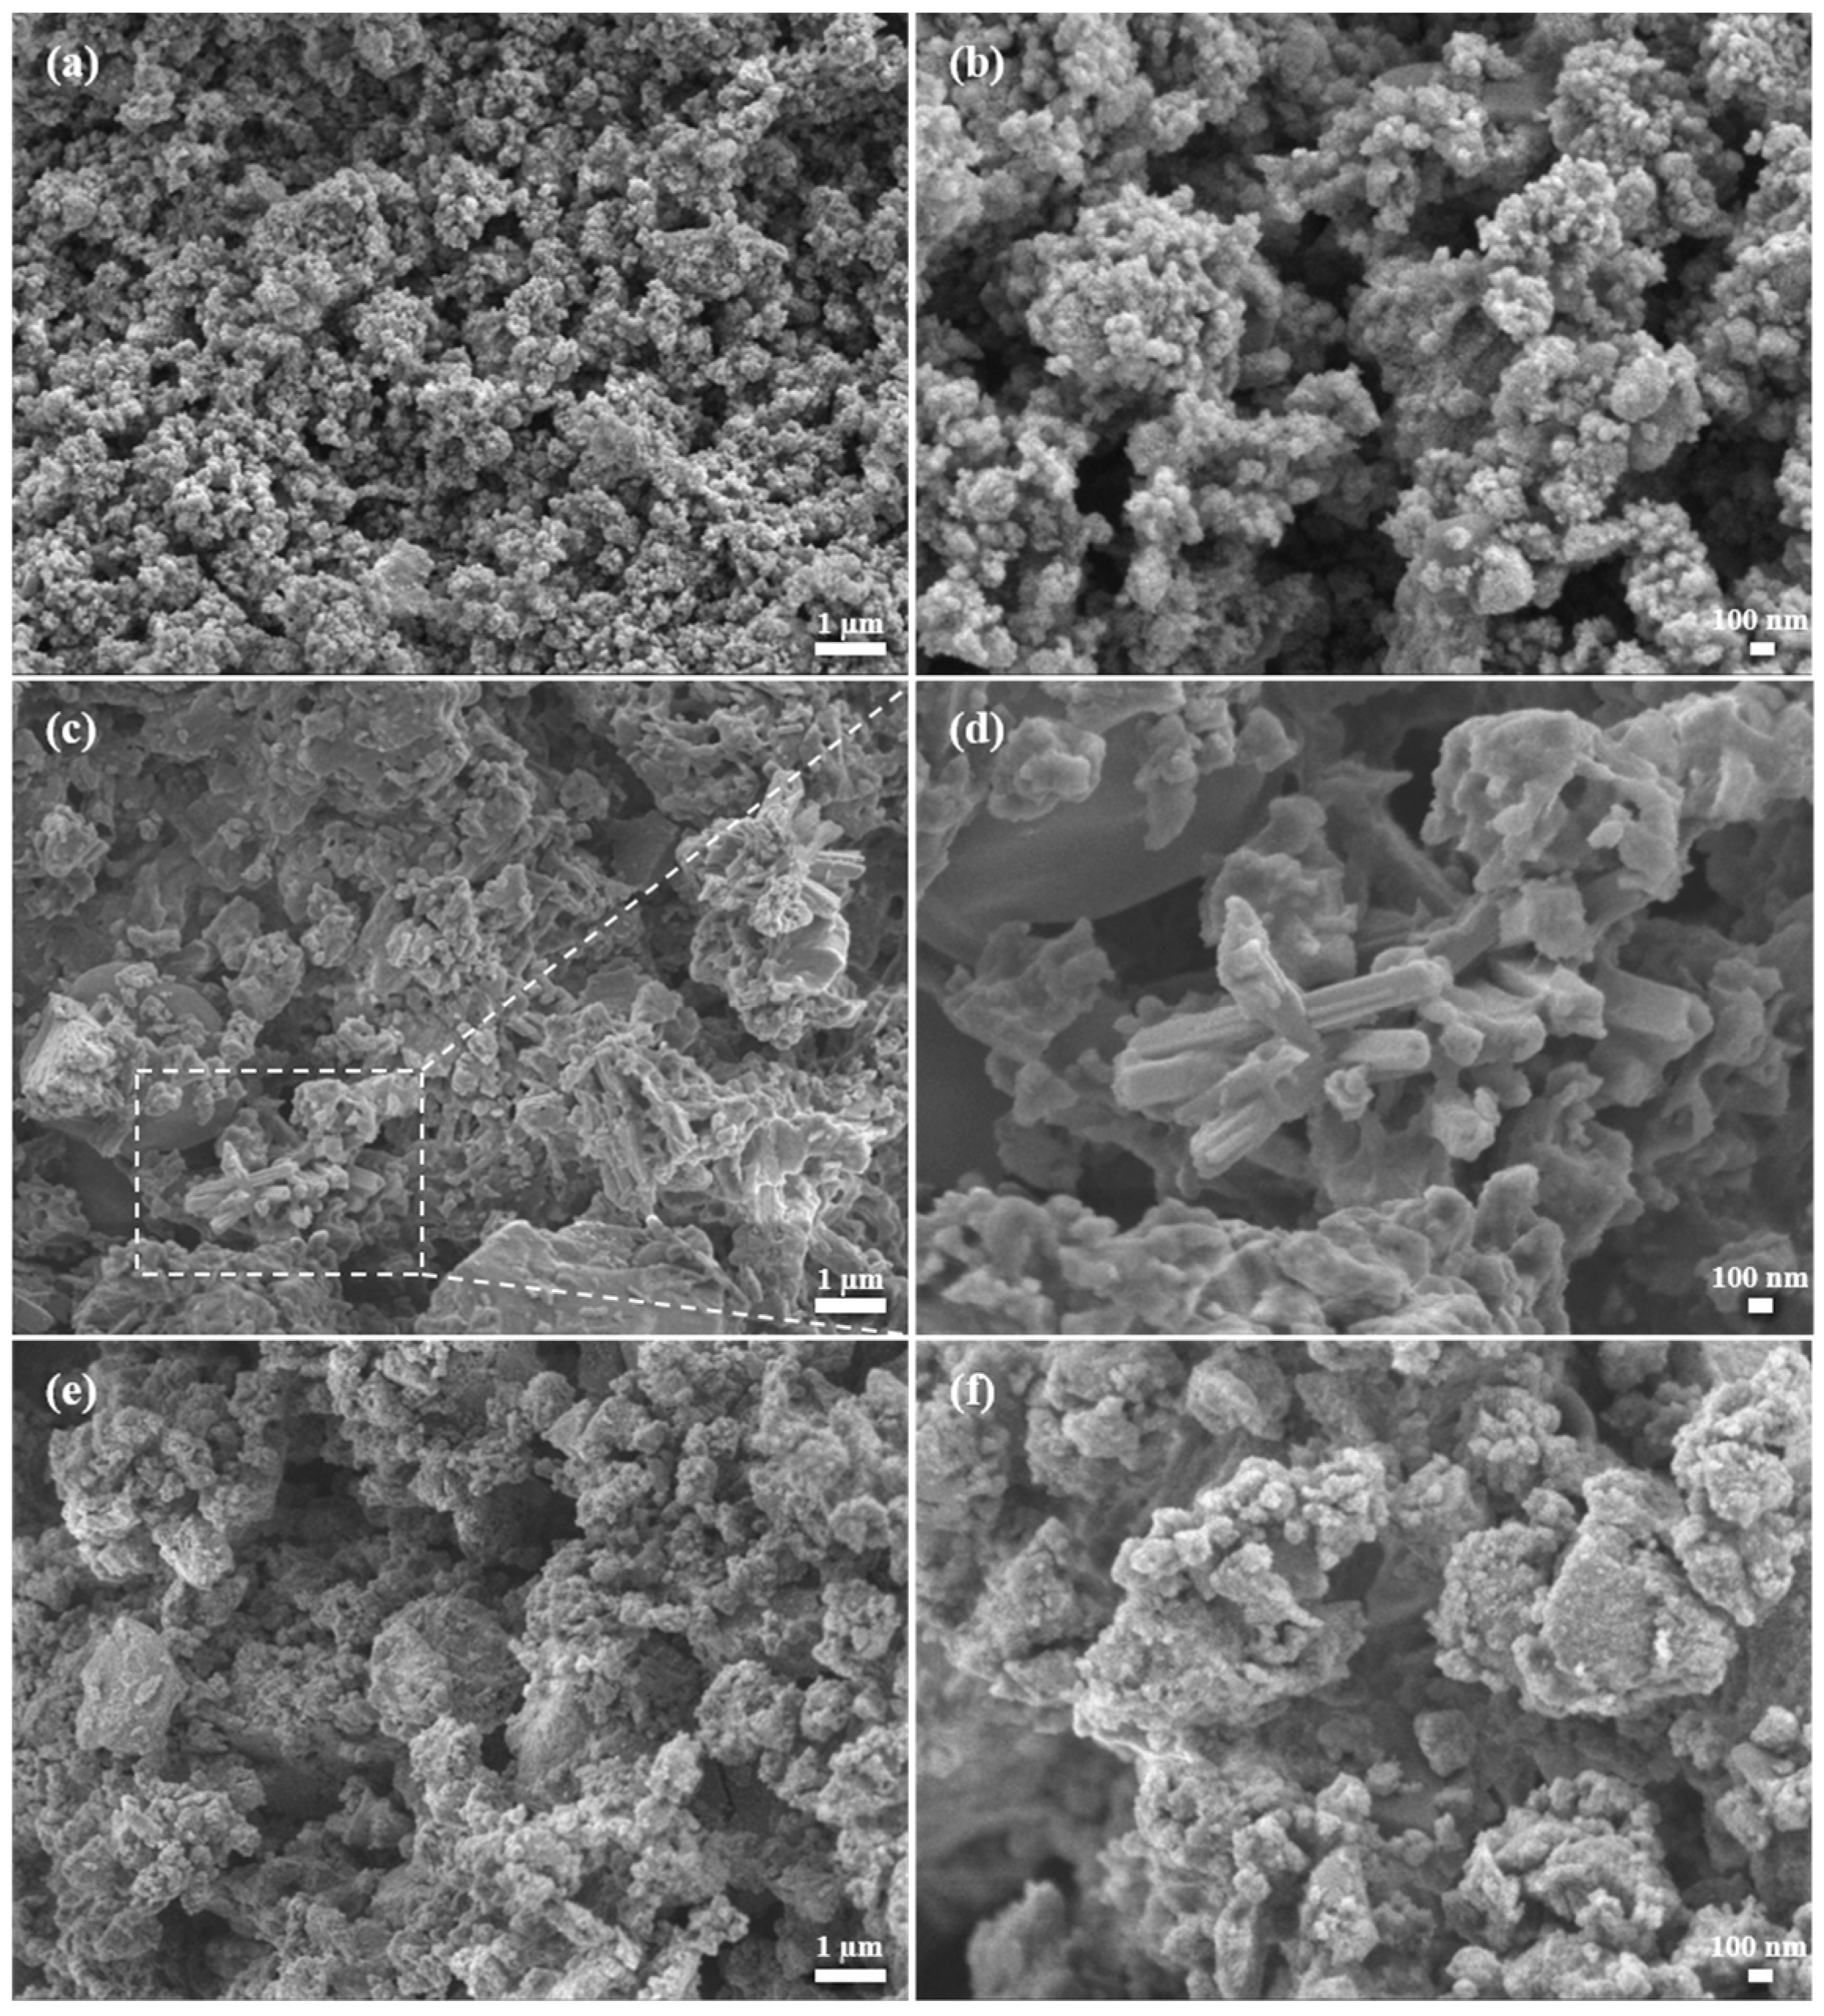
The SEM micrographs for all three samples are provided in Figure 6. The particles of CdS nanocrystals are very fine. In Figure 6b, larger agglomerates in micrometer-size are decorated with numerous fine grains with a size lower than 100 nm. The particles are of an undefined shape, typical for the mechanochemical synthesis [72]. The morphology of Bi2S3 is lumpy; however, in the center of Figure 6d, rod-like structures could be evidenced. The diameter of these rods seems to be around 200 nm, while their length exceeds one micron. The nano-rod structures of Bi2S3 are well-known [73]. The morphology of the composite resembles that of CdS; however, the particles are more compact, and the level of agglomeration seems to be larger than in the case of pure CdS (Figure 6f). It is possible that the lumpy-like Bi2S3 served the role as a glue, bringing CdS particles into closer contact.
To investigate the distribution of the present elements, EDS elemental mapping was performed. The results show the identical distribution of Bi, Cd, and S elements (Supplementary Figures S1–S3), thus confirming the good homogeneity of the sample and efficient intermixing between CdS and Bi2S3 particles.

3.7. TEM Analysis

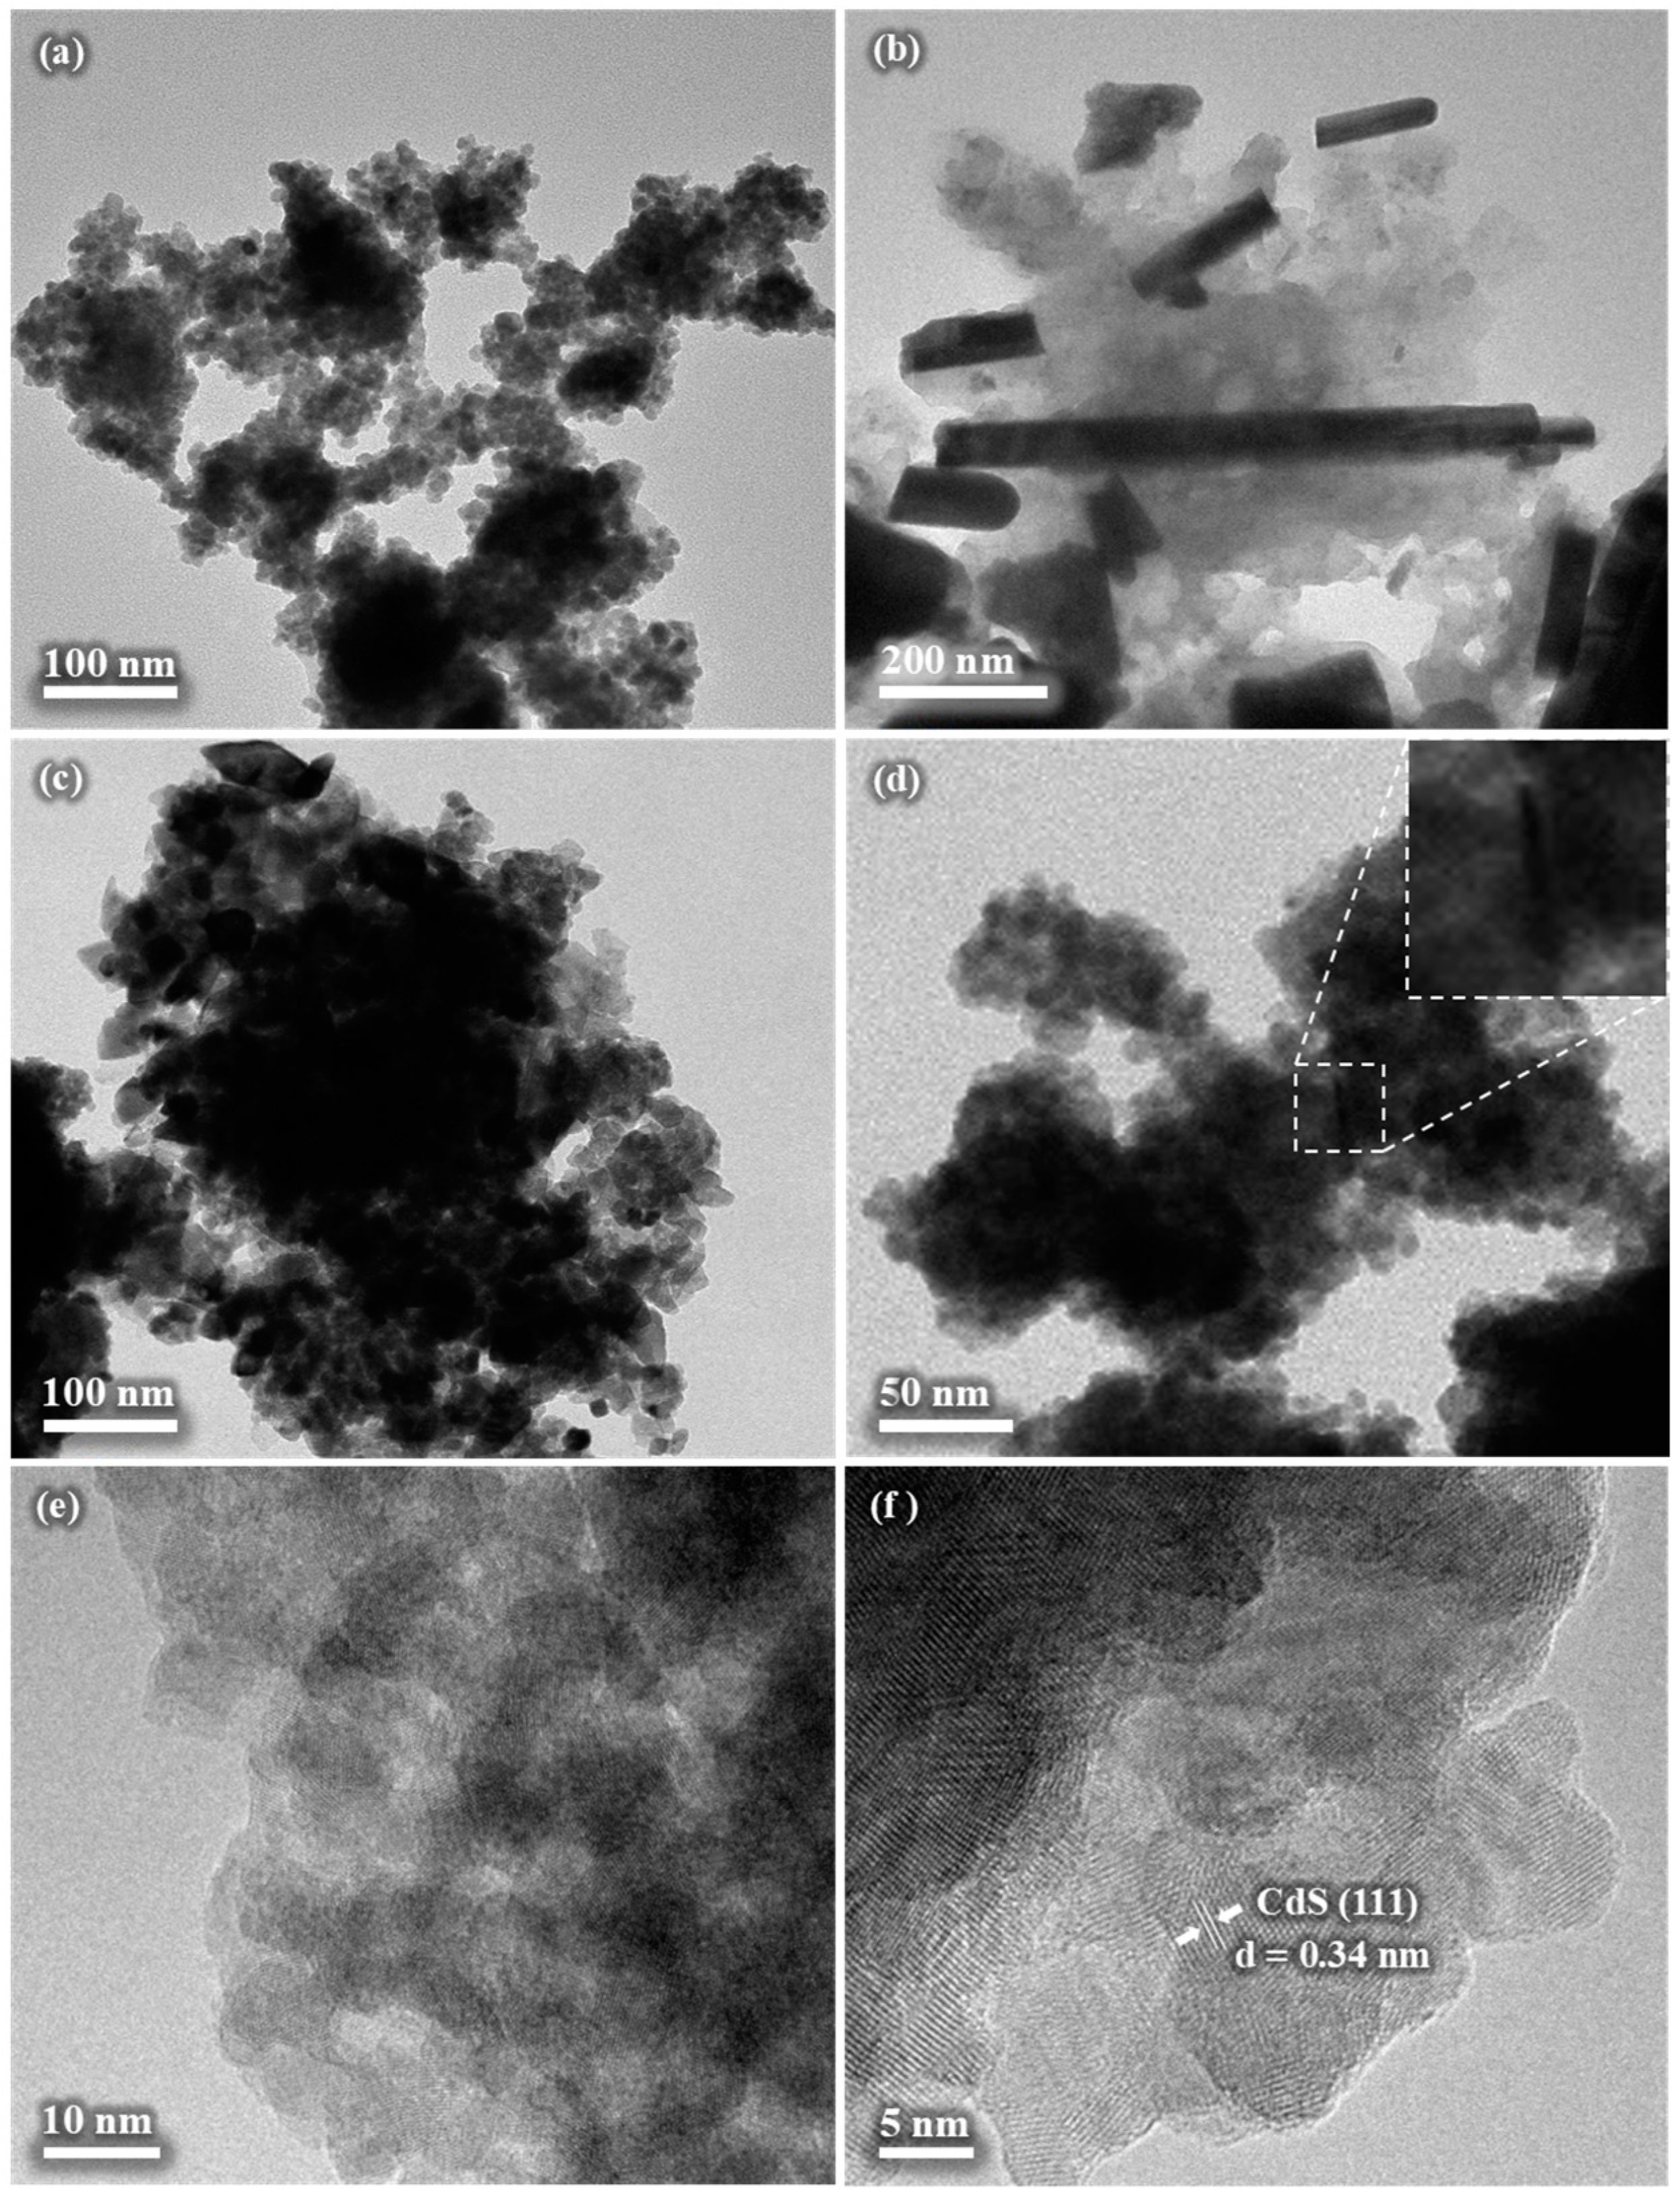
The three products were also subjected to TEM analysis (Figure 7). The observations from the SEM analysis were confirmed, namely the fine character of the CdS sample (Figure 7a), rod and lumpy-like structure of Bi2S3 (Figure 7b), and larger agglomerates for the composite (Figure 7c,d). The individual nanoparticles of CdS in Figure 7a seem to be of spherical shape, and their size appears to be within a few nanometers. The rod visible in Figure 7b is thinner than the one present in the SEM image (Figure 6d), this time being around 30 nm thick. The length is consistent with the SEM observations mentioned above. Regarding the composite, the agglomerate of few hundreds of nanometers can be seen in Figure 7c, while in Figure 7d, with lower magnification, among the majority of the spherical CdS nanoparticles, a rod, most probably belonging to Bi2S3, can be found, this is zoomed in in the inset. The HR-TEM images in Figure 7e,f confirm the very fine character of the CdS nanoparticles, being smaller than 10 nm. The interplanar distance of 0.34 nm is consistent with the (111) crystallographic plane of the CdS phase (Figure 7f).

3.8. Photocatalytic Hydrogen Evolution Results

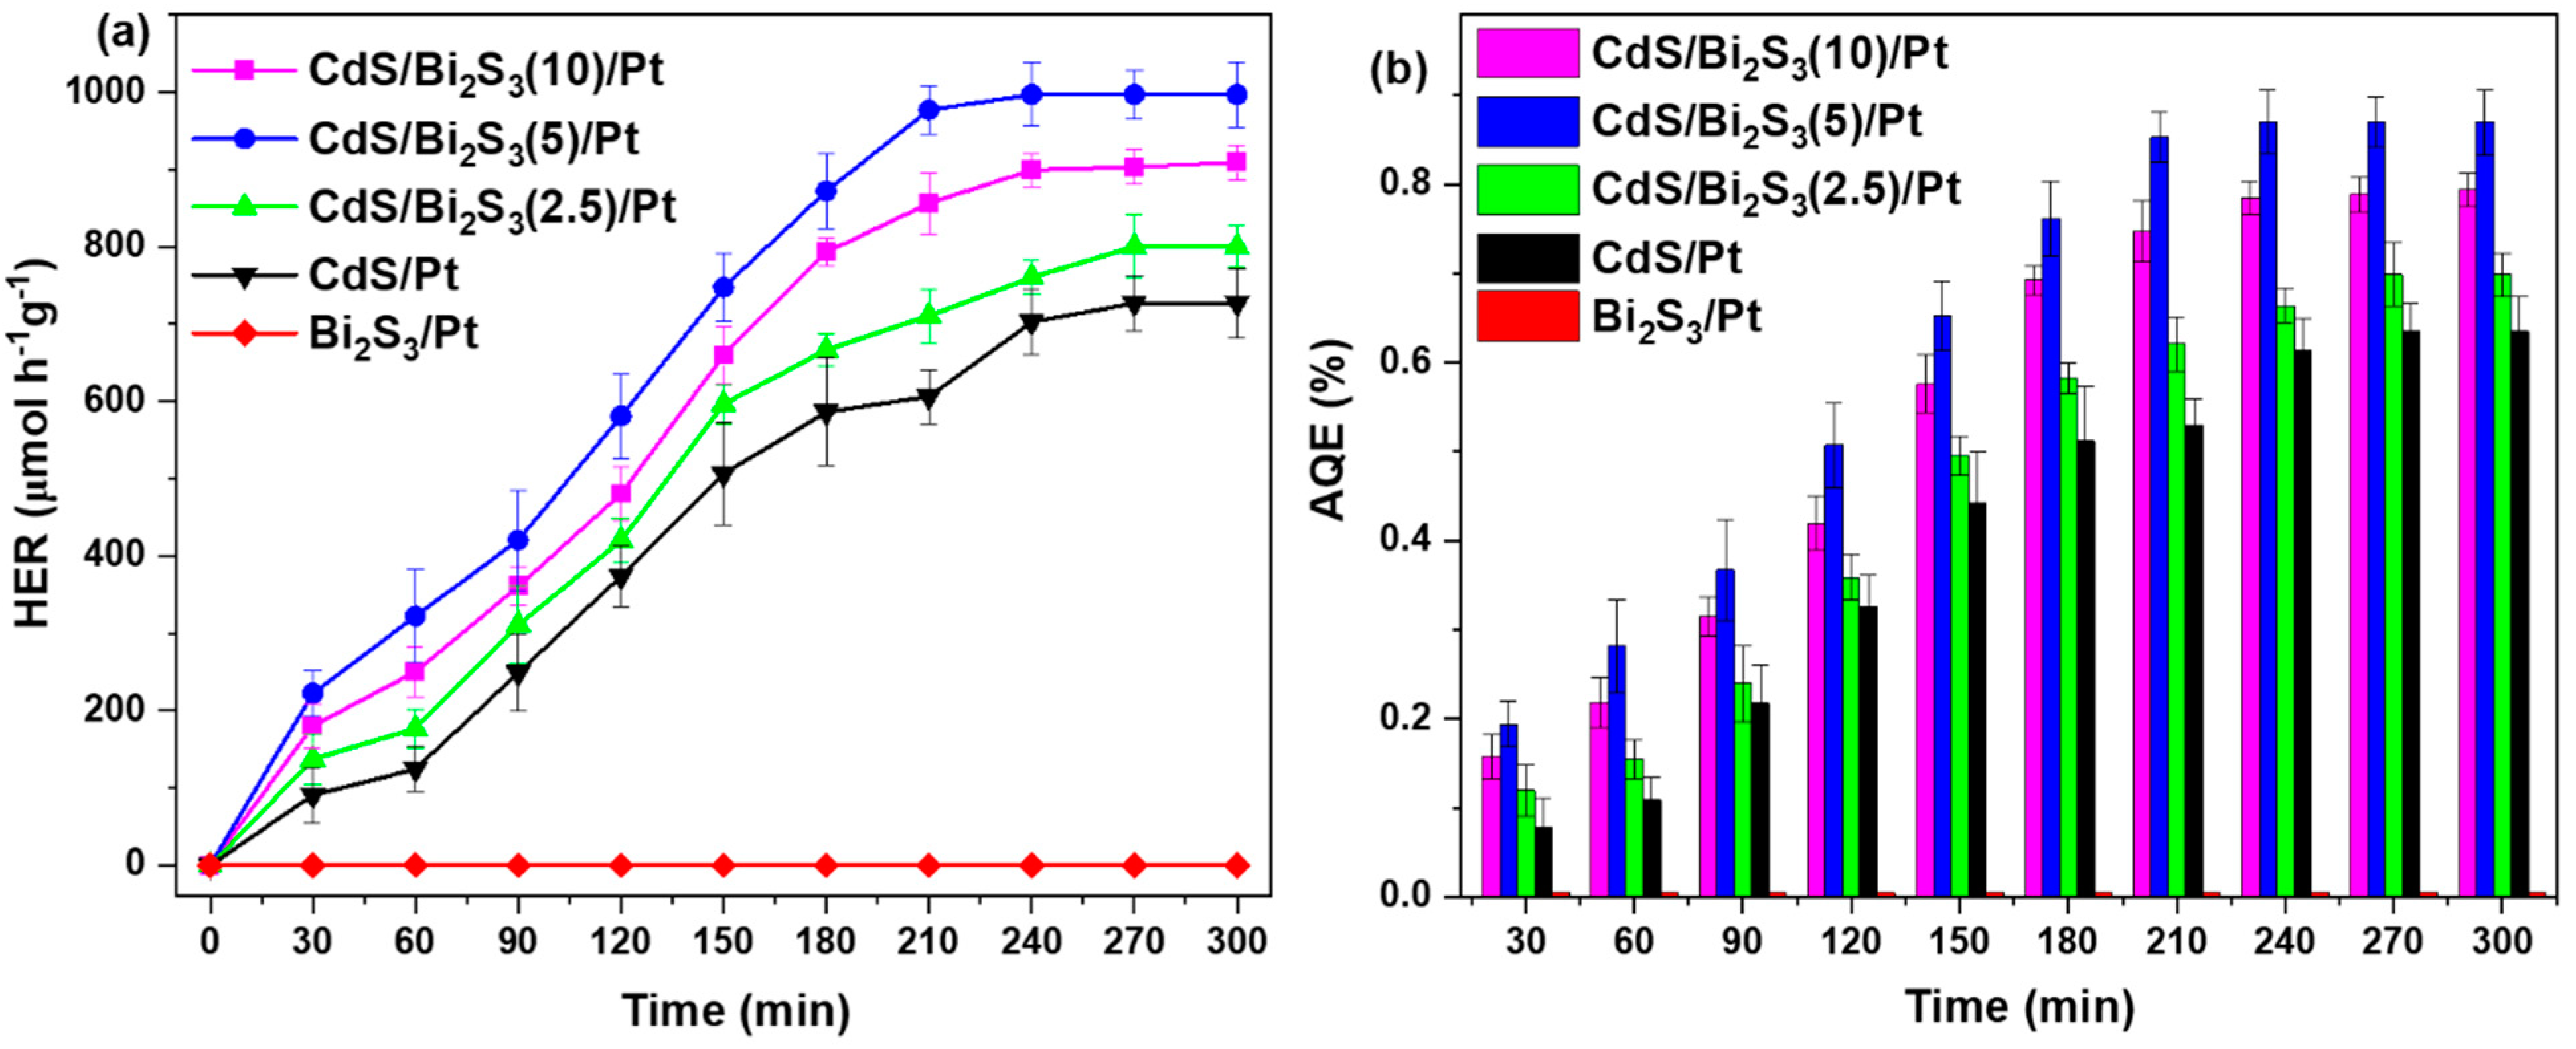
Before initiating light exposure, control experiments were carried out in the dark. These control experiments indicated that hydrogen (H2) is not generated without light. Figure 8a illustrates the photocatalytic hydrogen evolution rate (HER), showing a gradual increase in H2 production upon the start of light irradiation. The synthesized materials were exposed to 5 h of solar-light irradiation (30 mW/cm2). The photocatalytic activity of nanocomposites containing 2.5, 5, and 10% Bi2S3 was tested and compared. The results are presented in Figure 8a. The highest photocatalytic activity was shown by the nanocomposite containing 5% Bi2S3. The highest HER was observed in the CdS/Bi2S3(5)/Pt sample, reaching 996.68 μmol h−1g−1 at 3.5 h of irradiation and remaining stable for the rest of the process. In contrast, the CdS/Pt sample reached its peak HER at the 4th hour, with a value of 748.42 μmol h−1g−1, but its activity slightly decreased by the 5th hour. The Bi2S3/Pt and pure CdS/Bi2S3 samples did not produce any H2.
As shown in Figure 8b, the apparent quantum efficiency (AQE) of the CdS/Bi2S3(5)/Pt at 3.5 h of solar-light irradiation was 0.87%, while for CdS/Pt, at its peak HER at the 4th hour, the AQE was 0.67%. The AQE values at 30-minute intervals for CdS/Bi2S3/Pt and CdS/Pt are detailed in Figure 8b.
These results clearly show that bare CdS has lower activity, and Bi2S3 is inactive even with a Pt co-catalyst. The combination of the two metal sulfides with the Pt co-catalyst resulted in a synergistic effect, increasing H2 evolution by 1.3 times, if compared to CdS/Bi2S3(5)/Pt and CdS/Pt.
Table 1 offers a detailed comparative review of the photocatalytic hydrogen-generation rates observed in the present study, in comparison with those reported in the literature for several CdS, Bi2S3 nanoparticle, and CdS/Bi2S3 nanocomposite synthesis methods. The collected data suggest that the photocatalytic hydrogen-evolution capability of the sample obtained in the present study is on par with that achieved through alternative methods. Moreover, the eco-friendly nature of this approach, which avoids the use of hazardous organic solvents, positions it as a more favorable option compared to some of the methods presented in the table.
The development of photocatalytic hydrogen evolution has led to the creation of a number of highly effective semiconductor materials, which have the capacity to markedly enhance the efficiency of hydrogen production. Among these, the Cu/CdS/MnOx heterostructure is particularly noteworthy, exhibiting an exceptional hydrogen evolution rate (HER) of 5965.03 μmol h¹g¹. This is largely attributed to its effective charge-separation mechanisms, which optimize the utilization of photogenerated carriers [74]. Similarly, a ZnIn2S4 photocatalyst integrated with single-atom catalysts has demonstrated an exceptional performance, achieving a HER of up to 12,416.8 μmol h−1g−1 and an AQE of 4.9%. This performance highlights the significant advantages of single-atom activation in enhancing photocatalytic activity [75]. Furthermore, the W18O49/S heterojunction has been documented to demonstrate a robust performance, with an HER of 5373 μmol h−1g−1, which serves to exemplify the advancements in photocatalytic systems [74].
In comparison, the CdS/Bi2S3/Pt composite displays a HER of 996.68 μmol h−1g−1 and an AQE of 0.87%. Although these findings do not rank our composite among the most effective photocatalysts, they nevertheless demonstrate its potential for further enhancement. The current performance indicates that, with targeted improvements and innovative modifications, this composite could be developed into a more efficient photocatalyst in future research endeavors [76].
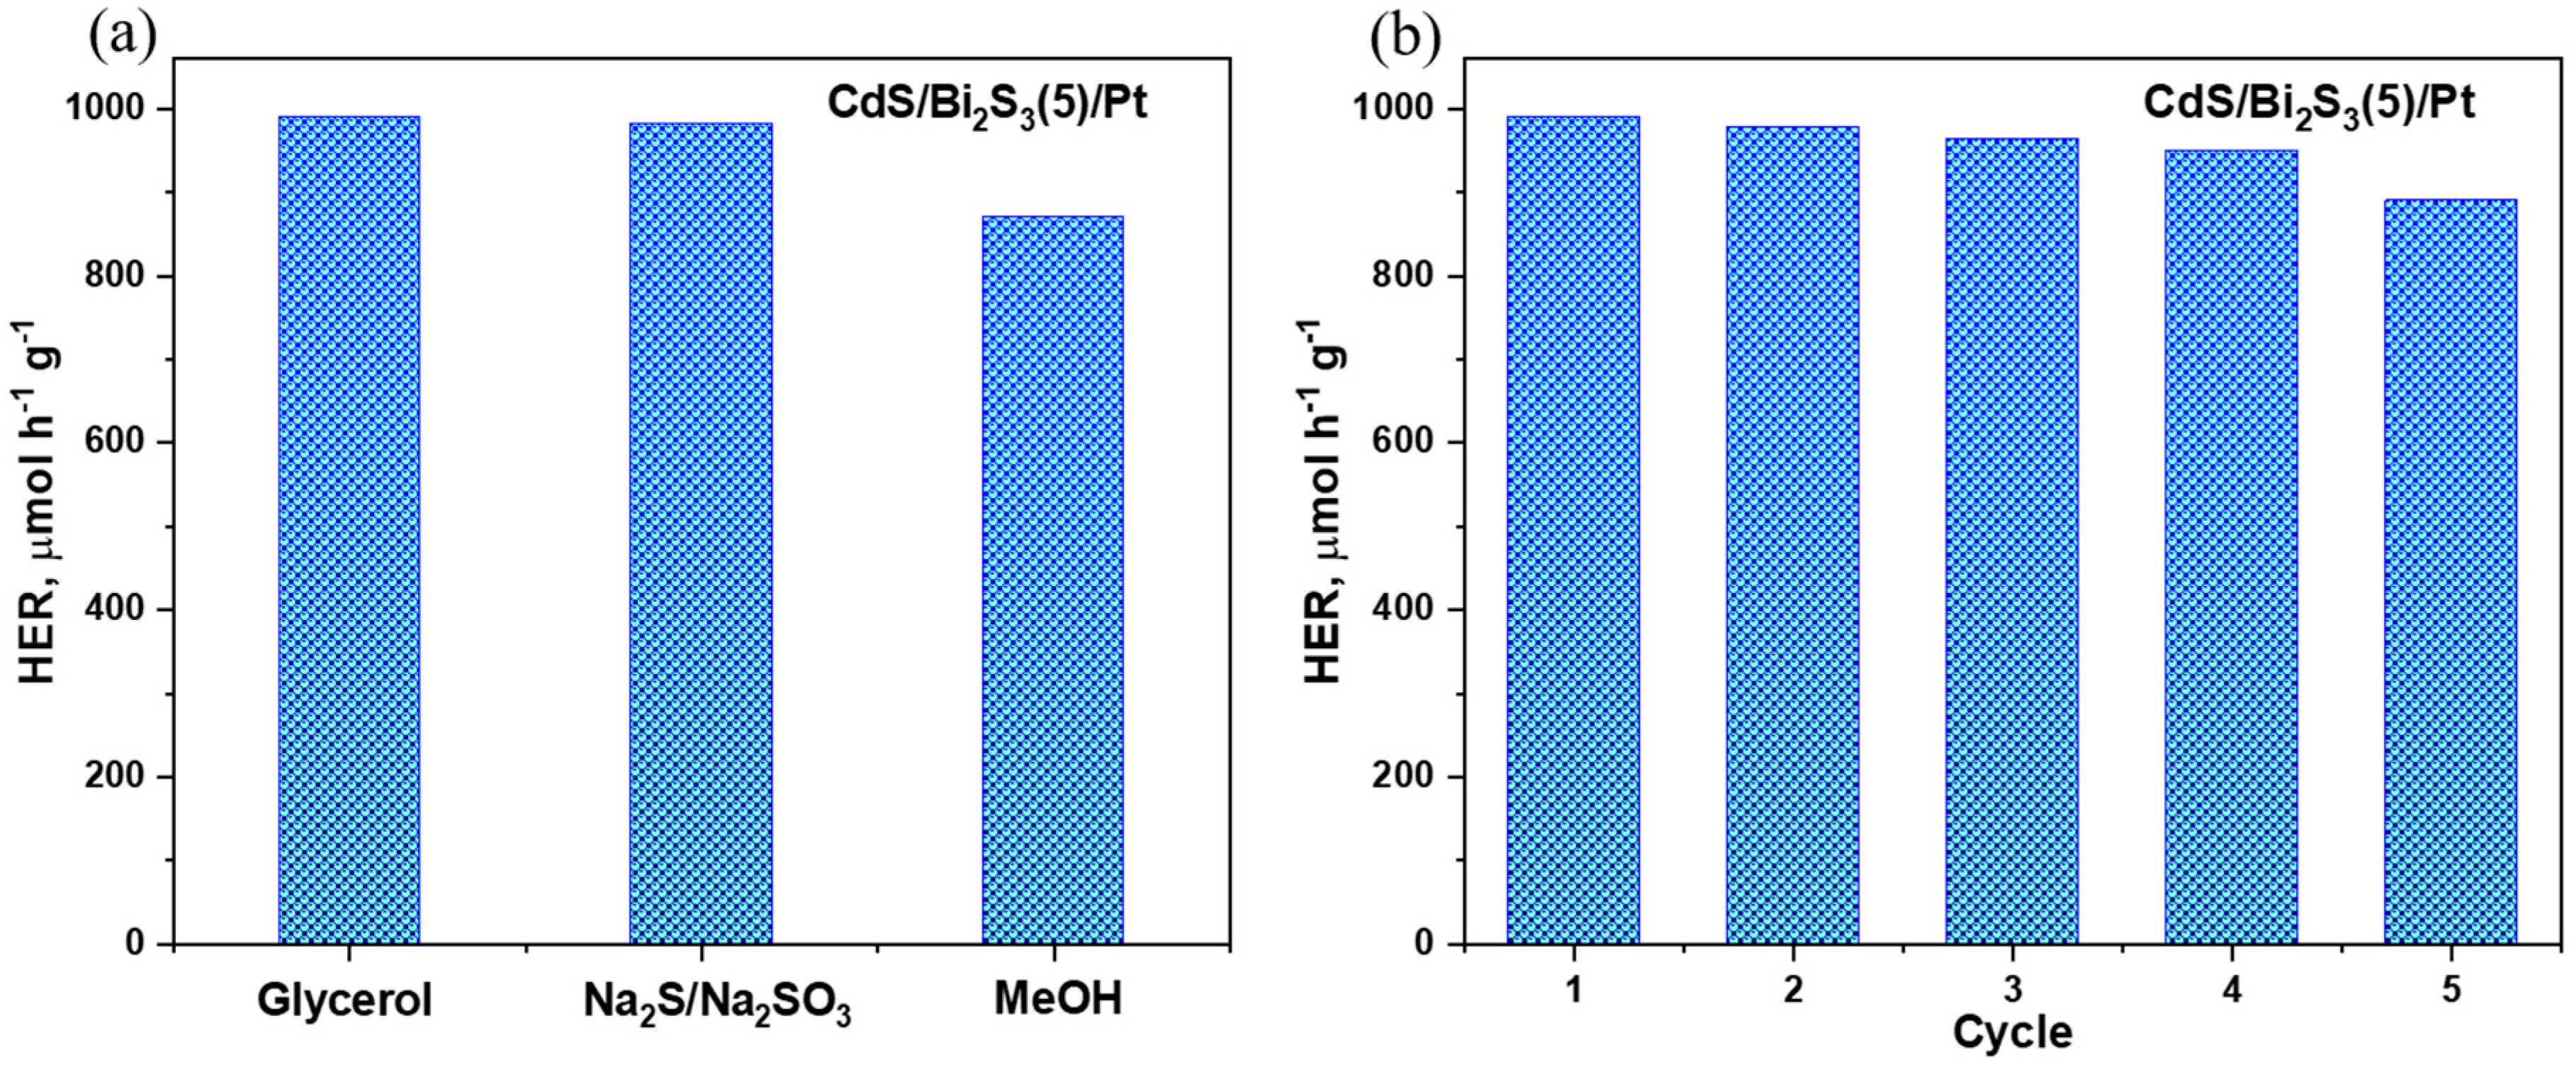
To comprehensively evaluate the photocatalytic performance of the synthesized nanocomposite, a series of systematic experiments were conducted to measure its efficiency in photocatalytic hydrogen evolution, employing various sacrificial agents. Alongside the use of glycerol, which is a commonly used organic sacrificial agent, additional tests were carried out using inorganic salts, namely sodium sulfide and sodium sulfite (in a 1 M concentration), as well as methanol (utilized at a 10% volume fraction). These experiments aimed to determine the influence of different sacrificial agents on the rate of hydrogen production and assess the versatility of the nanocomposite under varying chemical environments.
The experimental results, as depicted in Figure 9a, unequivocally demonstrate that the nanocomposite exhibits a consistently high photocatalytic activity across the different sacrificial agents tested. Notably, the hydrogen evolution rate when using sodium sulfide/sodium sulfite reached 980 μmol h−1g−1, closely mirroring the performance observed with glycerol, which suggests that the nanocomposite maintains its photocatalytic efficiency in both organic and inorganic environments. Furthermore, the use of methanol as a sacrificial agent yielded a slightly reduced hydrogen production rate of 870 μmol h−1g−1, indicating a modest decrease in activity compared to inorganic salts, yet still reflecting significant catalytic efficacy.
In addition to evaluating the photocatalytic activity, the long-term stability of the photocatalyst was assessed through five consecutive cycles of hydrogen generation, with glycerol employed as the sacrificial agent. As illustrated in Figure 9b, the hydrogen yield after the fifth cycle remained at 890 μmol h−1g−1, which corresponds to 89% of the hydrogen output recorded during the initial cycle. This minimal decrease in performance highlights the excellent durability of the photocatalyst under repeated use. The ability to maintain such a high hydrogen production rate across multiple cycles demonstrates that the photocatalyst not only performs efficiently but also exhibits high structural and functional stability.
Table 1. Hydrogen-production ability of CdS, Bi2S3, and CdS/Bi2S3 nanocomposites.
Synthetic MethodCatalystCo-CatalystPrecursorsExperimental
Conditions
Light SourceHER, mmol g−1h−1Ref.
Synthesis TimeTemperature, t °C
Biomolecule-assistedCdS-Cd(NO3)2∙4H2O, glutathione (GSH)24 h120Simulated sunlight0.085[77]
HydrothermalCdS-CdCl2, Na3PO4·12H2O, Na2S∙9H2O, H2PtCl6·6H2O12 h180Simulated sunlight0.0051[78]
CdSPt0.122
MechanochemicalCdSNiSCd(NO3)2∙4H2O, CS(NH2)2, NaOH, NaCl, Ni(NO3)2, Na2S∙9H2O10 minRTSimulated sunlight0.192[42]
HydrothermalBi2S3-Bi(NO3)3∙5H2O, CO(NH2)2, Na2S∙9H2O12 h120Simulated sunlight0.271[79]
HydrothermalCdS/Bi2S3-Bi(NO3)3∙5H2O, Cd(NO3)2∙4H2O, CS(NH2)210 h150Simulated sunlight0.38[30]
CdSQDs/Bi2S3-Cd(NO3)2∙4H2O, EG, DMF, C2H4NS, Bi(NO3)3∙5H2O9 h200Simulated sunlight41.67[80]
Intermediate-assisted chemical routeCdS/Bi2S3-Bi(NO3)3∙5H2O, KOH, CS(NH2)2, CH3OH, Zn(CH3COO)2⋅2H2O, Cd(CH3COO)2·2H2O4 h 10 min200Simulated sunlight3.85[31]
SonochemicalBi2S3/CdS-Cd(CH3COO)2∙2H2O, Bi(NO3)3∙5H2O, CH3CSNH21 h60Visible light5.5[23]
MechanochemicalCdS/Bi2S3PtCd(NO3)2∙4H2O, PtCl2, Bi(NO3)3∙5H2O, CS(NH2)22 h 10 min275Simulated sunlight0.997this work

The Mechanism of Photocatalytic Hydrogen Evolution

The positions of the conduction band (CB) and valence band (VB) in both CdS and Bi2S3 semiconductors can be determined using the provided formula:
E C B = X E e 0.5 E g
E V B = X E e + 0.5 E g
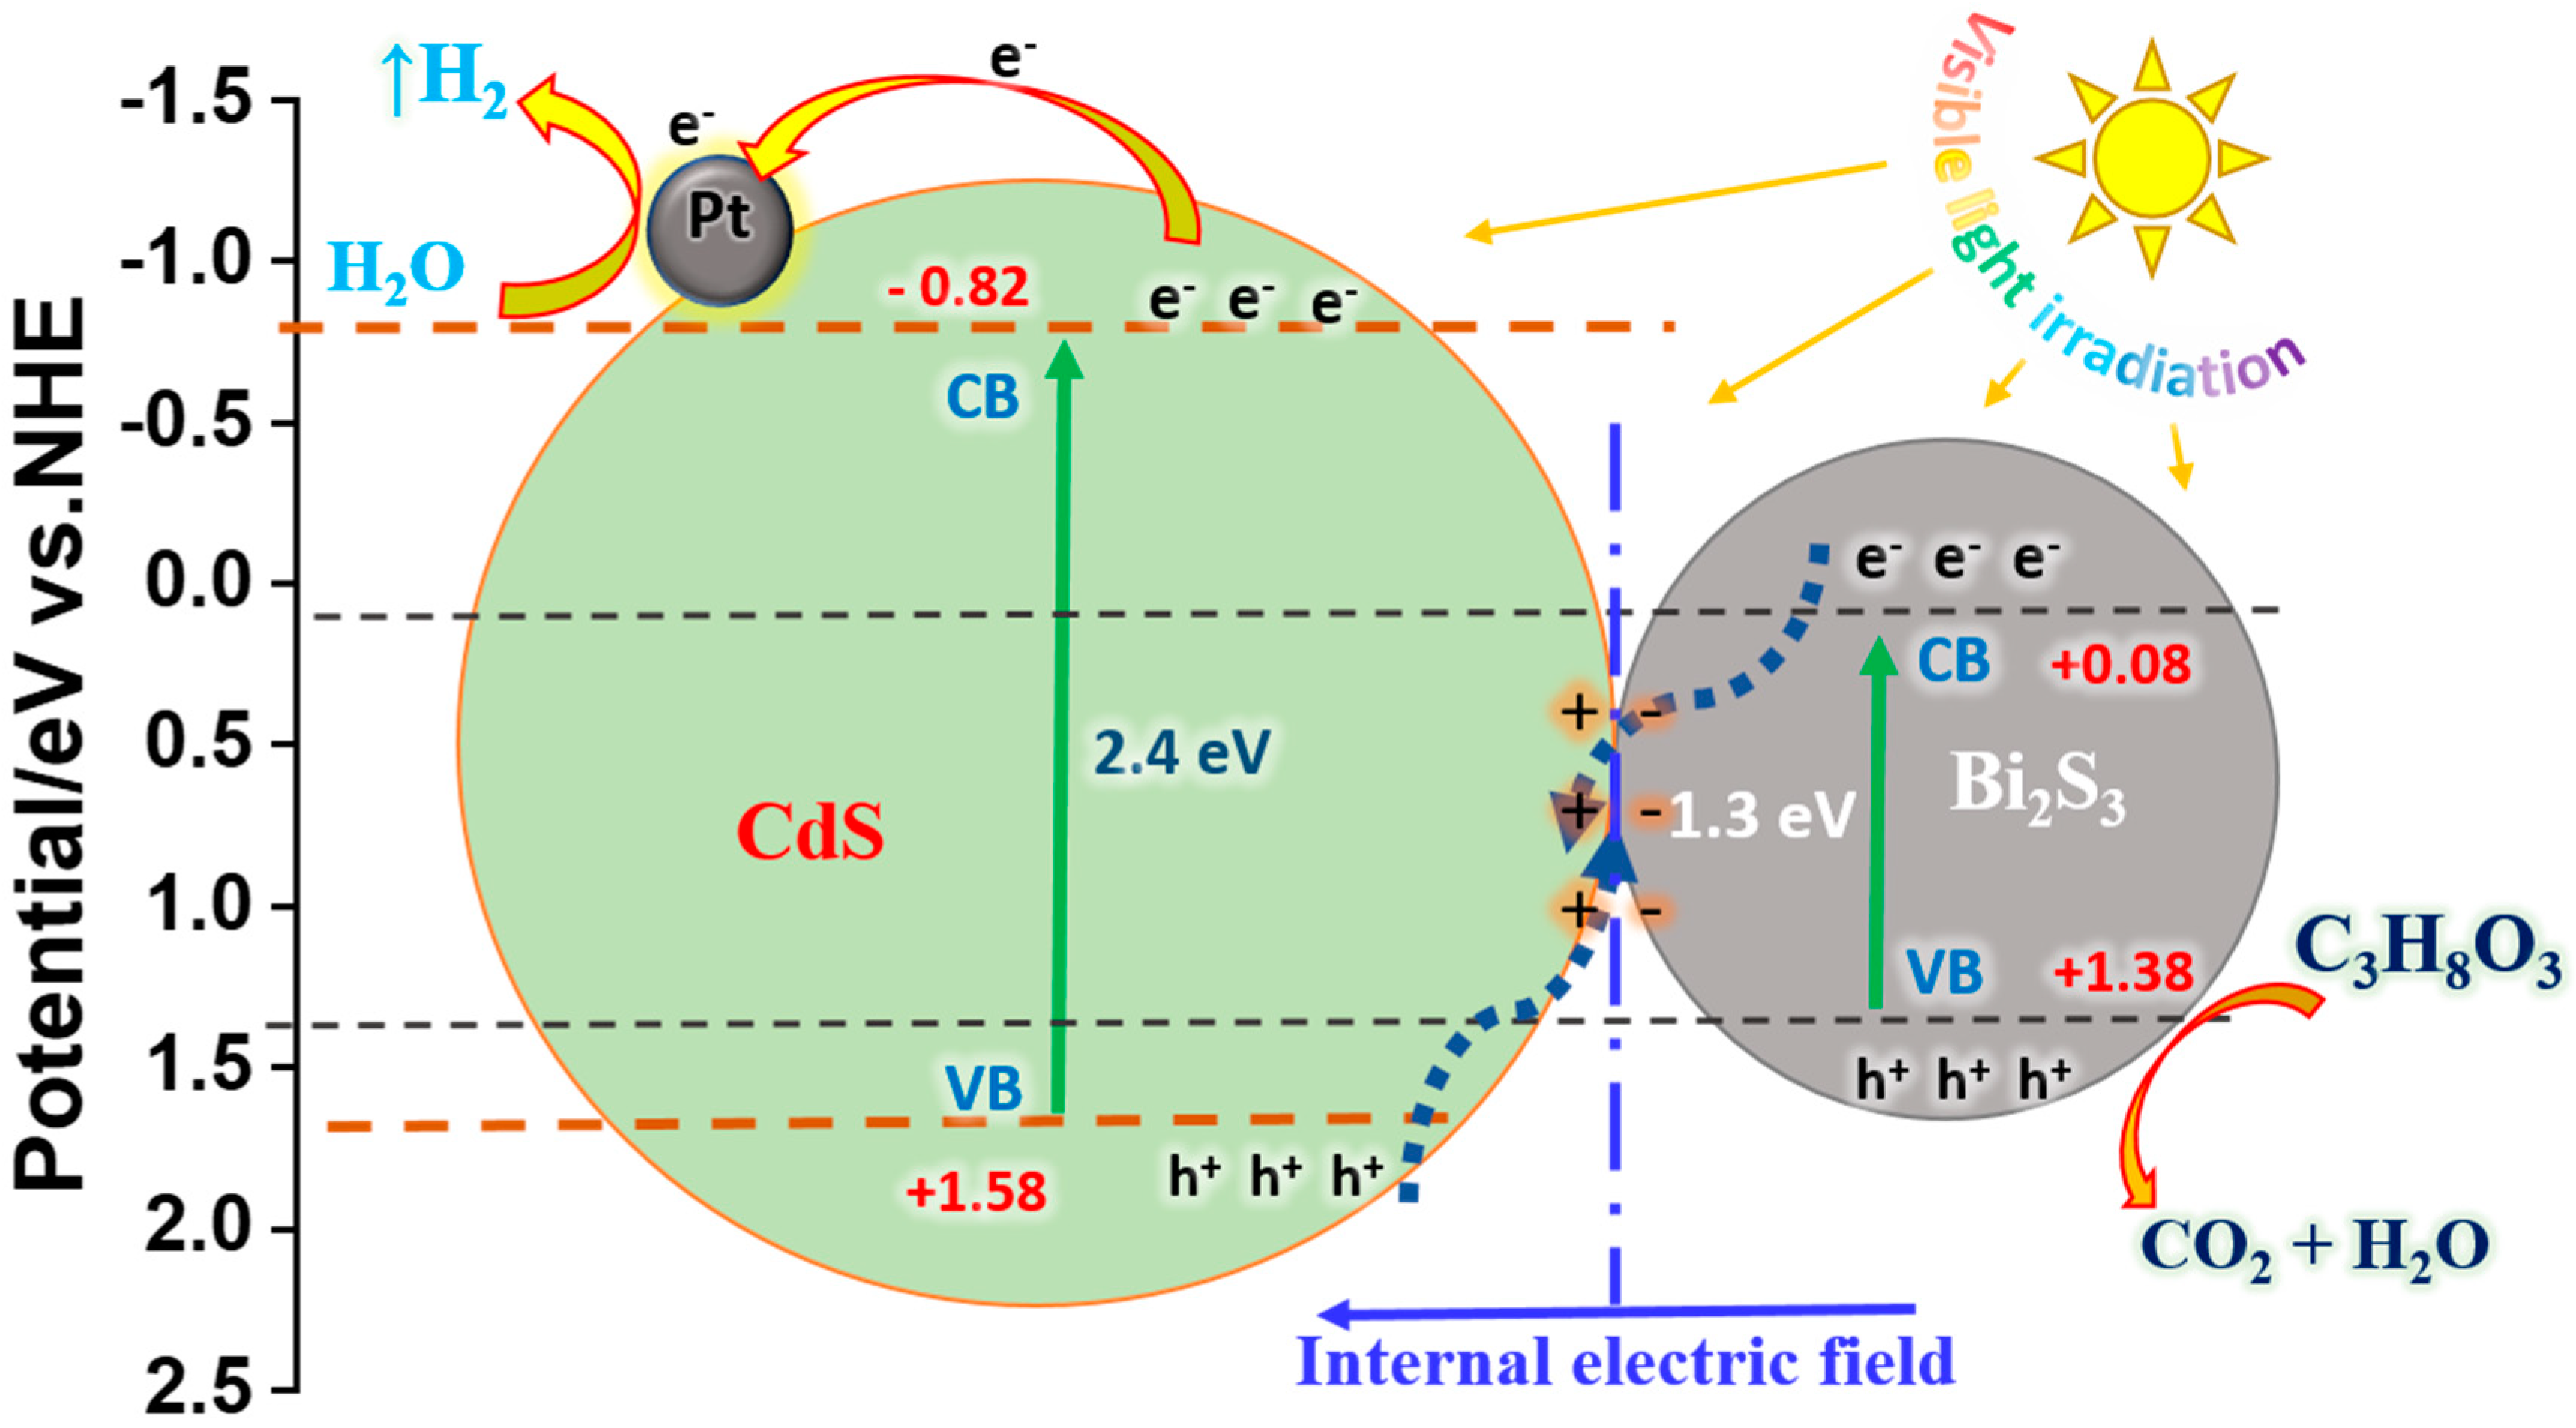
In this context, ECB and EVB represent the conduction-band and valence-band potential, respectively. X denotes the semiconductor’s electronegativity, Ee is the energy of free electrons on the hydrogen scale (approximately 4.5 eV), and Eg is the estimated bandgap value of the prepared sample, derived from UV–Vis diffuse reflectance spectrum results. The X values for CdS and Bi2S3 are 5.04 eV and 5.27 eV, respectively [81,82]. According to our calculation (Equations (6)–(9)) on XPS valence band spectra, the maximum value of the tangent intersection, and the minimum value of the tangent intersection of CdS and Bi2S3 samples, the conduction band potentials for CdS and Bi2S3 are calculated to be −0.82 eV and 0.08 eV, while their valence band potentials are approximately +1.58 eV and +1.38 eV, respectively.
In the energy-band structures of components in the CdS/Bi2S3 photocatalyst and the migration pathways of photogenerated carriers, an inherent electric field forms between CdS and Bi2S3. This field establishes a balanced Fermi level (EF), effectively suppressing charge carrier recombination and enabling photocatalytic H2 evolution. Numerous studies have detailed S-scheme heterojunctions composed of reduction photocatalysts with higher EF and lower work functions, and oxidative photocatalysts with lower EF and higher work functions, leveraging their band potentials synergistically [83,84,85]. Recent studies indicate the feasibility of constructing an S-scheme CdS/Bi2S3 heterojunction [25,31]. Initially, CdS exhibits a smaller work function and higher EF compared to Bi2S3 [24]. The conduction band energy of bismuth sulfide (Bi2S3) is below zero in the energy diagram, making hydrogen reduction on the surface of bismuth sulfide nanoparticles, when used as a catalyst, unfeasible. This conclusion is supported by the absence of detectable hydrogen in photocatalytic experiments involving bismuth sulfide with platinum deposition (Bi2S3/Pt); see Figure 10. As a result, the dominant mechanism for hydrogen generation is attributed to the S-scheme. In this mechanism, during photocatalytic hydrogen generation using the (CdS/Bi2S3)Pt composite, hydrogen reduction primarily occurs at the surface of cadmium sulfide (CdS) nanoparticles. This facilitates the efficient transfer of excited electrons from CdS to platinum, enabling hydrogen reduction to proceed effectively at the Pt sites.
Upon interfacial contact, electrons migrate from CdS to Bi2S3 until reaching an equilibrium, EF (Figure 10), resulting in CdS becoming positively charged and Bi2S3 becoming negatively charged, establishing a hole-rich and electron-rich interface in the space charge region, generating an internal electric field (IEF). Under light irradiation, this band bending drives the interfacial recombination of photogenerated electrons and holes [86]. Photogenerated electrons on the CV of Bi2S3 and holes on the VB of CdS are segregated by band bending and Coulomb attraction, preserving their superior redox capabilities. Electrons enriched on the CB of CdS with a more negative potential (−0.73 eV) transferred to Pt nanoparticles, as per the S-scheme model, swiftly reduce H+, which was adsorbed on Pt surface, to generate H2 in the presence of sacrificial agents:
C d S / B i 2 S 3 + h ν   C d S   e C B + h V B + / B i 2 S 3   e C B + h V B +
C d S   e C B + h V B + / B i 2 S 3   e C B + h V B +     C d S   e C B + B i 2 S 3 h V B +
h + ( B i 2 S 3 , V B ) + C 3 H 8 O 3 C O 2 + H 2 O
2 H + + 2 e   ( C d S C B )   H 2

4. Conclusions

In situ solid-state synthesis of CdS/Bi2S3 nanocomposites via the ball-milling technique, with further thermal annealing, was successfully performed in this study. The morphology, structure, and composition of the individual CdS and Bi2S3 samples, as well as the composite CdS/Bi2S3, were thoroughly characterized using XRD, Raman spectroscopy, FTIR, SEM, EDS, and TEM techniques. The XRD analysis and Rietveld refinement revealed that both the CdS and composite samples contain cubic and hexagonal phases of CdS. The bandgap energies were found to be 2.4 eV for CdS, 1.3 eV for Bi2S3, and 2.31 eV for the CdS/Bi2S3 composite. Moreover, synthesized samples were tested for their ability to perform photocatalytic hydrogen evolution. The highest HER was observed in the CdS/Bi2S3/Pt sample, reaching 996.68 μmol h−1g−1 (AQE 0.87%) at 3.5 h of solar-light irradiation. In contrast, the CdS/Pt sample reached its peak HER at the 4th hour, with a value of 748.42 μmol h−1g−1 (AQE 0.67%). The Bi2S3/Pt sample did not produce any H2. Thus, the obtained results showed that combining CdS, Bi2S3, and a Pt co-catalyst produced a synergistic effect, increasing the HER by 1.3 times when comparing CdS/Bi2S3/Pt to CdS/Pt. The nanocomposite exhibits a strong photocatalytic hydrogen-generation performance with various sacrificial agents and retains significant stability over repeated use. These findings highlight the material’s potential for sustainable hydrogen production in energy applications.

Supplementary Materials

The following supporting information can be downloaded at: https://www.mdpi.com/article/10.3390/nano14221785/s1, Figure S1. Elemental mapping of the CdS sample for Cd and S elements. Figure S2. Elemental mapping of the Bi2S3 sample for Bi and S elements. Figure S3. Elemental mapping of the CdS/Bi2S3 sample for Cd, Bi, and S elements.

Author Contributions

Conceptualization, Z.S. and B.T.; Methodology, Z.S., A.A., N.K., S.T. and B.T.; Formal analysis, A.S.; Investigation, Z.S., A.A., N.K., S.T., A.S. and M.B.; Writing—original draft, Z.S., A.A., N.K., S.T. and B.T.; Writing—review & editing, B.T. and M.B.; Project administration, Z.S. All authors have read and agreed to the published version of the manuscript.

Funding

This research was funded by the Committee of Science of the Ministry of Education and Science of the Republic of Kazakhstan (Grant No. AP14870472). The support of the Slovak Grant Agency VEGA (project 2/0112/22) is also gratefully acknowledged.

Data Availability Statement

The original contributions presented in the study are included in the article/Supplementary Materials, further inquiries can be directed to the corresponding author.

Conflicts of Interest

The authors declare no conflicts of interest.

References

  1. Winter, C.-J. Hydrogen energy—Abundant, efficient, clean: A debate over the energy-system-of-change. Int. J. Hydrogen Energy 2009, 34, S1–S52. [Google Scholar] [CrossRef]
  2. Ishaq, H.; Dincer, I.; Crawford, C. A review on hydrogen production and utilization: Challenges and opportunities. Int. J. Hydrogen Energy 2022, 47, 26238–26264. [Google Scholar] [CrossRef]
  3. Hassan, Q.; Sameen, A.Z.; Salman, H.M.; Jaszczur, M.; Al-Jiboory, A.K. Hydrogen energy future: Advancements in storage technologies and implications for sustainability. J. Energy Storage 2023, 72, 108404. [Google Scholar] [CrossRef]
  4. Barelli, L.; Bidini, G.; Gallorini, F.; Servili, S. Hydrogen production through sorption-enhanced steam methane reforming and membrane technology: A review. Energy 2008, 33, 554–570. [Google Scholar] [CrossRef]
  5. El-Shafie, M. Hydrogen production by water electrolysis technologies: A review. Results Eng. 2023, 20, 101426. [Google Scholar] [CrossRef]
  6. Oruc, O.; Dincer, I. Assessing the potential of thermo-chemical water splitting cycles: A bridge towards clean and sustainable hydrogen generation. Fuel 2021, 286, 119325. [Google Scholar] [CrossRef]
  7. Sivaramakrishnan, R.; Shanmugam, S.; Sekar, M.; Mathimani, T.; Incharoensakdi, A.; Kim, S.-H.; Parthiban, A.; Geo, V.E.; Brindhadevi, K.; Pugazhendhi, A. Insights on biological hydrogen production routes and potential microorganisms for high hydrogen yield. Fuel 2021, 291, 120136. [Google Scholar] [CrossRef]
  8. Akhlaghi, N.; Najafpour-Darzi, G. A comprehensive review on biological hydrogen production. Int. J. Hydrogen Energy 2020, 45, 22492–22512. [Google Scholar] [CrossRef]
  9. Gupta, A.; Likozar, B.; Jana, R.; Chanu, W.C.; Singh, M.K. A review of hydrogen production processes by photocatalytic water splitting—From atomistic catalysis design to optimal reactor engineering. Int. J. Hydrogen Energy 2022, 47, 33282–33307. [Google Scholar] [CrossRef]
  10. Agyekum, E.B.; Nutakor, C.; Agwa, A.M.; Kamel, S. A critical review of renewable hydrogen production methods: Factors affecting their scale-up and its role in future energy generation. Membranes 2022, 12, 173. [Google Scholar] [CrossRef]
  11. Villa, K.; Galán-Mascarós, J.R.; López, N.; Palomares, E. Photocatalytic water splitting: Advantages and challenges. Sustain. Energy Fuels 2021, 5, 4560–4569. [Google Scholar] [CrossRef]
  12. Reddy, N.L.; Rao, V.N.; Kumari, M.M.; Kakarla, R.R.; Ravi, P.; Sathish, M.; Karthik, M.; Venkatakrishnan, S.M.; Inamuddin. Nanostructured semiconducting materials for efficient hydrogen generation. Environ. Chem. Lett. 2018, 16, 765–796. [Google Scholar] [CrossRef]
  13. Khan, N.; Burashev, G.; Kadylbekova, A.; Atabaev, T.S.; Bakenov, Z.; Sultanov, F.; Mentbayeva, A.; Tatykayev, B. Sustainable scalable solid-state synthesis of highly efficient synergetic 2D/0D micro/nanostructured g-C3N4/CdS photocatalysts for hydrogen production and water purification. Sustain. Mater. Technol. 2024, 41, e01063. [Google Scholar] [CrossRef]
  14. Tahir, M.; Tasleem, S.; Tahir, B. Recent development in band engineering of binary semiconductor materials for solar driven photocatalytic hydrogen production. Int. J. Hydrogen Energy 2020, 45, 15985–16038. [Google Scholar] [CrossRef]
  15. Zhu, H.; Gou, L.; Li, C.; Fu, X.; Weng, Y.; Chen, L.; Fang, B.; Shuai, L.; Liao, G. Dual interfacial electric fields in black phosphorus/MXene/MBene enhance broad-spectrum carrier migration efficiency of photocatalytic devices. Device 2024, 2, 100283. [Google Scholar] [CrossRef]
  16. Manohar, A.; Suvarna, T.; Chintagumpala, K.; Ubaidullah, M.; Mameda, N.; Kim, K.H. Exploring progress in binary and ternary nanocomposites for photoelectrochemical water splitting: A comprehensive review. Coord. Chem. Rev. 2025, 522, 216180. [Google Scholar] [CrossRef]
  17. Xing, Z.; Li, Z.; Zhou, W. Semiconductor-Based Nanomaterials for Photocatalytic Hydrogen Generation. In Hydrogen Production Technologies; Scrivener Publishing: Austin, TX, USA, 2017; pp. 487–543. [Google Scholar]
  18. Yuan, Y.-J.; Chen, D.; Yu, Z.-T.; Zou, Z.-G. Cadmium sulfide-based nanomaterials for photocatalytic hydrogen production. J. Mater. Chem. A 2018, 6, 11606–11630. [Google Scholar] [CrossRef]
  19. Wang, Q.; Li, J.; Bai, Y.; Lian, J.; Huang, H.; Li, Z.; Lei, Z.; Shangguan, W. Photochemical preparation of Cd/CdS photocatalysts and their efficient photocatalytic hydrogen production under visible light irradiation. Green Chem. 2014, 16, 2728–2735. [Google Scholar] [CrossRef]
  20. Zheng, L.; Teng, F.; Ye, X.; Zheng, H.; Fang, X. Photo/electrochemical applications of metal sulfide/TiO2 heterostructures. Adv. Energy Mater. 2020, 10, 1902355. [Google Scholar] [CrossRef]
  21. Rao, V.N.; Ravi, P.; Sathish, M.; Vijayakumar, M.; Sakar, M.; Karthik, M.; Balakumar, S.; Reddy, K.R.; Shetti, N.P.; Aminabhavi, T.M.; et al. Metal chalcogenide-based core/shell photocatalysts for solar hydrogen production: Recent advances, properties and technology challenges. J. Hazard. Mater. 2021, 415, 125588. [Google Scholar]
  22. Vattikuti, S.P.; Shim, J.; Byon, C. Synthesis, characterization, and optical properties of visible light-driven Bi2S3 nanorod photocatalysts. J. Mater. Sci. Mater. Electron. 2017, 28, 14282–14292. [Google Scholar] [CrossRef]
  23. Hao, L.-X.; Chen, G.; Yu, Y.-G.; Zhou, Y.-S.; Han, Z.-H.; Liu, Y. Sonochemistry synthesis of Bi2S3/CdS heterostructure with enhanced performance for photocatalytic hydrogen evolution. Int. J. Hydrogen Energy 2014, 39, 14479–14486. [Google Scholar] [CrossRef]
  24. Zhang, Y.; Jin, Z.; Liu, D.; Tan, Z.; Mamba, B.B.; Kuvarega, A.T.; Gui, J. S-scheme Bi2S3/CdS nanorod heterojunction photocatalysts with improved carrier separation and redox capacity for pollutant removal. ACS Appl. Nano Mater. 2022, 5, 5448–5458. [Google Scholar] [CrossRef]
  25. Ghoreishian, S.M.; Ranjith, K.S.; Park, B.; Hwang, S.-K.; Hosseini, R.; Behjatmanesh-Ardakani, R.; Pourmortazavi, S.M.; Lee, H.U.; Son, B.; Mirsadeghi, S.; et al. Full-spectrum-responsive Bi2S3@CdS S-scheme heterostructure with intimated ultrathin RGO toward photocatalytic Cr(VI) reduction and H2O2 production: Experimental and DFT studies. Chem. Eng. J. 2021, 419, 129530. [Google Scholar] [CrossRef]
  26. Liu, Z.; Sun, D.; Wang, C.; You, B.; Li, B.; Han, J.; Jiang, S.; Zhang, C.; He, S. Zeolitic imidazolate framework-67 and its derivatives for photocatalytic applications. Coord. Chem. Rev. 2024, 502, 215612. [Google Scholar] [CrossRef]
  27. Sharma, S.; Sonu; Sudhaik, A.; Khan, A.A.P.; Saini, A.K.; Mittal, D.; Nguyen, V.-H.; van Le, Q.; Ahamad, T.; Raizada, P. Potential of novel dual Z-scheme carbon quantum dots decorated MnIn2S4/CdS/Bi2S3 heterojunction for environmental applications. Environ. Sci. Pollut. Res. 2023, 30, 77622–77641. [Google Scholar] [CrossRef]
  28. Zhang, L.; Ai, Z.; Xu, X.; Shi, D.; Zhang, B.; Hu, H.; Yang, M.; Shao, Y.; Wu, Y.; Hao, X. Research progress on synthetic and modification strategies of CdS-based photocatalysts. Ionics 2023, 29, 2115–2139. [Google Scholar] [CrossRef]
  29. Yang, M.; Shi, Y.; Li, Y.; Li, H.; Luo, N.; Li, J.; Fan, J.; Zhou, A. Construction of 2D Bi2S3/CdS Nanosheet Arrays for Enhanced Photoelectrochemical Hydrogen Evolution. J. Electron. Mater. 2019, 48, 6397–6405. [Google Scholar] [CrossRef]
  30. Li, M.; Yao, H.; Yao, S.; Chen, G.; Sun, J. Vacancy-induced tensile strain of CdS/Bi2S3 as a highly performance and robust photocatalyst for hydrogen evolution. J. Colloid Interface Sci. 2023, 630, 224–234. [Google Scholar] [CrossRef]
  31. Hu, H.; He, Y.; Wang, X.; Zhang, T.; Li, D.; Sun, M.; Deng, C. An intermediary route to CdS/Bi2S3 architectures with high-activity and stability in photocatalytic water splitting and dye degradation. Mater. Sci. Eng. B 2024, 305, 117431. [Google Scholar] [CrossRef]
  32. Li, X.; Chen, J.; Li, H.; Li, J.; Xu, Y.; Liu, Y.; Zhou, J. Photoreduction of CO2 to methanol over Bi2S3/CdS photocatalyst under visible light irradiation. J. Nat. Gas Chem. 2011, 20, 413–417. [Google Scholar] [CrossRef]
  33. Fang, Z.; Liu, Y.; Fan, Y.; Ni, Y.; Wei, X.; Tang, K.; Shen, J.; Chen, Y. Epitaxial growth of CdS nanoparticle on Bi2S3 nanowire and photocatalytic application of the heterostructure. J. Phys. Chem. C 2011, 115, 13968–13976. [Google Scholar] [CrossRef]
  34. Zhang, N.; Lü, J.; Cao, R. Photocatalytic CO2–to–Ethylene conversion over Bi2S3/CdS heterostructures constructed via facile cation exchange. Research 2022, 2022, 9805879. [Google Scholar]
  35. Yan, Y.; Zhou, Z.; Li, W.; Zhu, Y.; Cheng, Y.; Zhao, F.; Zhou, J. Facile ion-exchange synthesis of urchin-shaped CdS/Bi2S3 heterostructures with enhanced photostability and visible light photocatalytic activity. RSC Adv. 2014, 4, 38558–38567. [Google Scholar] [CrossRef]
  36. Shi, Y.; Chen, Y.; Tian, G.; Fu, H.; Pan, K.; Zhou, J.; Yan, H. One-pot controlled synthesis of sea-urchin shaped Bi2S3/CdS hierarchical heterostructures with excellent visible light photocatalytic activity. Dalton Trans. 2014, 43, 12396–12404. [Google Scholar] [CrossRef]
  37. Panmand, R.P.; Sethi, Y.A.; Deokar, R.S.; Late, D.J.; Gholap, H.M.; Baeg, J.-O.; Kale, B.B. In situ fabrication of highly crystalline CdS decorated Bi2S3 nanowires (nano-heterostructure) for visible light photocatalyst application. RSC Adv. 2016, 6, 23508–23517. [Google Scholar] [CrossRef]
  38. Uddin, M.R.; Khan, M.R.; Rahman, M.W.; Cheng, C.K.; Yousuf, A. Photocatalytic conversion of CO2 into methanol: Significant enhancement of the methanol yield over Bi2S3/CdS photocatalyst. Int. J. Eng. Technol. Sci. 2015, 3. [Google Scholar] [CrossRef]
  39. Desale, D.J.; Shaikh, S.; Ghosh, A.; Birajadar, R.; Siddiqui, F.; Ghule, A.; Sharma, R.B. Preparation and characterization of CdS–Bi2S3 nanocomposite thin film by successive ionic layer adsorption and reaction (SILAR) method. Compos. Part B Eng. 2012, 43, 1095–1100. [Google Scholar] [CrossRef]
  40. Mendhe, A.C.; Majumder, S.; Pawar, S.M.; Sankapal, B.R. Facile Bi2S3 nanoparticles on CdS nanowires surface: Core-shell nanostructured design towards solar cell application. Surf. Interfaces 2021, 27, 101457. [Google Scholar] [CrossRef]
  41. Shalabayev, Z.; Baláž, M.; Khan, N.; Nurlan, Y.; Augustyniak, A.; Daneu, N.; Tatykayev, B.; Dutková, E.; Burashev, G.; Casas-Luna, M.; et al. Sustainable synthesis of cadmium sulfide, with applicability in photocatalysis, hydrogen production, and as an antibacterial agent, using two mechanochemical protocols. Nanomaterials 2022, 12, 1250. [Google Scholar] [CrossRef]
  42. Burashev, G.; Tatykayev, B.; Baláž, M.; Khan, N.; Jumagazieva, A.; Iskakbayeva, Z.; Seysembekova, A.; Tugelbay, S.; Turgynbay, N.; Niyazbayeva, A.; et al. The superiority of the photocatalytic and antibacterial performance of mechanochemically synthesized CdS nanoparticles over solvothermal-prepared ones. Semicond. Sci. Technol. 2024, 39, 045006. [Google Scholar] [CrossRef]
  43. Wang, J.; Wang, Z.; Dai, K.; Zhang, J. Review on inorganic–organic S-scheme photocatalysts. J. Mater. Sci. Technol. 2023, 165, 187–218. [Google Scholar] [CrossRef]
  44. Colacino, E.; Dayaker, G.; Morère, A.; Friščić, T. Introducing students to mechanochemistry via environmentally friendly organic synthesis using a solvent-free mechanochemical preparation of the antidiabetic drug tolbutamide. J. Chem. Educ. 2019, 96, 766–771. [Google Scholar] [CrossRef]
  45. Głowniak, S.; Szczęśniak, B.; Choma, J.; Jaroniec, M. Mechanochemistry: Toward green synthesis of metal–organic frameworks. Mater. Today 2021, 46, 109–124. [Google Scholar] [CrossRef]
  46. Malca, M.Y.; Bao, H.; Bastaille, T.; Saadé, N.K.; Kinsella, J.M.; Friščić, T.; Moores, A. Mechanically activated solvent-free assembly of ultrasmall Bi2S3 nanoparticles: A novel, simple, and sustainable means to access chalcogenide nanoparticles. Chem. Mater. 2017, 29, 7766–7773. [Google Scholar] [CrossRef]
  47. Tatykayev, B.; Chouchene, B.; Balan, L.; Gries, T.; Medjahdi, G.; Girot, E.; Uralbekov, B.; Schneider, R. Heterostructured g-CN/TiO2 photocatalysts prepared by thermolysis of g-CN/MIL-125(Ti) composites for efficient pollutant degradation and hydrogen production. Nanomaterials 2020, 10, 1387. [Google Scholar] [CrossRef]
  48. Coelho, A.A. TOPAS and TOPAS-Academic: An optimization program integrating computer algebra and crystallographic objects written in C++. J. Appl. Crystallogr. 2018, 51, 210–218. [Google Scholar] [CrossRef]
  49. Evans, J.S. Advanced input files & parametric quantitative analysis using topas. In Material Science Forum; Trans Tech Publications Ltd.: Zurich, Switzerland, 2010; Volume 651, pp. 1–9. [Google Scholar]
  50. Motaung, M.P.; Onwudiwe, D.C.; Lei, W. Microwave-assisted synthesis of Bi2S3 and Sb2S3 nanoparticles and their photoelectrochemical properties. ACS Omega 2021, 6, 18975–18987. [Google Scholar] [CrossRef]
  51. Kumari, P.; Awasthi, K.; Agarwal, S.; Ichikawa, T.; Kumar, M.; Jain, A. Flower-like Bi2S3 nanostructures as highly efficient anodes for all-solid-state lithium-ion batteries. RSC Adv. 2019, 9, 29549–29555. [Google Scholar] [CrossRef]
  52. Kumar, P.; Saxena, N.; Chandra, R.; Gupta, V.; Agarwal, A.; Kanjilal, D. Nanotwinning and structural phase transition in CdS quantum dots. Nanoscale Res. Lett. 2012, 7, 584. [Google Scholar] [CrossRef]
  53. Briggs, R.; Ramdas, A. Piezospectroscopic study of the Raman spectrum of cadmium sulfide. Phys. Rev. B 1976, 13, 5518. [Google Scholar] [CrossRef]
  54. Tell, B.; Damen, T.; Porto, S. Raman effect in cadmium sulfide. Phys. Rev. 1966, 144, 771. [Google Scholar] [CrossRef]
  55. Chuu, D.; Dai, C.; Hsieh, W.; Tsai, C. Raman investigations of the surface modes of the crystallites in CdS thin films grown by pulsed laser and thermal evaporation. J. Appl. Phys. 1991, 69, 8402–8404. [Google Scholar] [CrossRef]
  56. Richter, H.; Wang, Z.; Ley, L. The one phonon Raman spectrum in microcrystalline silicon. Solid State Commun. 1981, 39, 625–629. [Google Scholar] [CrossRef]
  57. Sambathkumar, C.; Manirathinam, V.; Manikandan, A.; Krishna Kumar, M.; Sudhahar, S.; Devendran, P. Solvothermal synthesis of Bi2S3 nanoparticles for active photocatalytic and energy storage device applications. J. Mater. Sci. Mater. Electron. 2021, 32, 20827–20843. [Google Scholar] [CrossRef]
  58. Vattikuti, S.P.; Police, A.K.R.; Shim, J.; Byon, C. Sacrificial-template-free synthesis of core-shell C@Bi2S3 heterostructures for efficient supercapacitor and H2 production applications. Sci. Rep. 2018, 8, 4194. [Google Scholar] [CrossRef]
  59. Zuo, X.-Q.; Yang, X.; Zhou, L.; Yang, B.; Li, G.; Tang, H.-B.; Zhang, H.-J.; Wu, M.-Z.; Ma, Y.-Q.; Jin, S.-W. Facile synthesis of Bi₂S3–C composite microspheres as low-cost counter electrodes for dye-sensitized solar cells. RSC Adv. 2014, 4, 57412–57418. [Google Scholar] [CrossRef]
  60. Ferrari, A.C.; Robertson, J. Interpretation of Raman spectra of disordered and amorphous carbon. Phys. Rev. B 2000, 61, 14095. [Google Scholar] [CrossRef]
  61. Boughdachi, S.; Azizian-Kalandaragh, Y.; Badali, Y.; Altındal, Ş. Facile ultrasound-assisted and microwave-assisted methods for preparation of Bi2S3-PVA nanostructures: Exploring their pertinent structural and optical properties and comparative studies on the electrical, properties of Au/(Bi2S3-PVA)/n-Si Schottky structure. J. Mater. Sci. Mater. Electron. 2017, 28, 17948–17960. [Google Scholar]
  62. López-Cabaña, Z.; Torres, C.M.S.; González, G. Semiconducting properties of layered cadmium sulphide-based hybrid nanocomposites. Nanoscale Res. Lett. 2011, 6, 523. [Google Scholar] [CrossRef]
  63. Kumar, S.; Sharma, P.; Sharma, V. Redshift in Absorption Edge of Cd1−xCoxS Nanofilms. IEEE Trans. Nanotechnol. 2014, 13, 343–348. [Google Scholar] [CrossRef]
  64. Tauc, J.; Scott, T.A. The optical properties of solids. Phys. Today 1967, 20, 105–107. [Google Scholar] [CrossRef]
  65. Li, P.; Zhang, X.; Hou, C.; Chen, Y.; He, T. Highly efficient visible-light driven solar-fuel production over tetra(4-carboxyphenyl)porphyrin iron(III) chloride using CdS/Bi2S3 heterostructure as photosensitizer. Appl. Catal. B Environ. 2018, 238, 656–663. [Google Scholar] [CrossRef]
  66. Zhang, N.; Liu, X.; Wei, Z.; Liu, H.; Peng, J.; Zhou, L.; Li, H.; Fan, H. Cell imaging using two-photon excited CdS fluorescent quantum dots working within the biological window. Nanomaterials 2019, 9, 369. [Google Scholar] [CrossRef]
  67. Wei, Z.; Mao, W.; Liu, J.; Xiao, Y.; Zhu, M.; Tian, Y. CdS nanorods decorated with ultrathin MoS2 nanosheets for efficient visible-light photocatalytic H2 production. J. Mater. Sci. Mater. Electron. 2020, 31, 4574–4581. [Google Scholar] [CrossRef]
  68. Khan, M.S.; Gul, B.; Khan, G.; Benaadad, M.; Ghlamallah, B.; Khattak, S.A.; Khan, T.; Zulfiqar, S.; Shah, S.K.; Khan, M.A. Ab-initio study about the electronic, optical and thermoelectric nature of α-, β-, and γ-phases of CdS semiconductor: Using the accurate m-BJ approach. Phys. Scr. 2021, 96, 055803. [Google Scholar]
  69. Luo, X.; Wang, G.; Huang, Y.; Wang, B.; Yuan, H.; Chen, H. A two-dimensional layered CdS/C2 N heterostructure for visible-light-driven photocatalysis. Phys. Chem. Chem. Phys. 2017, 19, 28216–28224. [Google Scholar] [CrossRef]
  70. Mahendra, K.; Anupriya, J.; Gajendra, N.; Madhusudhan, C.; Nagaraja, B.; Pattar, J.; Udayashankar, N. Visible-light-driven photocatalytic degradation of organic dyes over cubic-phase and hexagonal-phase CdS: A comparative study. J. Mater. Sci. Mater. Electron. 2023, 34, 730. [Google Scholar] [CrossRef]
  71. Yang, X.; Wang, B.; Mu, Y.; Zheng, M.; Wang, Y. Photocatalytic performance of cubic and hexagonal phase CdS synthesized via different Cd sources. J. Electron. Mater. 2019, 48, 2895–2901. [Google Scholar] [CrossRef]
  72. Baláž, P.; Baláž, M.; Achimovičová, M.; Bujňáková, Z.; Dutková, E. Chalcogenide mechanochemistry in materials science: Insight into synthesis and applications (a review). J. Mater. Sci. 2017, 52, 11851–11890. [Google Scholar] [CrossRef]
  73. Sahu, M.; Park, C. A comprehensive review on bismuth-sulfide-based compounds. Mater. Today Sustain. 2023, 23, 100441. [Google Scholar] [CrossRef]
  74. Mamiyev, Z.; Balayeva, N.O. Metal sulfide photocatalysts for hydrogen generation: A review of recent advances. Catalysts 2022, 12, 1316. [Google Scholar] [CrossRef]
  75. Cui, J.; Wang, Y.; Lin, L.; Yang, X.; Luo, X.; Guo, S.; Xu, X. Single-atomic activation on ZnIn2S4 basal planes boosts photocatalytic hydrogen evolution. Nano Res. 2024, 17, 5949–5955. [Google Scholar] [CrossRef]
  76. Wang, S.; Liao, W.; Su, H.; Pang, S.; Yang, C.; Fu, Y.; Zhang, Y. Review on the application of semiconductor heterostructures in photocatalytic hydrogen evolution: State-of-the-art and outlook. Energy Fuels 2023, 37, 1633–1656. [Google Scholar] [CrossRef]
  77. Li, C.; Yuan, J.; Han, B.; Shangguan, W. Synthesis and photochemical performance of morphology-controlled CdS photocatalysts for hydrogen evolution under visible light. Int. J. Hydrogen Energy 2011, 36, 4271–4279. [Google Scholar] [CrossRef]
  78. Li, Y.; Tang, L.; Peng, S.; Li, Z.; Lu, G. Phosphate-assisted hydrothermal synthesis of hexagonal CdS for efficient photocatalytic hydrogen evolution. CrystEngComm 2012, 14, 6974–6982. [Google Scholar] [CrossRef]
  79. Li, X.; Jun, L.; Xiao, J.; Xu, Y.; Yang, C.; Tang, J.; Zhou, K.; Gong, X.; Zhou, X.; Zou, H. Study on the relationship between Bi2S3 with different morphologies and its photocatalytic hydrogen production performance. J. Anal. Sci. Technol. 2022, 13, 19. [Google Scholar] [CrossRef]
  80. Vattikuti, S.P.; Nagajyothi, P.; Shim, J. Fabrication of CdS quantum dot/Bi2S3 nanocomposite photocatalysts for enhanced H2 production under simulated solar light. J. Mater. Sci. Mater. Electron. 2019, 30, 5681–5690. [Google Scholar] [CrossRef]
  81. Nethercot Jr, A.H. Prediction of Fermi energies and photoelectric thresholds based on electronegativity concepts. Phys. Rev. Lett. 1974, 33, 1088. [Google Scholar] [CrossRef]
  82. Li, X.; Zhu, J.; Li, H. Comparative study on the mechanism in photocatalytic degradation of different-type organic dyes on SnS2 and CdS. Appl. Catal. B Environ. 2012, 123, 174–181. [Google Scholar] [CrossRef]
  83. Xu, Q.; Zhang, L.; Cheng, B.; Fan, J.; Yu, J. S-scheme heterojunction photocatalyst. Chem 2020, 6, 1543–1559. [Google Scholar] [CrossRef]
  84. Wang, Y.; Liu, M.; Wu, C.; Gao, J.; Li, M.; Xing, Z.; Li, Z.; Zhou, W. Hollow nanoboxes Cu2−xS@ZnIn2S4 core-shell S-scheme heterojunction with broad-spectrum response and enhanced photothermal-photocatalytic performance. Small 2022, 18, 2202544. [Google Scholar] [CrossRef] [PubMed]
  85. Sharma, K.; Hasija, V.; Malhotra, M.; Verma, P.K.; Khan, A.A.P.; Thakur, S.; van Le, Q.; Quang, H.H.P.; Nguyen, V.-H.; Singh, P.; et al. A review of CdS-based S-scheme for photocatalytic water splitting: Synthetic strategy and identification techniques. Int. J. Hydrogen Energy 2023, 52, 804–818. [Google Scholar] [CrossRef]
  86. Hasija, V.; Kumar, A.; Sudhaik, A.; Raizada, P.; Singh, P.; van Le, Q.; Le, T.T.; Nguyen, V.-H. Step-scheme heterojunction photocatalysts for solar energy, water splitting, CO2 conversion, and bacterial inactivation: A review. Environ. Chem. Lett. 2021, 19, 2941–2966. [Google Scholar] [CrossRef]
Figure 1. Illustration scheme of CdS/Bi2S3 nanocomposite’s preparation.
Nanomaterials 14 01785 g001
Figure 2. XRD patterns of the CdS, Bi2S3, and CdS/Bi2S3 samples.
Nanomaterials 14 01785 g002
Figure 3. Raman spectra (a) and FTIR spectra (b) of the bare CdS, Bi2S3, and CdS/Bi2S3 nanocomposite.
Nanomaterials 14 01785 g003
Figure 4. UV-Vis spectra (a) and Tauc plot graph (b) of as-synthesized CdS, Bi2S3, and CdS/Bi2S3 samples.
Nanomaterials 14 01785 g004
Figure 5. XPS spectra of the CdS (a,b) and Bi2S3 (c) samples. (d) XPS valence-band spectra, the maximum value of the tangent intersection and the minimum value of the tangent intersection of CdS and Bi2S3 samples.
Nanomaterials 14 01785 g005
Figure 6. SEM images of the CdS (a,b), Bi2S3 (c,d), and CdS/Bi2S3 (e,f) samples.
Nanomaterials 14 01785 g006
Figure 7. TEM images of the CdS (a), Bi2S3 (b), CdS/Bi2S3 (c,d), and HR-TEM images of CdS/Bi2S3 (e,f) samples.
Nanomaterials 14 01785 g007
Figure 8. HER (a) and AQE values (b) at 30-minute intervals of the CdS, Bi2S3, and CdS/Bi2S3 samples.
Nanomaterials 14 01785 g008
Figure 9. Study of photocatalytic activity of nanocomposite (a) using different sacrificial agents and (b) cyclic experiments to study the stability of the photocatalyst.
Nanomaterials 14 01785 g009
Figure 10. Energy band-structure diagram of CdS/Bi2S3 and S-scheme pathway for the photocatalytic mechanism of photocatalytic H2 evolution.
Nanomaterials 14 01785 g010
Disclaimer/Publisher’s Note: The statements, opinions and data contained in all publications are solely those of the individual author(s) and contributor(s) and not of MDPI and/or the editor(s). MDPI and/or the editor(s) disclaim responsibility for any injury to people or property resulting from any ideas, methods, instructions or products referred to in the content.