Abstract
A transparent fluoroborosilicate glass ceramic was designed for the controllable precipitation of fluoride nanocrystals and to greatly enhance the photoluminescence of active ions. Through the introduction of B2O3 into fluorosilicate glass, the melting temperature was decreased from 1400 to 1050 °C, and the abnormal crystallization in the fabrication process of fluorosilicate glass was avoided. More importantly, the controlled crystallizations of KZnF3 and KYb3F10 in fluoroborosilicate glass ceramics enhanced the emission of Mn2+ and Mn2+–Yb3+ dimers by 6.7 and 54 times, respectively. Moreover, the upconversion emission color of glass ceramic could be modulated from yellow to white and blue by adjusting the Yb3+ concentration. The well-designed glass ceramic is a novel and significant compound to simultaneously provide efficiently coordinated sites for transition metal and rare earth ions. More importantly, the design strategy opens a new way for engineering high-quality oxy-fluoride glass ceramics with properties of excellent stability, controllable nano-crystallization and high-efficiency photoluminescence.
1. Introduction
Oxy-fluoride glass is a desired luminescent material that possesses an excellent stability of oxide network structures and a high luminescence efficiency of fluoride environments. In the past decades, extensive research has been conducted on various oxy-fluoride glasses for applications in lighting, solar cells and lasers [1,2,3,4]. Among these, fluorosilicate (FS) glasses have drawn the most attention due to their stable structures of [SiO4] frameworks [5,6,7,8,9,10,11]. More importantly, fluoride nanocrystals (NaYF4, LaF3, YF3, SrF2, etc.) have been successfully precipitated from the FS glasses via heat treatments to fabricate nano-crystallized glass ceramics (NGCs) due to the thermally metastable states of the glass [12,13,14,15,16,17,18,19,20,21,22,23,24,25,26]. These fluoride nanocrystals provide low-phonon-energy environments for active rare earth (RE) ions and dramatically enhance the luminescent efficiencies of glasses. However, the fabrication of high-quality FS NGCs, in particular, of bulk NGC samples, remains a grand challenge. On one hand, high-silica FS glass exhibits high melting temperature (>1400 °C), which leads to the drastic volatilization of fluorides and the severe erosion to the crucible. Though the melting temperature is decreased by increasing the content of fluorides in the FS glass, the crystallization of the NGC in low-silica glass is usually uncontrollable. Crystals are already precipitated in precursor glasses (PGs) with large sizes due to the low viscosity in networks in low-silica glass. As a result, the optical transmittance of FS–NGC decreases heavily, caused by the scattering of large crystal particles. This has prevented the practical application of FS–NGCs in optical devices. To tackle these questions, it is crucial to design and manufacture novel NGCs characterized by an efficient photoluminescence (PL), a low melting temperature and a controllable precipitation of fluoride nanocrystals.
In this study, a novel fluoroborosilicate (FBS) glass was synthesized by the introduction of B2O3 into FS glass for controllable crystallizations. The melting temperature of the FBS glass decreased from 1400 to 1050 °C by adding B2O3, avoiding the severe volatilization of fluorides in glass and reducing the erosion to crucible. The crystalline phases and microstructures of the FBS samples were investigated carefully to compare them with those of the FS samples. Through the heat treatments, KZnF3 and KYb3F10 nanocrystals were controllably precipitated in the FBS NGCs, which provided excellent fluoride crystal environments for enhancing the luminescence efficiency of transition metal (TM) ions and rare earth (RE) ions. To validate this concept, the luminescent characteristics of Mn2+- and Yb3+-doped NGCs were investigated. The well-designed glass exhibits large potential in the application of multi-color lighting, 3D information storage and tunable lasers.
2. Experimental
2.1. Materials and Preparations
In this work, the host PGs were selected with a nominal composition of (in mol%) xSiO2–(50–x) B2O3–25ZnF2–25KF (x = 40 and 50). The sample was called FBS–PG and FS–PG, respectively. For TM and RE ion doping, MnO and YbF3 were selected as doping sources. All materials were produced by Xinzhen New Material Co., Ltd. (Ganzhou, China). All glasses were fabricated via the melt-quenching technique [27]. The stoichiometric mixture of 30 g reagent grade SiO2 (99.99%), B2O3 (99.99%), ZnF2 (99.99%), KF (99.99%), YbF3 (99.99%) and MnO (99.99%) were fully mixed and melted in quartz crucible for 30 min (the melting temperatures of FBS–PG and FS–PG were 1050 and 1400 °C, respectively). Moreover, the FS–PG sample was also melted in a platinum rhodium crucible. The molten glass was cast into a precooled brass mold, and another copper plate was used to press the glass sample to obtain PG samples. Subsequently, these PG samples were heated at 500 °C and 520 °C for 5 h to prepare NGCs based on the differential scanning calorimetry (DSC) results shown in Figure 1.
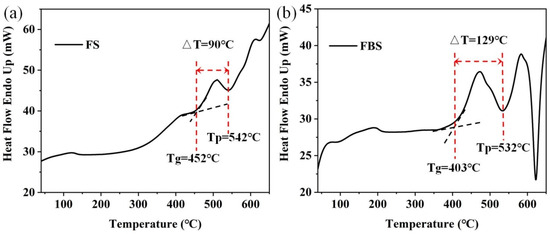
Figure 1.
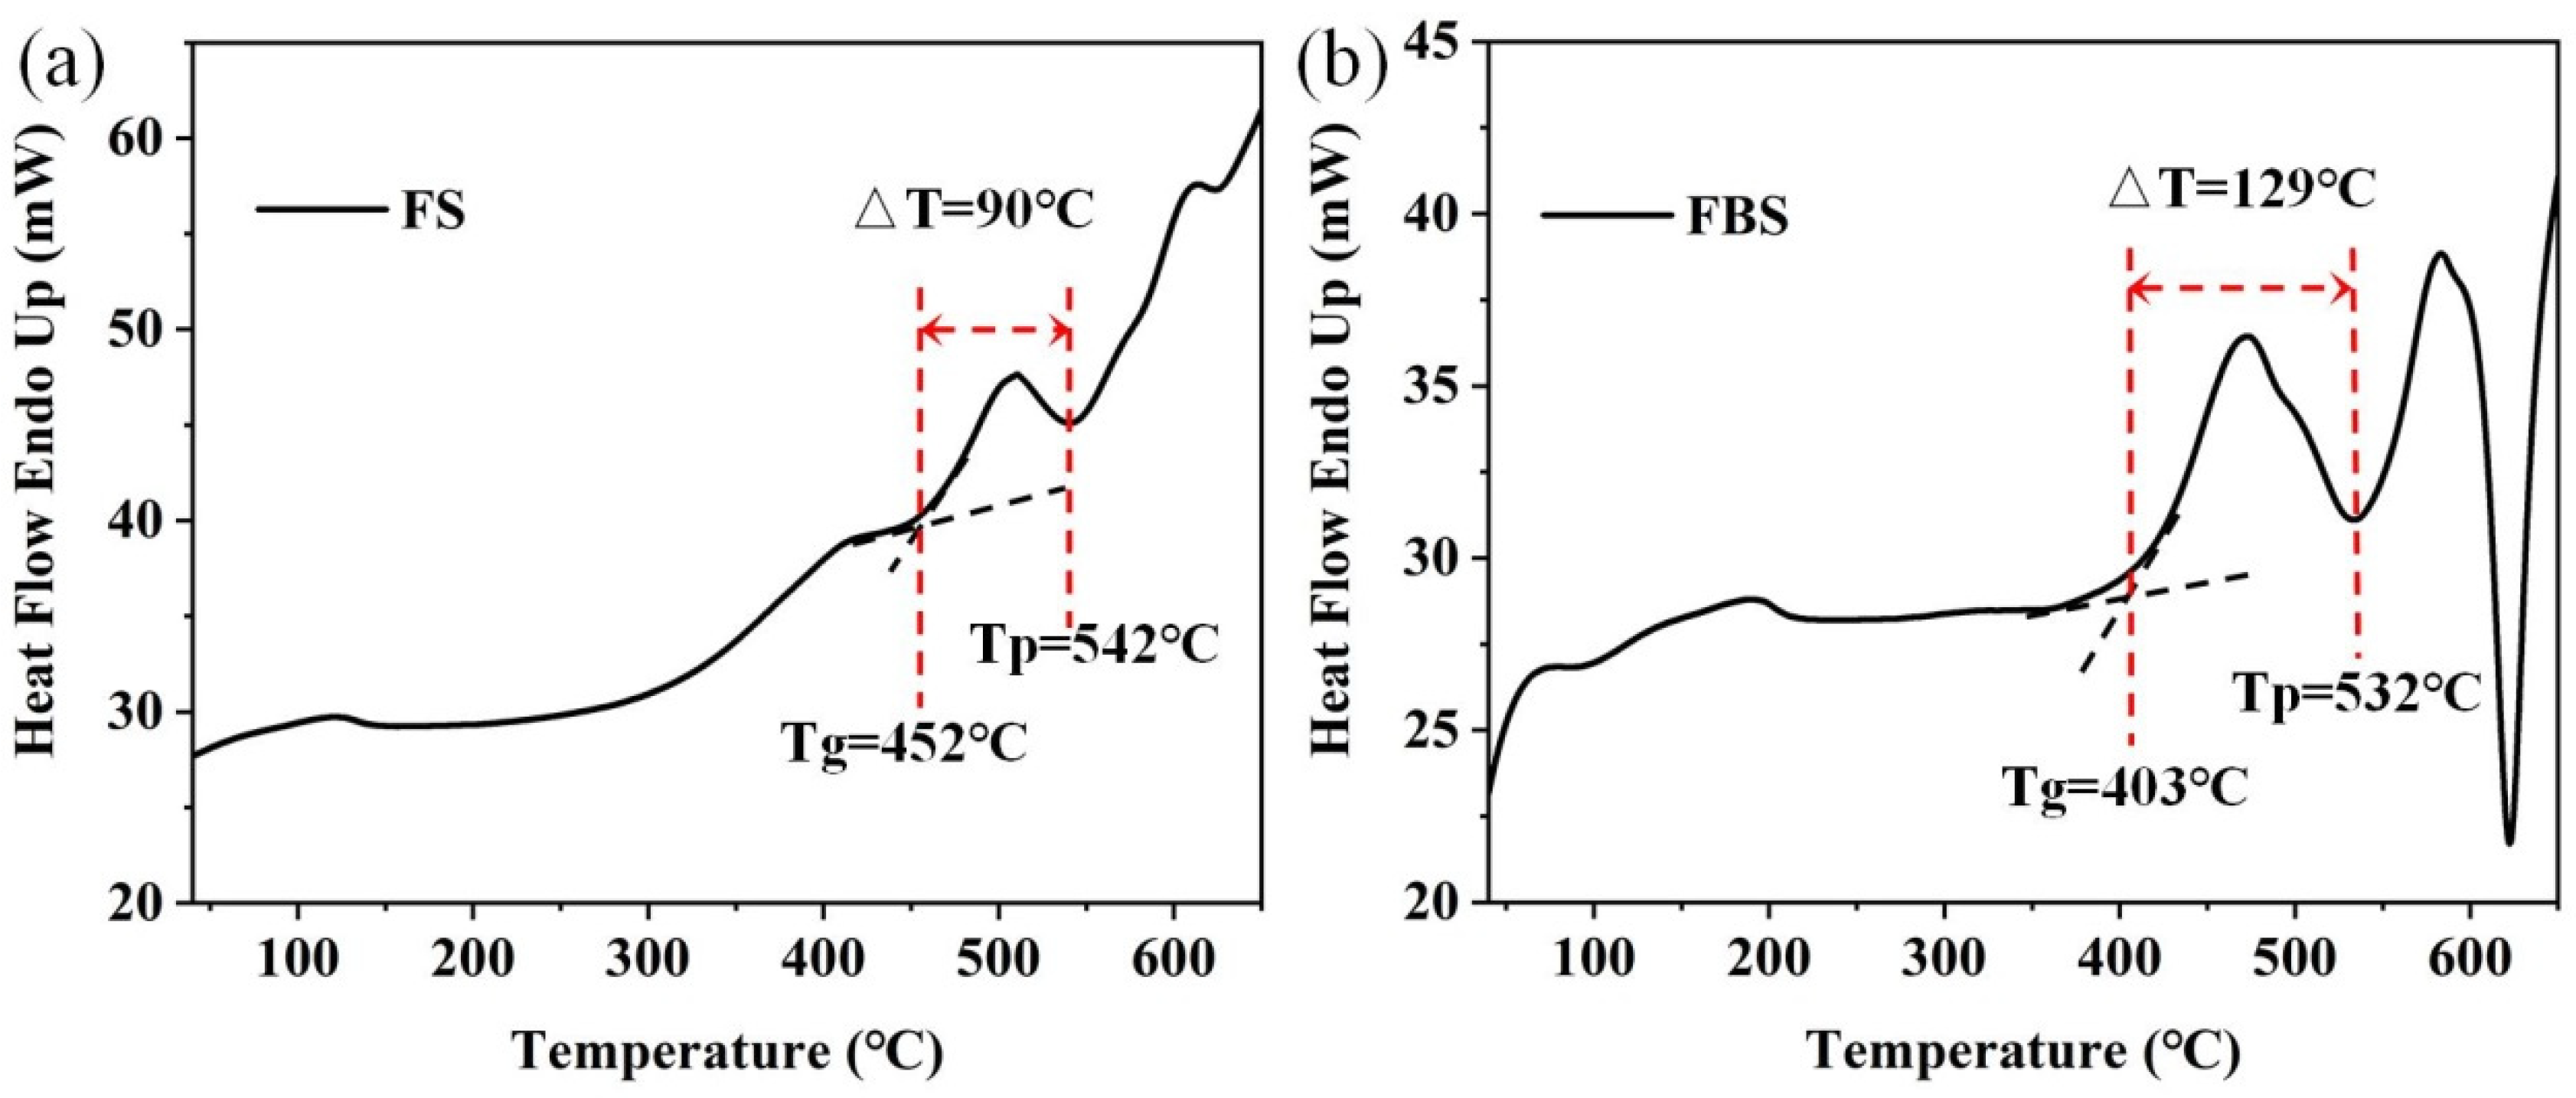
DSC curves of 1.0Mn2+-doped (a) FS and (b) FBS–PGs.
2.2. Characterization
The thermal stability of the glass was assessed via the DSC curve obtained using the STA449C Jupiter instrument (Netzsch, Selb, Germany) at a heating rate of 5K min−1 in an argon atmosphere. High-resolution transmission electron microscope (HR-TEM), high-angle annular dark field TEM (HAADF-TEM) and element mapping were measured with a Tecnai G2 instrument (FEI, Hillsboro, OR, USA). The working voltage was 200 kV, and the current on the sample was ~50 pA. TEM samples, approximately 40 nm in thickness, were obtained using conventional mechanical polishing followed by ion beam milling techniques (PIPS II, GATAN, Pleasanton, CA, USA). The amorphous and crystal states within the glass samples were characterized by X-ray diffraction (XRD) using a D8 advance X-ray diffractometer (Bruker, Fällanden, Switzerland) with Cu/Ka (λ = 0.1541 nm) radiation. The emission spectrum was characterized by an Edinburgh FLS980 fluorescence spectrometer (Edinburgh Instruments, Livingston, UK), utilizing a 450 W xenon lamp as the excitation source. The upconversion (UC) spectra and lifetime curves of the glass were obtained using the same spectrometer. A 980 nm semiconductor laser diode (LD) served as the excitation source for the UC spectra. All properties of samples were measured at room temperature.
3. Results and Discussion
The DSC curves presented in Figure 1a,b both contained a crystallization peak temperature (Tp) and a glass transition temperature (Tg). For the controllable precipitation of nanocrystals in FBS–NGCs, the heat treatment temperatures were set between Tg (403 °C) and Tp (532 °C). Thus, the heat treatment temperature of the FBS–PG was set to 500 and 520 °C to prepare NGCs embedded with fluoride nanocrystals. The difference value (ΔT) between Tg and Tp was used to evaluate the controllability of crystallization in glass. The ΔT of FS and FBS–PG was about 90 and 129 °C, respectively, suggesting that the crystallization in FBS–PG was more controllable compared to that in FS–PG. In the compositions of FBS glass, 10 mol% SiO2 was substituted by 10 mol% B2O3, which actually provided 20 mol% [BO4] units and thus strengthened the framework of glass. Hence, the introduction of B2O3 afforded remarkable prospects for the controllable nano-crystallization of fluoride crystals in FBS–NGCs.
In the past investigations, the FS–PG (50SiO2-25ZnF2-25KF) was proved to be a host for the crystallization of KZnF3 crystals to greatly enhance the PL emission of TM ions [28]. However, the PG melted by a platinum rhodium crucible possessed large tendency of crystallization during the glass fabrication process because superabundant fluorides were introduced into the glass. As shown in the inset of Figure 2a, the FS–PG was completely opaque and looked like a ceramic sample. As shown in Figure 2a, the transmittance of FS–PG was sharply reduced to 0% below 600 nm, and the visible light was hardly able to penetrate the sample due to the severe scattering by crystal particles in the PG sample. In fact, a substantial quantity of KZnF3 crystals have already precipitated in the PG during the glass fabrication process as proved by the bottom XRD pattern in Figure 2b. Generally, the controllable nano-crystallization in NGC should be achieved by the subsequent heat treatment of PG at a low temperature (a little higher than Tg). The crystallization during glass fabrication process is commonly uncontrollable. Moreover, the average size and the crystalline volume fraction of the KZnF3 crystals in the FS–PG was as large as 37.94 nm and 19%, respectively, as calculated from the XRD pattern. This severe and uncontrollable crystallization in the FS–PG makes it difficult to apply in practical optical devices. Moreover, the XRD pattern of the FS–NGC melted by a quartz crucible is also shown in Figure 2b. No peaks corresponding to KZnF3 crystals were detected; however, the sharp peaks in the XRD pattern were consistent with the diffraction peaks of K2SiF6 crystals (No: 85–1382), indicating that the crystalline phase in the NGC changed to K2SiF6. According to the works by Lin et al. [29], KZnF3 crystals tend to precipitate in low-silicon glasses, whereas K2SiF6 crystals are usually crystallized in the FS glasses containing high concentrations of SiO2. The precipitation of K2SiF6 crystals in the FS–NGC indicates that SiO2 from the quartz crucible was dissolved into the glass melt at the high temperature. These results indicate that it is difficult to prepare high-quality NGC based on the FS–PG with the controllable crystallization of KZnF3 nanocrystals.
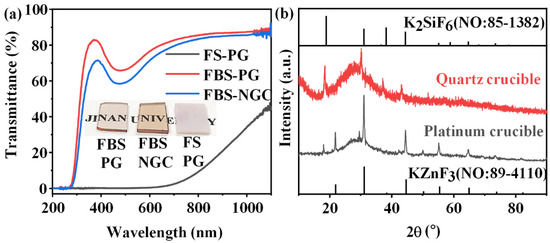
Figure 2.
(a) Transmission spectra of 1.0Mn2+-doped FS–PG, FBS–PG and NGC (treated at 500 °C for 5 h) samples; inset: digital photo of FBS–PG, FBS–NGC and FS–PG samples. (b) XRD patterns of FS–PGs melted in different crucibles.
Though the introduction of 10 mol% B2O3 into the glass to substitute SiO2, the total content of fluorides maintained in 50 mol%, and the melting temperature of glass decreased from 1400 to 1050 °C, which reduced the volatilization of fluorides and avoided the severe erosion of the crucible. The FBS–PG exhibited transparent as presented in the inset of Figure 2a. The FBS–PG possessed high transmittance (~76.5% at 600 nm) (Figure 2a) with a thickness of 2 mm. Thus, the uncontrollable crystallization during the fabrication process of glass could be avoided in the FBS–PG.
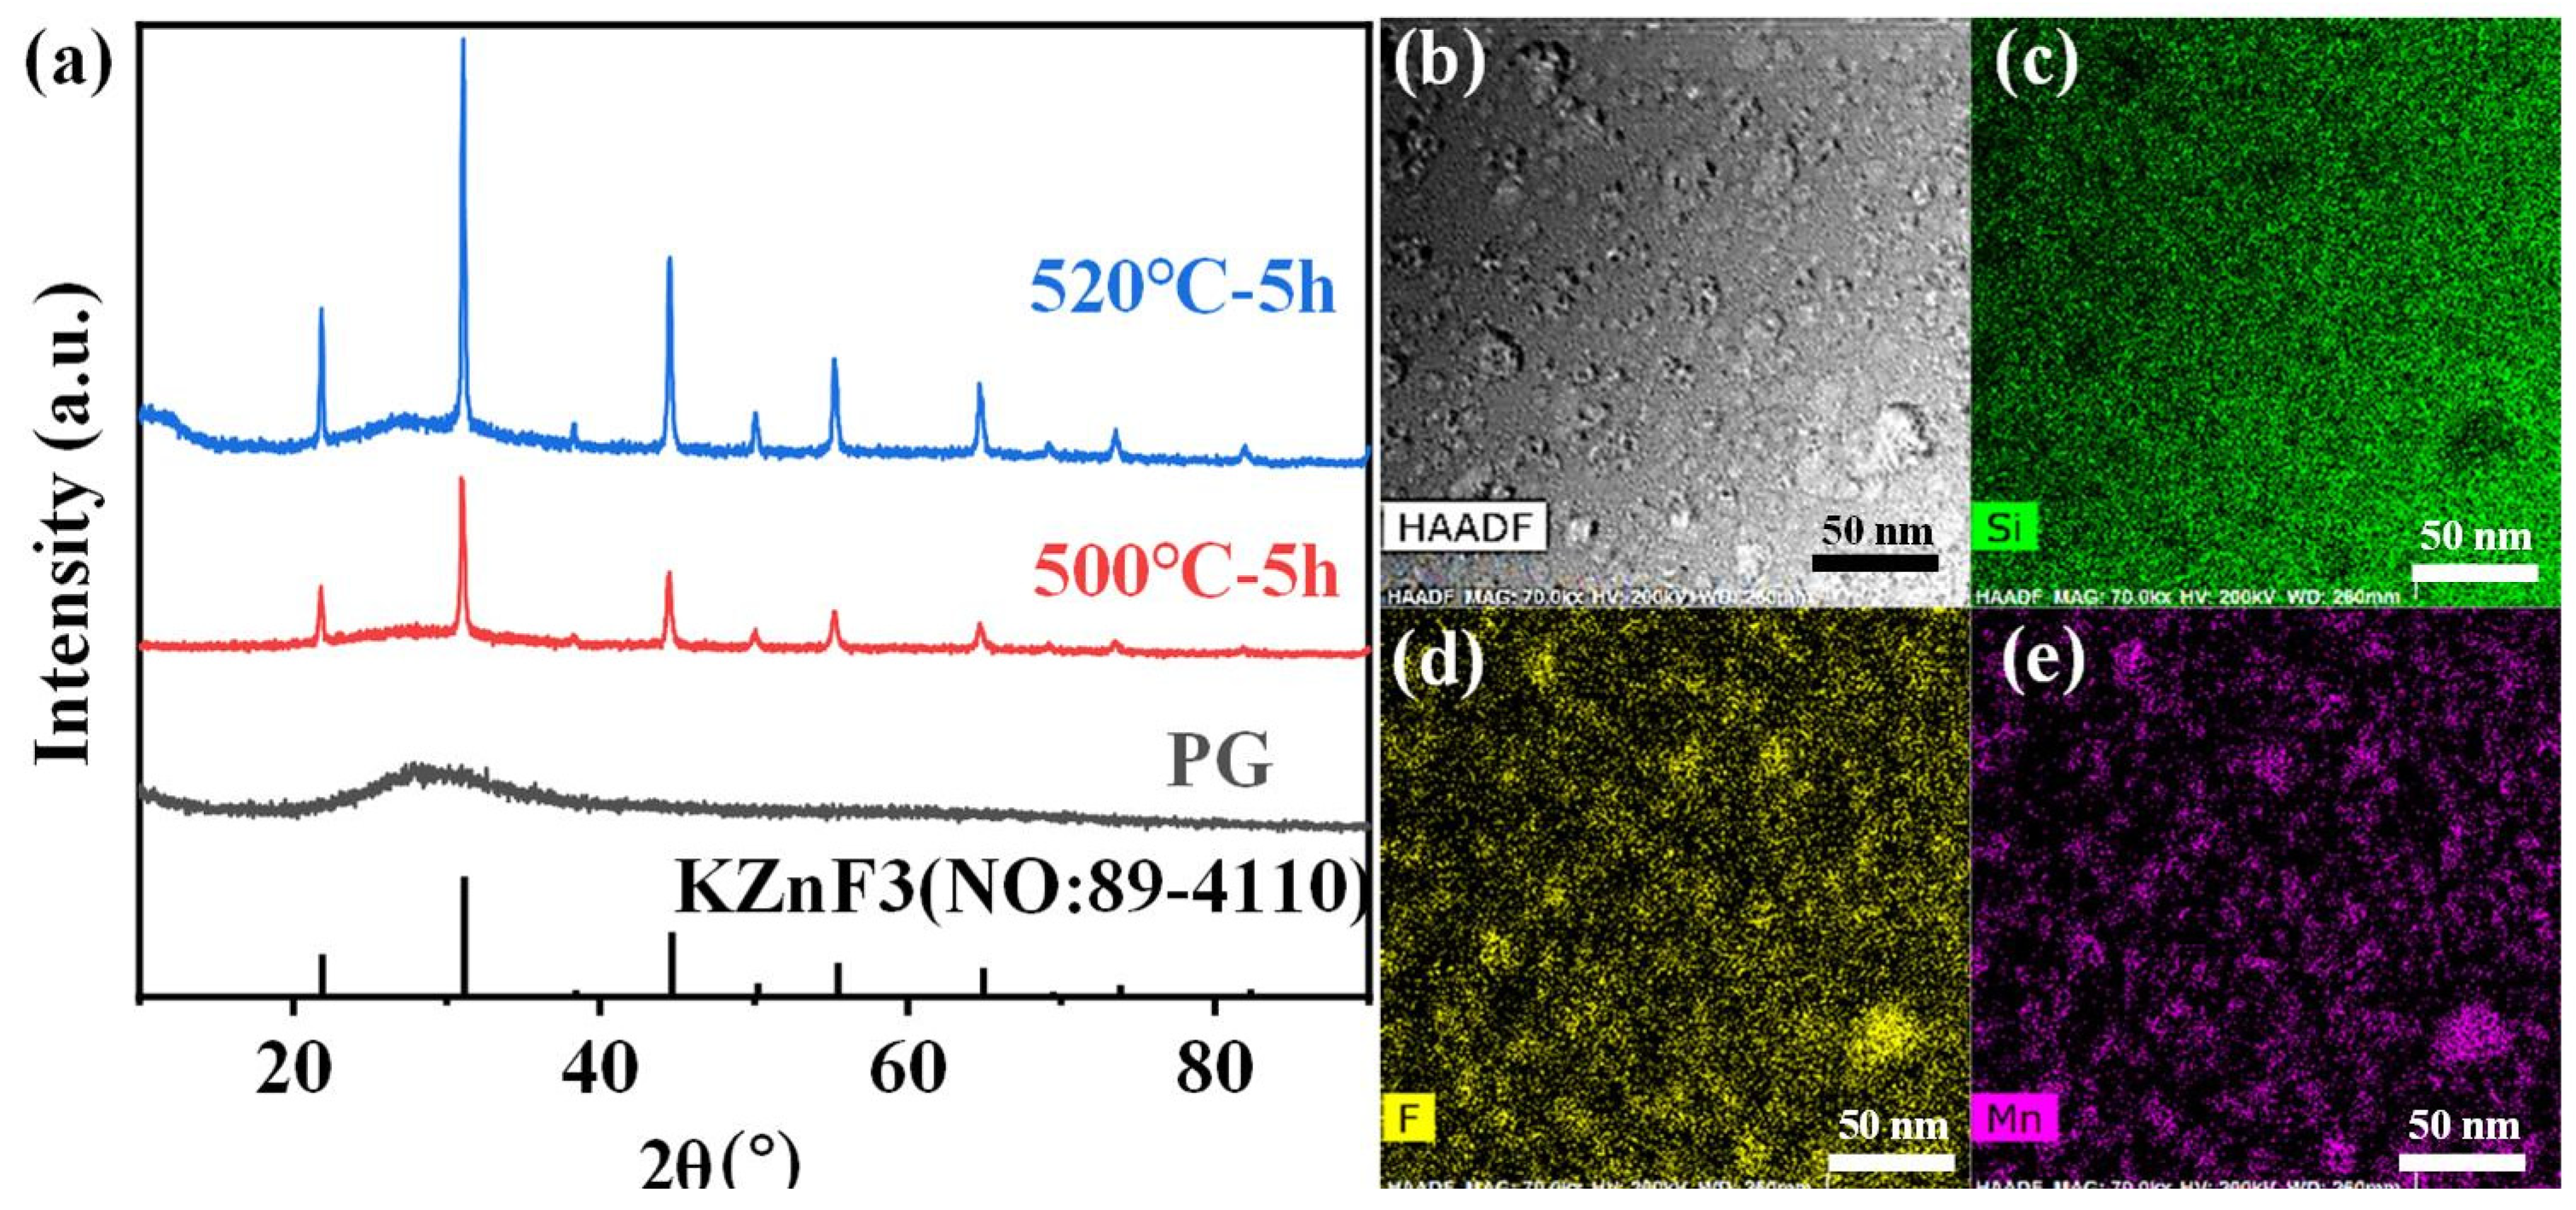
More importantly, the crystallization in the FBS–NGC was controllable by the subsequent heat treatments at 500 °C. As shown in Figure 3a, a broad band was found in the XRD pattern of PG ascribed to the amorphous phase of glass, suggesting the absence of crystal precipitation during the glass fabrication process. On the contrary, the sharp peaks corresponding to the diffraction peaks of the KZnF3 crystals (No: 89–4110) were found in the XRD pattern of NGC. The mainly intense peaks at 2θ = 21.9°, 31.2°, 44.7°, 55.5° and 65.0° were attributed to the diffraction of the (100), (110), (200), (211) and (220) crystal facets for cubic KZnF3 crystals, respectively. Moreover, no other diffraction peak was observed in the XRD pattern, proving that only KZnF3 crystals were precipitated in the FBS–NGC. The average size of KZnF3 nanocrystals was approximately 18.3 nm calculated by Scherrer’s equation, based on the XRD diffraction peak at around 44.6°.

Figure 3.
(a) XRD patterns of 1.0Mn2+-doped FBS–PG and GCs (treated at 500 and 520 °C for 5 h). (b) A typical HAADF-TEM image of the 1.0Mn2+-doped FBS–GC. (c–e) TEM elemental mapping images for Yb, F and Mn corresponding to region in (b) with relative concentrations indicated by color intensity.
Moreover, the FBS–NGC still possessed high transmittance after the precipitation of KZnF3 crystals as shown in Figure 2a. The FBS–NGC exhibited a high transmittance to 71.5% at 600 nm. As the heating temperature rose from 500 to 520 °C, the intensities of all diffraction peaks enhanced, and more KZnF3 crystals were precipitated from the glass matrix. These findings verify that the FBS–PG served as an outstanding host for the crystallization of KZnF3 and the crystals were controllably precipitated in the FBS–NGC through the heat treatments.
The HAADF-TEM image in Figure 3b illustrates the in situ precipitation of nanocrystals within the glass matrix, with particle sizes ranging from 5 to 30 nm. The TEM elemental mapping patterns (Figure 3d,e) indicate that the distribution of the F and Mn elements correlated closely with that of the nanocrystal particles (Figure 2b). Conversely, the distribution profile of the Si elements was contrary to that of the nanocrystal particles (Figure 3c). These findings unambiguously demonstrate that Mn2+ ions were successfully incorporated into the KZnF3 nanocrystals, while the K2SiF6 crystal failed to precipitate in the NGCs. The KZnF3 crystal was attributed to a typical cubic perovskite structure with a Pm-3m space group, consisting of a 3D network of angle-sharing ZnF6 octahedra, where Zn2+ ions were situated at the centers of the octahedra [30]. Mn2+ exhibited a high octahedral preference energy and possessed the same valence state and comparable ionic radius as Zn2+ (R: Zn2+ = 0.074 nm, R: Mn2+ = 0.067 nm). It was likely to incorporate into the KZnF3 nanocrystal by the substitution for Zn2+. Thus, with the precipitation of KZnF3 nanocrystals in the FBS–NGCs, Mn2+ ions could be confined within fluoride crystal structures, thereby offering excellent environments for high-efficiency luminescence.
The excitation spectra of FBS–PG and FBS–NGC are presented in Figure 4a. In the excitation spectrum of the PG sample, two prominent bands were observed at approximately 352 and 414 nm, corresponding to the electronic transitions of Mn2+ from 6A1g (S) to the 4T2g (D) and 4T2g (G) energy levels, respectively. In the PLE spectrum of the GC sample, aside from the broad excitation bands around 352 and 414 nm, two sharp excitation peaks at 330 and 397 nm were also observable. These peaks were attributed to the transitions of Mn2+: 6A1g (S) → 4Eg (D) and 4Eg (G). The PL spectra and emission decay curves of FBS–PG and NGCs doped with 1.0Mn2+ are shown in Figure 4b,c. Under 414 nm excitation, the PG exhibited a broadband emission ranging from 500 to 800 nm, as presented in Figure 4a. The emission peak was centered at 640 nm with a full width at half maximum (FWHM) of 127 nm. This emission was attributed to the electronic transition of Mn2+ from the 4T1g (G) to 6A1g (S) energy levels [31]. In the NGC samples, the emission peaks shifted to 588 nm, and the FWHMs narrowed to approximately 66 nm. Given the sensitivity of Mn2+ d-d electronic transitions to coordinated environments, the differences in PL emission spectra between PG and NGCs suggest that the coordinated environments of Mn2+ ions have been altered during the heat treatments. Compared with the glass matrix, the fluoride crystal exhibited lower phonon energy, which decreased the probability of non-radiative transitions, thereby enhancing the efficiency of Mn2+ luminescence. From Figure 4a, it can be further observed that the emission intensity of Mn2+ in NGC increased 3.3 and 6.7 times relative to PG after the heat treatments at 500 and 520 °C, respectively. Additionally, the lifetime of Mn2+ emission extended from 7.9 to 20.8 ms after the heat treatments. These findings conclusively demonstrate the incorporation of Mn2+ ions into the fluoride nanocrystals within the NGCs.
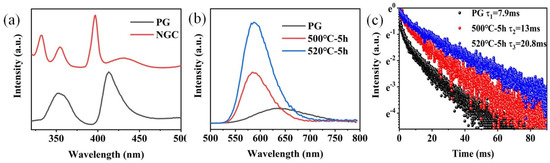
Figure 4.
(a) Excitation spectra of 1.0Mn2+-doped FBS–PG (emission at 620 nm) and NGC (emission at 588 nm). (b) PL spectra of 1.0Mn2+-doped FBS–PG and NGCs (incubated at 500 and 520 °C for 5 h). (c) Emission decay curves of 1.0Mn2+-doped FBS–PG (at 640 nm emission) and NGCs (at 588 nm emission).
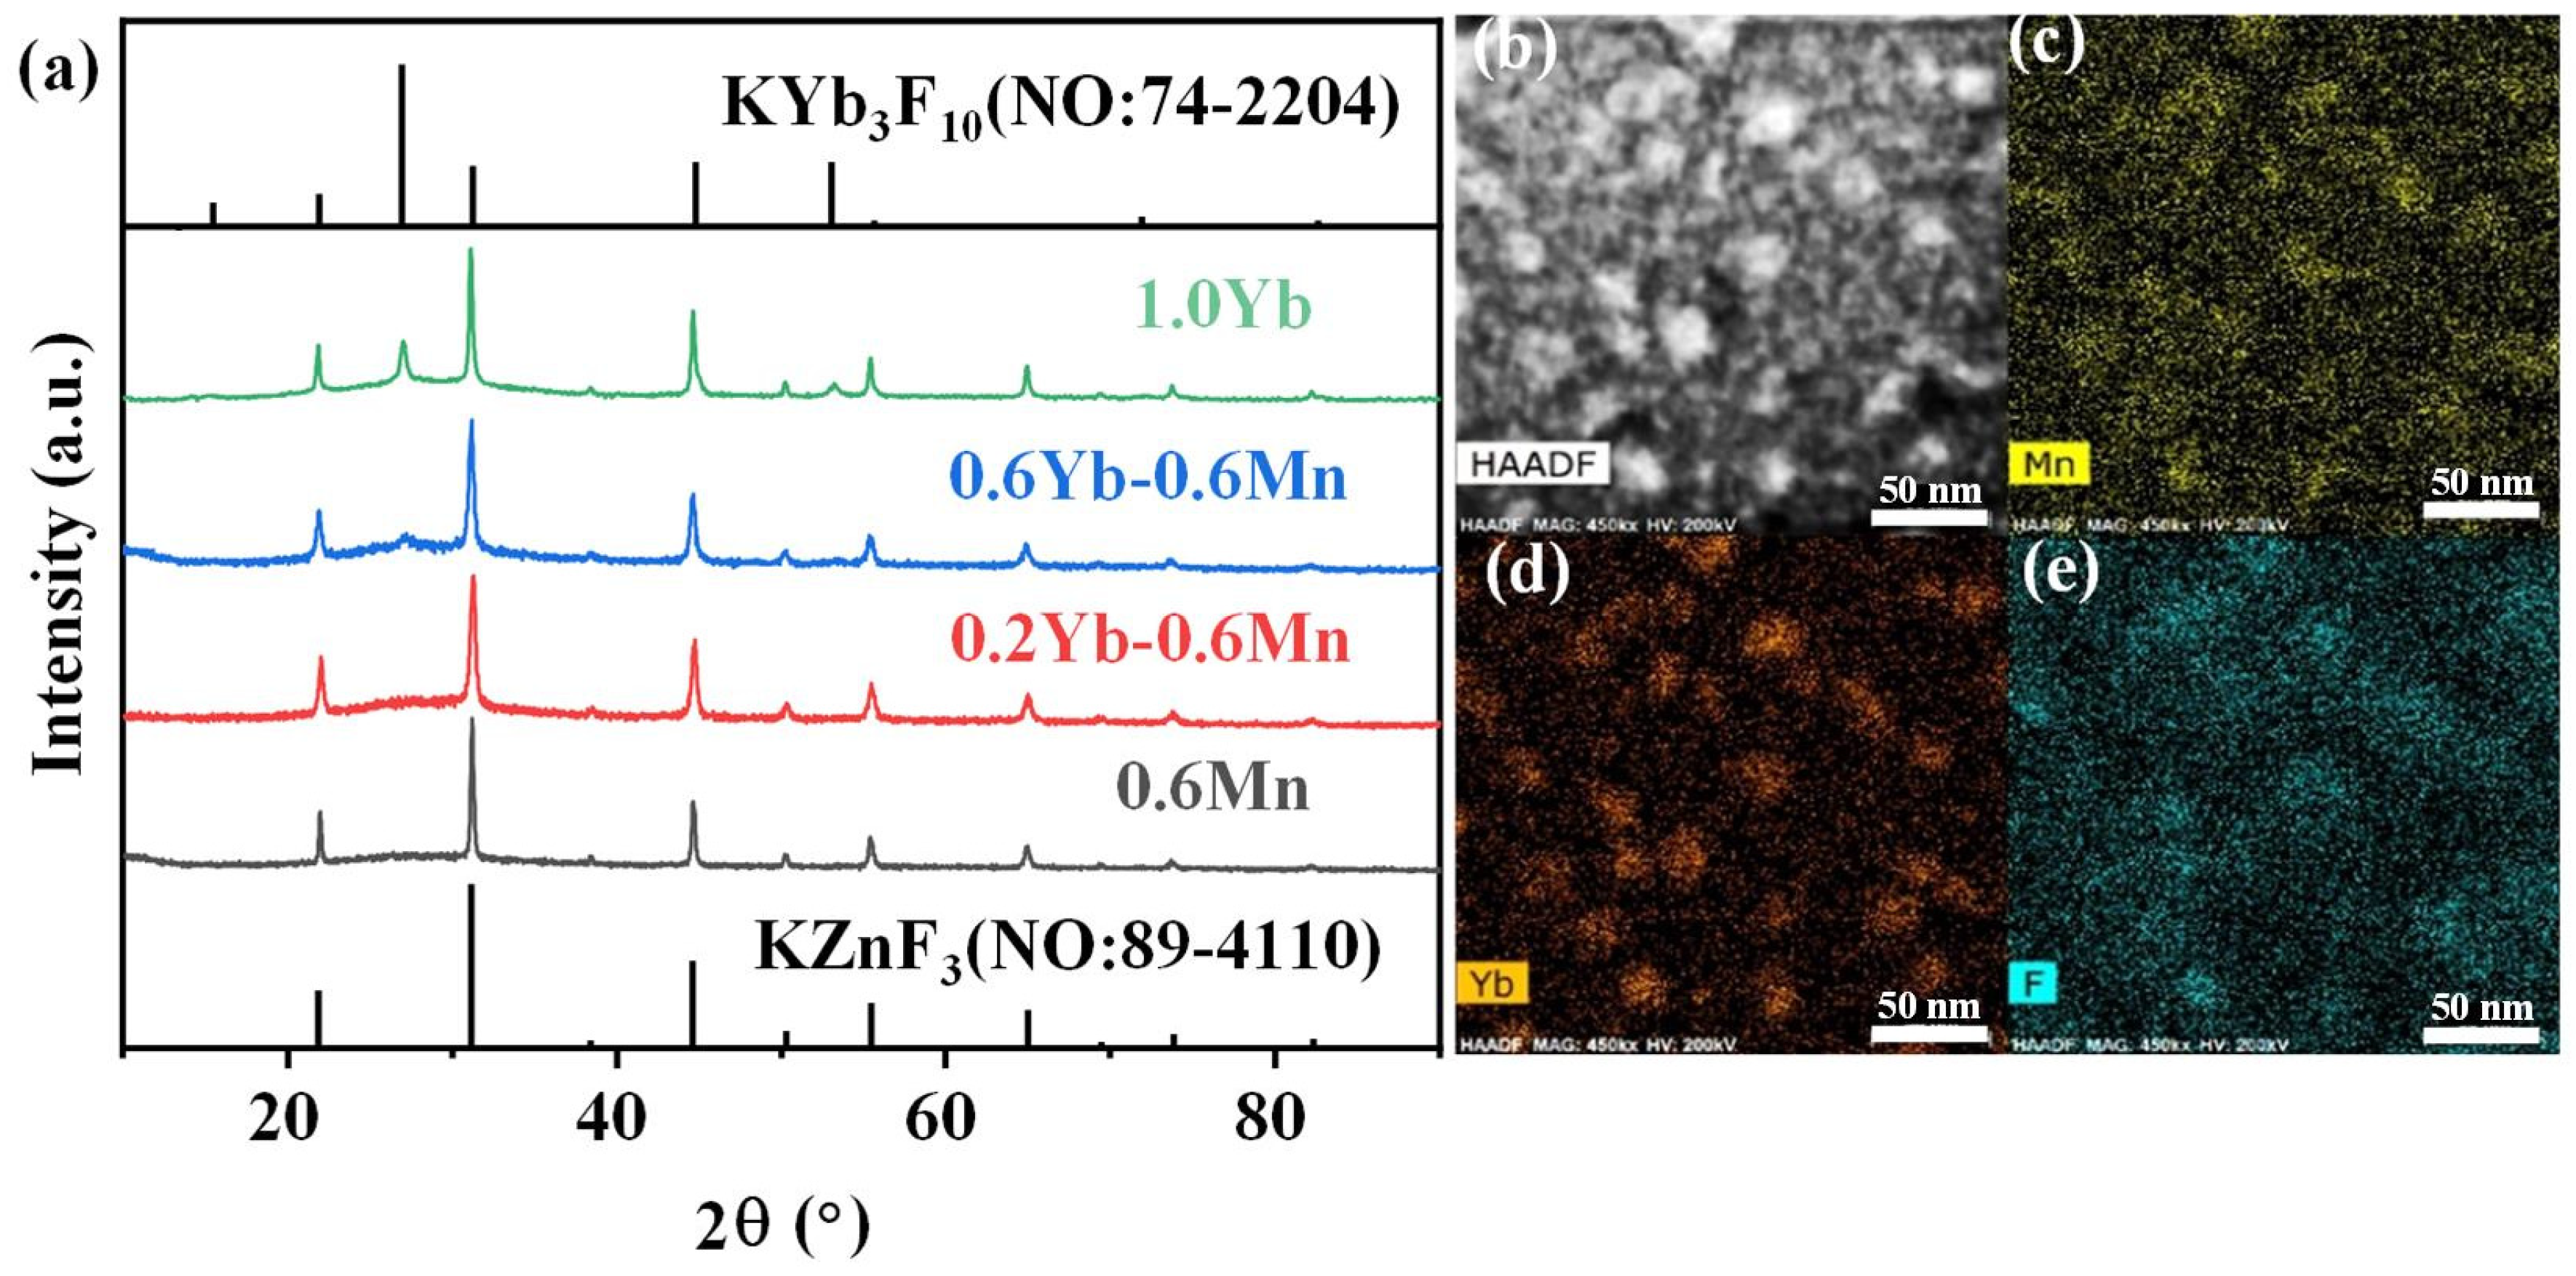
Furthermore, the crystalline phase of Mn2+–Yb3+ co-doped FBS–PG and NGCs were also investigated and are shown in Figure 5. KZnF3 nanocrystals were also precipitated in the Mn2+–Yb3+ co-doped NGCs as depicted in Figure 5a. Furthermore, the XRD patterns exhibited diffraction peaks at 27° and 53° corresponding to KYb3F10 crystals. Additionally, the intensities of these diffraction peaks for KYb3F10 crystals all increased monotonically when the doping concentration of Yb3+ rose from 0 to 1.0 mol%. Generally, Yb3+ works as a center for crystallization due to its big ionic radius and large potential [32]. Thus, the doping of Yb3+ induced the controllable precipitation of KYb3F10 nanocrystals in the FBS–NGCs. More interestingly, the TEM mapping patterns, depicted in Figure 5b–e, demonstrate that the distributions of Mn and Yb in the co-doped NGC nearly coincided and correlated well with those of F and the crystal particles. It can be assumed that the crystallization of KZnF3 in the co-doped NGC was around Yb3+, which has been commonly used as a nucleating agent and a crystallization center in NGCs in past investigations [33]. These elemental distributions in the NGC resulted in extremely short distances between RE and TM ions, which was conducive to the formation of Mn2+–Yb3+ dimers, and F promoted the energy transfer between Yb3+ and Mn2+.
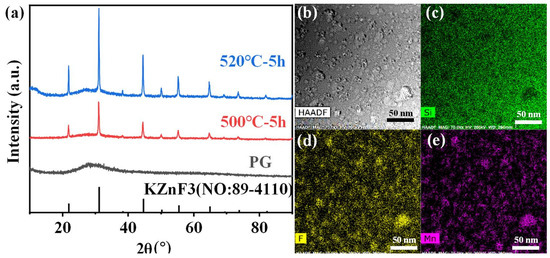
Figure 5.
(a) XRD patterns of Mn2+ single-doped, Mn2+–Yb3+ co-doped and Yb3+ single-doped FBS–GCs (treated at T ~500 °C for 5 h). (b) A typical HAADF-TEM image of the 1.0Mn2+–1.0Yb3+ co-doped FBS–GC. (c–e) TEM mapping for Mn, Si and F elements, respectively, corresponding to (b).
Figure 6a shows the PL emission spectra of 0.6Mn2+–0.2Yb3+ co-doped FBS–PG and NGCs under the excitation of a 980 nm LD. Broadband emission around 600 nm was observed in the amorphous PG sample, while the centers of the emission bands in the NGC samples both blue-shifted to 588 nm, which were all ascribed to the UC luminescence of the Mn2+–Yb3+ dimers [34,35]. In NGC samples, KZnF3 and KYb3F10 crystals offered a low-phonon-energy crystal environment for Mn2+ and Yb3+, respectively. This not only decreased non-radiative transition probabilities but also shortened the distance between Mn2+ and Yb3+, facilitating the formation of Mn2+–Yb3+ dimers. Consequently, as illustrated in Figure 6a, when the samples were heated at 500 and 520 °C for 5 h, respectively, the UC emission of the Mn2+–Yb3+ dimers in NGC enhanced 45 and 54 times compared to PG. Furthermore, the emission lifetime of the Mn2+–Yb3+ dimers extended from 1.1 to 8.4 ms following the heat treatments, as presented in Figure 6b. To further investigate the luminescence mechanism of Mn2+–Yb3+, the dependence of UC emission on the excitation power of a 980 nm laser was examined. The double-logarithmic plots depicting the excitation power dependence on the 588 nm emission intensities, presented in Figure 6c, indicate that the broadband emission around 588 nm in the NGC arose from a two-photon process associated with the UC luminescence of Mn2+–Yb3+ dimers. Additionally, the UC emission spectra of 1.0Yb3+-doped PG and GCs, excited by a 980 nm LD, revealed intense emission peaks around 480 nm in the GCs’ spectra, shown in Figure 6d, which were attributed to the UC emission of Yb3+–Yb3+ pairs [36,37]. Owing to the KYb3F10 nanocrystals’ precipitation in NGCs, Yb3+ ions were confined in fluoride crystals with short ionic distances, which promoted the Yb3+–Yb3+ pairs formation. The UC emission intensities of Yb3+ in the NGCs were both higher as compared to the PG, as shown in Figure 6d. Because more KYb3F10 crystals were precipitated in the NGC heated at 520 °C, the ionic distances between Yb3+ were shorter. The UC emission intensity of Yb3+ in the NGC heated at 520 °C was lower than that at 500 °C due to the concentration-quenching effect. Therefore, enhanced UC emissions of Mn2+–Yb3+ dimers and Yb3+–Yb3+ pairs could both be achieved in the FBS–NGCs because of the controllable nano-crystallization of KZnF3 and KYb3F10 crystals.
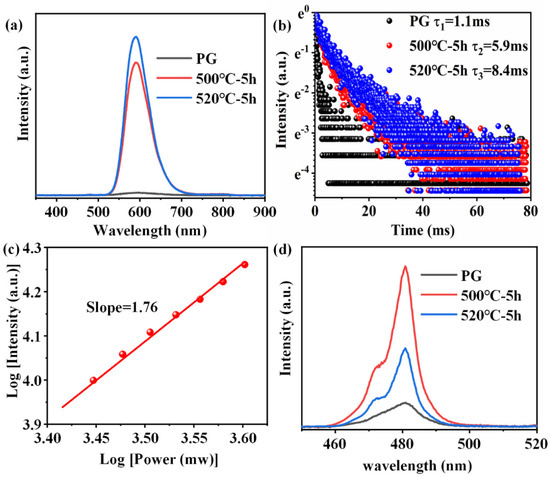
Figure 6.
(a) Emission spectra of 0.6Mn2+–0.2Yb3+ co-doped FBS–PG and NGCs excited by a 980 nm LD. (b) Decay curves of emissions for Mn2+ in FBS–PG and GCs. (c) Double-logarithmic plots of the excitation power dependency on the 588 nm emission intensity of 0.6Mn2+–0.2Yb3+ co-doped FBS–NGC. (d) Emission spectra of 1.0Yb3+-doped PG and GCs.
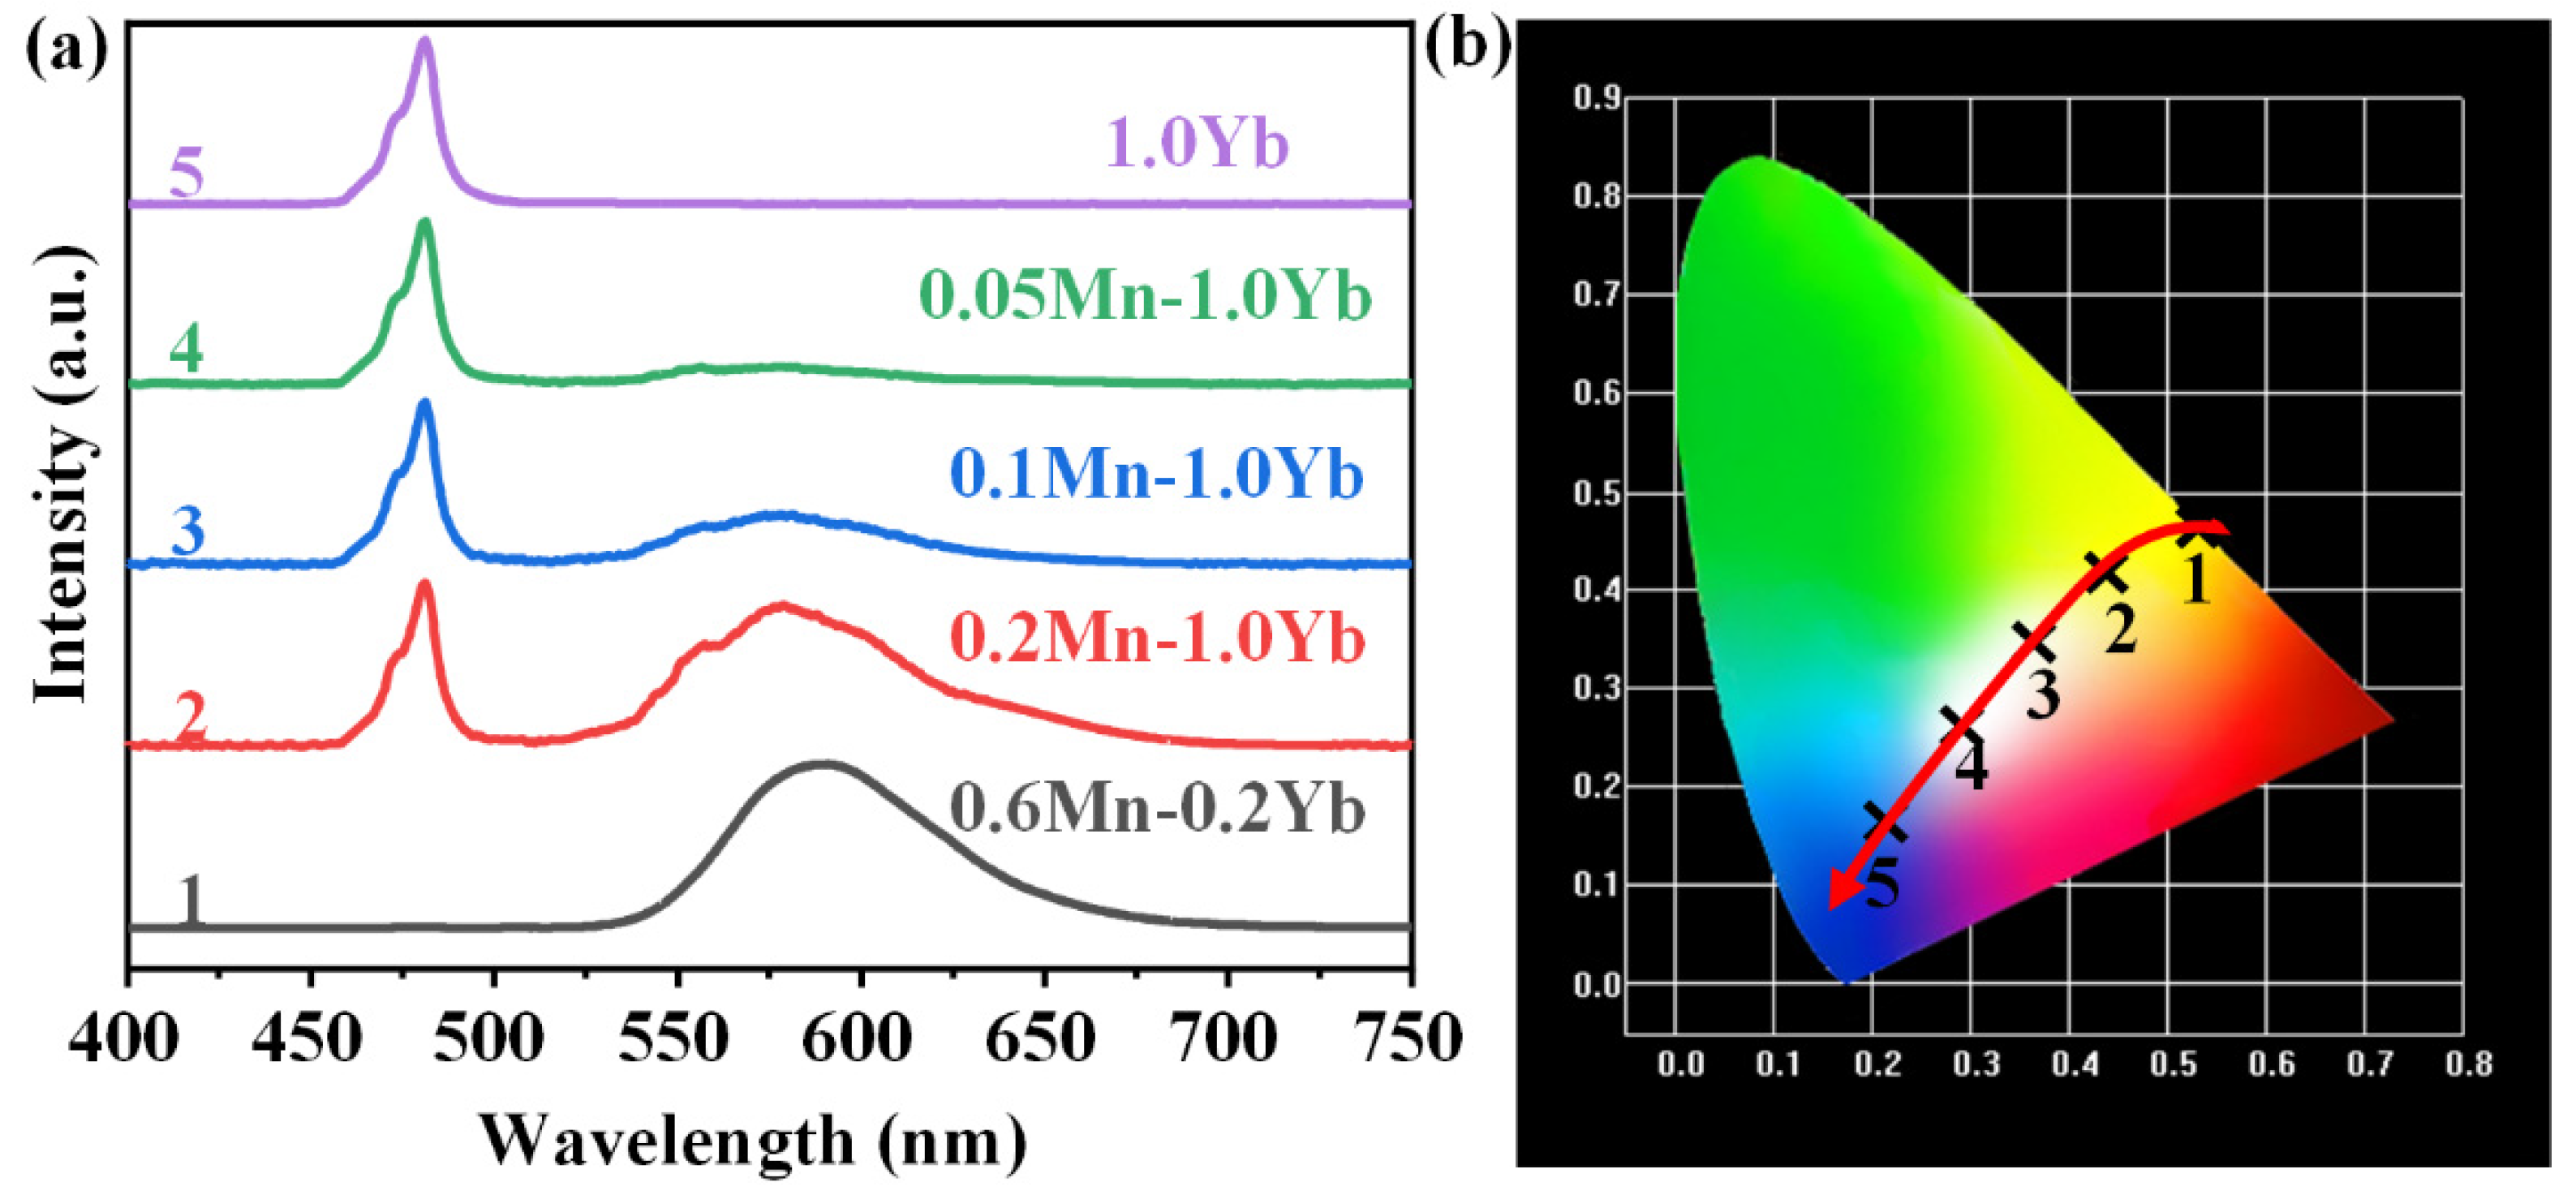
As mentioned above, GCs exhibited both yellow UC emission around 588 nm and blue UC emission near 480 nm. According to the blue-yellow two-primary-color principle, white emission can be obtained by the combination of the blue and yellow emissions [38]. As shown in Figure 7a, in the spectrum of 1.0Yb3+ single-doped NGC, an intense blue emission at 480 nm was detected, which was ascribed to the UC emission of the Yb3+–Yb3+ pairs. Yellow emissions of the Mn2+–Yb3+ dimers around 588 nm appeared in the spectra when Mn2+ was co-doped in the NGCs. The yellow emission intensity enhanced with the increasing Mn2+ doping concentration. When the Mn2+ concentration was increased to 0.6 mol% and the Yb3+ concentration was reduced to 0.2 mol%, the spectrum predominantly featured the yellow emission of Mn2+–Yb3+ dimers. The chromaticity coordinate diagram corresponding to the emission spectra in Figure 7a is depicted in Figure 7b. Upon excitation with a 980 nm LD, the Yb3+ single-doped NGC emitted pure blue light. White emissions could be observed in the 0.1Mn2+–1.0Yb3+ and 0.05Mn2+–1.0Yb3+ NGCs. When the Mn2+ content was further increased and the Yb3+ concentration was low, the NGC emitted pure yellow light. Hence, the emission color of the NGC could be nearly continuously modulated from blue to white and yellow via adjusting the doping concentrations of Mn2+ and Yb3+. The FBS–NGCs provide significant compounds for the promising applications in white/multi-color lighting and tunable fiber lasers.

Figure 7.
(a) The UC emission spectra of FBS–NGCs (heat treated at 500 °C) doped with different concentrations of Mn2+ and Yb3+ under an excitation of 980 nm LD. (b) CIE chromaticity coordinates corresponding to the samples in (a).
4. Conclusions
In summary, to achieve efficient and tunable luminescence, a high-quality FBS–NGC was designed and fabricated. The introduction of B2O3 into the glass resulted in a reduction of the melting temperature from 1400 to 1050 °C. The designed FBS–NGCs were more stable and possessed higher transmittance than the FS–PG. Meanwhile, KZnF3 nanocrystals were controllably precipitated within the Mn2+-doped FBS–NGCs, resulting in a 6.7-fold enhancement of Mn2+ luminescence. Moreover, KZnF3 and KYb3F10 nanocrystals were simultaneously precipitated in the co-doped NGCs, which confined Mn2+ and Yb3+ in fluoride crystals, respectively. In the NGCs, the UC emission intensity of Mn2+–Yb3+ dimers was enhanced 54-fold compared to that in the PG, and the UC emission color was modulated from blue to white and yellow via adjusting the doping concentrations. The well-designed NGCs provide significant optical gain materials for applications in white LEDs, 3D information storages, solar cells and tunable fiber lasers. More importantly, the material design strategy developed herein offers a novel pathway for exploiting a diverse array of high-quality oxy-fluoride NGCs, characterized by high transmittance, highly efficient PL emission and controllable nano-crystallization.
Author Contributions
Conceptualization, Z.F.; methodology, Y.X. and Y.L.; formal analysis, Y.X., P.C. and S.L.; investigation, Y.X., P.C., Y.L. and S.L.; resources, Z.F.; data curation, Y.L.; writing—original draft, Y.X.; writing—review and editing, Y.L., Z.F. and R.J.; project administration, R.J.; funding acquisition, Z.F. and R.J. All authors have read and agreed to the published version of the manuscript.
Funding
The authors gratefully acknowledge financial support from the National Key R&D Program of China (2021YFA0805800, 2023YFE0107700 and 2020YFA0803202), the 111 Project (D18010) the National Natural Science Foundation of China (No. 31970538, 62275105). This work was also supported by the Guangzhou Medical University Discipline Construction Funds (Basic Medicine) (JCXKJS2022A02), the Guangdong Basic and Applied Basic Research Foundation (No. 2021A1515011938, 2023A1515012264), Guangzhou Science and Technology Plan Project (2023A04J1736).
Institutional Review Board Statement
Not applicable.
Informed Consent Statement
Not applicable.
Data Availability Statement
Data are contained within the article.
Conflicts of Interest
The authors declare no conflict of interest.
References
- Xu, X.H.; Zhang, W.F.; Yang, D.C.; Lu, W.; Qiu, J.B.; Yu, S.F. Phonon-assisted population inversion in lanthanide-doped upconversion Ba2LaF7 nanocrystals in glass-ceramics. Adv. Mater. 2016, 28, 8045–8050. [Google Scholar] [CrossRef] [PubMed]
- Zhang, W.J.; Zhang, J.P.; Wang, Z.; Wang, W.C.; Zhang, Q.Y. Spectroscopic and structural characterization of transparent fluorogermanate glass ceramics with LaF3:Tm3+ nanocrystals for optical amplifications. J. Alloys Compd. 2015, 634, 122–129. [Google Scholar] [CrossRef]
- Jia, Z.X.; Yao, C.F.; Jia, S.J.; Wang, F.; Wang, S.B.; Zhao, Z.P.; Qin, G.S.; Ohishi, Y.; Qin, W.P. 4.5 W supercontinuum generation from 1017 to 3438 nm in an all-solid fluorotellurite fiber. Appl. Phys. Lett. 2017, 110, 261106. [Google Scholar] [CrossRef]
- Galleani, G.; Bradtmüller, H.; Fares, H.; Santagneli, S.H.; Nalin, M.; Eckert, H. BiF3 incorporation in Na/Ba mixed network modifier fluoride-phosphate glasses: Structural studies by solid-state NMR and raman spectroscopies. J. Phys. Chem. C 2020, 124, 25578–25587. [Google Scholar] [CrossRef]
- Zhao, J.J.; Ma, R.; Chen, X.K.; Kang, B.B.; Qiao, X.S.; Du, J.C.; Fan, X.P.; Ross, U.; Roiland, C.; Lotnyk, A.; et al. From phase separation to nanocrystallization in fluorosilicate glasses: Structural design of highly luminescent glass-ceramics. J. Phys. Chem. C 2016, 120, 17726–17732. [Google Scholar] [CrossRef]
- Liang, H.Z.; Luo, Z.W.; Liu, X.Y.; Wang, B.Y.; Qin, C.C.; Lei, W.C.; Lu, A. Effect of F/O ratio on up-conversion and down-conversion luminescence properties of Er3+/Yb3+ co-doped SiO2-Al2O3-AlF3-Gd2O3-Na2O glass. J. Alloys Compd. 2020, 827, 154274. [Google Scholar] [CrossRef]
- Lee, J.H.; Yeo, T.M.; Cho, J.W. Effect of Li2O on melt crystallization of CaO-SiO2-CaF2 based glasses. Ceram. Int. 2021, 47, 6773–6778. [Google Scholar] [CrossRef]
- Silva, I.D.A.; Donoso, J.P.; Magon, C.J.; Tambelli, C.E.; Santagneli, S.H.; Ribeiro, S.J.L.; Silva, M.A.P.; Chiesa, M.; Rodrigues, A.C.M. Magnetic resonance and conductivity study of lead–cadmium fluorosilicate glasses and glass-ceramics. J. Phys. Chem. C 2018, 122, 6288–6297. [Google Scholar] [CrossRef]
- Dan, H.K.; Tap, T.D.; Vinh, H.X.; Ty, N.M.; Vinh, L.T.; Zhou, D.C.; Qiu, J.B. Enhanced red upconversion emission and energy transfer of Tm3+/Cr3+/Yb3+ tri-doped transparent fluorosilicate glass-ceramics. J. Non-Cryst. Solids 2020, 535, 119885. [Google Scholar] [CrossRef]
- Hu, Q.L.; Gao, Z.G.; Lu, X.S.; Ren, J.; He, F.; Fang, Z.J.; Liu, Y.Y.; Sun, S.Y.; Yang, P.P.; Wang, P.F. Bane to boon: Intrinsic defect sensitized photoluminescence from Mn2+ or rare-earth ions doped fluorosilicate photonic glasses. J. Mater. Chem. 2017, 5, 11806–11814. [Google Scholar] [CrossRef]
- Fang, Z.J.; Chen, Z.; Peng, W.C.; Shao, C.G.; Zheng, S.P.; Hu, L.L.; Qiu, J.R.; Guan, B.O. Phase-separation engineering of glass for drastic enhancement of upconversion luminescence. Adv. Opt. Mater. 2019, 7, 1801572. [Google Scholar] [CrossRef]
- Wang, S.X.; Chen, J.K.; Lin, J.; Yang, C.B.; Huang, F.; Chen, D.Q. Nanocrystallization of lanthanide-doped KLu2F7–KYb2F7 solid-solutions in aluminosilicate glass for upconverted solid-state-lighting and photothermal anti-counterfeiting. J. Mater. Chem. C 2019, 7, 14571–14580. [Google Scholar] [CrossRef]
- Chen, D.Q.; Wan, Z.Y.; Zhou, Y.; Xiang, W.D.; Zhong, J.S.; Ding, M.Y.; Yu, H.; Ji, Z.G. Tuning into blue and red:europium single-doped nano-glass-ceramics for potential application in photosynthesis. J. Mater. Chem. 2015, 3, 3141–3149. [Google Scholar]
- Lin, C.G.; Rüssel, C.; Wullen, L.V. Phase separation and nanocrystallization in KF-ZnF2-SiO2 glasses: Lessons from solid-state NMR. J. Phys. Chem. B 2019, 123, 1688–1695. [Google Scholar] [CrossRef] [PubMed]
- Lin, C.G.; Liu, C.; Zhao, Z.Y.; Li, L.G.; Bocker, C.; Rüssel, C. Broadband near-IR emission from cubic perovskite KZnF3:Ni2+ nanocrystals embedded glass-ceramics. Opt. Lett. 2015, 40, 5263–5266. [Google Scholar] [CrossRef] [PubMed]
- Walas, M.; Lewandowski, T.; Synak, A.; Łapiński, M.; Sadowski, W.; Kościelsk, B. Eu3+ doped tellurite glass ceramics containing SrF2 nanocrystals: Preparation, structure and luminescence properties. J. Alloys Compd. 2017, 696, 619–626. [Google Scholar] [CrossRef]
- Yanes, A.C.; Santana-Alonso, A.; Méndez-Ramos, J.; del-Castillo, J.; Rodríguez, V.D. Novel sol-gel nano-glass-ceramics comprising Ln3+-doped YF3 nanocrystals: Structure and high efficient UV up-conversion. Adv. Funct. Mater. 2011, 21, 3136–3142. [Google Scholar] [CrossRef]
- Hémono, N.; Pierre, G.; Muñoz, F.; Pablos-Martín, A.; Pascual, M.J.; Durán, A. Processing of transparent glass-ceramics by nanocrystallisation of LaF3. J. Eur. Ceram. Soc. 2009, 29, 2915–2920. [Google Scholar] [CrossRef]
- Wei, T.; Tian, Y.; Tian, C.; Jing, X.F.; Li, B.P.; Zhang, J.J.; Xu, S.Q. 2.7 μm emissions in Er3+:NaYF4 embedded aluminosilicate glass ceramics. Ceram. Int. 2016, 42, 1332–1338. [Google Scholar] [CrossRef]
- Gao, Y.; Hu, Y.B.; Ren, P.; Zhou, D.C.; Qiu, J.B. Phase transformation and enhancement of luminescence in the Tb3+-Yb3+ co-doped oxyfluoride glass ceramics containing NaYF4 nanocrystals. J. Eur. Ceram. Soc. 2016, 36, 2825–2830. [Google Scholar] [CrossRef]
- Qiao, X.S.; Fan, X.P.; Xue, Z.; Xu, X.H.; Luo, Q. Upconversion luminescence of Yb3+/Tb3+/Er3+-doped fluorosilicate glass ceramics containing SrF2 nanocrystals. J. Alloys Compd. 2011, 509, 4714–4721. [Google Scholar] [CrossRef]
- Pawlik, N.; Sroka, B.S.; Goryczka, T.; Zubko, M.; Lelątko, J.; Pisarski, W.A. Structure and luminescent properties of oxyfluoride glass-ceramics with YF3:Eu3+ nanocrystals derived by sol-gel method. J. Eur. Ceram. Soc. 2019, 39, 5010–5017. [Google Scholar] [CrossRef]
- Lee, S.K.; Eng, P.J.; Mao, H.-K.; Meng, Y.; Newville, M.; Hu, M.Y.; Shu, J. Probing of bonding changes in B2O3 glasses at high pressure with inelastic X-ray scattering. Nat. Mater. 2005, 4, 851–854. [Google Scholar] [CrossRef]
- Zhou, S.F.; Guo, Q.G.; Inoue, H.; Ye, Q.; Masuno, A.; Zheng, B.B.; Yu, Y.Z.; Qiu, J.R. Topological engineering of glass for modulating chemical state of dopants. Adv. Mater. 2014, 26, 7966–7972. [Google Scholar] [CrossRef] [PubMed]
- Saudi, H.A.; Abd-Allah, W.M. Structural, physical and radiation attenuation properties of tungsten doped zinc borate glasses. J. Alloys Compd. 2021, 860, 158225. [Google Scholar] [CrossRef]
- Weiss, N.S.; Bradtmüller, H.; Fortino, M.; Bertani, M.; Youngman, R.E.; Pedone, A.; Eckert, H.; Goel, A. Combined experimental and computational approach toward the structural design of borosilicate-based bioactive glasses. J. Phys. Chem. C 2020, 124, 17655–17674. [Google Scholar] [CrossRef]
- Huang, X.J.; Guo, Q.Y.; Yang, D.D.; Xiao, X.D.; Liu, X.F.; Xia, Z.G.; Fan, F.J.; Qiu, J.R.; Dong, G.P. Reversible 3D laser printing of perovskite quantum dots inside a transparent medium. Nat. Photonics 2019, 14, 82–88. [Google Scholar] [CrossRef]
- Lin, C.G.; Li, L.G.; Dai, S.X.; Liu, C.; Zhao, Z.Y.; Bocker, C.; Rüssel, C. Oxyfluoride glass-ceramics for transition metal ion based photonics:broadband near-IR luminescence of nickel ion dopant and nanocrystallization mechanism. J. Phys. Chem. C 2016, 120, 4556–4563. [Google Scholar] [CrossRef]
- Lin, C.G.; Bocker, C.; Rüssel, C. Nanocrystallization in oxyfluoride glasses controlled by amorphous phase separation. Nano Lett. 2015, 15, 6764–6769. [Google Scholar] [CrossRef] [PubMed]
- Song, E.H.; Ding, S.; Wu, M.; Ye, S.; Xiao, F.; Zhou, S.F.; Zhang, Q.Y. Anomalous NIR luminescence in Mn2+-doped fluoride perovskite nanocrystals. Adv. Opt. Mater. 2014, 2, 670–678. [Google Scholar] [CrossRef]
- Fang, Z.J.; Peng, W.C.; Zheng, S.P.; Qiu, J.R.; Guan, B.O. Controllable modulation of coordination environments of Mn2+ in glasses and glass-ceramics for tunable luminescence. J. Eur. Ceram. Soc. 2020, 40, 1658–1664. [Google Scholar] [CrossRef]
- Fang, Z.F.; Li, J.F.; Long, Y.; Guan, B.O. High-efficiency luminescence in optical glass via the controllable crystallization of KYb3F10 nanocrystals depending on the dopants. Opt. Lett. 2020, 45, 3030–3033. [Google Scholar] [CrossRef] [PubMed]
- Chen, D.Q.; Wang, Y.S.; Yu, Y.L.; Ma, E. Influence of Yb3+ content on microstructure and fluorescence of oxyfluoride glass ceramics containing LaF3 nano-crystals. Mater. Chem. Phys. 2007, 101, 464–469. [Google Scholar] [CrossRef]
- Song, E.H.; Chen, Z.T.; Wu, M.; Ding, S.; Ye, S.; Zhou, S.F.; Zhang, Q.Y. Room-temperature wavelength-tunable single-band upconversion luminescence from Yb3+/Mn2+ Codoped Fluoride Perovskites ABF3. Adv. Opt. Mater. 2016, 4, 798–806. [Google Scholar] [CrossRef]
- Liu, X.; Cheng, C.; Zeng, N.; Li, X.; Jiao, Q.; Lin, C.; Dai, S. Tunable broadband upconversion luminescence from Yb3+/Mn2+ co-doped dual-phase glass ceramics. Ceram. Int. 2020, 46, 5271–5277. [Google Scholar] [CrossRef]
- Long, Y.; Li, J.; Fang, Z.; Guan, B. Modulation of activator distribution by phaseseparation of glass for efficient and tunable upconversion luminescence. RSC Adv. 2020, 10, 12217. [Google Scholar] [CrossRef]
- Qin, W.P.; Liu, Z.Y.; Sin, C.N.; Wu, C.F.; Qin, G.S.; Chen, Z.; Zheng, K.Z. Multi-ion cooperative processes in Yb3+ clusters. Light Sci. Appl. 2014, 3, e193. [Google Scholar] [CrossRef]
- Ye, S.; Li, Y.J.; Yu, D.C.; Dong, G.P.; Zhang, Q.Y. Room-temperature upconverted white light from GdMgB5O10: Yb3+, Mn2+. J. Mater. Chem. 2011, 21, 3735–3739. [Google Scholar] [CrossRef]


Disclaimer/Publisher’s Note: The statements, opinions and data contained in all publications are solely those of the individual author(s) and contributor(s) and not of MDPI and/or the editor(s). MDPI and/or the editor(s) disclaim responsibility for any injury to people or property resulting from any ideas, methods, instructions or products referred to in the content. |
© 2025 by the authors. Licensee MDPI, Basel, Switzerland. This article is an open access article distributed under the terms and conditions of the Creative Commons Attribution (CC BY) license (https://creativecommons.org/licenses/by/4.0/).