1. Introduction
Nano-porous metal frameworks exhibit unique surface to volume ratios whereby the metal natural’s optical, catalytic and mechanical properties become dramatically enhanced [
1,
2]. Typically, through sufficient increase of the relative density of metal nano-particles (NPs) assembled across an otherwise porous matrix, non-linear optical responses a decade higher than that predicted by effective medium theories were obtained [
3]. Similarly, partially coalesced metal NPs offer thermal and electrical conductivities significantly higher than bulk metal [
4]. Metal nano-textured surfaces and meso-porous networks are emerging as advanced platforms for chemical reactions, sensing and separation [
5].
Current commercial porous metal materials have limited scope due to their relatively large micron sized pore inherent to their fabrication process [
5]. To date, commercial porous metal materials are either processed by sintering of macro sized metal particles or foaming. Sintering consists of the hot-compression of metal powders or fibres at the softening temperature of the metal to form a semi-porous network. Alternatively, foaming is performed by combustion of foaming agents within molten metals leading to the release of gases to form macro-cavities and pores within the cooling cast metal slab [
6]. These fabrication processes typically lead to large pore size distributions (>1 µm), low pore connectivity and limited porosity (<45%), and do not offer scope for the processing of nano-structured surfaces with enhanced surface properties reported for finer nanoscale metal frameworks [
7]. Recently, metal nano-foaming, electro-spinning and metal electro-less deposition were applied to the development of novel meso-porous electrodes, heat sinks or separation materials [
8,
9,
10,
11]. These techniques offer the advantage of very fine and highly controllable pore formation across metal materials and up-scalable, large surface areas [
5,
10]. The surface roughness, specific surface area and topography of these materials can also be tuned by varying the processing parameters leading to different ranges of metal grain size distributions and thus to adjustable surface energies with potential benefits in catalysis due to the high reactivity of most nano-structured metal materials [
12].
However, the most notable recent progress has been achieved through a deeper understanding of coalescence mechanisms and the development of advanced routes to stabilize metal NPs into ordered and porous crystalline micro-network [
13]. Further improvements of the stability of long range ordered metal NP assemblies and enhancement of pore density and homogeneity are still, however, pressing issues and would lead to more controlled metal nano-fabrication routes [
5]. Powder metallurgy and nano-metallurgy, which relates to the controlled sintering of metal powder and nano-powder mixtures, are emerging research fields for the processing of nano and meso porous metal materials [
14,
15]. However, issues related to powder mixing, including spontaneous phase separation of the powders and de-mixing during powder flow are still only partially understood phenomenon. The size, but also the density and shape of the multiple distributions of mixed particles were shown to lead to near complete lamellar type phase separation thus offering new routes to the processing of highly porous layered metal materials [
16,
17,
18]. In addition, the controlled coalescence of metal NPs is also a challenge due to the naturally high surface energy of the materials leading to rapid densification. It is, therefore, critical to investigate ways to limit coalescence mechanisms in order to maintain porosity of the nano-structure upon removal of the sacrificial phase.
In this paper, a new and simple route to process stable meso-porous metal materials by cold-pressing of mixed powders and selective etching of a sacrificial matrix will be demonstrated. This technique is applied to the processing of pure silver and copper meso-porous thin films. The potential of the technique to lead to stratified materials with a range of porosities and pore size distributions will be critically analyzed in light of the powder mixture compositions and morphologies and properties of final meso-porous materials. In addition, potential applications of meso-porous metal materials will be discussed.
2. Results and Discussion
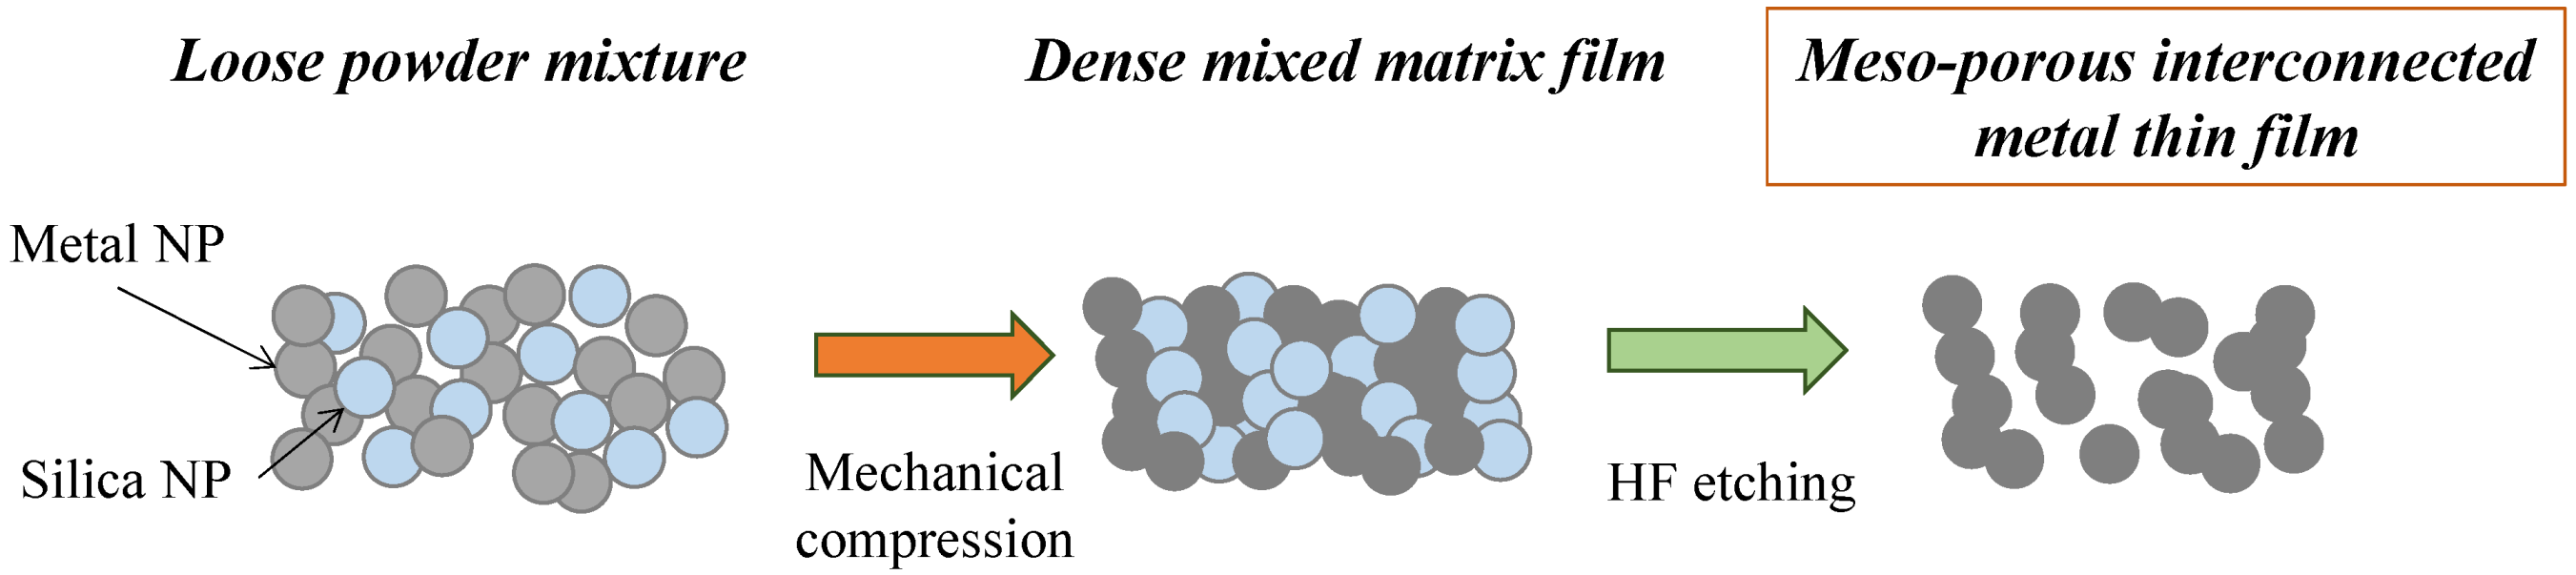
The formation of the meso-porous metal thin films by cold-pressing of mixed NP powder mixtures is depicted in
Figure 1. The NPs were mixed together and poured into the die and the powder levelled through tangential vibrations prior to cold-pressing. The mixture of the two powders, while Si and dark grey Ag, were gently but thoroughly mixed until formation of a homogeneous light grey coloured powder.
Figure 1.
Schematic of the powder mixing, cold-compression and silica etching process leading to a meso-porous pure metal material.
Figure 1.
Schematic of the powder mixing, cold-compression and silica etching process leading to a meso-porous pure metal material.
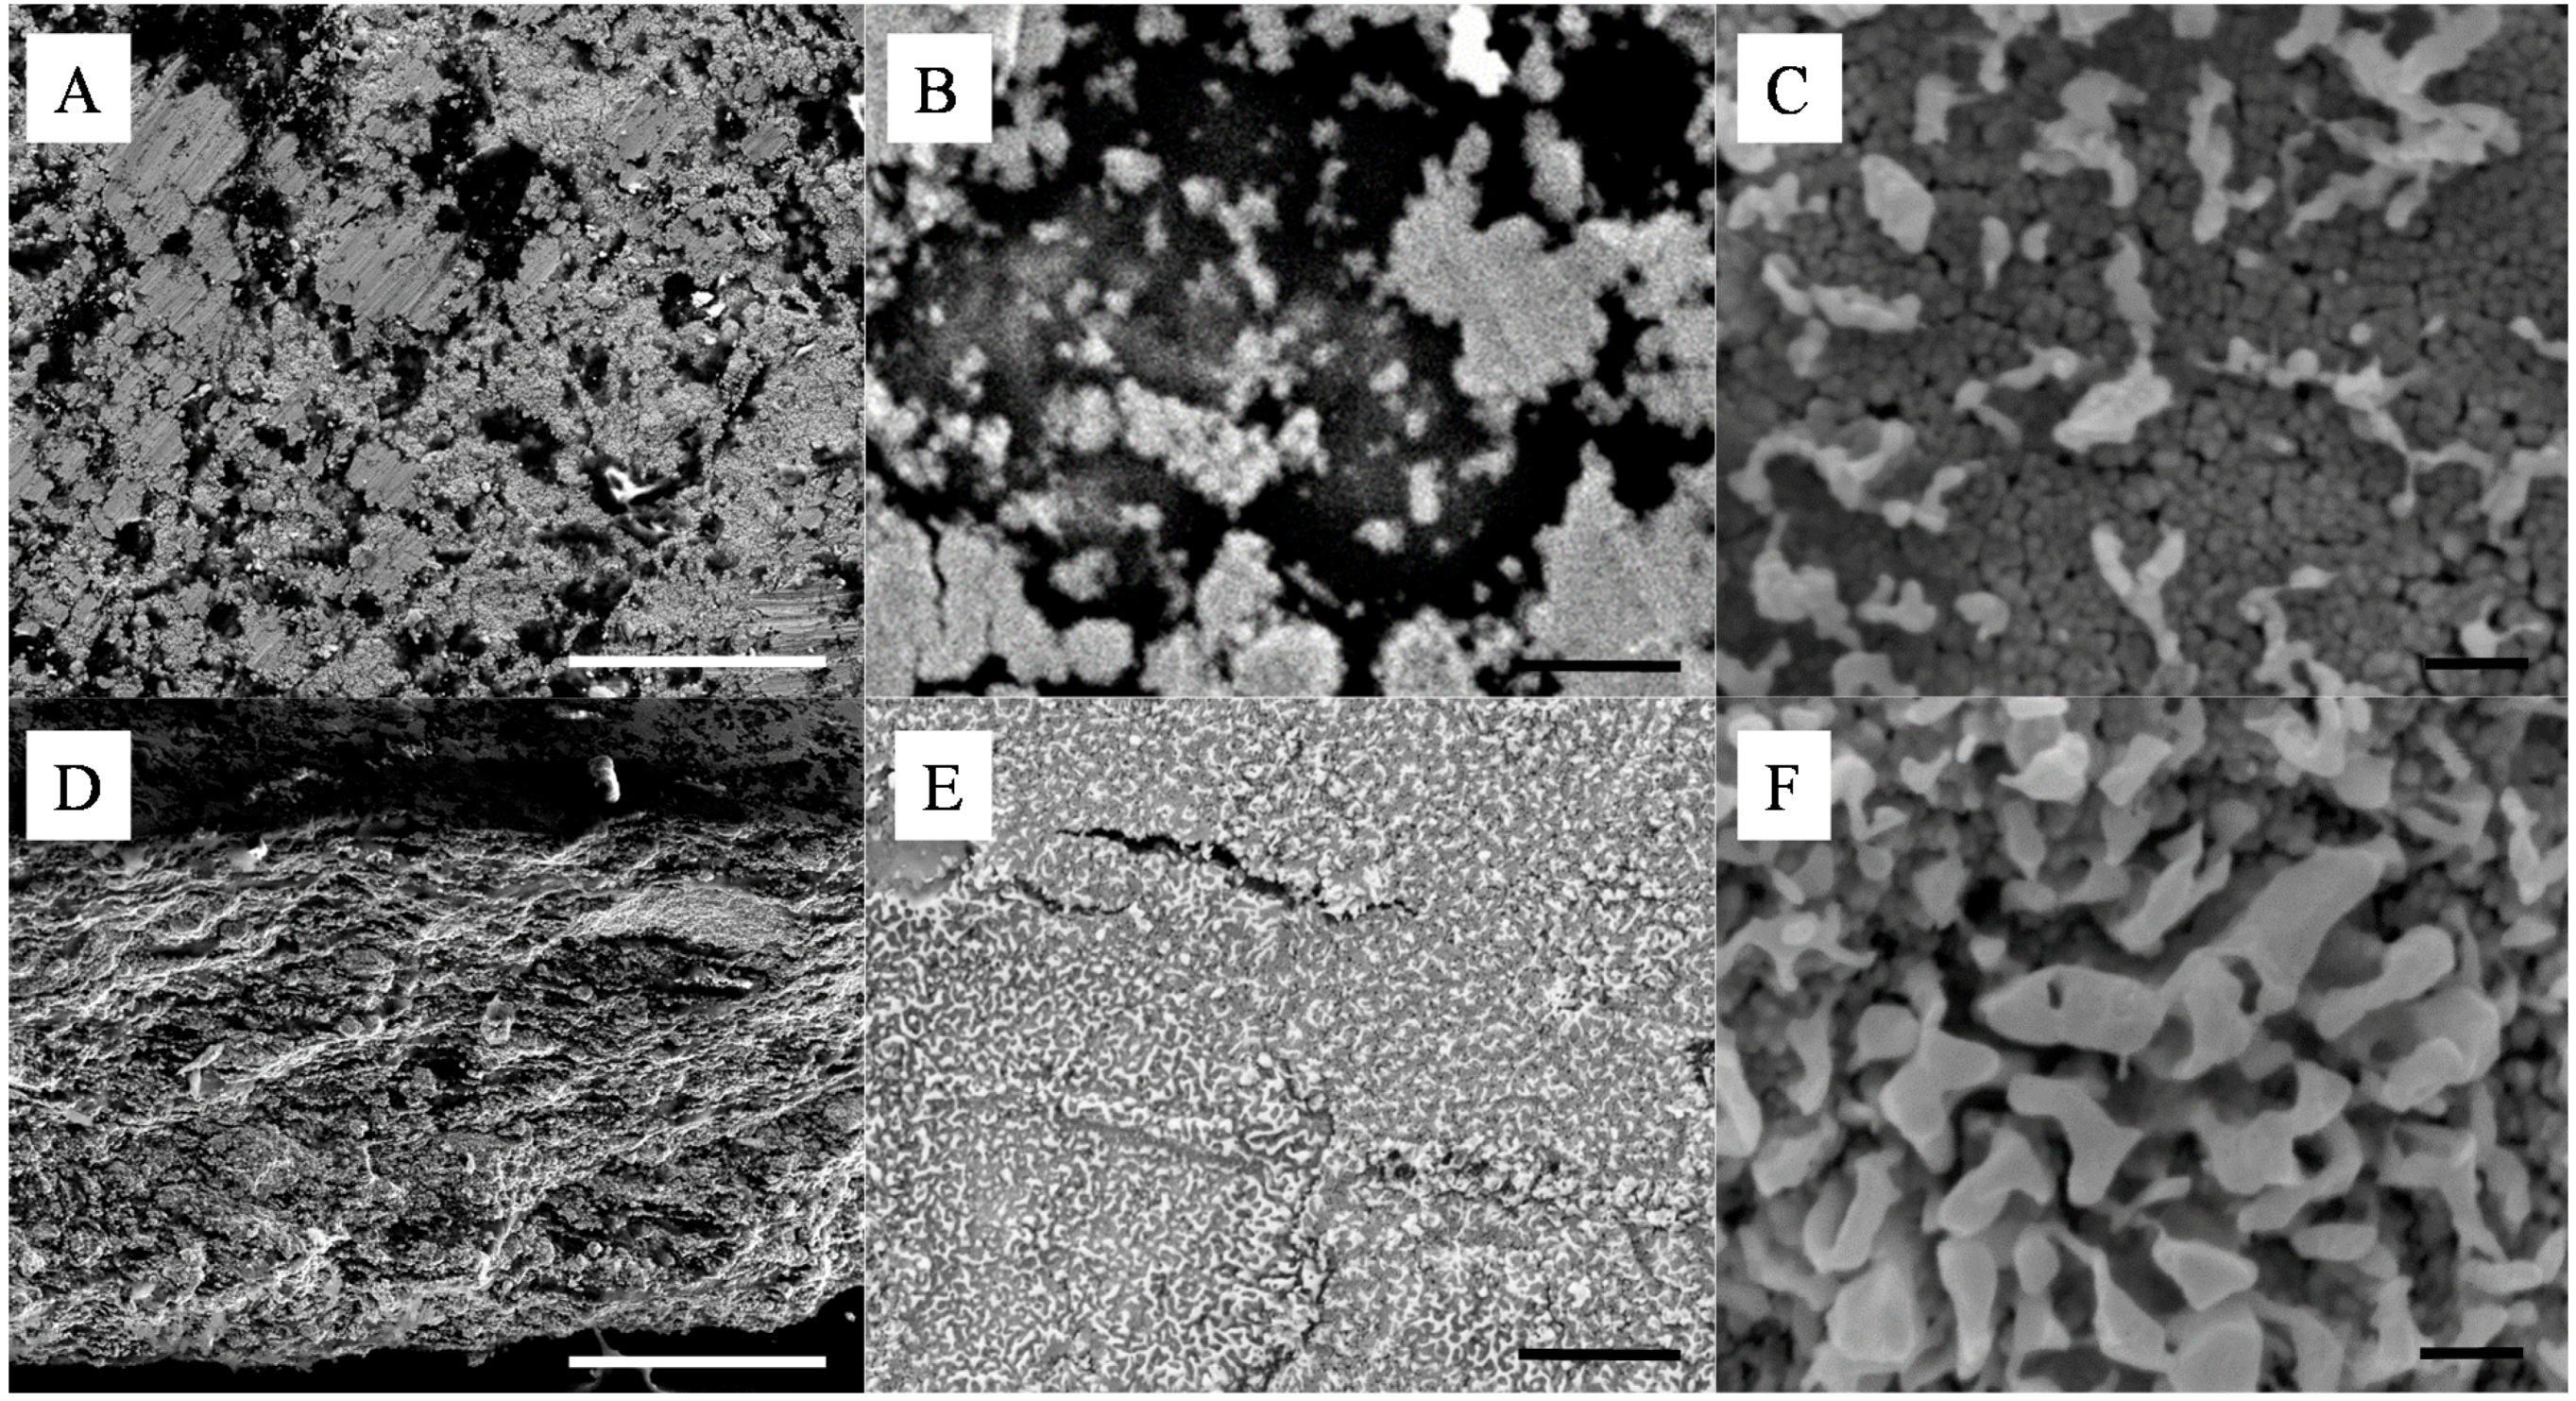
Although powder mixing was thorough and no aggregates could be detected by optical microscopy and visual inspections of the powders, this process, as shown in
Figure 2A–D, lead to the formation of dense materials with apparent particle segregation domains on the surface and across the thickness. The formation of layered NPs sub-structures is particularly visible in
Figure 2D. De-mixing of powders is a process which was previously related to the size, density and shape of the mixed particles. The moving particles flowing across a vortex or a Couette flow may phase separate through simple gravity separation [
14] and the smaller particles may then form a bed and infiltrate gaps between the larger particles. This phenomenon can be enhanced upon mechanical agitation of the mixed powders creating movement of the larger particles and facilitating the displacement of the smaller particles. Segregation induced separation has not been reported to date for sub-100 nm particles and has implications for the dry processing of NP powders (
Figure S1). Here, the clustering of the particles and their aggregation may also be enhanced from surface affinities between the high surface energy NPs [
1]. Although at the nanoscale Si and Ag materials shall be oppositely charged, SiO
2 and Ag being respectively naturally negatively and positively charged due to surface valence deficiency, the de-mixing may be caused by surface frictions between the like particles, leading to the formation of the visible clusters from the material surface [
19]. These frictions may lead to electrostatic interactions between particles upon flowing and may therefore explain some of the clusters formation [
20]. The impact of compression pressure on the sintering was first investigated. Interestingly, compression pressures lower than 20 ton·m
−2 did not lead to well-structured and mechanically stable thin films and a minimum energy was required to induce sintering of the Ag particles to form strong networks of metal at silica contents larger than 5 wt%, corresponding to ~42 v% (
Figure S3). Therefore all samples presented in this work were cold-pressed at 20 ton·m
−2.
Figure 2.
Representative SEMs of the silica - silver cold-pressed composites at 20 ton·m−2; (A–C) are surface and (D–F) cross section images of a 10 wt% silica content composite. The scale bars of (A,D), (B,E) and (C,F) respectively represent 100 μm, 1 μm and 100 nm.
Figure 2.
Representative SEMs of the silica - silver cold-pressed composites at 20 ton·m−2; (A–C) are surface and (D–F) cross section images of a 10 wt% silica content composite. The scale bars of (A,D), (B,E) and (C,F) respectively represent 100 μm, 1 μm and 100 nm.
The size of the surface clusters was found by SEM analysis to range, across all studied samples, between 500 nm and 2 μm (
Figure 2A). Interestingly, the clusters seem to be larger on the surface of the material than across its thickness as seen in
Figure 2E,F. There, after cold-compression, the average size of the clusters was found to be reduced to approximately 100 nm, corresponding to the agglomeration of ~5 Ag NPs. It is clear from these cross section micrographs that the size of the corresponding silica clusters is also close to the same dimensions, with up to 10
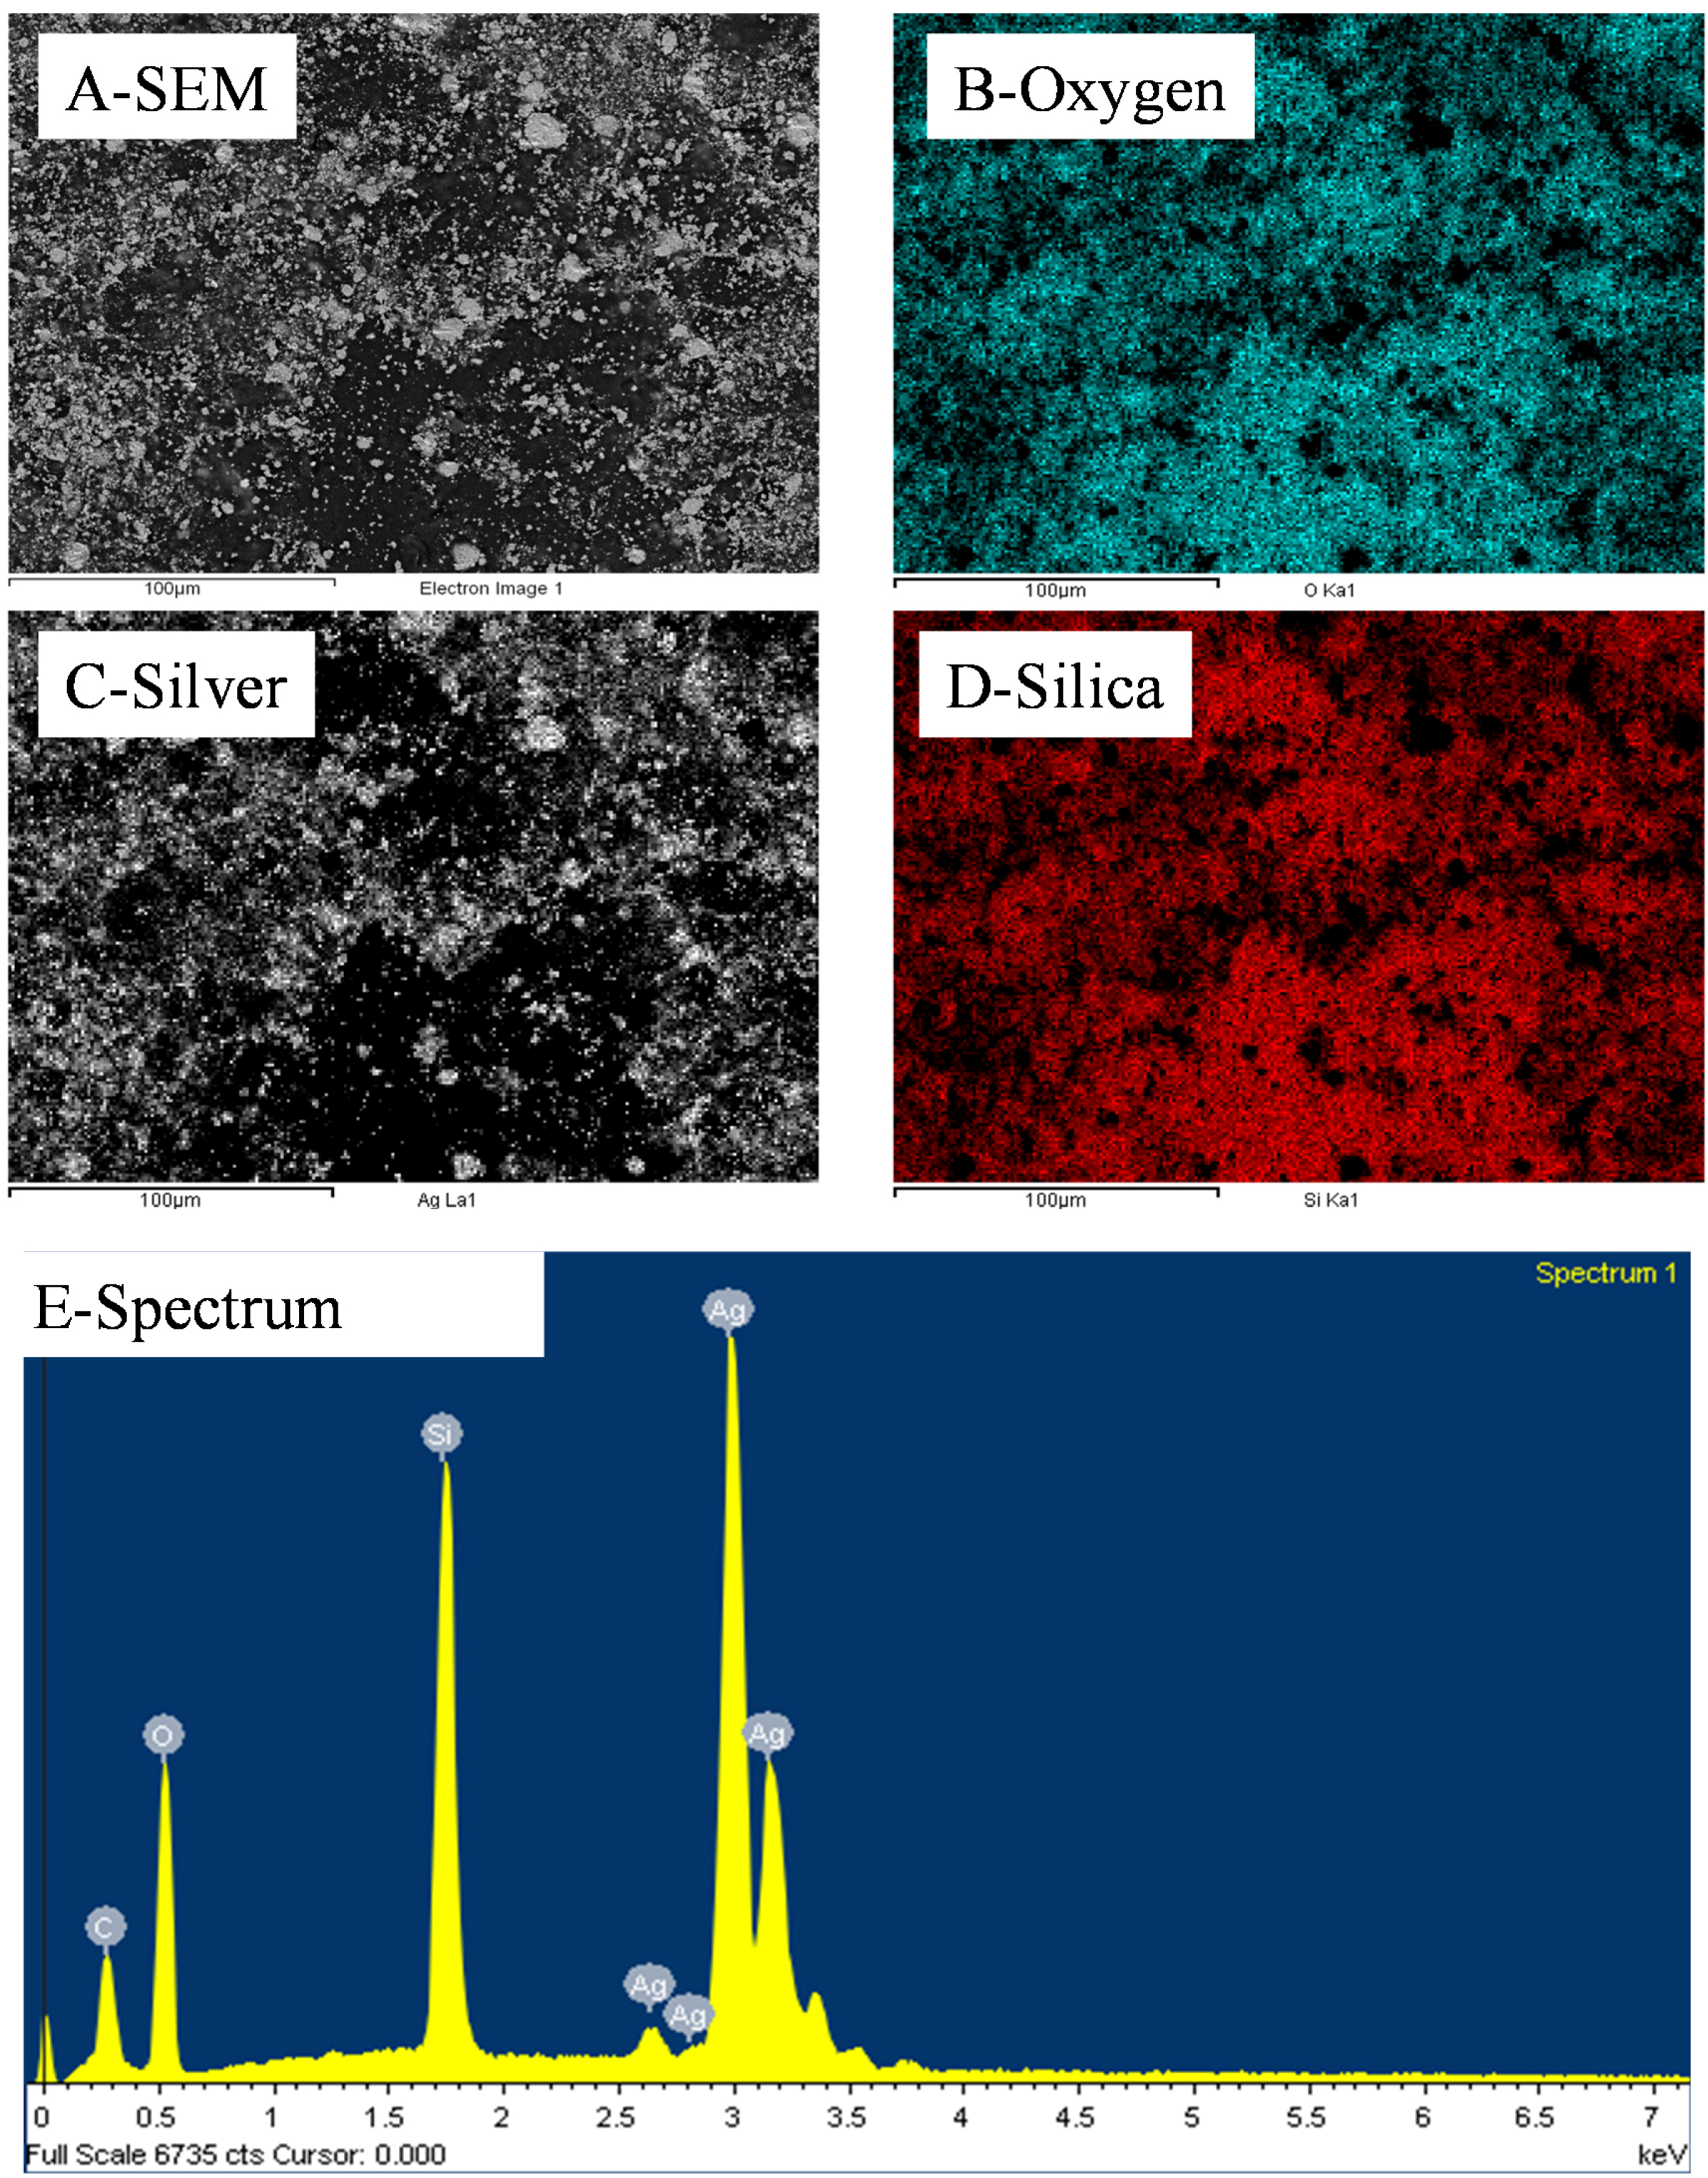
12 silica NPs per cluster. This particle distribution was confirmed by energy dispersive spectroscopy (EDS) mapping (
Figure 3) where the clusters could be clearly attributed to either nearly pure Ag or SiO
2. Furthermore small angle x ray scattering (SAXS) analysis of the samples before etching shows a large particulate distribution between 5 and 35 nm characteristic of the SiO
2 particles and small clusters (
Figure S2).
Figure 3.
Representative EDS distributions of Si, Ag and O elements across a 10 wt% silica content cold-pressed composite before silica etching presented in
Figure 1—carbon is present due to the sputtering step for sample preparation for SEM imaging.
Figure 3.
Representative EDS distributions of Si, Ag and O elements across a 10 wt% silica content cold-pressed composite before silica etching presented in
Figure 1—carbon is present due to the sputtering step for sample preparation for SEM imaging.
As seen in
Figure 2, the energy brought to the system by cold-pressing lead to the near complete coalescence of the soft Ag NPs and the formation of clear and well interconnected bridges across the silica matrix. The ability for a metal to coalesce at low input energy, such as the system described here, is largely related to the surface energy of the metal and to localized vacancies on the surface of the particles allowing for metal grain deformation and ultimately re-conformation and fusion [
21] similar to that previously reported for solution particle formation and coalescence [
22]. On the other hand, the hard SiO
2 spheres appeared undamaged even at compressing pressures of 20 ton·m
−2 and particle clusters were only found on the surface and across the thickness of the composite thin films. It is possible that the application of the pressure led to particle movement across the powder bed which may favor segregation. The initial powder bed thickness was estimated, based on the volume of particles poured in the dye, to be around 250 μm, while the final thickness of the compressed thin film samples was measured to be around 25 μm. This compression rate of the bed is therefore close to 90% suggesting large displacements of the nanoscale particles during the early stage of the cold-pressing process. The total energy of the particles can be divided into three main components, namely their kinetic energy, their potential energy and their surface energy. Although the kinetic energy of the particles is here close to nil due to the compression leading to a nearly static, low velocity, system [
23], the smaller particles potential energy may be reduced by moving across the mixed bed particles prior to Ag coalescence [
22]. This may favor segregation by gravimetric sorting of the particles. In addition, the strong friction between the particles upon compression will lead to localized heating and favor sintering and surface grain aggregation [
21]. The soft Ag particles will tend to limit their surface energy by coalescence and will expand their overall volume by combining with neighboring like particles [
24]. This process, closely related to powder metallurgy, may be used for the preparation of metal alloys from different metal NP mixtures by cold-pressing.
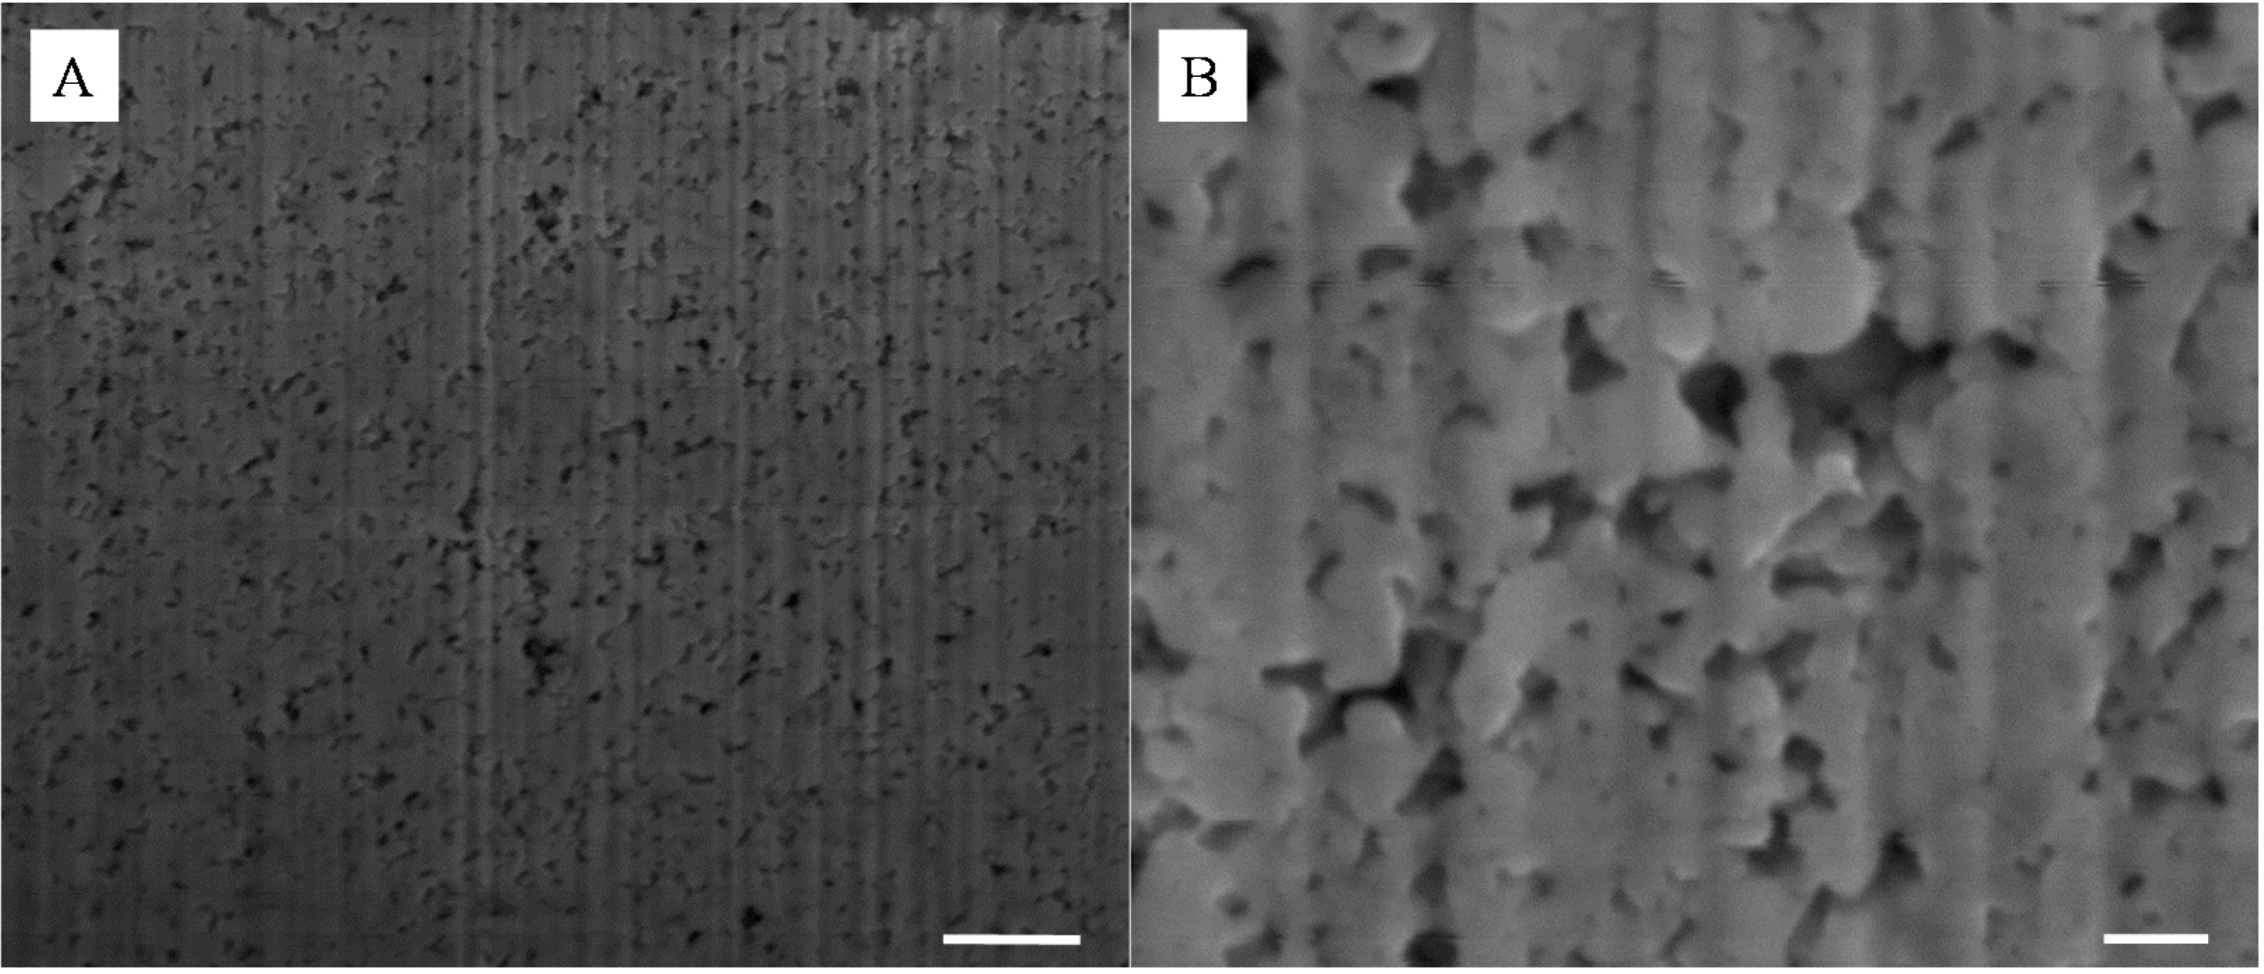
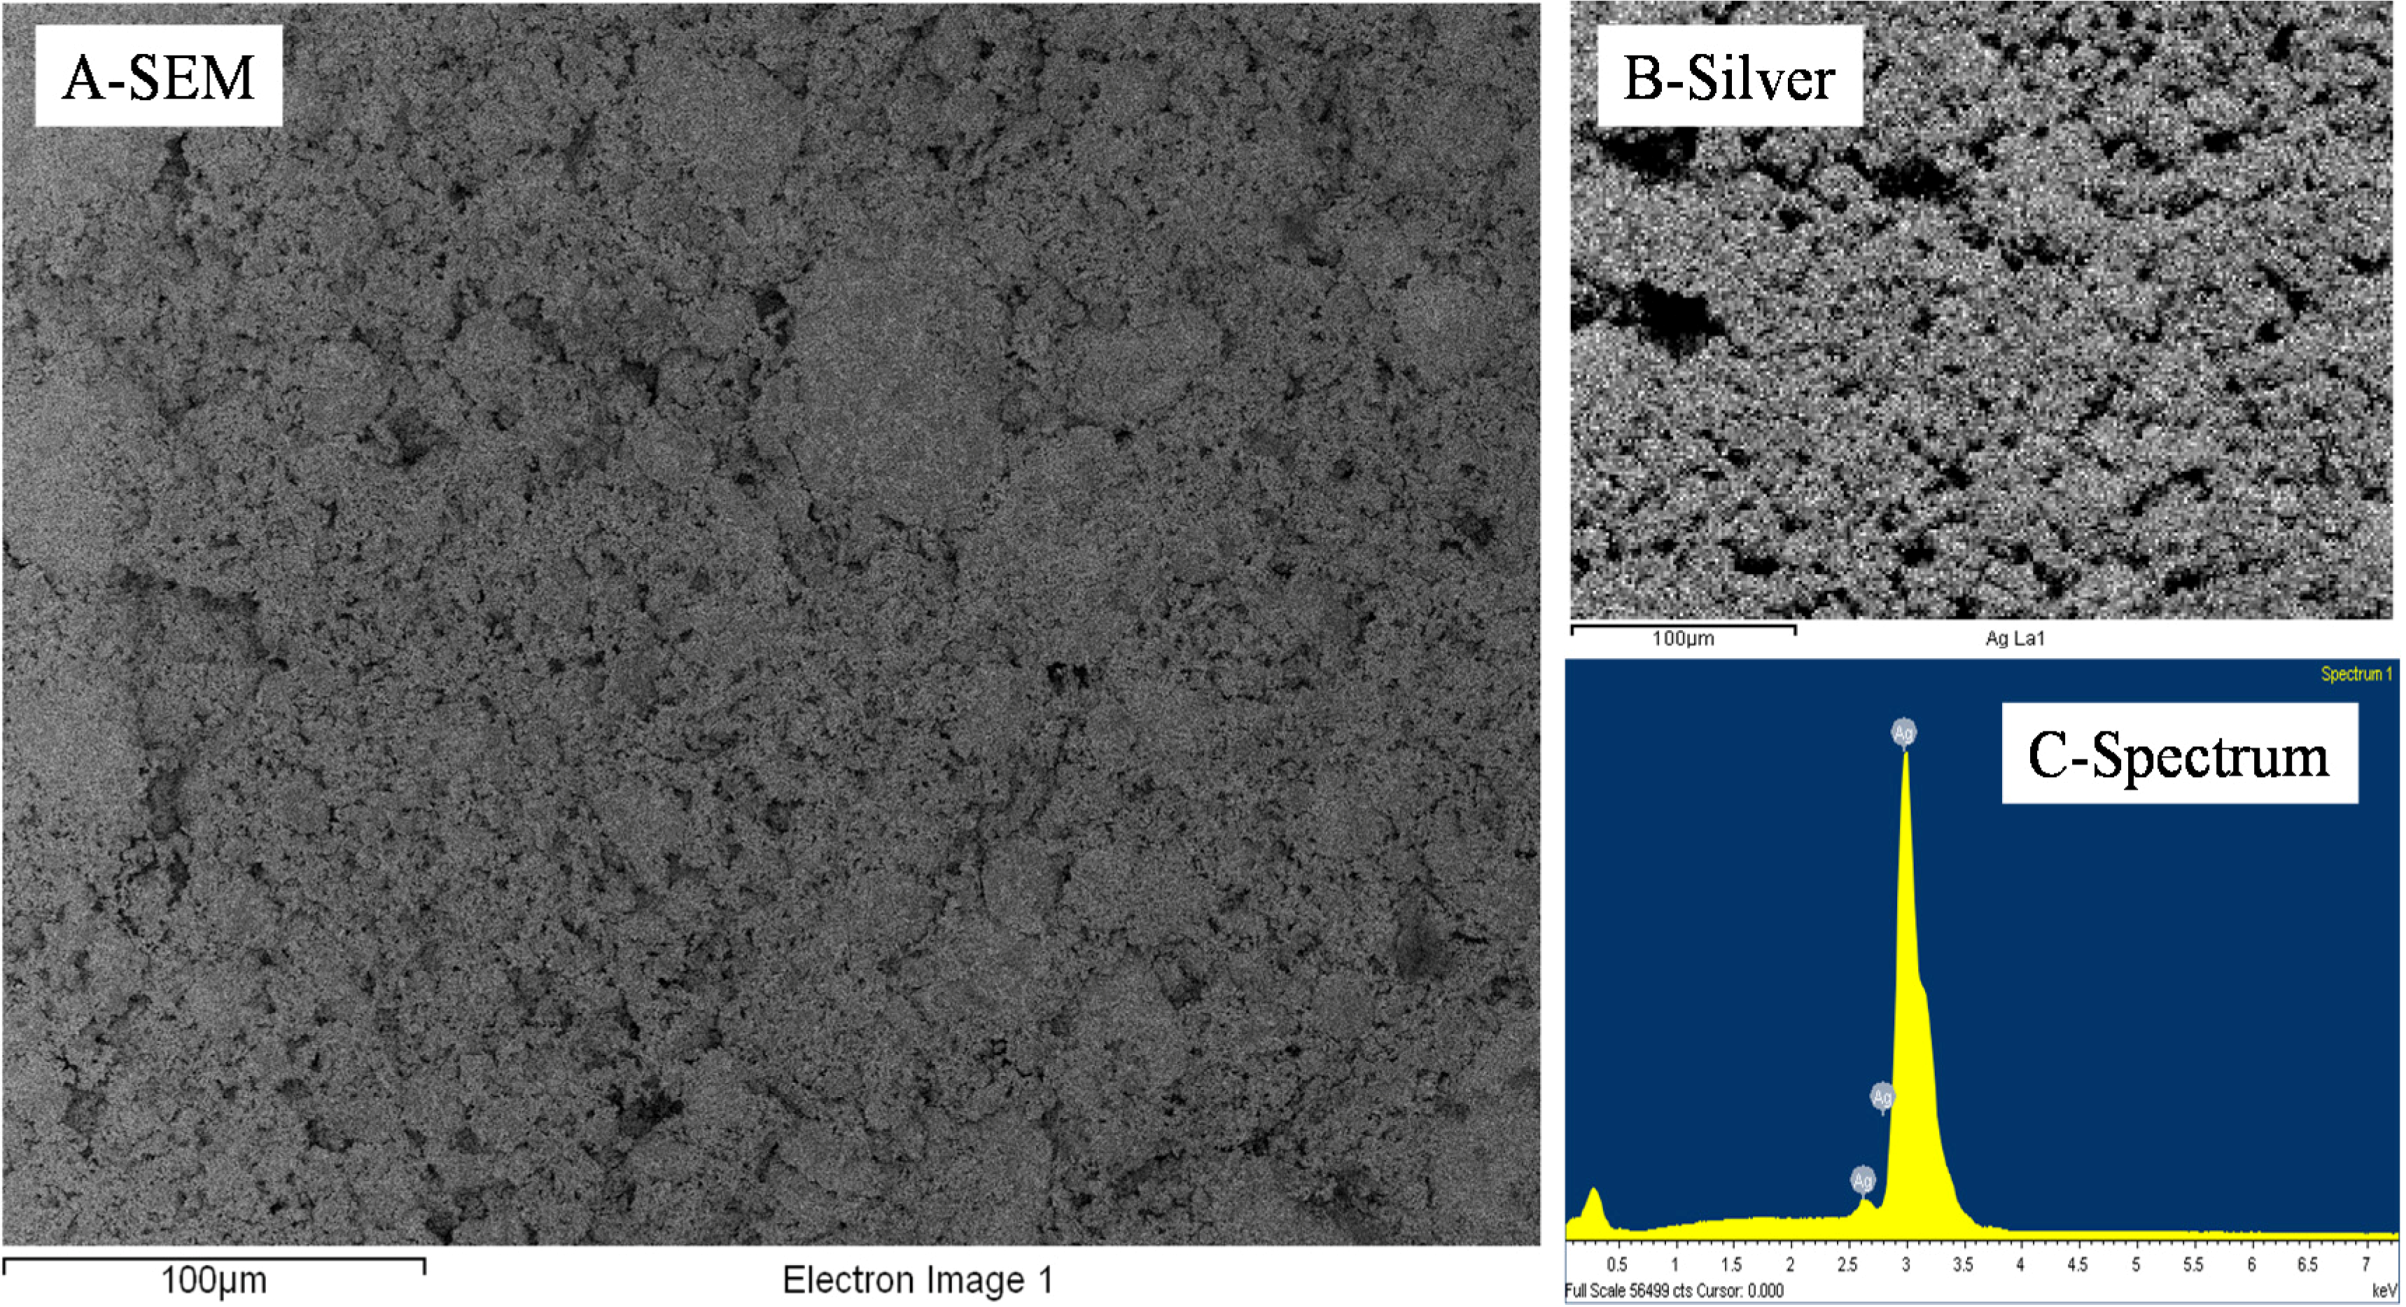
As seen in
Figure 4, the Ag sintered clusters were very stable upon etching in hydrofluoric acid (HF) and lead to the formation of pore domains in the site of the SiO
2 clusters and NPs. The presence of SiO
2, potentially remaining from the etching process was also checked by EDS, but, as seen in
Figure 5 and
Figure 6, none could be detected after the etching process and the structure was found to be made of pure Ag.
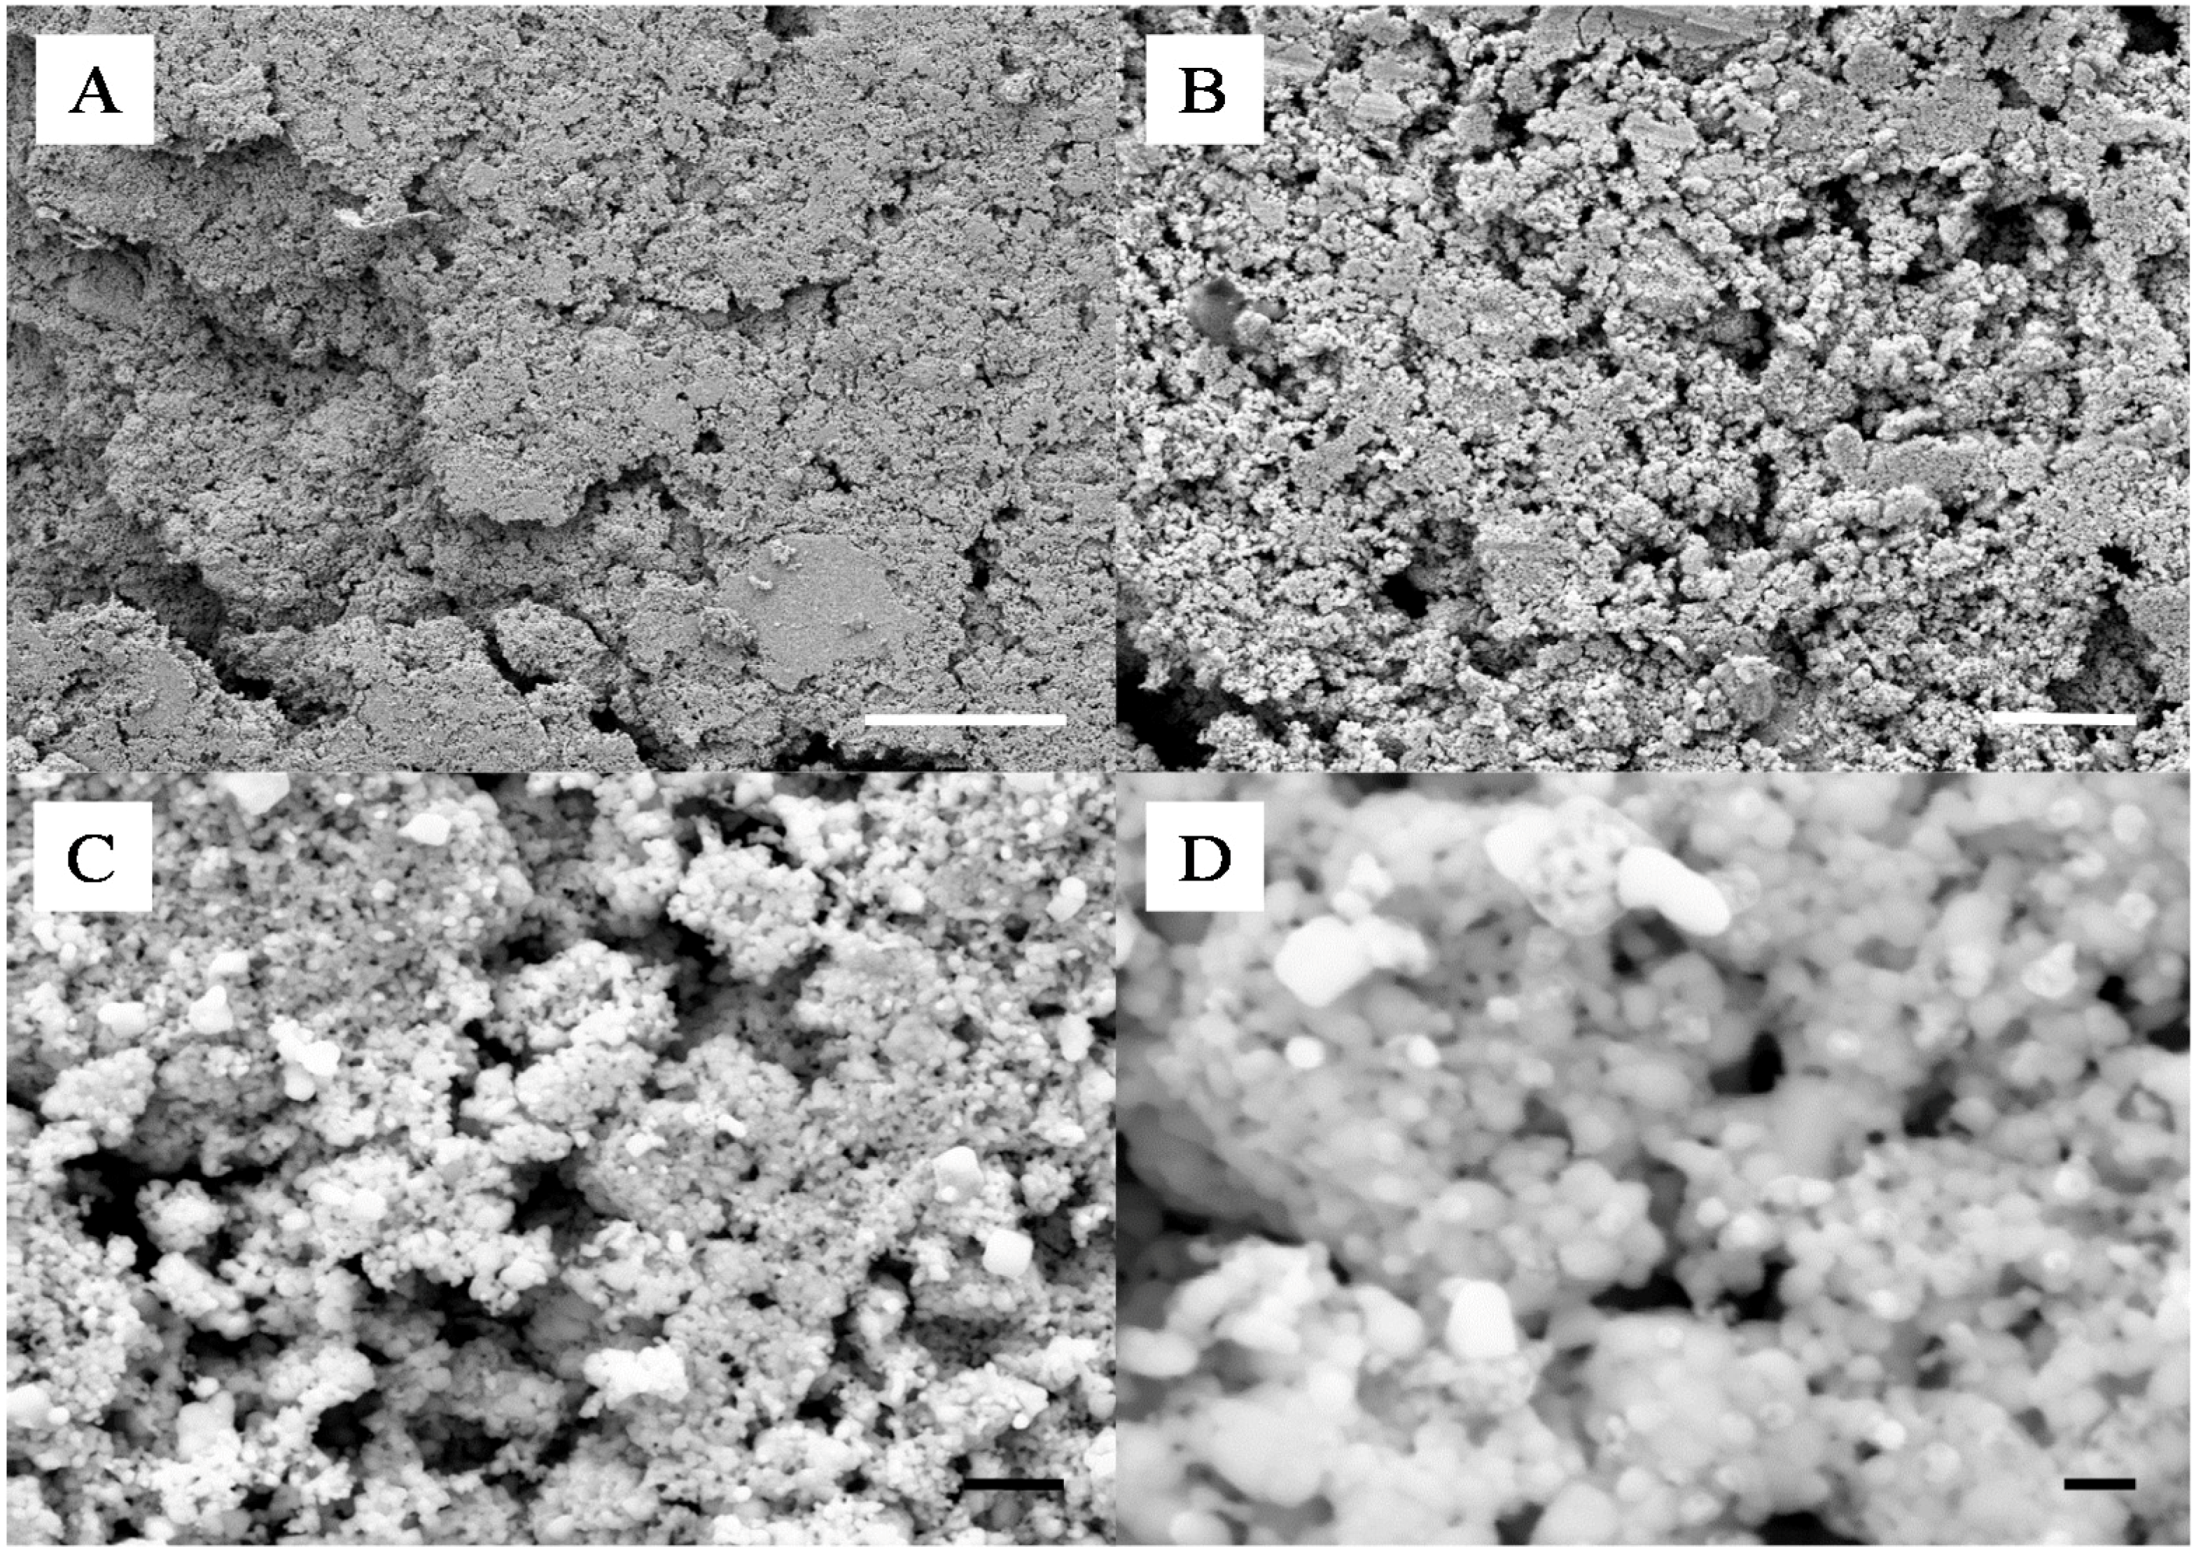
Figure 4.
Representative SEMs of the surface of an etched 10 wt% SiO
2-Ag composite similar to those presented in
Figure 1; scale bars of (
A), (
B), (
C) and (
D), respectively correspond to 100 μm, 10 μm, 1 μm and 100 nm.
Figure 4.
Representative SEMs of the surface of an etched 10 wt% SiO
2-Ag composite similar to those presented in
Figure 1; scale bars of (
A), (
B), (
C) and (
D), respectively correspond to 100 μm, 10 μm, 1 μm and 100 nm.
Figure 5.
Representative SEMs of the cross-section of an etched 10 wt% SiO2-Ag composite; scale bars of (A) and (B) are 1 μm and 200 nm respectively. The images were taken approximately 10 μm from the surface.
Figure 5.
Representative SEMs of the cross-section of an etched 10 wt% SiO2-Ag composite; scale bars of (A) and (B) are 1 μm and 200 nm respectively. The images were taken approximately 10 μm from the surface.
Figure 6.
Representative EDS distributions of Si, Ag and O elements across a 10 wt% silica content cold-pressed composite after silica etching–a small amount of carbon can be detected residual from sample preparation for SEM imaging; no Si and minutes amount of O could be detected; the scale bar corresponds to 100 μm.
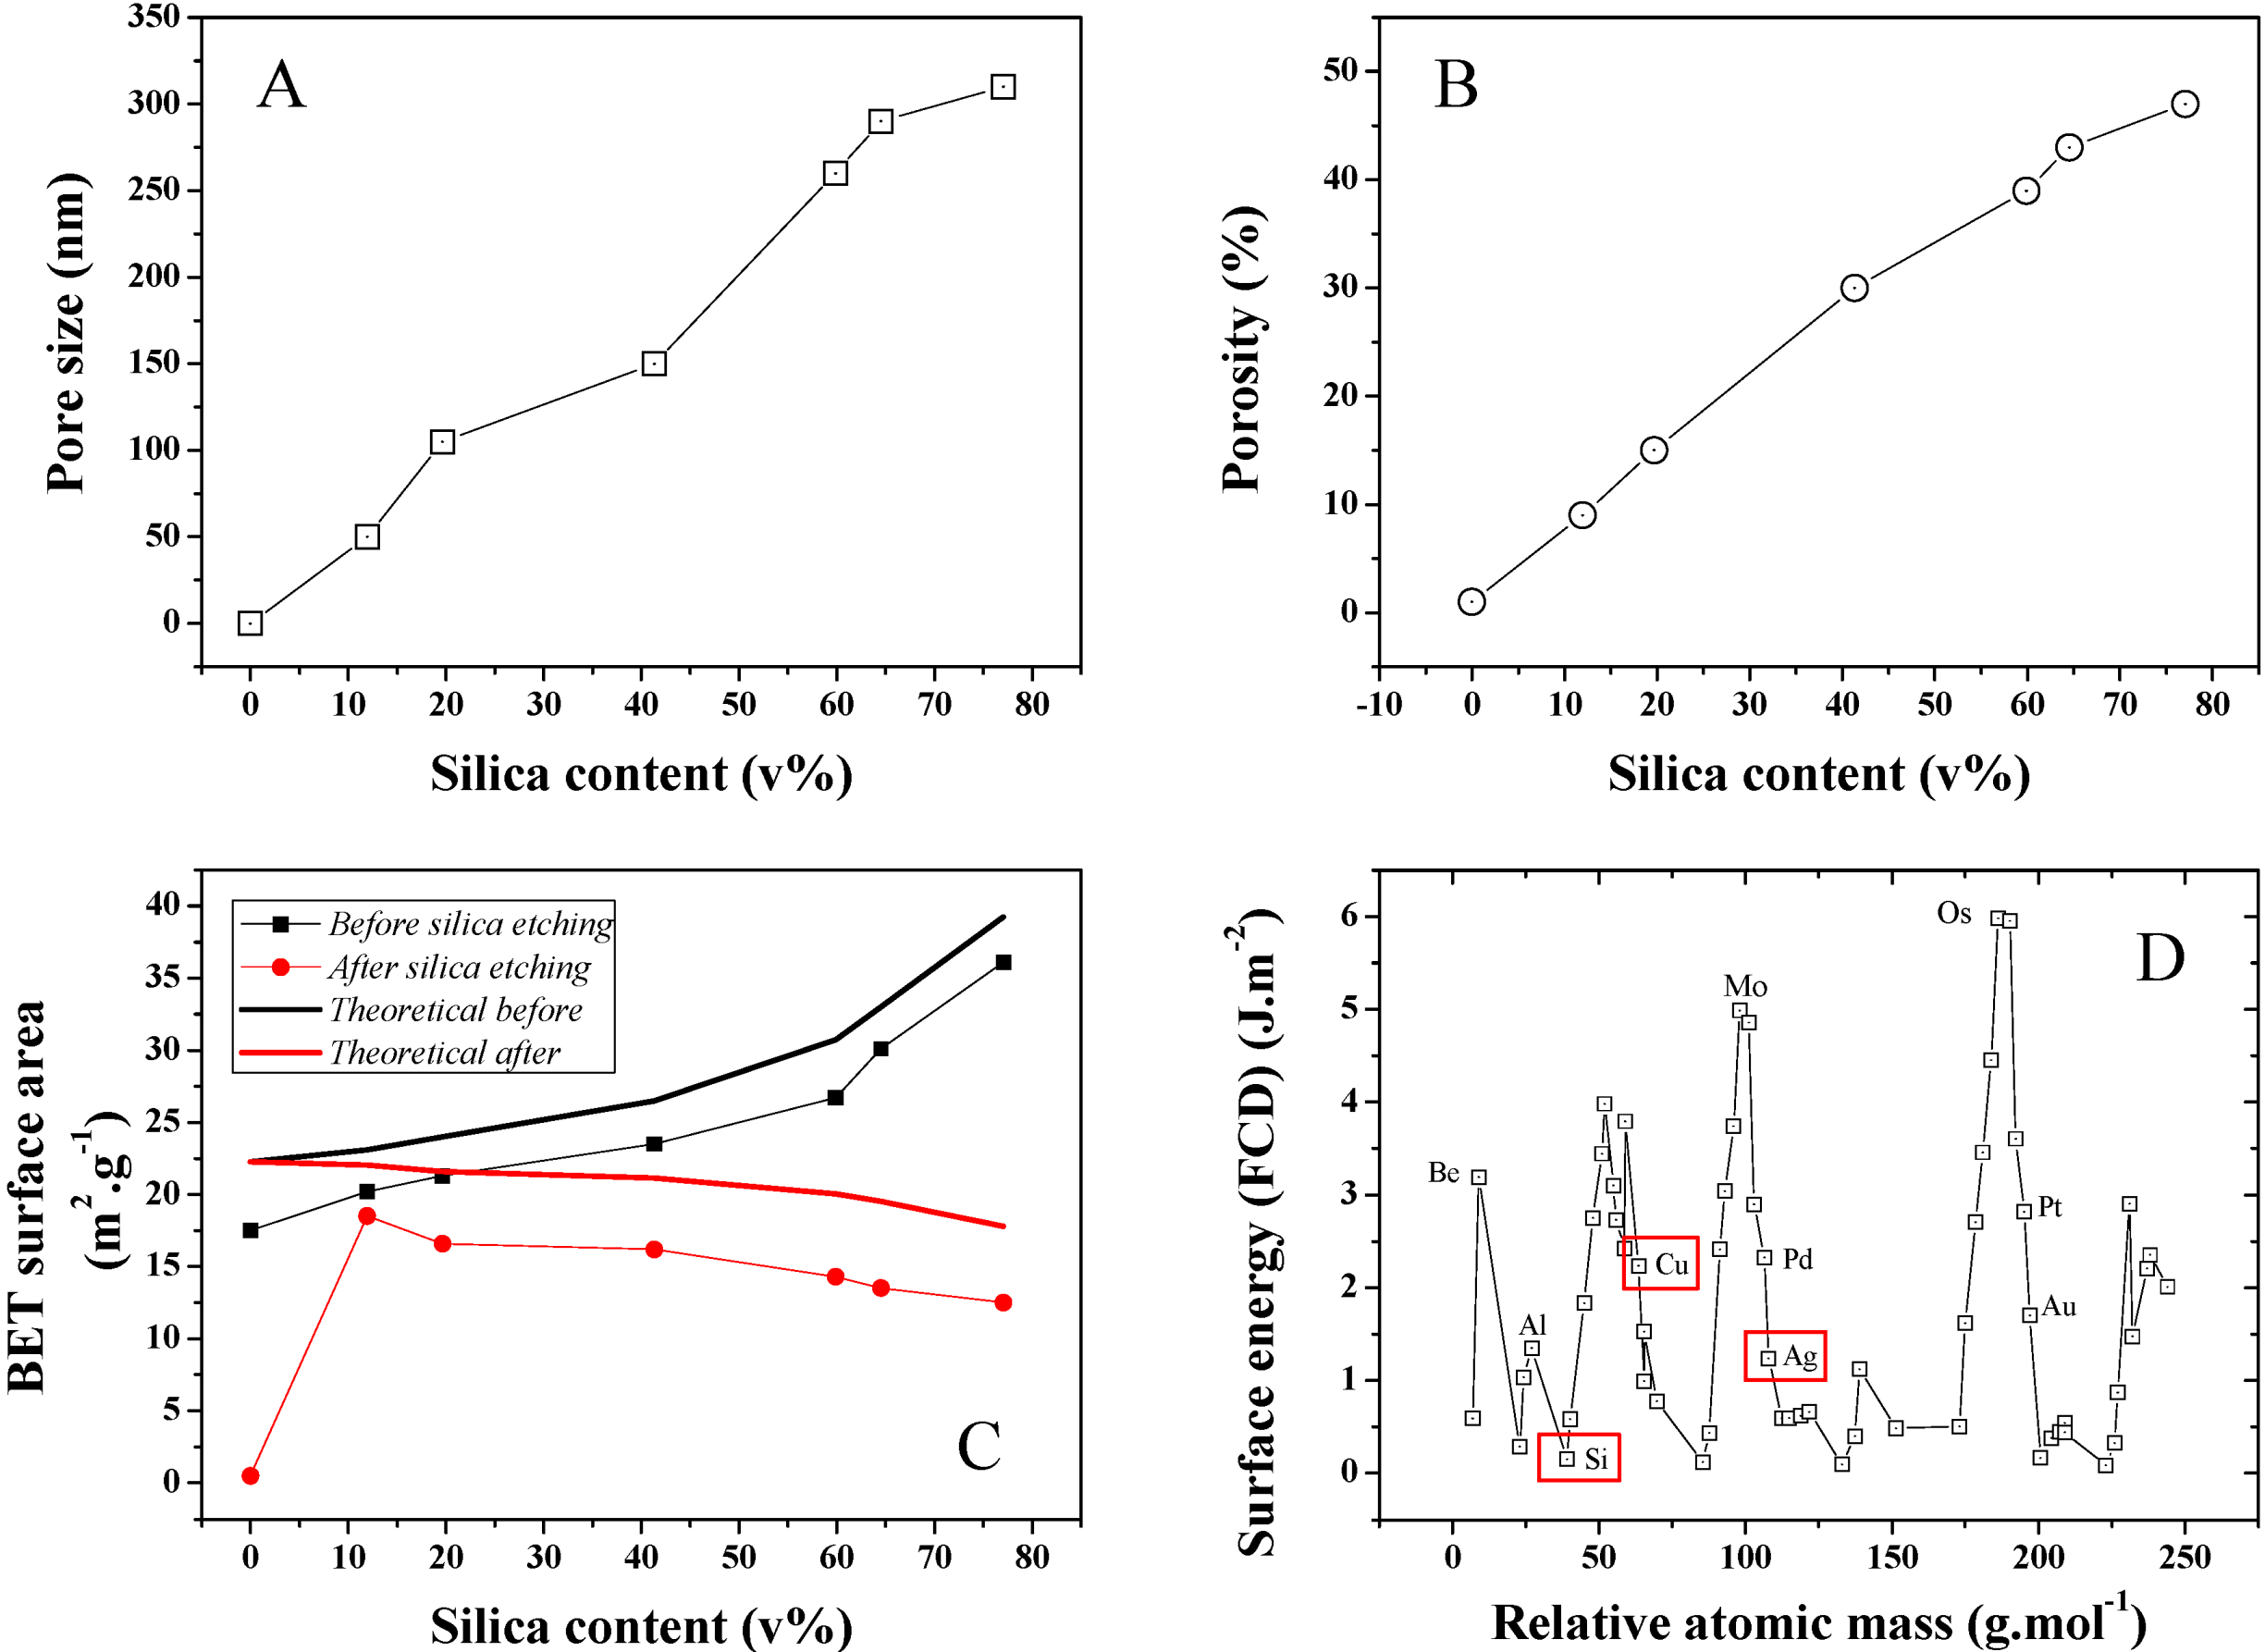
The average pore size distribution of a series of different silica loading samples was investigated and is presented in
Figure 7A. Pore size is found to steadily increase with silica content during the isobaric compression, suggesting an increase of the clustering due to stronger interactions between the SiO
2 NPs during cold-pressing. This was confirmed by SEMs taken on Focus Ion Beam (FIB) cross-sectioned samples (
Figure 5) where 50–400 nm diameter pores could be detected. The average pore size for 10 and ~80 v% samples was found to increase nearly 6 fold from 50 to 300 nm (Conversion wt% to v% is presented in
Figure S3). Furthermore, porosity was also found to strongly increase upon SiO
2 content increase in the initial powder bed. A typical pore size distribution for a 12 v% SiO
2 content sample is shown in
Figure S4. As seen in
Figure 7B, porosity increased for the 10 and ~80 v% samples from approximately 10% to 47%. This strong discrepancy between the SiO
2 volume and the final porosity may be explained by the larger SiO
2 clusters visible on the sample surface before etching and from potential recombination of the Ag matrix upon HF etching. Both the surface area and thickness of the samples before and after etching was found to shrink by about 10%. It is, however, challenging to properly measure this volume change due to the rough surface of the material, limiting the accuracy of any thickness measurement attempts and to potential decay on the side of the samples due to the presence of SiO
2 clusters. This hypothesis was confirmed by BET surface area analysis of the series of samples, which was also found to steadily increase with SiO
2 content (
Figure 7C). The maximum specific surface area of the samples were calculated based on that of the individual particles before compression. A discrepancy between these values and that measured is found, which is here related to the strong surface energy and roughness change of the silver due to the plastic deformation leading to grain deformation and ultimately at an excitation energy high enough coalescence. The reactivity of metal surface is illustrated in
Figure 7D where modelled surface energies for a range of elements were computed [
25].
Figure 7.
(A) Average pore size distribution obtained for the series of Ag-Si nano-composites after Si etching; (B) Average porosity for the same series; (C) BET surface area for the series of samples before and after etching and theoretical BET surface area calculated for an estimated individual surface area of the Si and Ag NP powders of 23.81 and 30 m2·g−1. The surface area of the cold press sample at 0 wt% of SiO2 was extremely low and thus 0 due to strong particle coalescence; and (D) FTD calculated surface energy for the main elements of the periodic table and visual representation of the position of Si, Cu and Ag. The 0 wt% silica data points for pore size and porosity were extrapolated since no data could be obtained neither by perm-porometry nor pyknometry.
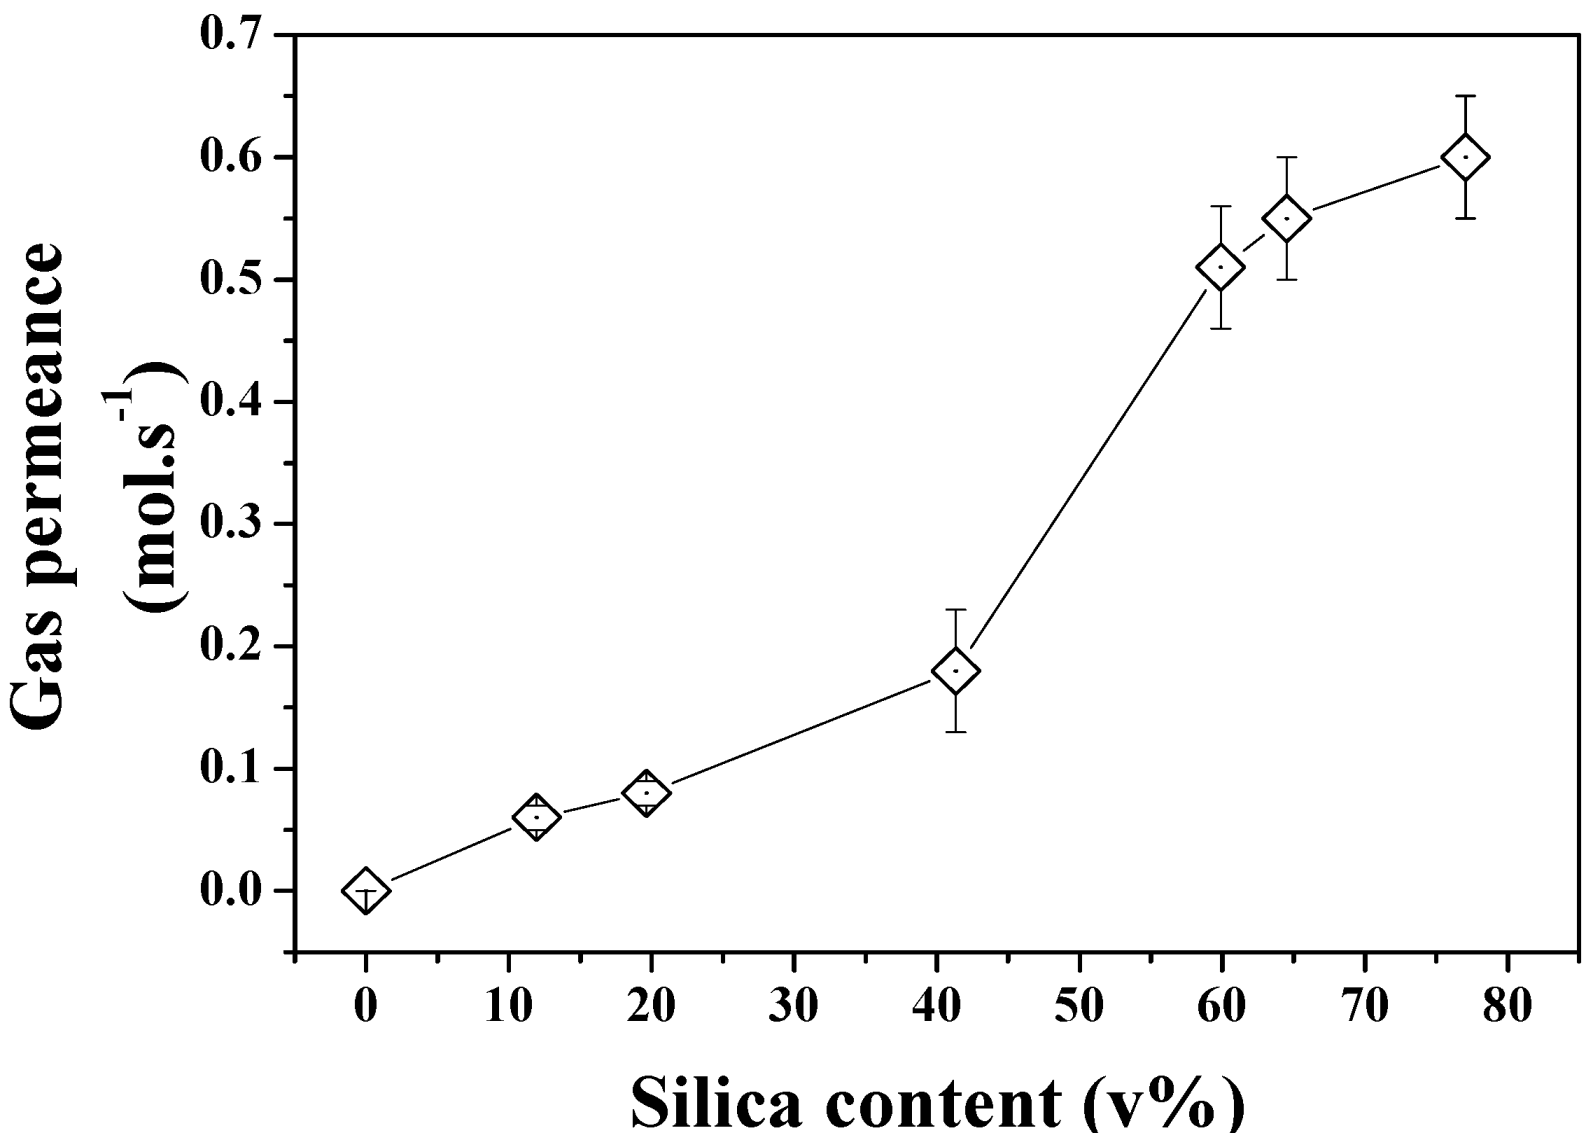
The gas permeation properties of the same series of samples were also investigated to demonstrate the formation of true through pores across the structures. As seen in
Figure 8, the increasing pore size and porosity lead to enhanced gas permeation. Interestingly, a stronger shift was found to occur between 40 and 60 SiO
2 v% content in the powder beds which could be related to the formation of larger defects on the edge of the samples or to macro voids across the materials which cannot be otherwise characterized by direct pore size or porosity measurements. The break-up of the gas permeation at this level could be related to localized inhomogeneity of the materials and variations of relative pore size and porosity despite the care taken in both sample preparation and tests. The relationship between pore size and gas permeation is expected to be linear for this regime of diffusion at constant porosity. However the increasing porosity directly related to pore size and demonstrated in
Figure 7 may affect this trend and lead to non-linear gas permeation regimes due to great variations of structures between the samples. Further analysis of the formation of the clusters and pores upon etching for Ag are required and shall be carried out in order to process narrower pore size distribution materials and process materials with fixed porosity and ranging pore size distributions.
Figure 8.
N2 permeance across the etched Si-Ag NP composites.
Figure 8.
N2 permeance across the etched Si-Ag NP composites.
A similar study was performed with SiO
2–Cu NPs. This was performed to assess the feasibility of the technique to produce lower cost meso-porous metal materials. Most of the work reported to date on the coalescence of metal NPs has focused on the use of noble and inert metals such as Ag, Gold and Platinum. The Cu particles must be handled in an inert atmosphere in order to avoid their spontaneous combustion in contact with O
2 gas. For this reason only a select number of samples were prepared and etched in HF following the same protocol as for the Ag NPs. As seen in
Figure 9A–D, the formation of the composite was in essence similar to that of the SiO
2-Ag frameworks, although smaller aggregates were found on the surface of the samples upon compression. The surface of the material was also found to be much smoother than that of the SiO
2-Ag composites, which was attributed to the higher surface energy of Cu NPs and thus their stronger capability to coalesce. Etching of the composite samples led to the formation of very different pore shapes than those obtained for Ag films. A change of solution color during etching, from transparent to green, suggested a competitive etching between the silica and the copper. This was confirmed by SEM as seen in
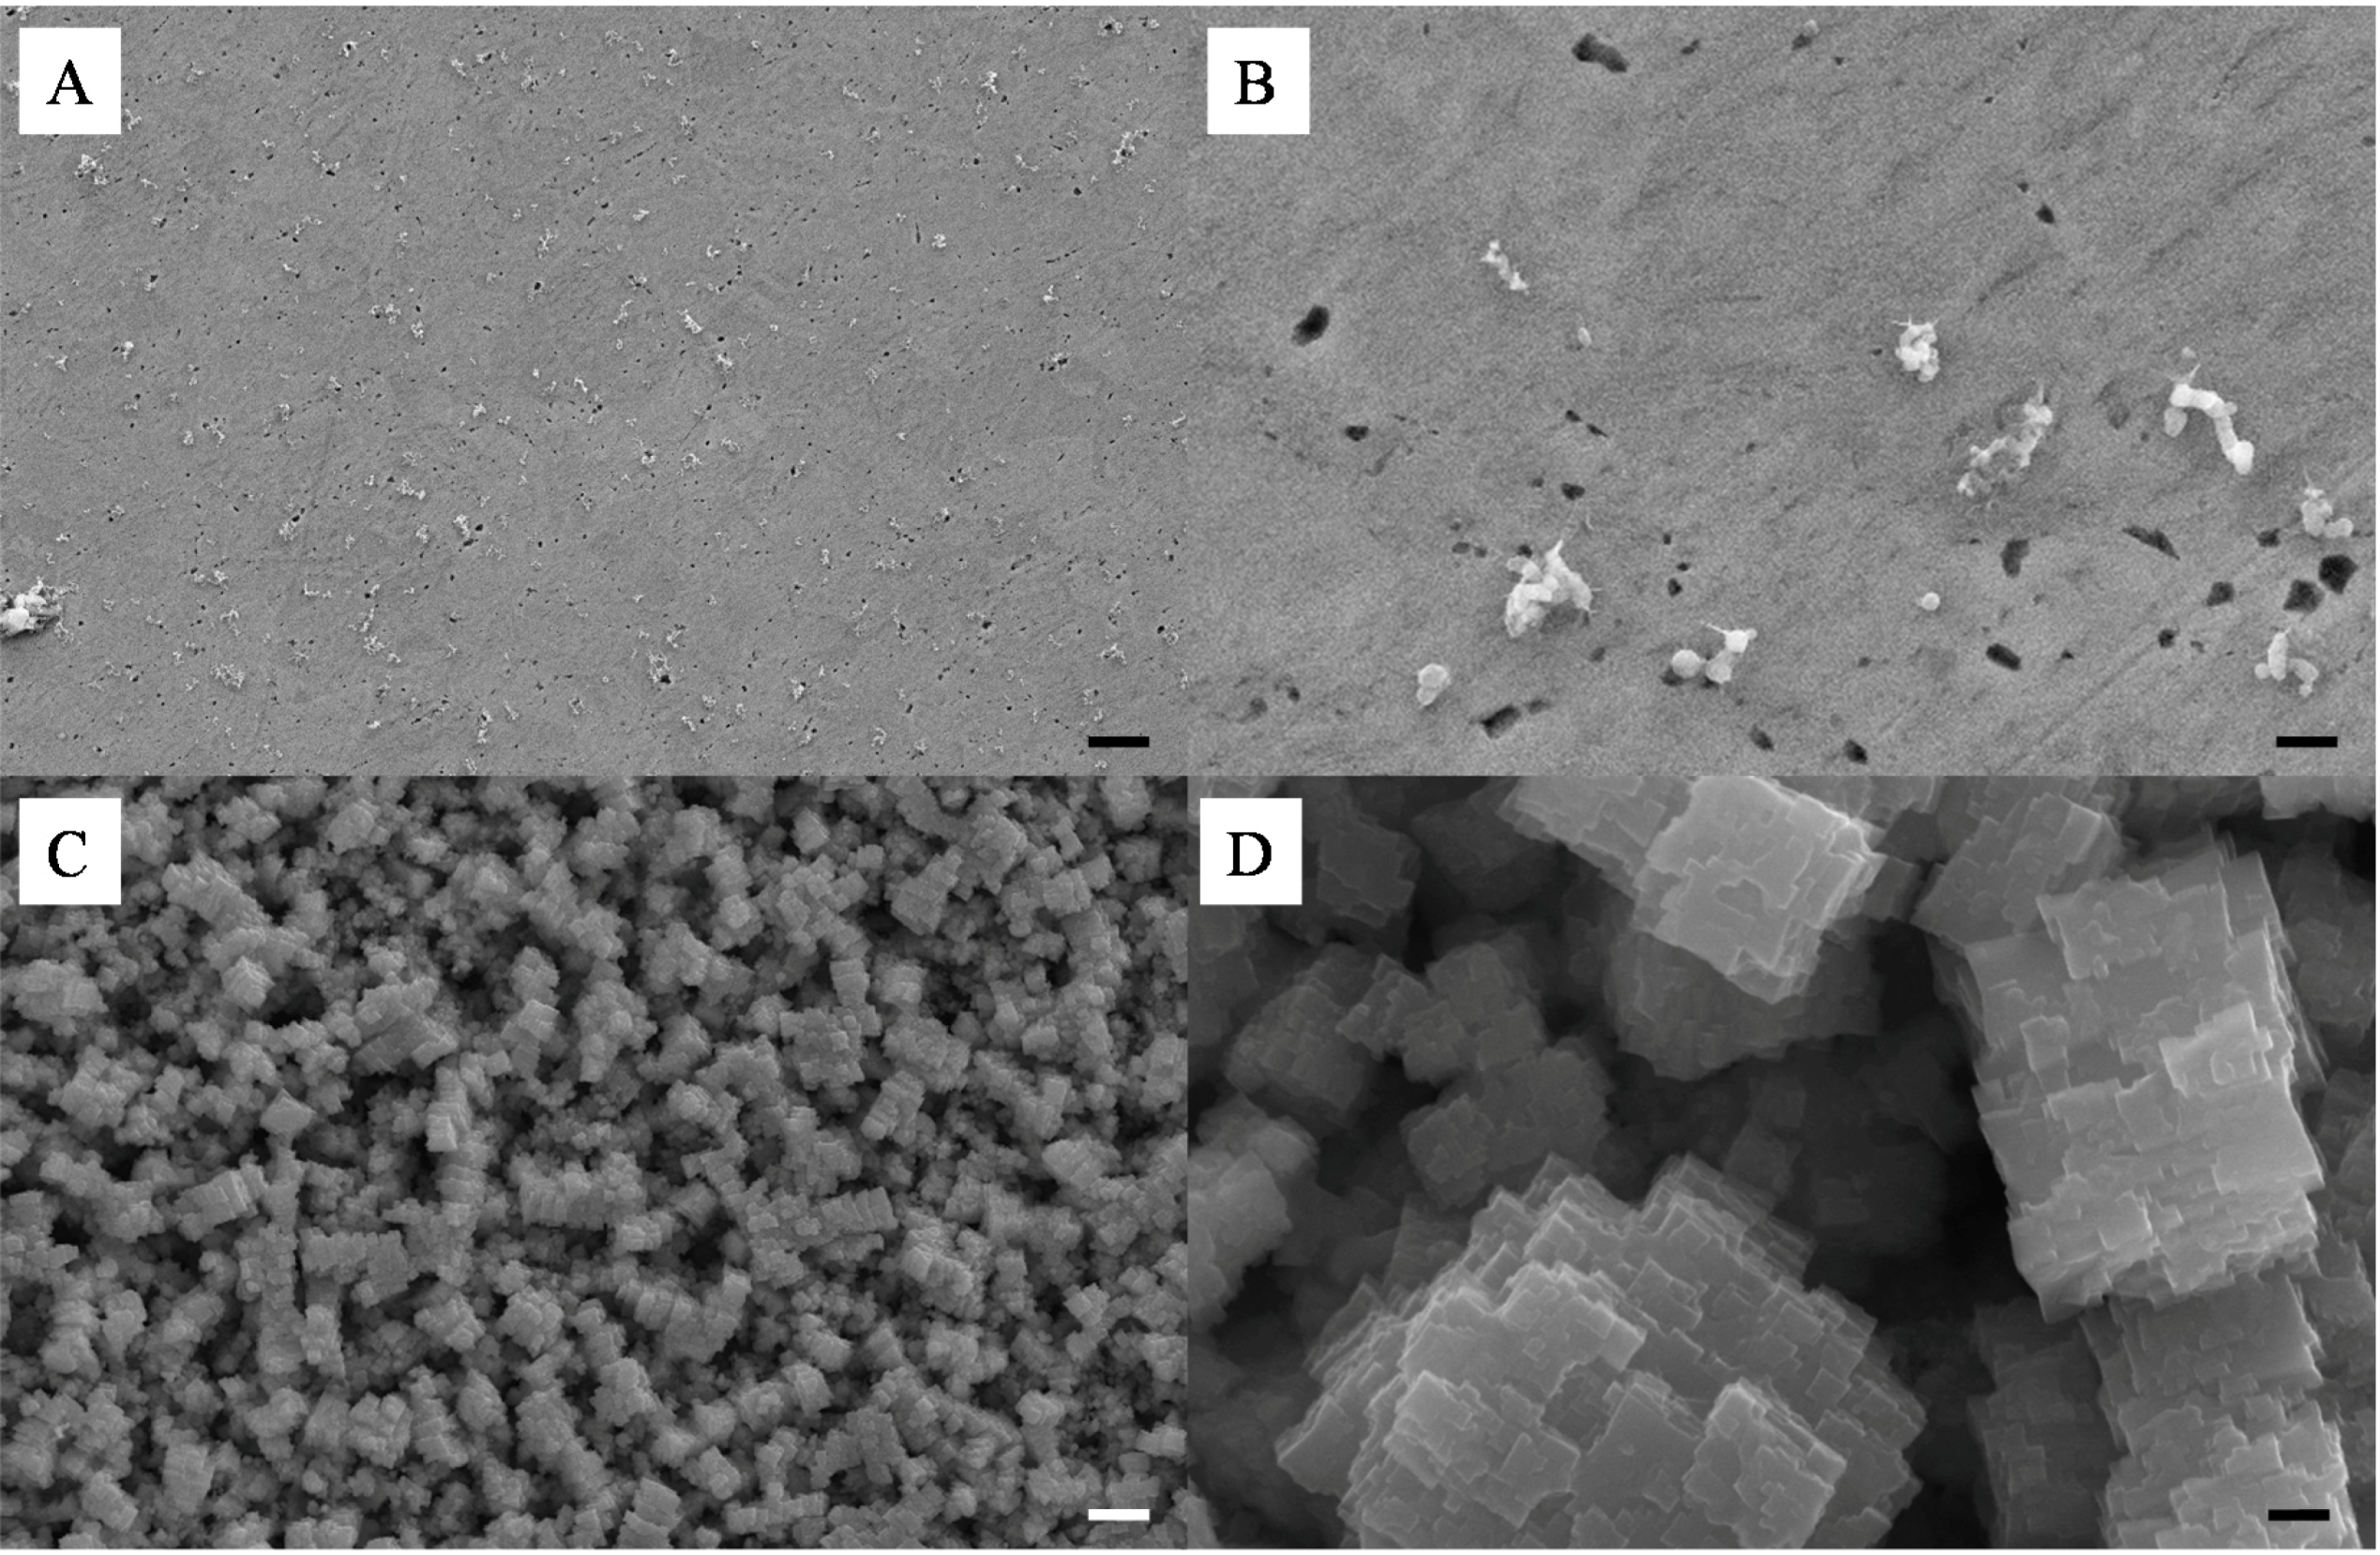
Figure 9C,D, where cubic aggregates can be seen. Interestingly it appears that the surface of the coalesced Cu NPs was partially corroded which lead to a much rougher and more ordered surface with clear cubic particles formation. Clear pores can be seen from the SEMs suggesting a similar network formed across the pure copper clusters. Although highly promising more analysis should be carried out to fully reveal the properties of these Cu based meso-porous structures.
Figure 9.
Representative SEMs of the surface of a 10 wt% Si-Cu composite before (A,B) and after (C,D) HF etching; scale bars of (A,C) and (B,D) respectively correspond to 2 μm and 200 nm.
Figure 9.
Representative SEMs of the surface of a 10 wt% Si-Cu composite before (A,B) and after (C,D) HF etching; scale bars of (A,C) and (B,D) respectively correspond to 2 μm and 200 nm.

 ,
, 

