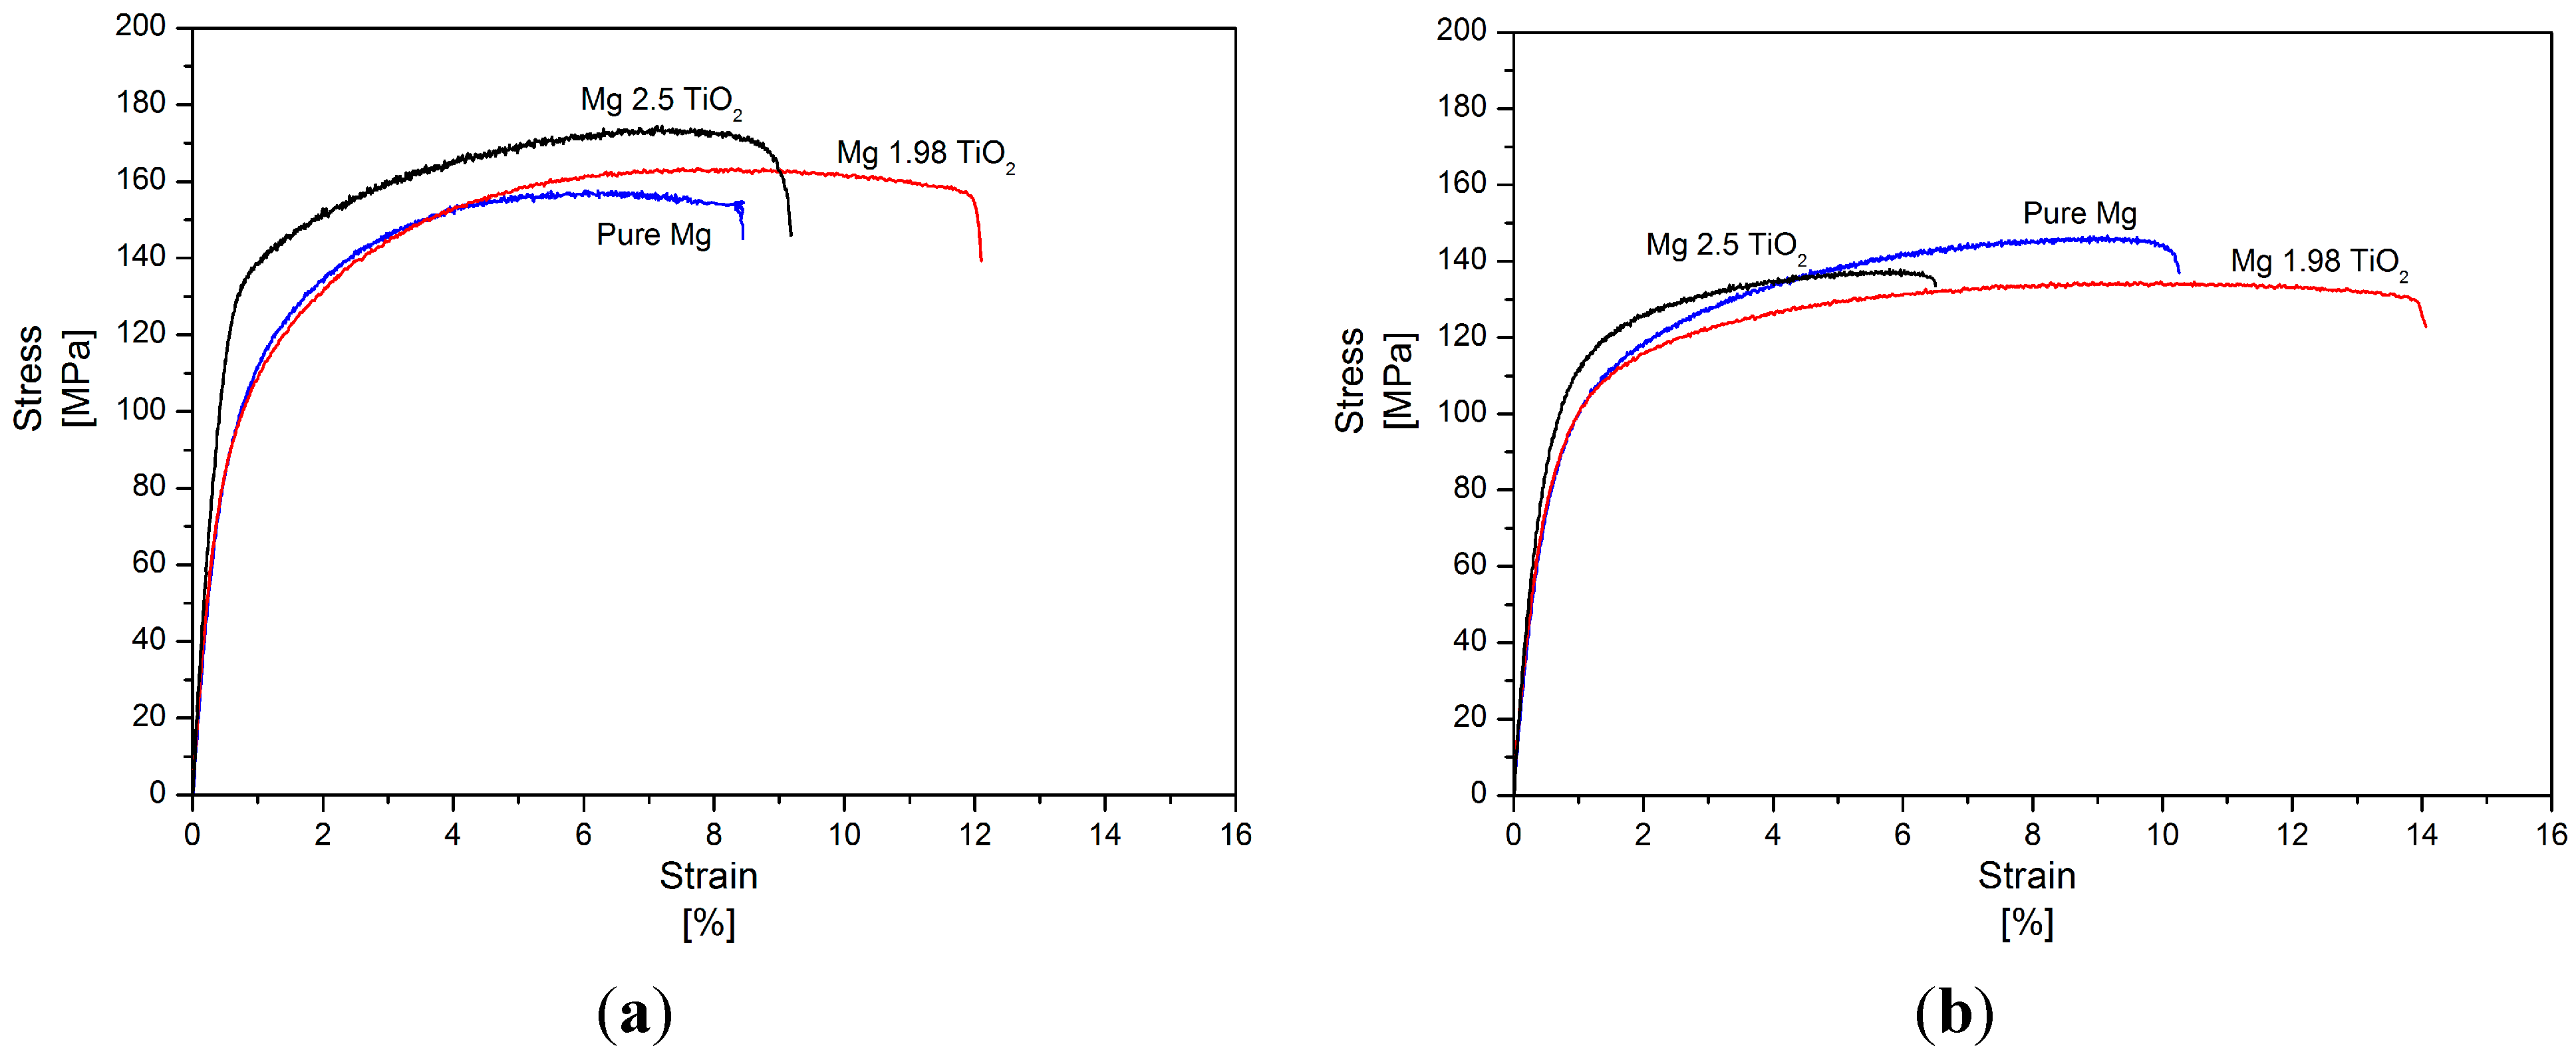
Among the synthesized Mg materials, DMD synthesized Mg 2.5 vol % TiO
2 nanocomposite exhibited the maximum 0.2% TYS of ~124 MPa which is ~37% greater than that of pure Mg. Whereas, in the case of PM synthesized Mg materials, the 0.2% TYS of pure Mg marginally increased with Mg 2.5 vol % TiO
2 exhibiting 0.2%TYS of ~91 MPa which is ~3% greater than that of pure Mg. The mechanisms contributing to the strength of the particulate reinforced metal matrix nanocomposites (MMNCs) (as discussed under
Section 1) and the effects of particulate size, amount of particulates added to the matrix and synthesis methodologies on the strengthening mechanisms are discussed for better understanding on the tensile behavior of the synthesized Mg-TiO
2 MMNCs.
Orowan Strengthening
Orowan strengthening is due to the resistance offered by the ultrafine particulates to the dislocation movement by formation of dislocation loops around the particulates. These dislocation loops possess high work hardening rates and thereby assist in strengthening of MMNCs. The strength improvement due to Orowan effect of particulate reinforcement within the Mg matrix is given by Orowan-Ashby equation as shown in Equation (1) [
25]:
where,
G is the shear modulus of Mg (17.3 GPa) [
32], b is the burgers vector of Mg (3.21 × 10
−10 m) [
33],
r and
dp are the average radius and diameter of NPs, respectively. The interparticulate spacing (λ) between the NPs within the Mg metal matrix is given by Equation (2) [
34,
35]:
where,
Vp is the volume fraction addition of TiO
2 NPs.
The design of Mg matrix composites based on the theoretical contribution of Orowan strengthening varying with (a) size of the reinforcements such as nano (10 to 100 nm), sub-micron (0.1 and 0.5 μm) and micron sized (1 μm) and (b) volume fraction of the reinforcement particulates and is shown in
Table 7. Considering the cost of the NPs and the effectiveness of the available synthesis methodologies to uniformly disperse the NPs within the Mg metal matrix, a critical threshold of 2.5 vol % is considered in the case of Mg MMNCs. From
Table 7, for a constant volume fraction, the contribution of Orowan strengthening decreases with the increase in the size of the particulates. For example, considering a constant volume fraction of 2.5 vol %, the Orowan strengthening contribution for particulate size of ~1 μm is almost negligible whereas strength as high as ~147 MPa is theoretically predicted for particulate size of 10 nm. In the case of Mg matrix microcomposites, maximum strength of ~65 MPa is predicted with particulate size and quantity of 0.5 μm, 40 vol %, respectively. However, presence of high volume fraction reinforcements significantly contributes to the density of the Mg materials which pose a major limitation especially targeting towards synthesizing light-weight materials.
For activation of Orowan strengthening, synthesis methodologies play a vital role in controlling the interparticulate spacing for avoiding clustering of particulate reinforcements within the metal matrix.
Table 7 shows the theoretically predicted interparticulate spacing for varying the particulate size and quantity of reinforcements. Interparticulate spacing between the particulates was found to decrease with increasing volume fraction and decreasing particulate size. It is difficult to control the interparticulate spacing in the case of 40 vol % reinforced Mg microcomposite as well as 2.5 vol % reinforced Mg MMNCs which are ~3.86 × 10
−8 m and ~1.78 × 10
−8 m (
Table 7) for 0.5 μm and 10 nm sized particulates, respectively.
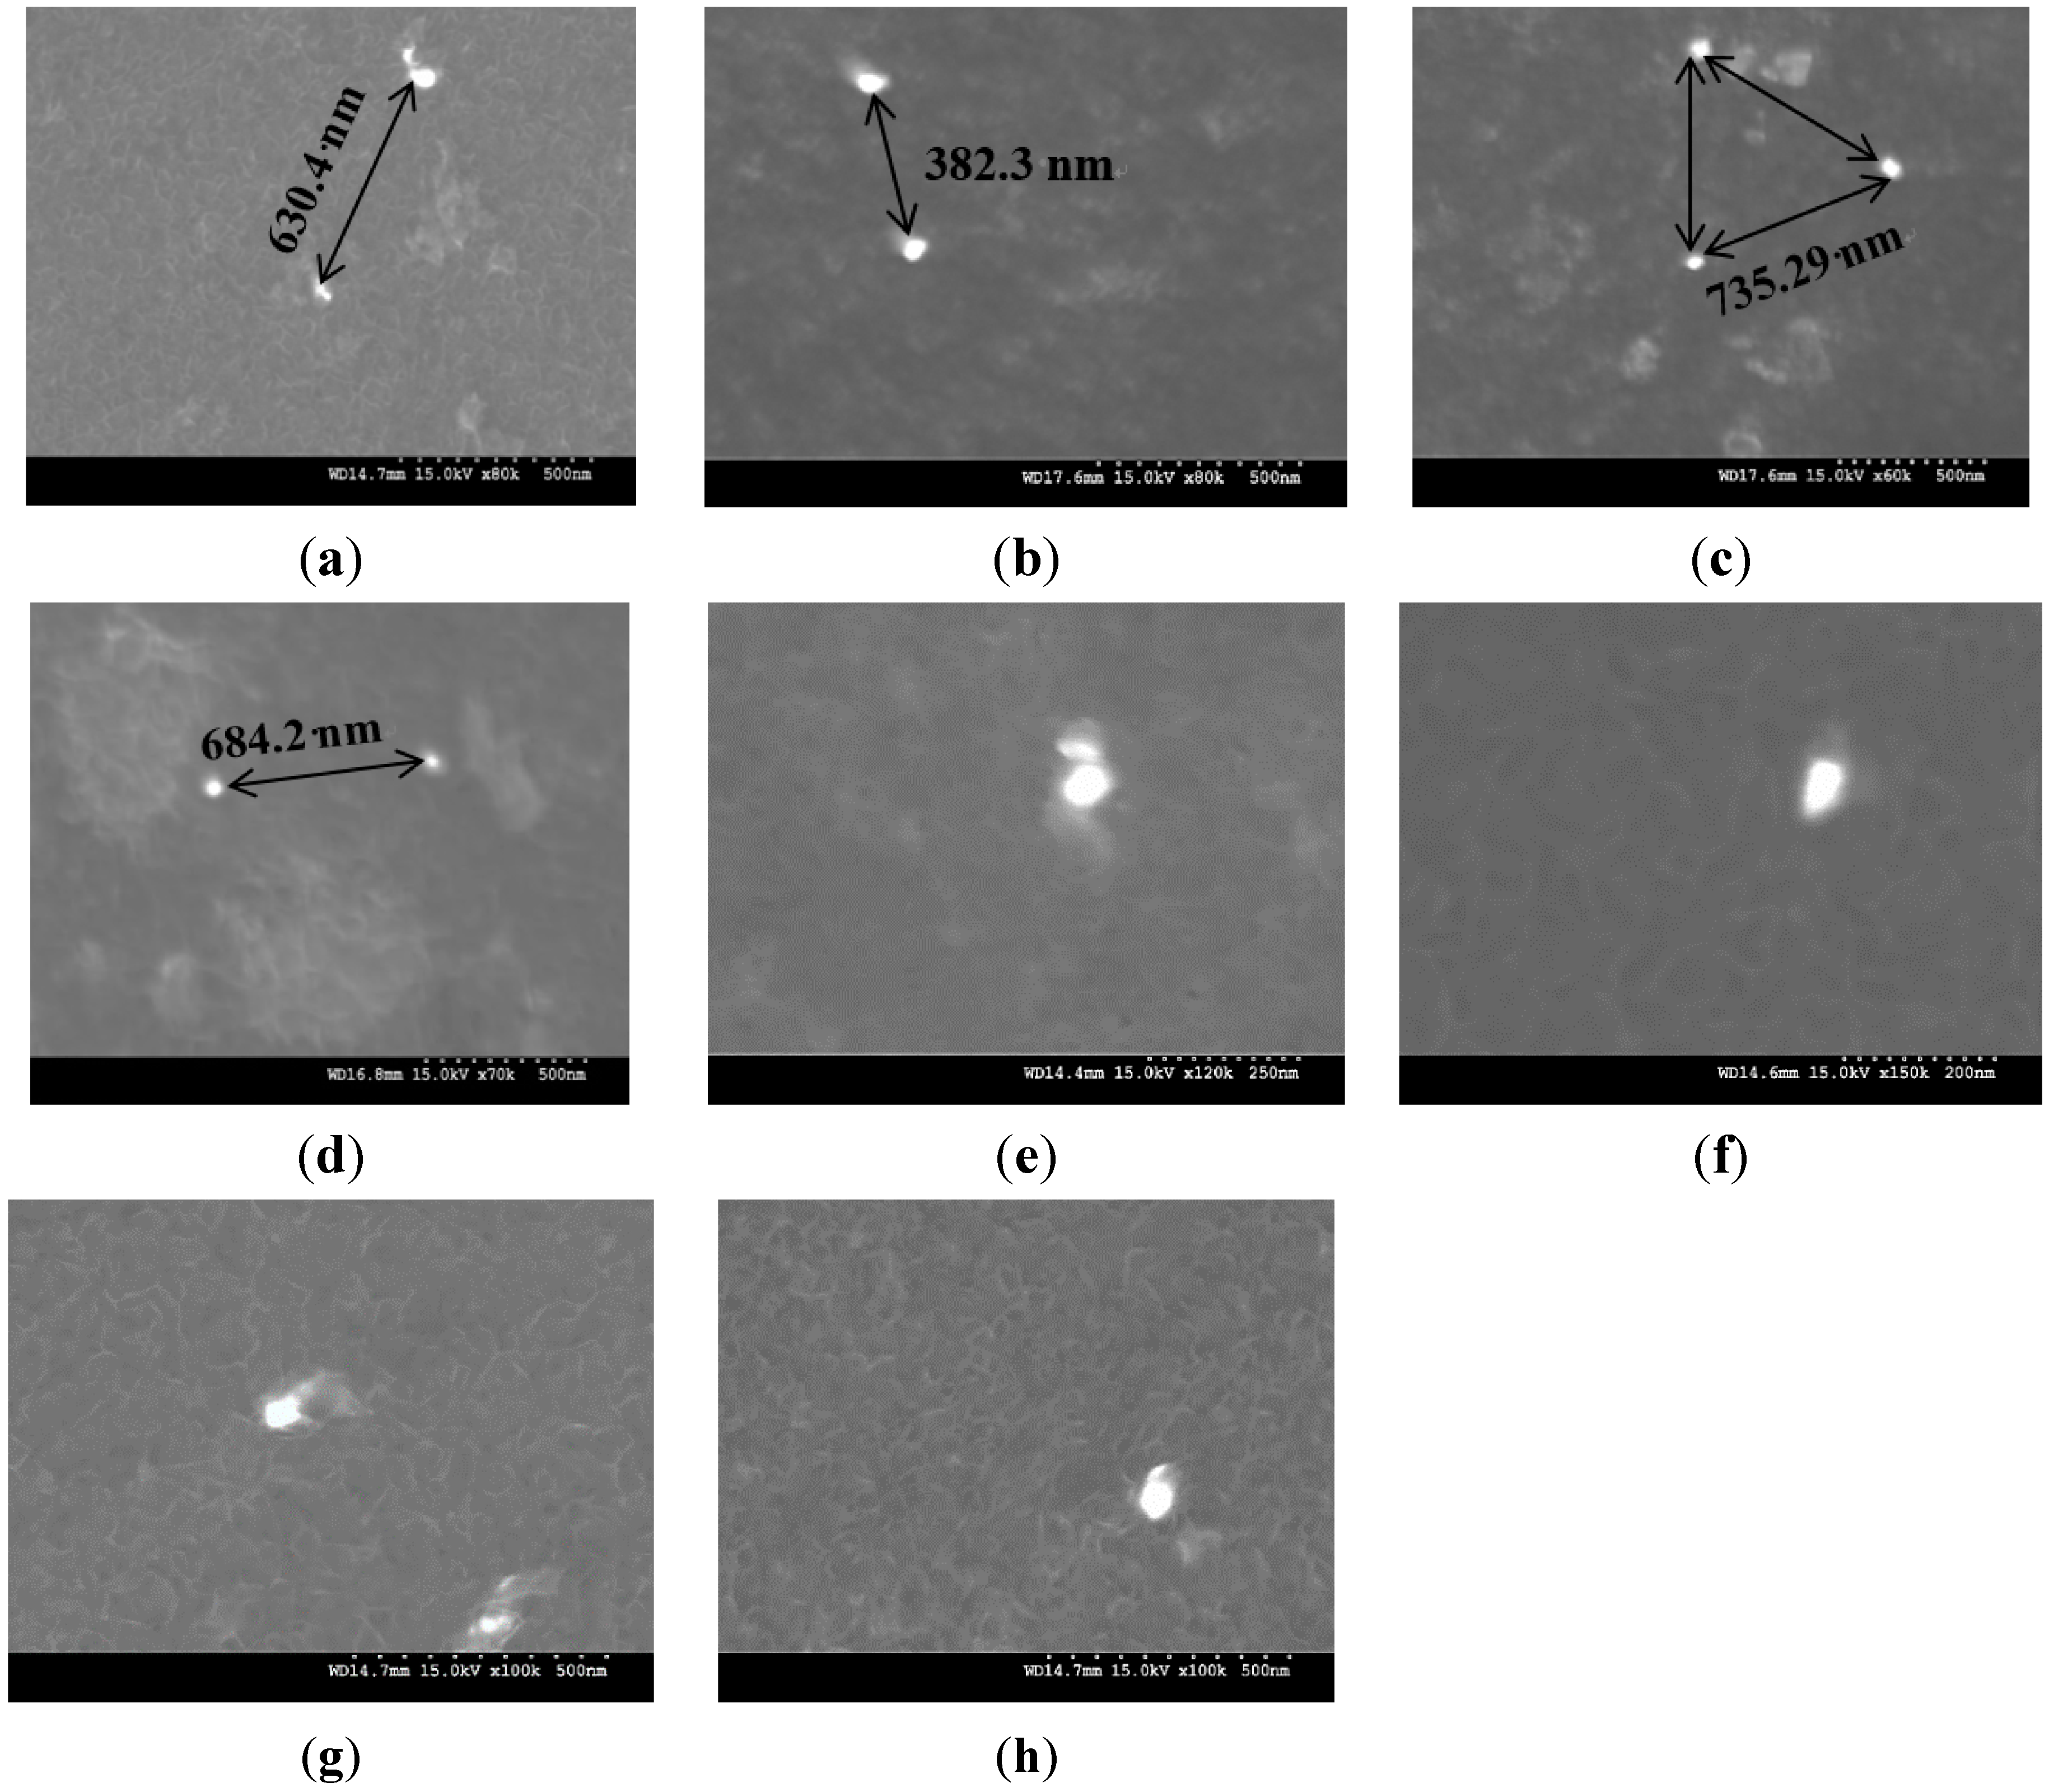
Table 4 shows the theoretically predicted and experimentally observed interparticulate spacing of TiO
2 NPs within the synthesized Mg-TiO
2 nanocomposites. It is observed that by utilizing the adopted synthesis techniques (DMD and PM), the interparticulate spacing observed through microstructural characterization of the nanocomposites is not sufficient to contribute to the Orowan strengthening.
Forest Strengthening
The strengthening contribution due to forest strengthening (σ
CTE) or mismatch between the CTE values of reinforcement particulates and Mg matrix leads to generation of dislocations nearby the particulates and thereby contributes to the increase in dislocation density and strength of the composite. The presence of high dislocation density near the interface between the matrix and reinforcement particulates generated due to CTE mismatch has been experimentally observed [
37,
38]. Forest strengthening effect generated due to CTE mismatch can be described by the following Equations (6) and (7):
where
A is a constant characterizing the transparency of dislocation forest for basal-basal interaction in Mg (0.2) [
33], ρ
th is the dislocation density, Δα is the difference in the CTE values between the matrix (Pure Mg) and reinforcement, Δ
T is the temperature excursion which is chosen to be 250 K (for all the nanocomposites) assuming that the dislocation generation begins at 550 K corresponding to a stress-free homologous temperature of 0.6 [
33]. From Equations (6) and (7), theoretically, the forest strengthening contribution (σ
CTE) value is found to increase with the addition of ultrafine reinforcements of higher volume fraction. Experimentally, Vogt
et al. [
39] observed that when compared to microcomposites, forest strengthening was found negligible in the case of MMNCs synthesized by PM process by plotting the true stress-strain curves of MMNCs specimens under various heat treatment and quenching conditions. It is found to be low for particulate size less than 80 nm due to the limitations of synthesis methodologies to uniformly disperse ultrafine NPs [
40]. Further, Chawla
et al. [
41,
42] reported that forest strengthening can be realized only with higher volume fraction addition (greater than 10 vol %). In the present study, the contribution of forest strengthening, theoretically calculated by utilizing Equations (6) and (7), on the TYS of pure Mg was found to be ~115 MPa and ~130 MPa for Mg (1.98 and 2.5) vol % TiO
2 nanocomposites, respectively.
Taylor Strengthening
The strengthening contribution due to Taylor strengthening (σ
EM) or mismatch between the elastic modulus values of the reinforcement particulates and the metal matrix leading to the formation of geometrically necessary dislocations (GND) due to straining or presence of external load is given by Equations (8) and (9) [
43]:
where α is a constant (0.5), ρ
EM is density of dislocations due to modulus mismatch and ξ is uniform deformation or strain. Theoretically, the strengthening contribution due to Taylor strengthening is found to increase with the presence of ultrafine particulates of larger volume fraction. During extrusion, it is observed that dislocations produced by work hardening effects accumulate in the coarse grain regions (on the order of 1000 μm) and density of dislocation in fine grained regions is insignificant [
44,
45]. Further, in the case of Mg MMNCs, when compared to the contributions of other strengthening mechanisms, Taylor strengthening is considered negligible.
For theoretically predicting the tensile yield strength (TYS) of the MMNCs, several models such as: (1) summation of strengthening [
46], (2) Zhang and Chen model [
47,
48], and (3) modified Clyne models [
20,
43] have been utilized. In the summation of strengthening contributions model, the individual contributions of the strengthening mechanisms are simply added along with the TYS of the Mg matrix to get the overall strength of the composite assuming that each strengthening mechanism behaves independently [
43]. Summation of strengthening contributions (σ
summation) model is given by Equation (10):
Modified Clyne model was developed by Sanatay-Zadeh [
43]. In this model, the root of sum of squares of contributions of different strengthening mechanisms is calculated and finally added to 0.2% TYS (σ
Mg). The modified Clyne (σ
modified Clyne) model is given by the following Equations (11) and (12):
Table 7.
Designing of Mg composites based on contribution of Orowan strengthening calculated by using Orowan- Ashby equation [
25].
Table 7.
Designing of Mg composites based on contribution of Orowan strengthening calculated by using Orowan- Ashby equation [25].
| Volume Fraction (in %) | Orowan Stress σorowan (in MPa) and Interparticulate Spacing λ (in m) | Reinforcement Particulate Size |
|---|
| In (nm) | In (μm) |
|---|
| 10 | 20 | 21 * | 25 | 30 | 40 | 50 | 60 | 70 | 75 | 80 | 90 | 100 | 0.5 | 0.75 | 1 |
|---|
| 0.58 | σorowan | 73.66 | 36.83 | 35.08 | 29.46 | 24.55 | 18.41 | 14.73 | 12.27 | 10.52 | 9.82 | 9.20 | 8.18 | 7.36 | 1.47 | 1.00 | 0.74 |
| λ (× 10−8) | 3.41 | 6.83 | 7.17 | 8.54 | 10.3 | 33.7 | 17.0 | 20.5 | 23.9 | 25.6 | 27.3 | 30.8 | 31.4 | 170 | 256 | 341 |
| 0.97 | σorowan | 92.50 | 46.25 | 44.05 | 37.00 | 30.83 | 23.12 | 18.50 | 15.41 | 13.21 | 12.33 | 11.56 | 10.27 | 9.25 | 1.85 | 1.23 | 0.92 |
| λ (× 10−8) | 2.72 | 5.44 | 5.71 | 6.80 | 8.16 | 10.8 | 13.6 | 16.3 | 19.0 | 20.4 | 21.8 | 24.4 | 27.2 | 136 | 204 | 272 |
| 1.50 | σorowan | 113.50 | 56.74 | 54.04 | 45.39 | 37.83 | 28.37 | 22.69 | 18.91 | 16.21 | 15.13 | 14.18 | 12.61 | 11.34 | 2.26 | 1.51 | 1.13 |
| λ (× 10−8) | 2.21 | 4.43 | 4.65 | 5.54 | 6.65 | 8.87 | 11.0 | 13.3 | 15.5 | 16.6 | 17.7 | 19.9 | 22.1 | 110 | 166 | 221 |
| 1.98 | σorowan | 130.19 | 65.09 | 62.00 | 52.07 | 43.39 | 32.54 | 26.03 | 21.69 | 18.59 | 17.35 | 16.27 | 14.46 | 13.01 | 2.60 | 1.73 | 1.30 |
| λ (× 10−8) | 1.93 | 3.87 | 4.06 | 4.83 | 5.80 | 7.73 | 9.66 | 11.6 | 13.5 | 14.5 | 15.4 | 17.4 | 19.3 | 96.6 | 145 | 193 |
| 2.50 | σorowan | 146.85 | 73.42 | 69.93 | 58.74 | 48.95 | 36.71 | 29.37 | 24.48 | 20.97 | 19.58 | 18.35 | 16.31 | 14.69 | 2.93 | 2.00 | 1.46 |
| λ (× 10−8) | 1.71 | 3.42 | 3.60 | 4.28 | 5.14 | 6.85 | 8.57 | 10.2 | 12.0 | 12.8 | 13.7 | 15.4 | 17.1 | 85.7 | 128 | 171 |
| 10.00 | σorowan | Not Applicable | 7.09 | 4.72 | 3.54 |
| λ (× 10−8) | 35.4 | 53.2 | 71.0 |
| 20.00 | σorowan | 14.09 | 9.39 | 7.04 |
| λ (× 10−8) | 17.8 | 26.7 | 35.7 |
| 30.00 | σorowan | 27.12 | 18.08 | 13.56 |
| λ (× 10−8) | 9.28 | 1.39 | 18.5 |
| 40.00 | σorowan | 65.21 | 43.47 | 32.60 |
| λ (× 10−8) | 3.86 | 5.79 | 7.72 |
Zhang and Chen [
34] derived an empirical model for predicting the TYS of Mg MMNCs by studying the effects of volume fraction and size of alumina NPs without considering the contribution of Hall-Petch strengthening. Zhang and Chen σ
ZC model is given by the following Equation (13):
In the present study, pure Mg is reinforced with (1.98 and 2.5) vol % TiO
2 with TiO
2 particulates of size ~21 nm. The contributions of σ
LT and σ
EM are considered insignificant or negligible. Further, σ
summation and σ
modified Clyne are calculated for DMD and PM synthesized Mg-TiO
2 nanocomposites with and without considering the contribution of Forest strengthening (σ
CTE). Theoretically, the individual contributions of Orowan (σ
Orowan), Hall-Petch (σ
Hall-Petch) and Forest strengthening (σ
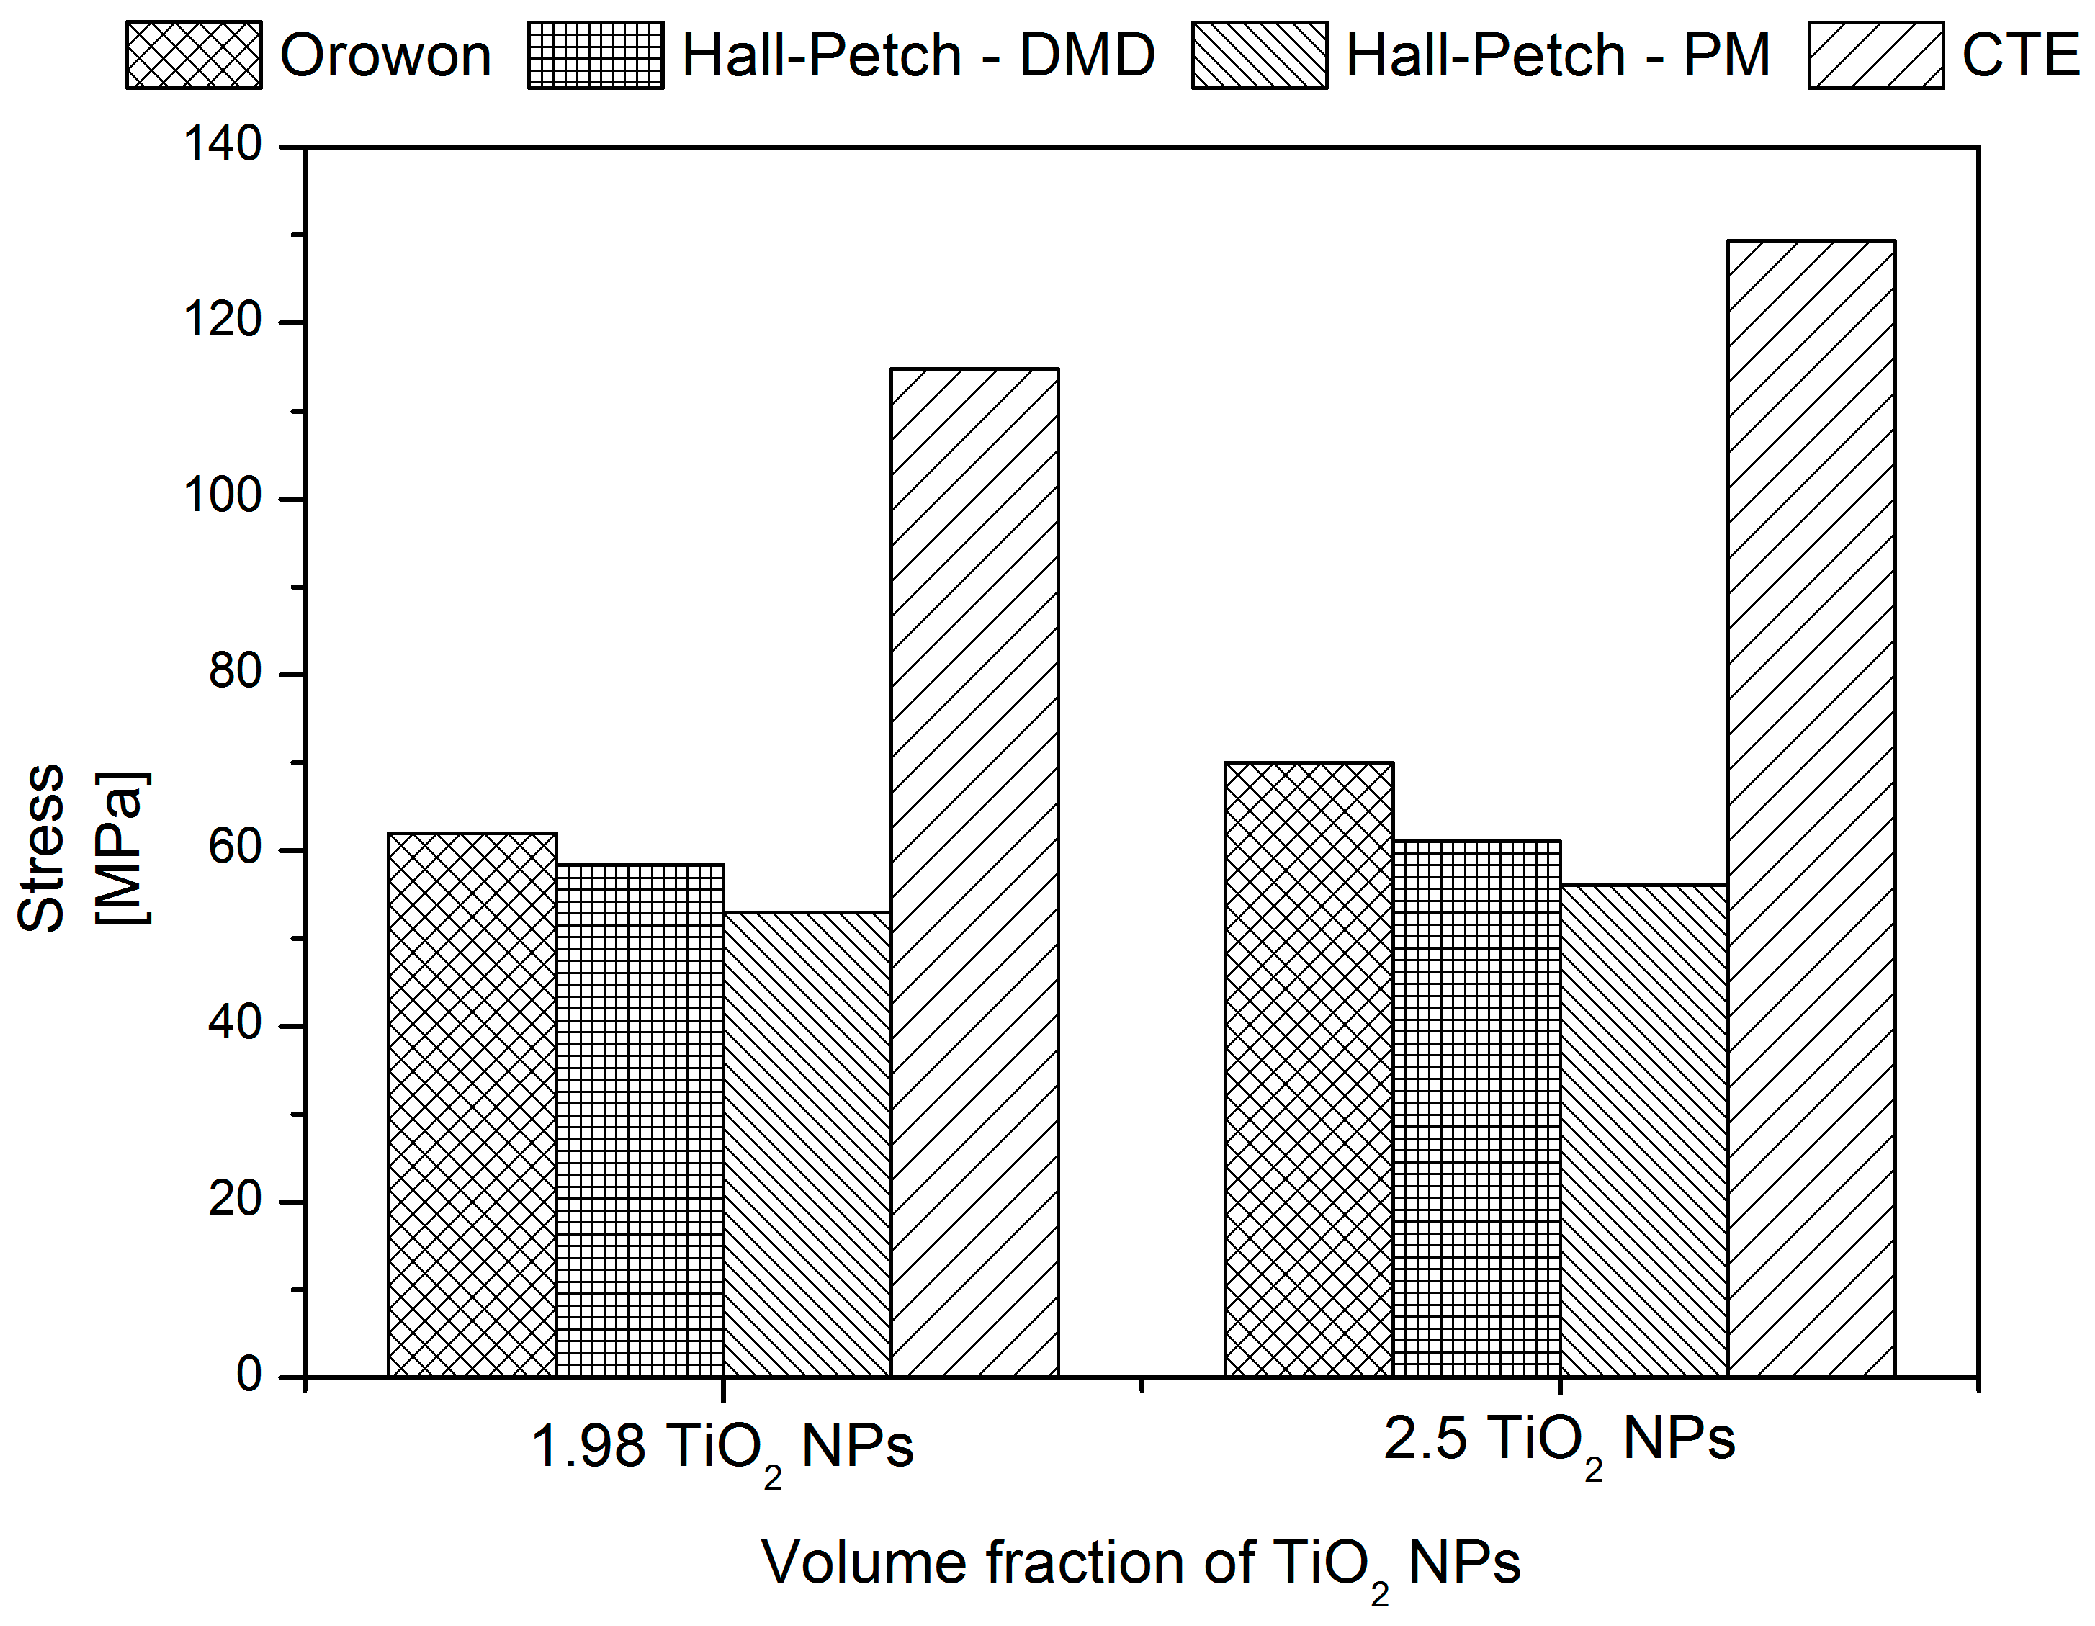
CTE) are calculated using the Equations (1) to (7) and are shown in
Figure 6 and
Table 8. Among the strengthening mechanisms theoretically calculated for Mg-TiO
2 nanocomposites, the contribution of Forest strengthening (σ
CTE) is found to be the maximum with ~115 MPa and ~130 MPa for Mg (1.98 and 2.5) vol % TiO
2 NPs, respectively. From microstructural characterization, the contribution of Orowan strengthening calculated by using the observed λ values for both DMD and PM processed nanocomposites indicate that the strengthening is almost negligible. Owing to the insignificance of Orowan strengthening, both the summation of strengthening and modified Clyne models reduce to the below Equation (14) which indicates that the TYS of Mg-TiO
2 MMNCs predominantly depends only on the σ
Hall-Petch:
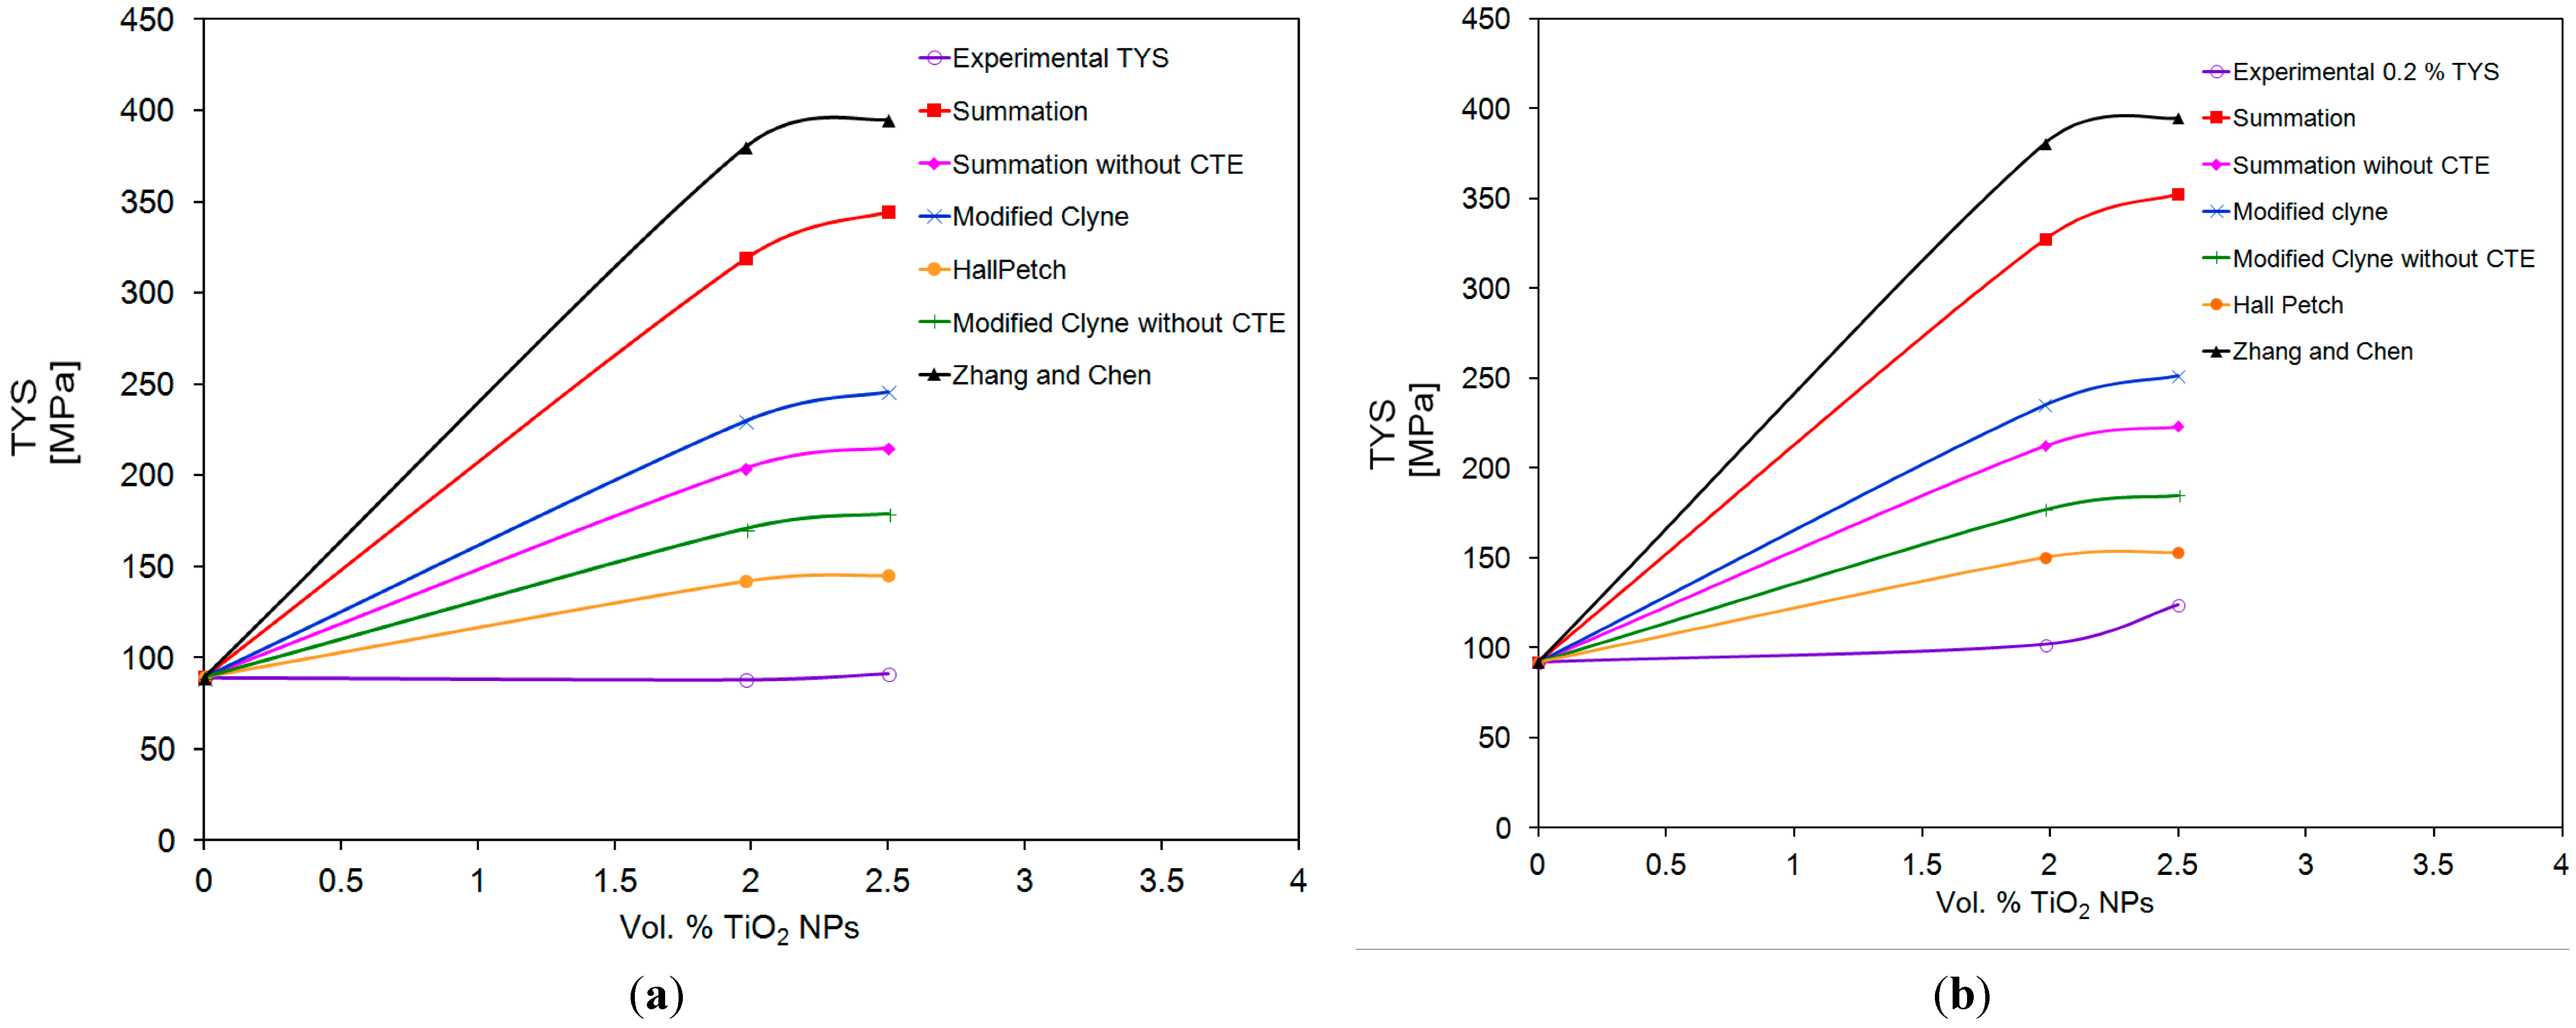
The theoretical TYS values of the DMD and PM synthesized Mg-TiO
2 nanocomposites computed utilizing the existing mathematical models in the literature (Equations (10) to (13)) and Hall Petch model (Equation 14) are compared with the experimentally observed 0.2% TYS values of Mg (1.98 and 2.5) vol % TiO
2 nanocomposites, respectively and is shown in
Figure 7 and
Table 8. The experimental 0.2% TYS values are found to be in close agreement with the predicted TYS considering only Hall-Petch strengthening Equations (14).
Figure 6.
Individual contribution of strengthening mechanisms on the TYS of DMD and PM synthesized Mg/TiO2 nanocomposites.
Figure 6.
Individual contribution of strengthening mechanisms on the TYS of DMD and PM synthesized Mg/TiO2 nanocomposites.
Figure 7.
Experimental and Predicted TYS values of DMD and PM synthesized Mg/TiO2 nanocomposites.
Figure 7.
Experimental and Predicted TYS values of DMD and PM synthesized Mg/TiO2 nanocomposites.
Table 8.
Contribution of different strengthening mechanisms and predicted values of tensile yield strength of DMD and PM synthesized Mg/TiO2 nanocomposites using analytical models.
Table 8.
Contribution of different strengthening mechanisms and predicted values of tensile yield strength of DMD and PM synthesized Mg/TiO2 nanocomposites using analytical models.
| Material | Synthesis | 0.2% TYS Experimental (MPa) | σOrowan (MPa) | σHall-Petch (MPa) | σCTE (MPa) | σSummation (MPa) | σModified Clyne (MPa) | σZC (MPa) | σMg + σHall-Petch (MPa) |
|---|
| With σCTE | Without σCTE | With σCTE | Without σCTE |
|---|
| Pure Mg | DMD | 92 ± 5 | – | – | – | – | – | – | – | – | – |
| PM | 89 ± 4.5 |
| Mg 1.98 TiO2 | DMD | 102 ± 3 | 62 | 58.3 | 114.82 | 327.1 | 212.2 | 234.9 | 177.0 | 349.61 | 150.3 |
| PM | 88 ± 10 | 52.9 | 318.7 | 203.88 | 230.0 | 170.5 | 380.041 | 142.0 |
| Mg 2.5 TiO2 | DMD | 124 ± 8.8 | 70 | 61.1 | 129.36 | 352.4 | 223.04 | 251.2 | 185.0 | 394.65 | 153.1 |
| PM | 91.1 ± 5 | 56.0 | 344.3 | 215.00 | 246.4 | 178.6 | 394.98 | 145.0 |
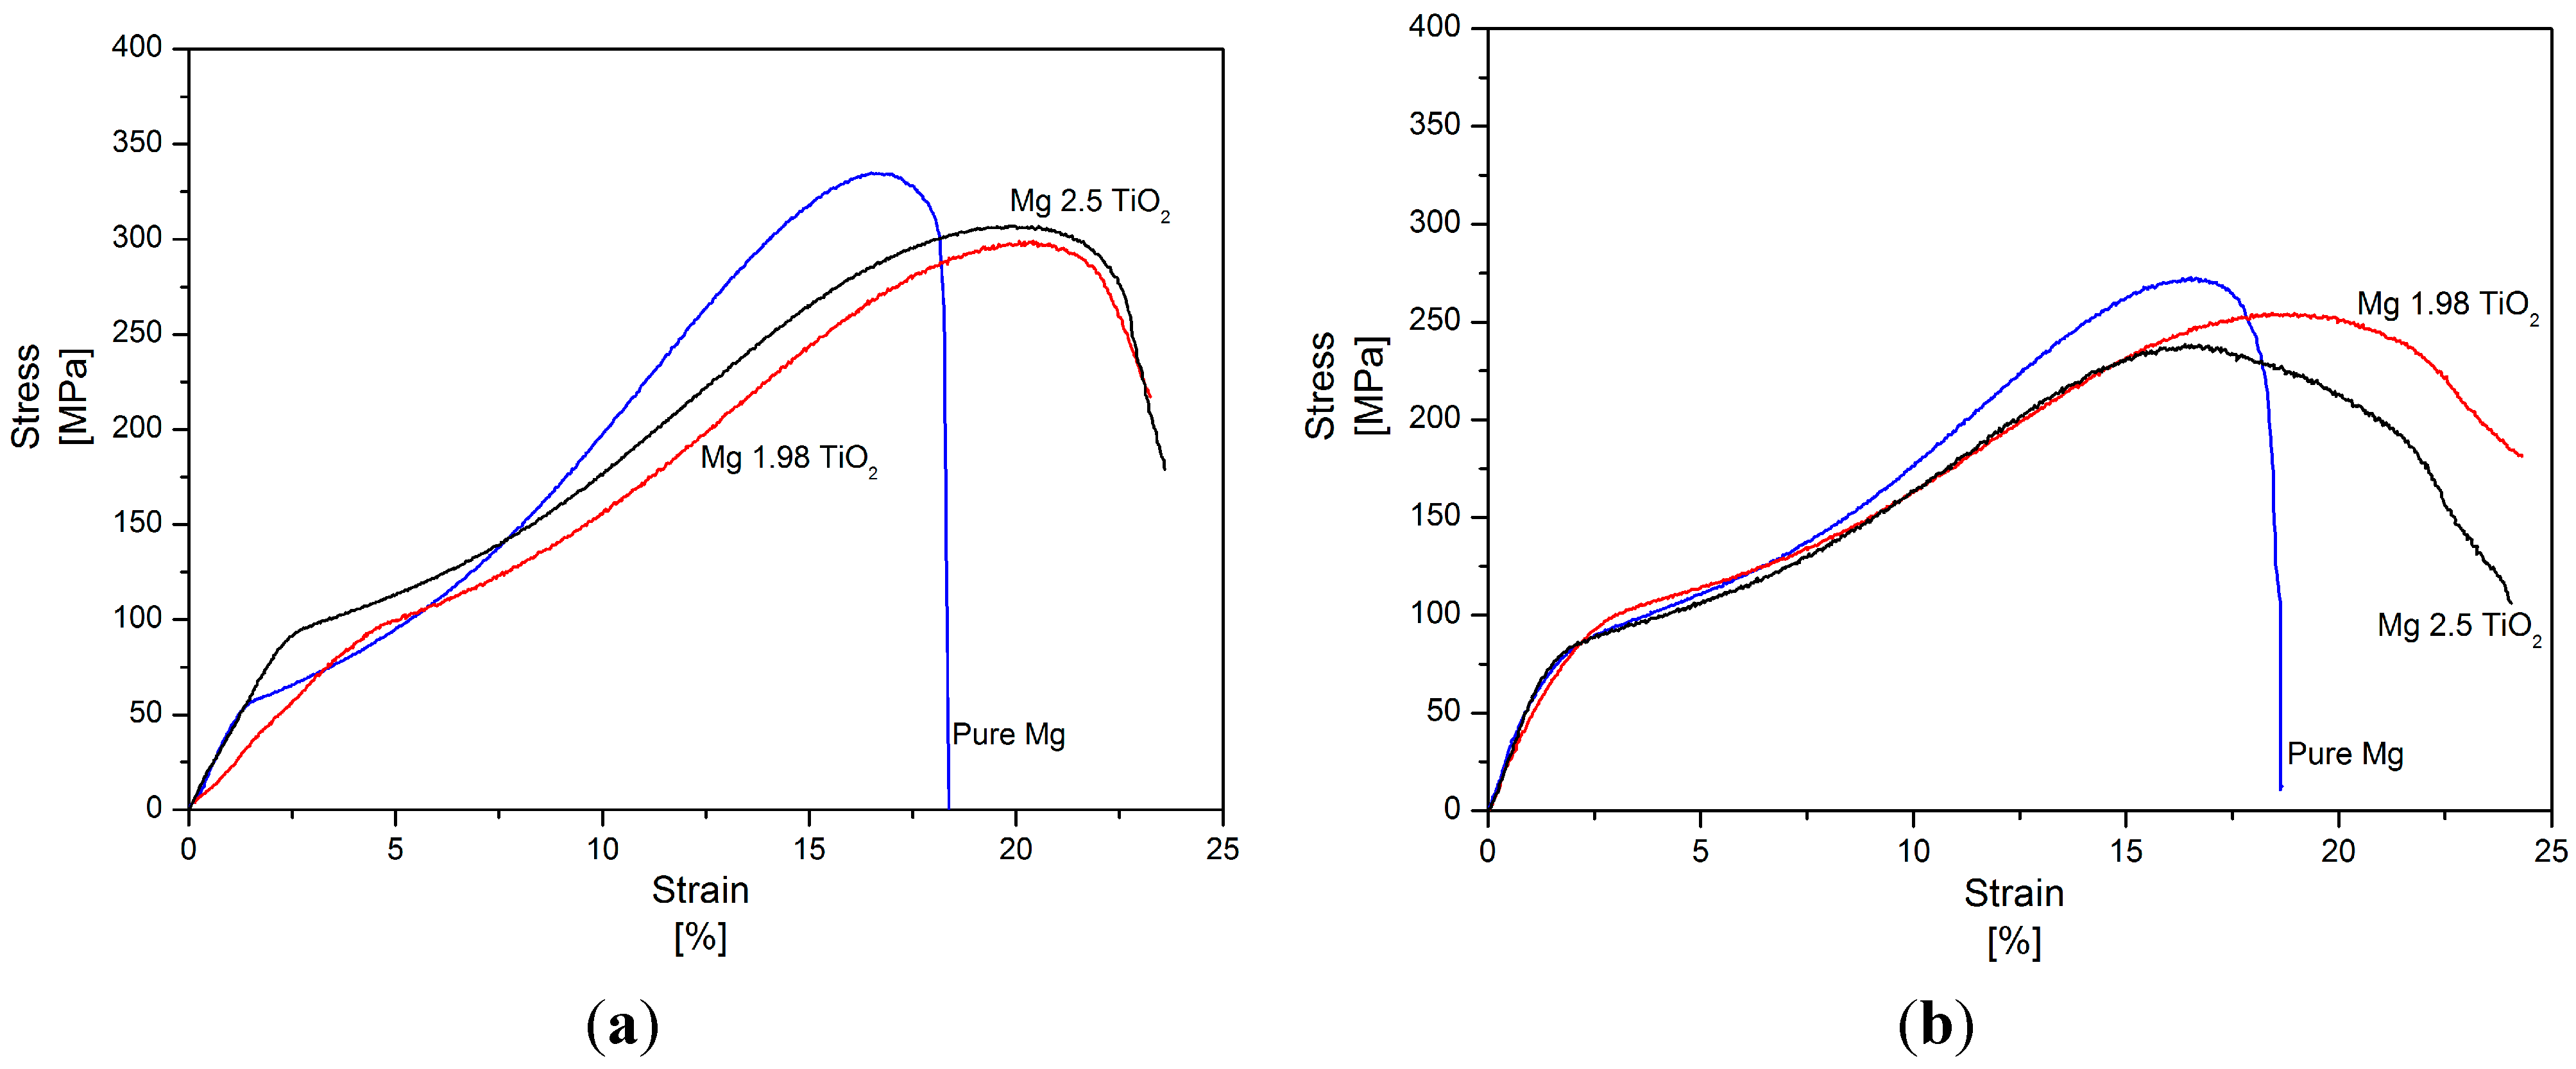
Limited increase in the 0.2% TYS of pure Mg (particularly with 1.98 vol % TiO
2) and changes in its tensile fracture strain with the addition of TiO
2 NPs is due to: (a) induced textural changes of pure Mg due to the presence of NPs (
Table 2 and
Figure 1) [
20,
21,
24,
49] and (b) distribution or agglomeration of TiO
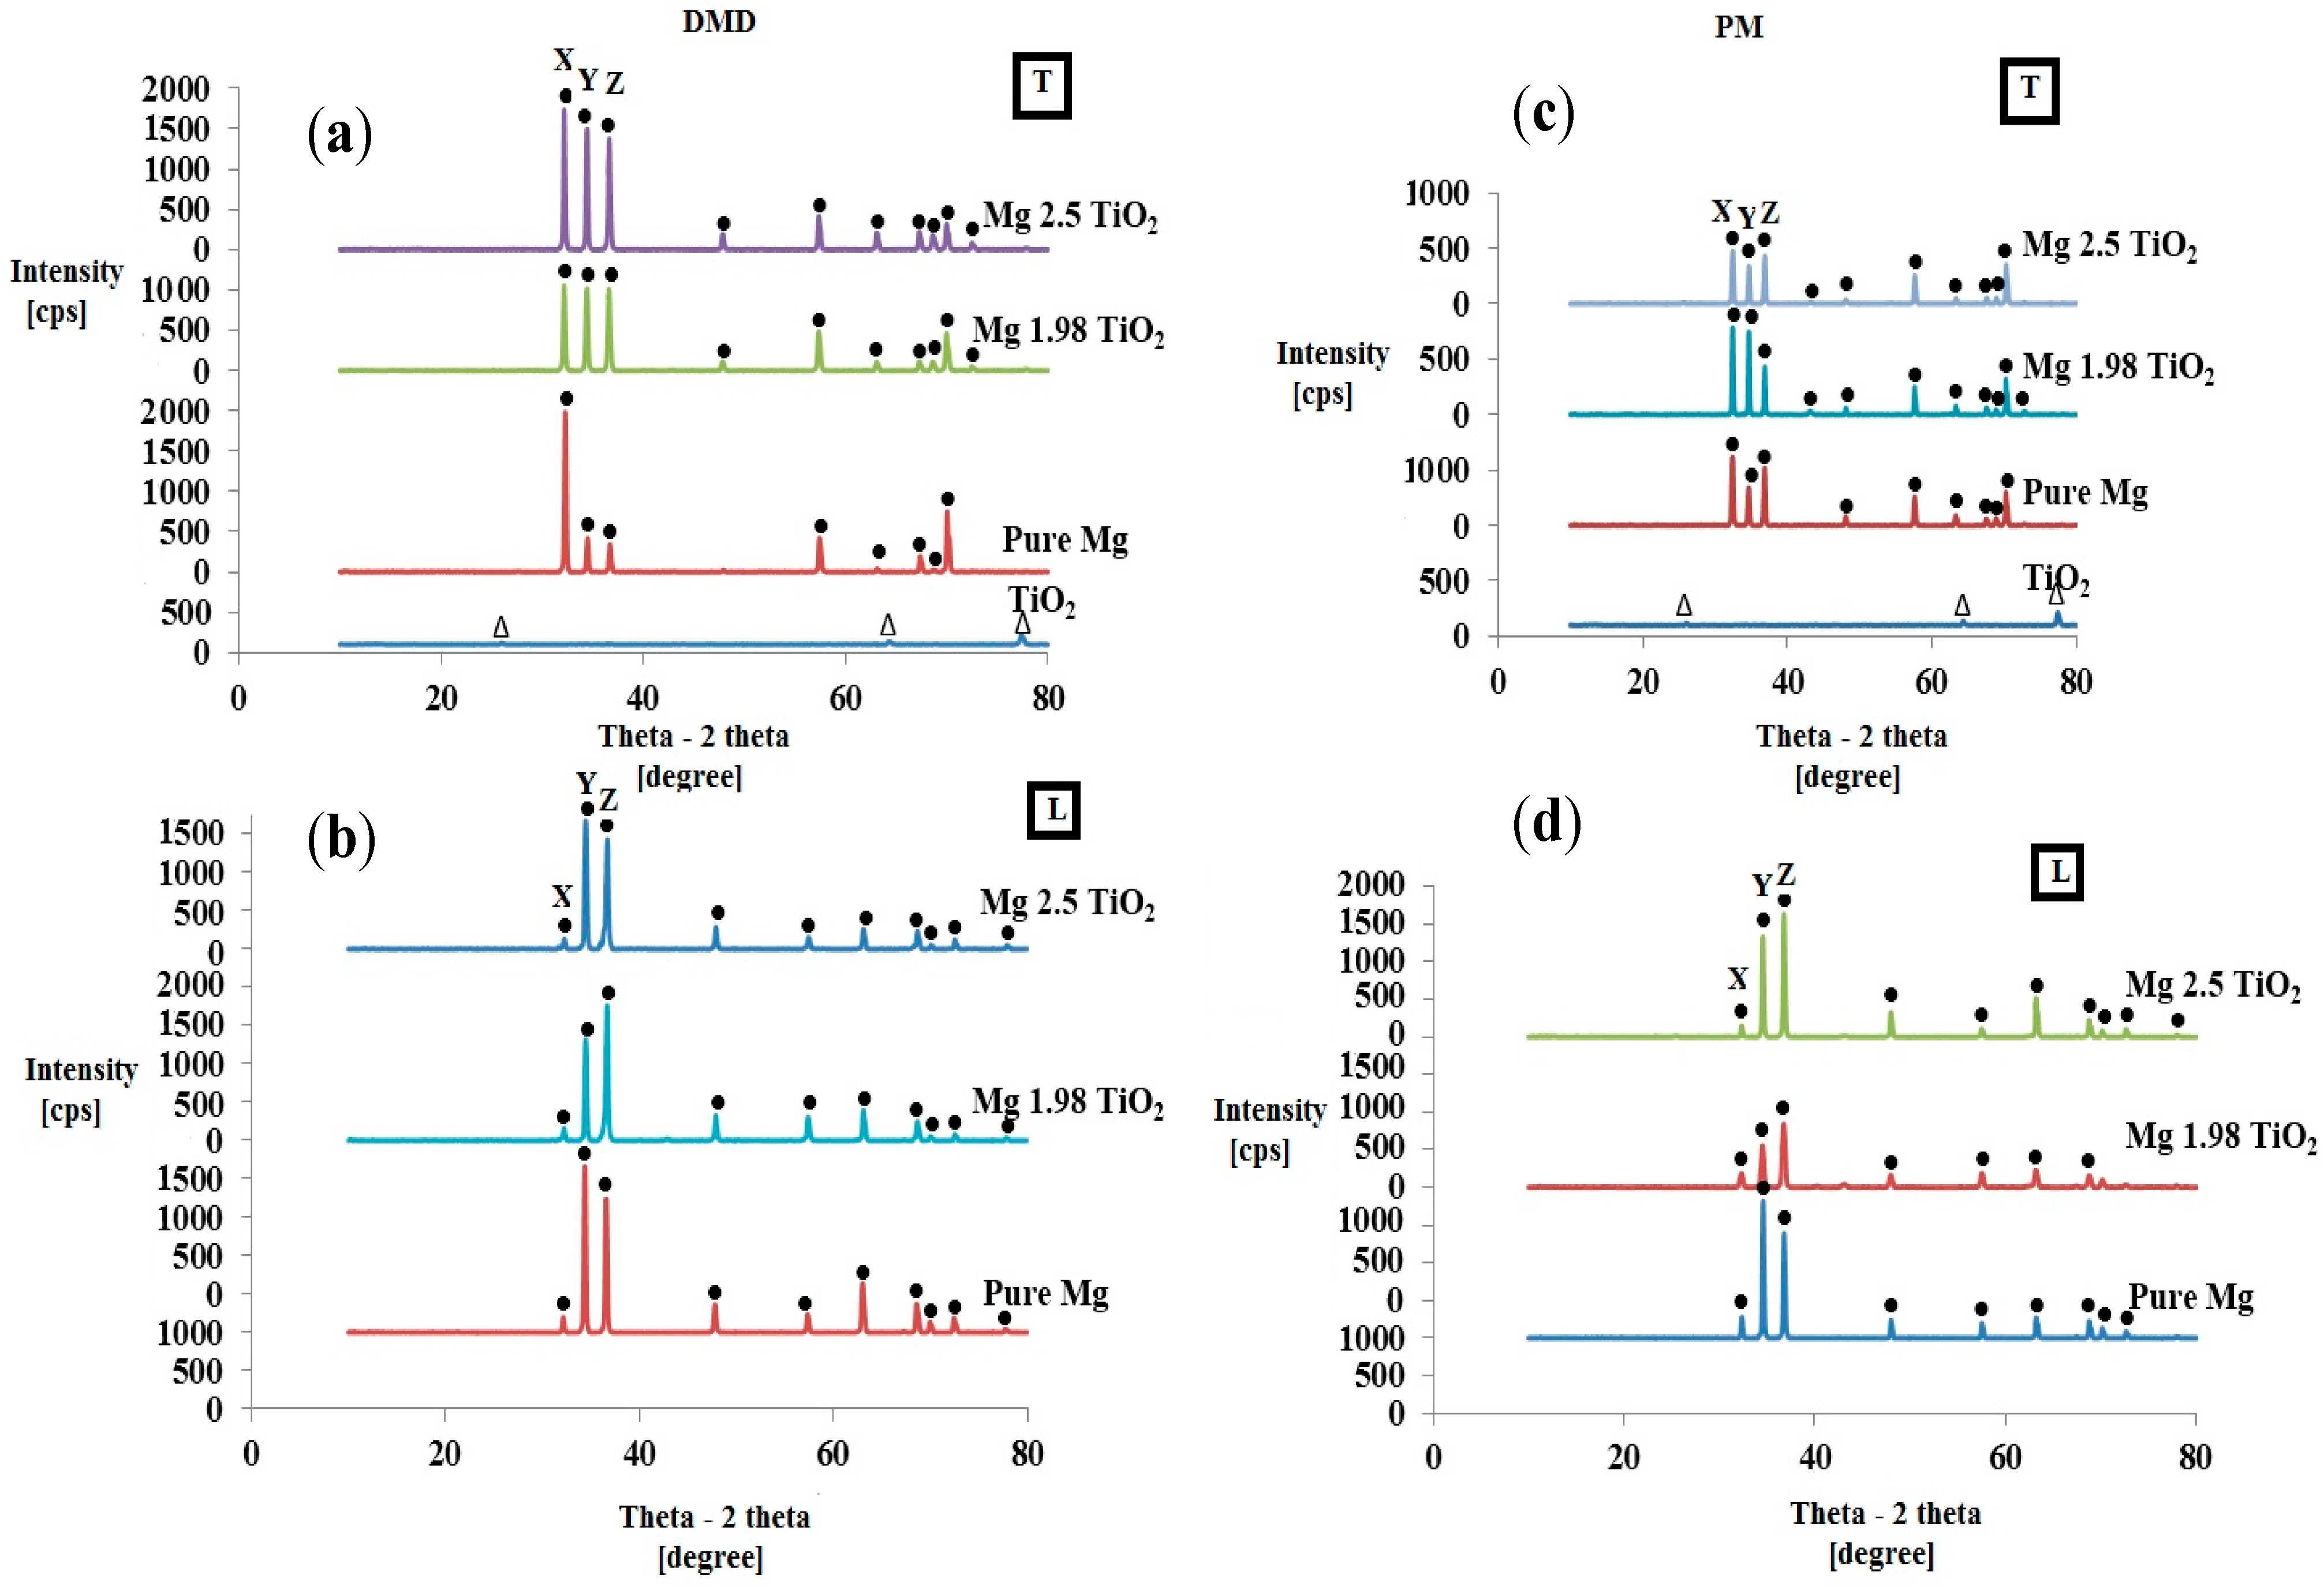
2 NPs within the Mg matrix. From the XRD studies (
Table 2), the ratio of
Ibasal/
Imax value measured along longitudinal sections of DMD and PM synthesized Mg 1.98 vol % TiO
2 nanocomposite samples are ~0.751 and ~0.655, respectively. The decrease in the basal plane intensity of pure Mg indicates non-basal cross-slip activation in PM synthesized pure Mg due to the presence of 1.98 vol % TiO
2 NPs which is evident from its maximum tensile fracture strain value of ~14.5% when compared to that of DMD synthesized Mg 1.98 vol % TiO
2 nanocomposite (~11.5%). Relatively lower tensile fracture strain in DMD synthesized Mg 2.5 vol % TiO
2 nanocomposite is due to the dominance of basal texture with increase in the ratio of
I/
Imax corresponding to the basal plane intensity (
I/
Imax = 1) measured along its longitudinal section. Significant decrease in the tensile fracture strain of PM synthesized Mg 2.5 vol % TiO
2 nanocomposite is due to the combined effect of (a) visible agglomeration sites of TiO
2 NPs within Mg matrix and (b) increase in the ratio of (
Ibasal/
Imax) measured along the longitudinal sections to 0.844. The mathematical models available in the literature over predict the TYS of Mg MNNCs. For effective design of Mg MMNCs, texture effects and effectiveness of synthesis methodologies to disperse the NPs within the Mg metal matrix through careful microstructural investigation may have to be considered for more realistic prediction of TYS. The mode of fracture under tensile loading of DMD synthesized pure Mg and Mg-TiO
2 nanocomposites with representative fractographs are discussed already [
24]. For all the DMD synthesized pure Mg and nanocomposite samples, typical cleavage mode of fracture was observed [
24].
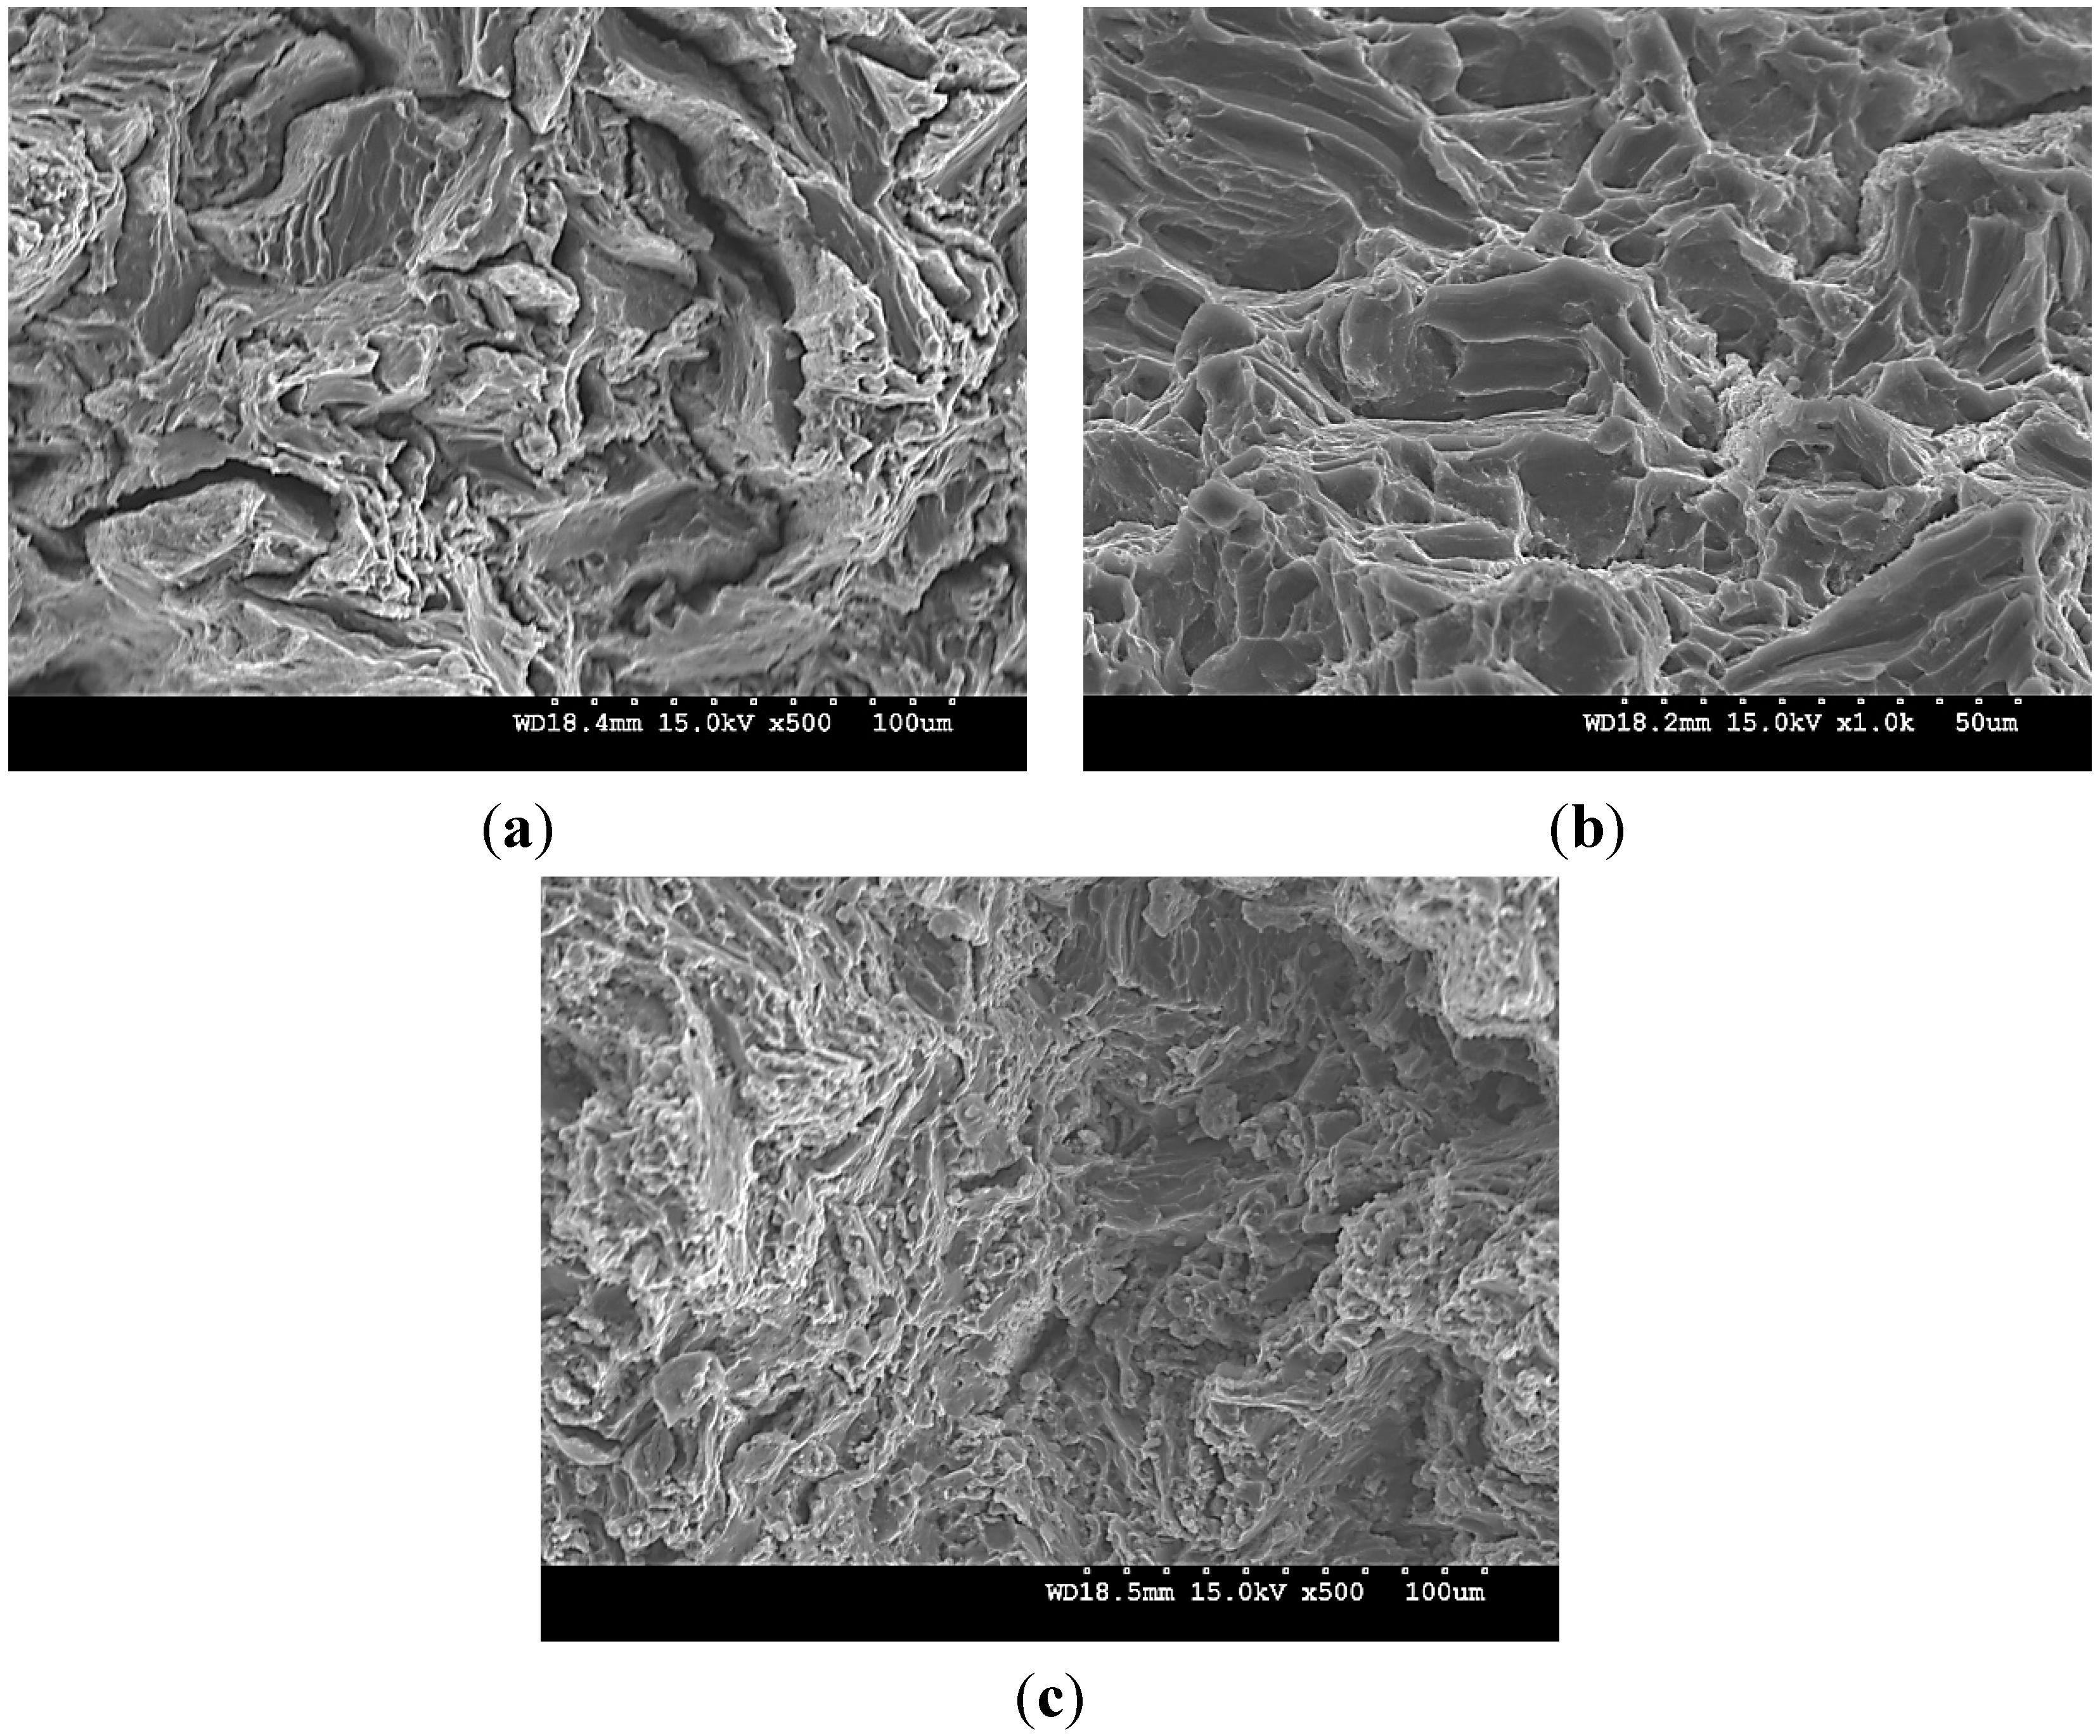
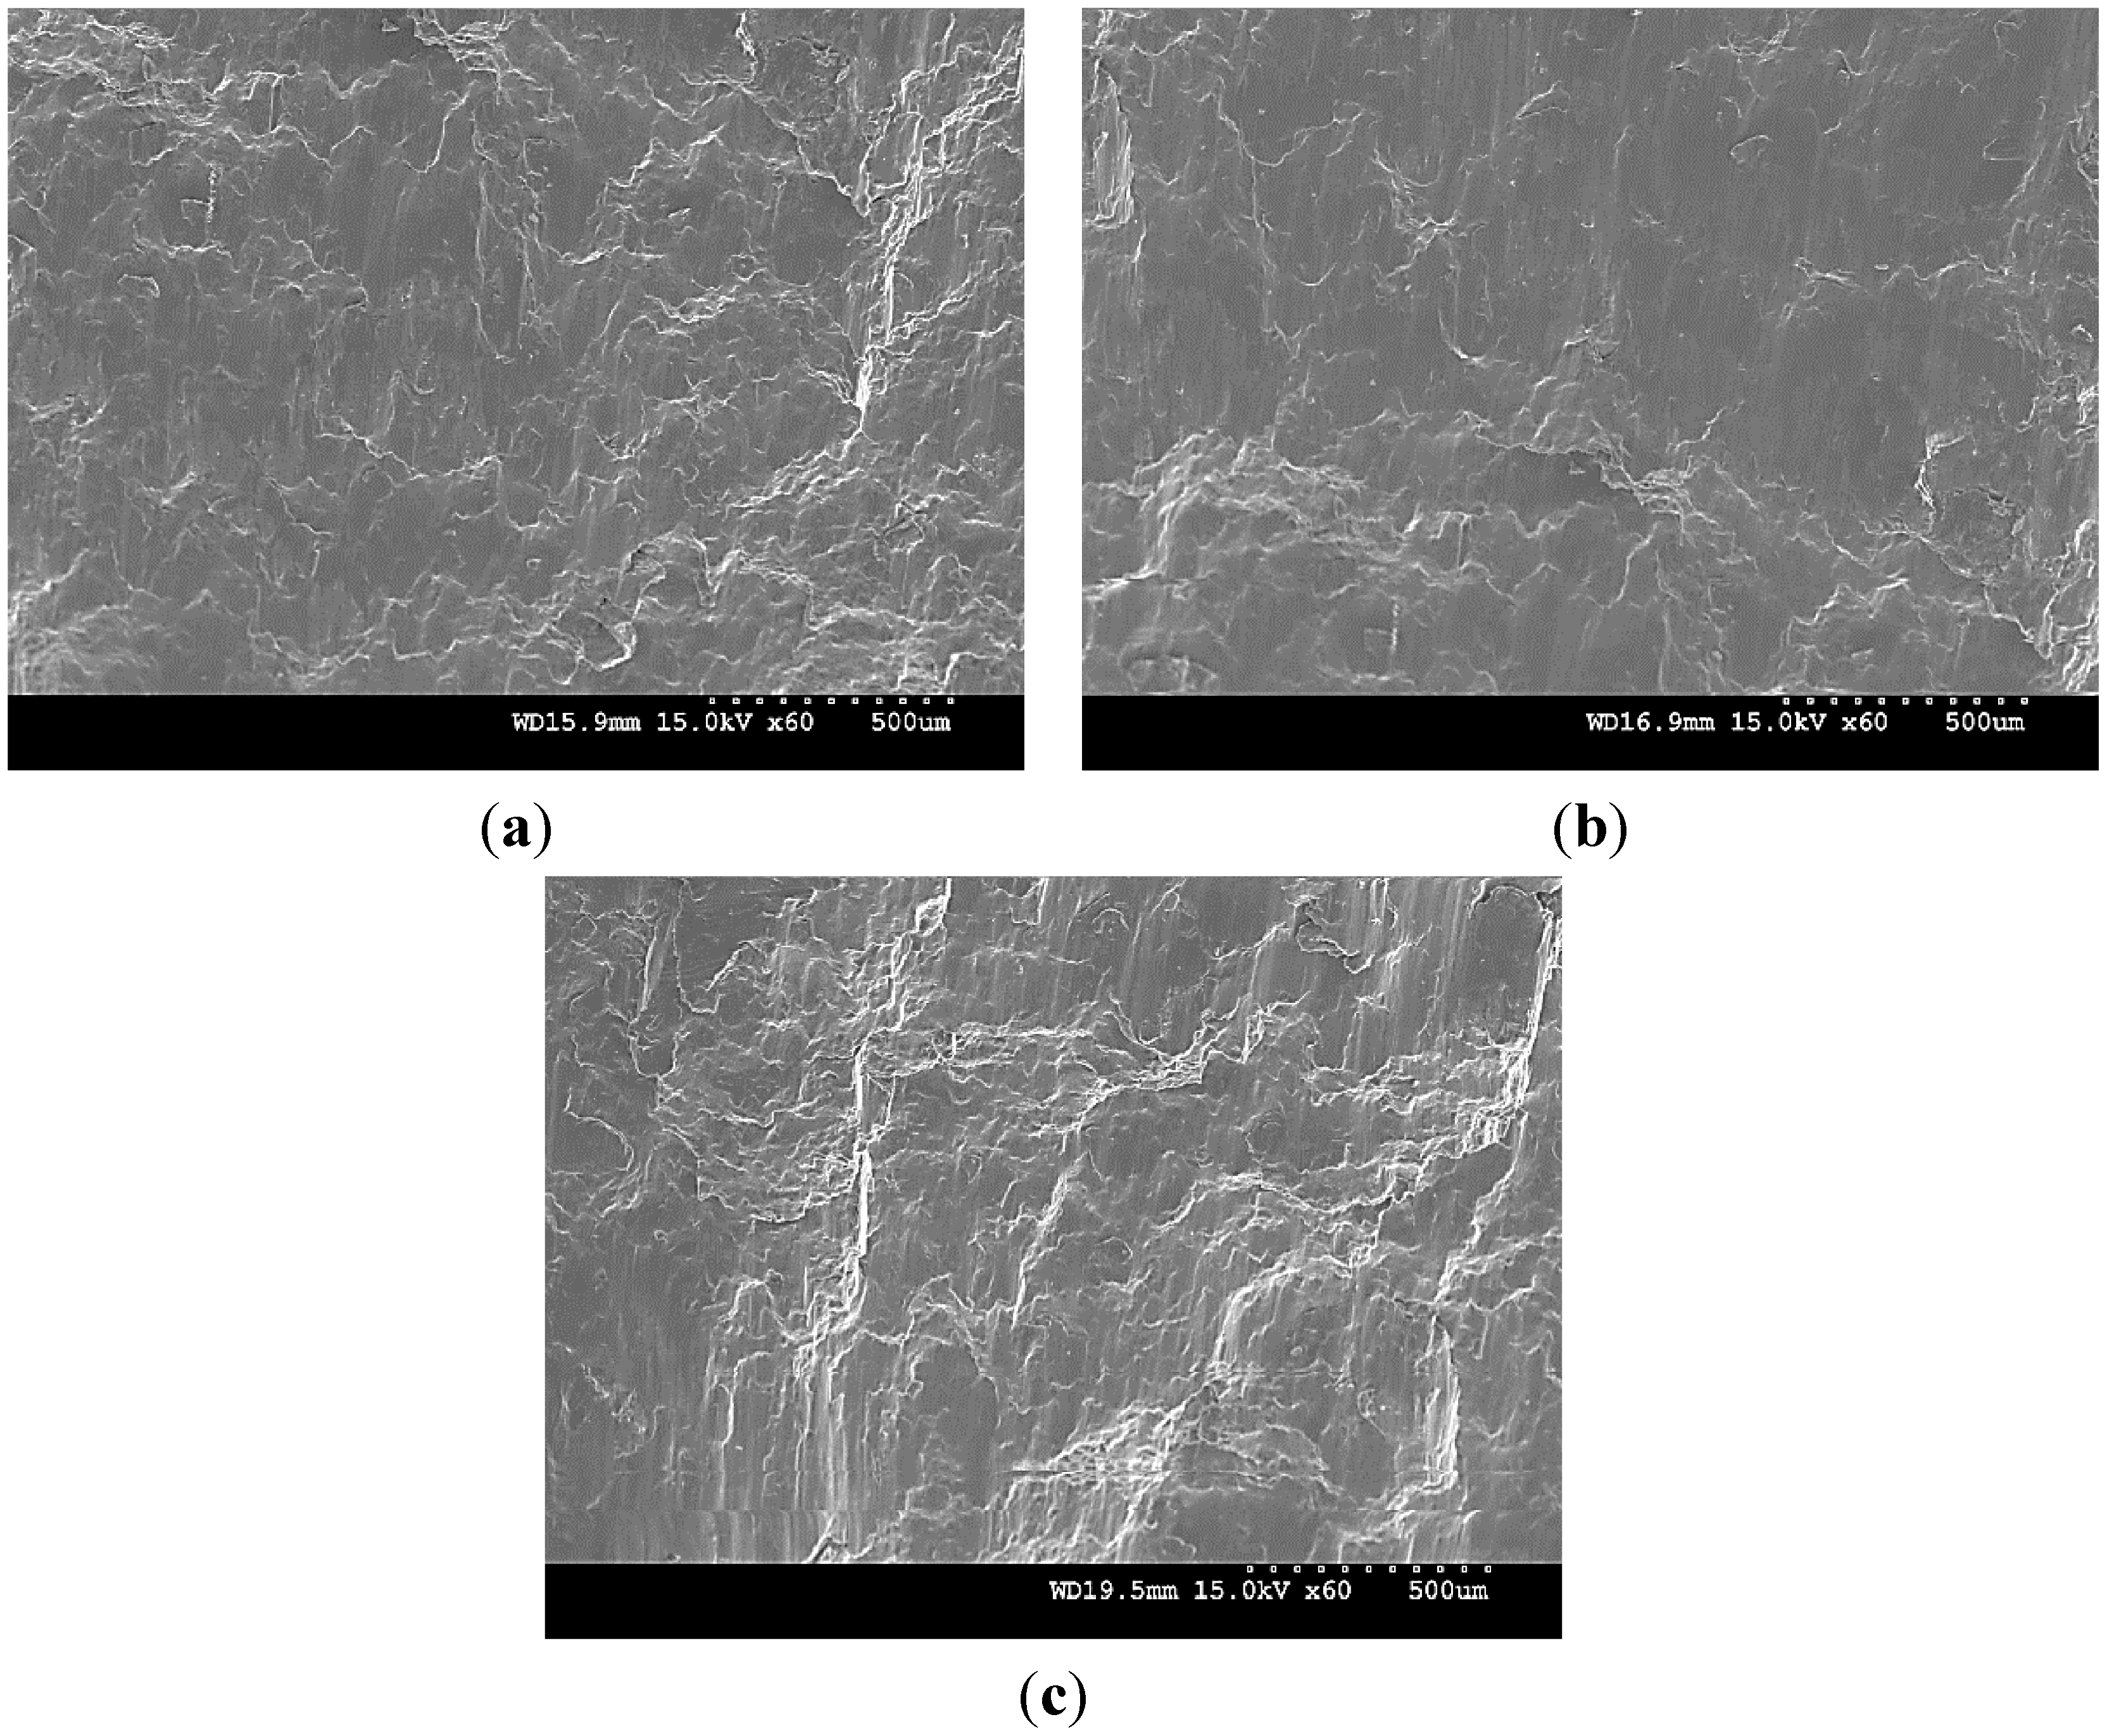
Figure 8 shows the tensile fracture surfaces of PM synthesized pure Mg and Mg (1.98 and 2.5) vol % TiO
2 nanocomposite. Fracture surfaces of PM synthesized pure Mg and Mg 2.5 vol % TiO
2 samples (
Figure 8a,c) indicate microscopically rough features with cleavage steps highlighting brittle failure which is also evident from their tensile fracture strain values of ~10% and 6%, respectively. Whereas, in the case of PM synthesized Mg 1.98 vol % TiO
2, fractograph indicates mixed mode of failure with dimple like features thereby indicating possibilities of plastic deformation of Mg matrix which is also evident from its high tensile fracture strain value of ~14.5%.


