1. Introduction
Metal-organic frameworks (MOFs) are an emerging class of nanoporous structures that composed of organic units (linker or ligand) and inorganic metallic units with one, two, or three dimensions [
1,
2]. Tunable and regular porosity, various possible synthesis routes, and the capability of structural engineering and post-synthesis modifications, make these hybrid crystalline materials a platform for sensing, drug delivery, gas storage and purification, luminescence, catalyst, and adsorption [
2,
3].
Currently, adsorption is extensively used for the removal of pollutants from aqueous systems [
4]. To overcome the drawbacks of ordinary adsorbents, such as slow adsorption rate and low capacity, researchers have focused extensively on novel adsorbents [
4]. With a very high surface area, excellent porosity, and voids fraction, MOFs provide a promising perspective in sorption field. Until recently, MOFs were applied for the sorption of arsenic [
5], fluoride [
6], dyes [
7,
8,
9], among others [
10,
11].
Zeolitic imidazolate frameworks (ZIFs) are a class of MOFs composed of cobalt or zinc metal ions and organic imidazole linkers. They are highly stable in aqueous and harsh environments. ZIF-8 is a nitrogen-coordinated ZIF that consisting of zinc (II) ion and 2-methylimidazole linker to build tetrahedral units. It is known for its superior advantages in membrane separation, adsorption, and catalysis. ZIF-67 has the same sodalite zeolite-type topology as ZIF-8 with cobalt ions instead of zinc [
12].
UIO-66 is a zirconium base MOF with hexa-nuclear zirconium clusters connected by terephthalate linkers. Owing to its stable structures under harsh thermal and chemical environments, UIO-66 has received considerable attention for the purpose of different environmental applications [
1].
Ciprofloxacin (CIP) is a member of fluoroquinolone antibiotics that have diverse medical purposes. CIP is a mobile, soluble, and non-biodegradable contaminant that could not be removed completely during the conventional wastewater treatment system. Due to their toxic, bio-accumulative, and persistent nature, the presence of CIP and its residues in water bodies pose a major concern to the environment and human health [
3,
4].
No study has yet examined the CIP removal by ZIFs or UIO-66. Thus, we studied the feasibility of CIP removal under various key operating parameters, named pH, antibiotic concentration, MOFs dosage and contact time. A mathematical process model was developed and optimized to maximize CIP removal efficiency. Kinetic coefficients for CIP adsorption under conventional mechanical stirring and ultra-sonication provided. The work also covers the study of parameters that controls the leak of heavy metal from the MOF structure.
2. Experimental Design, Materials, and Methods
2.1. Reagents and Chemicals
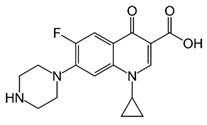
All the chemical used in this study were prepared from Sigma Aldrich (St. Louis, Mo, USA) and Merck (KGaA, Darmstadt, Germany) and used without modification. The chemical structure of CIP and its physiochemical properties are presented in
Table 1.
2.2. Synthesis of Metal-Organic Frameworks (MOFs)
ZIF-8, ZIF-67, and UIO-66 were prepared according to the procedures described in the
supplementary file. Different crystal topologies for ZIF-8 and ZIF-67 were obtained by changing the mole ratios and metal compounds in synthesis method as summarized in
Table 2. The resulting product in the synthesis solution, (white in the case of ZIF-8, purple for ZIF-67, and yellow for UIO-66) was centrifuged at 3000 rpm for 10 min and washed several times with deionized water. The residual solid was oven-dried at 70 °C to remove any remaining moisture in the MOF pores [
14,
15,
16].
A batch experimental system was employed in this study and the experiments were carried out in 25 °C and agitated at a speed of 200 rpm and duplicate (mean values). The pH of the CIP solution was adjusted to the required values using dilute NaOH or HCl solutions. The experiments were conducted by changing the variables of pH (4–12), initial CIP concentration (10–100 mg/L), adsorbent dosage (0.2–1 g), and contact time (10–90 min). The residual concentration of CIP in the solution was determined using high liquid performance chromatography (HPLC, knauer, smartline, Germany) equipped with a vortex column and UV detector at a flow rate of 0.8 mL min-1 and wavelength 270 nm.
2.3. Experimental Design
Response surface methodology (RSM) is a collection of statistical and mathematical techniques and also one of the ideal tools for experimental design optimization where several variables affect the response of interest. It is an economical approach to determine the maximum efficiency in a shorter period of time and with conducting the least number of experiment runs [
17,
18].
The effect of four independent variables was investigated using the central composite design (CCD) with a total 30 runs consisting of 2 × 4 = 8 axial points, 2
4 = 16 factorial points, and six center points. To explain functional interactions between input parameters and the response, a second-order polynomial equation was applied to model the sorption process as following:
where Y is the response, X
i and X
j are the independent variables, β
0 is a constant value, β
i, β
ii, and β
ij are the regression coefficients for a linear, second-order, and interaction effects, respectively.
is the error of the model [
17,
18].
In the first phase of this study, the synthesized MOFs were used at 15–30 min contact time to find the adsorbent with the highest affinity to the CIP. The amount of CIP removal and the amount of CIP uptake (q
e) at the equilibrium were calculated by using the following equations, respectively:
where
is initial CIP concentration,
is final CIP concentration, V is the volume of the solution (L), and W is the mass of the MOF (g) used in the experiments. During the first phase of study, the CIP detaches from the MOF surfaces gradually as time increases beyond about 30 min. On the basis of these observations, the upper limit of time in designing the experiments was considered to be 30 min. The study also revealed that ZIF-67-SO
4 has the highest CIP removal. Thus, ZIF-67-SO
4 was selected to continue the CIP adsorption study. Response surface methodology (RSM) using R software was utilized to model the sorption process. Before run design, the operational variables were coded in the following order: X
1, X
2, X
3, and X
4 representing contact time (min), adsorbent dosage (g/L), pH and CIP concentration (mg/L), respectively. The range of independent variables and their coded values are shown in
Table 3.
A total of 29 experiments with four replicates at the center point were performed in a Box-Behnken design (BBD) design. The coded values (
) of the input variables were determined by the following equation [
19]:
where X
i is the actual value of input variables, X
0 is the actual value of input variables at the center point, and
is the step change value. After performing the experiments according to the design matrix (
Table 4), the data were analyzed using the analysis of variance (ANOVA), coefficient of determination (R
2), and lack of fit (LOF).
3. Results and Discussion
3.1. Adsorbent Characterization
The adsorbents were characterized by x-ray diffraction (XRD, Unisantis S.A, XMD300 model, Geneva, Switzerland) and field emission scanning electron microscope (FE-SEM, MIRA3 TESCAN, Czech Republic) analysis.
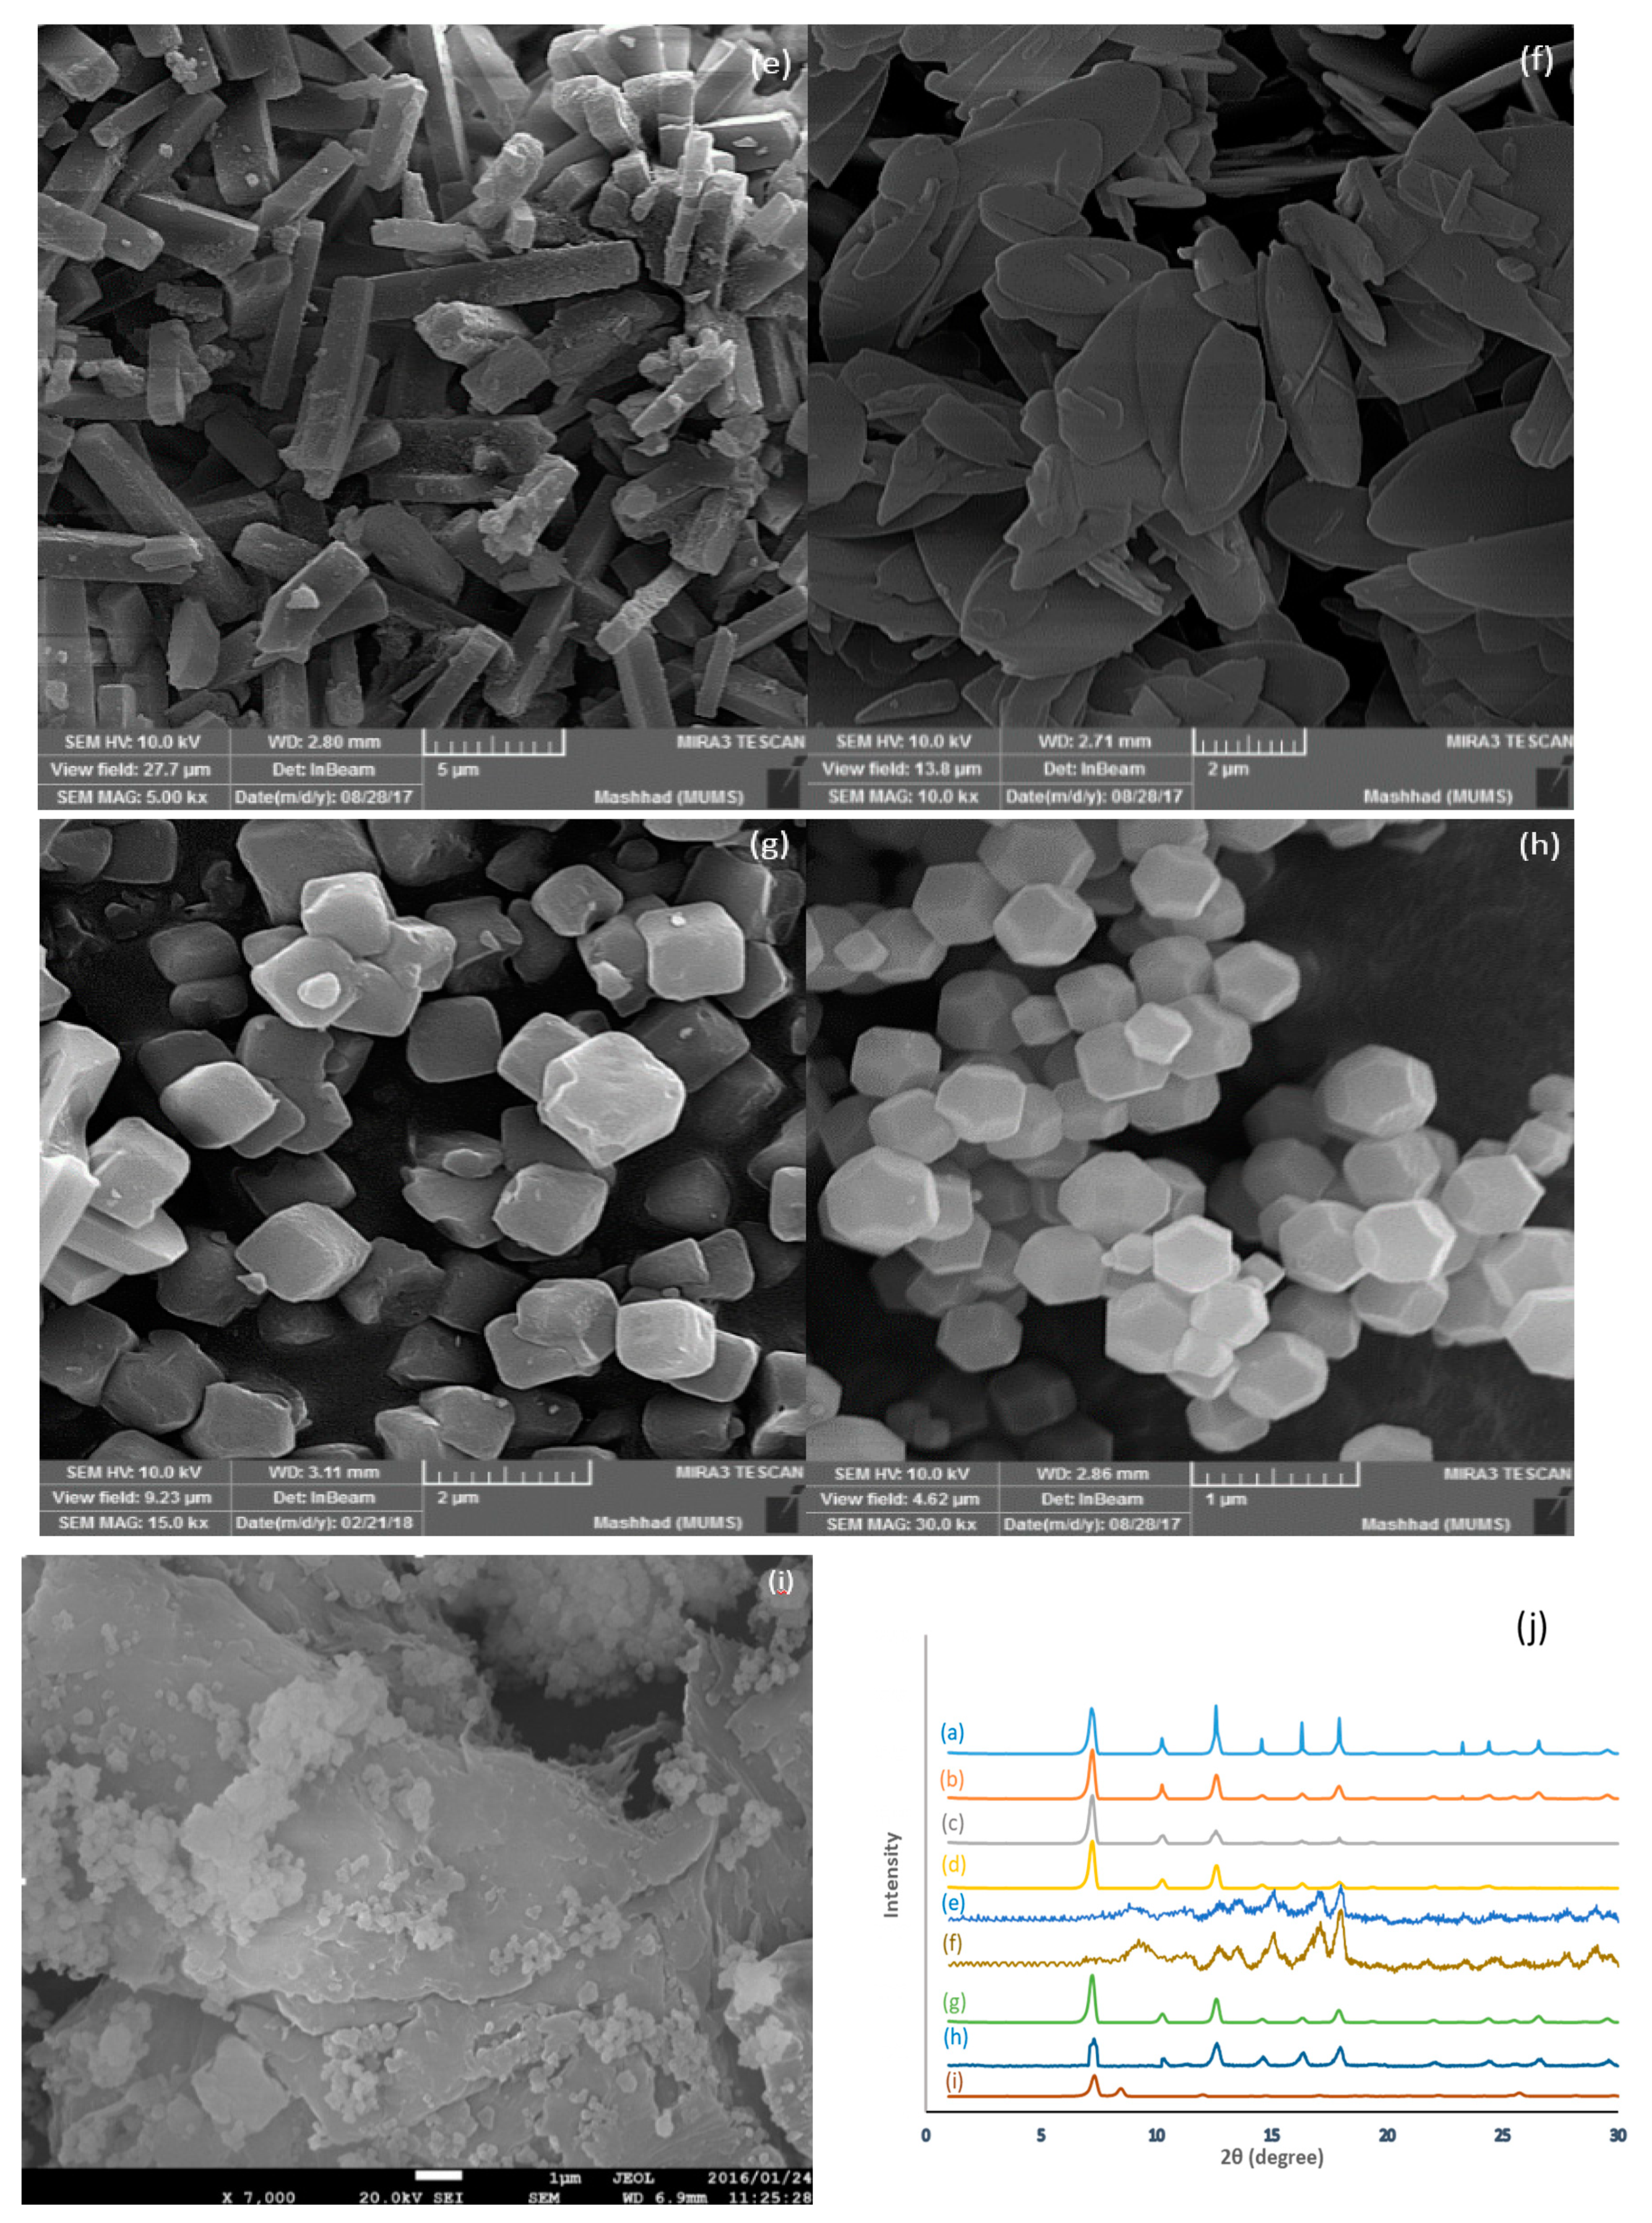
Figure 1 shows the XRD pattern of the MOFs. The conformity of XRD peaks for MOFs with those reported in the literature shows their pure crystalline structures [
14,
15,
16]. Moreover, the uniformity of micrometer-sized crystals and geometrical structure of the particles in SEM analysis, as shown in
Figure 1, confirms the preciseness of the MOFs’ synthesis.
3.2. Study of MOFs for Ciprofloxacin (CIP) Removal
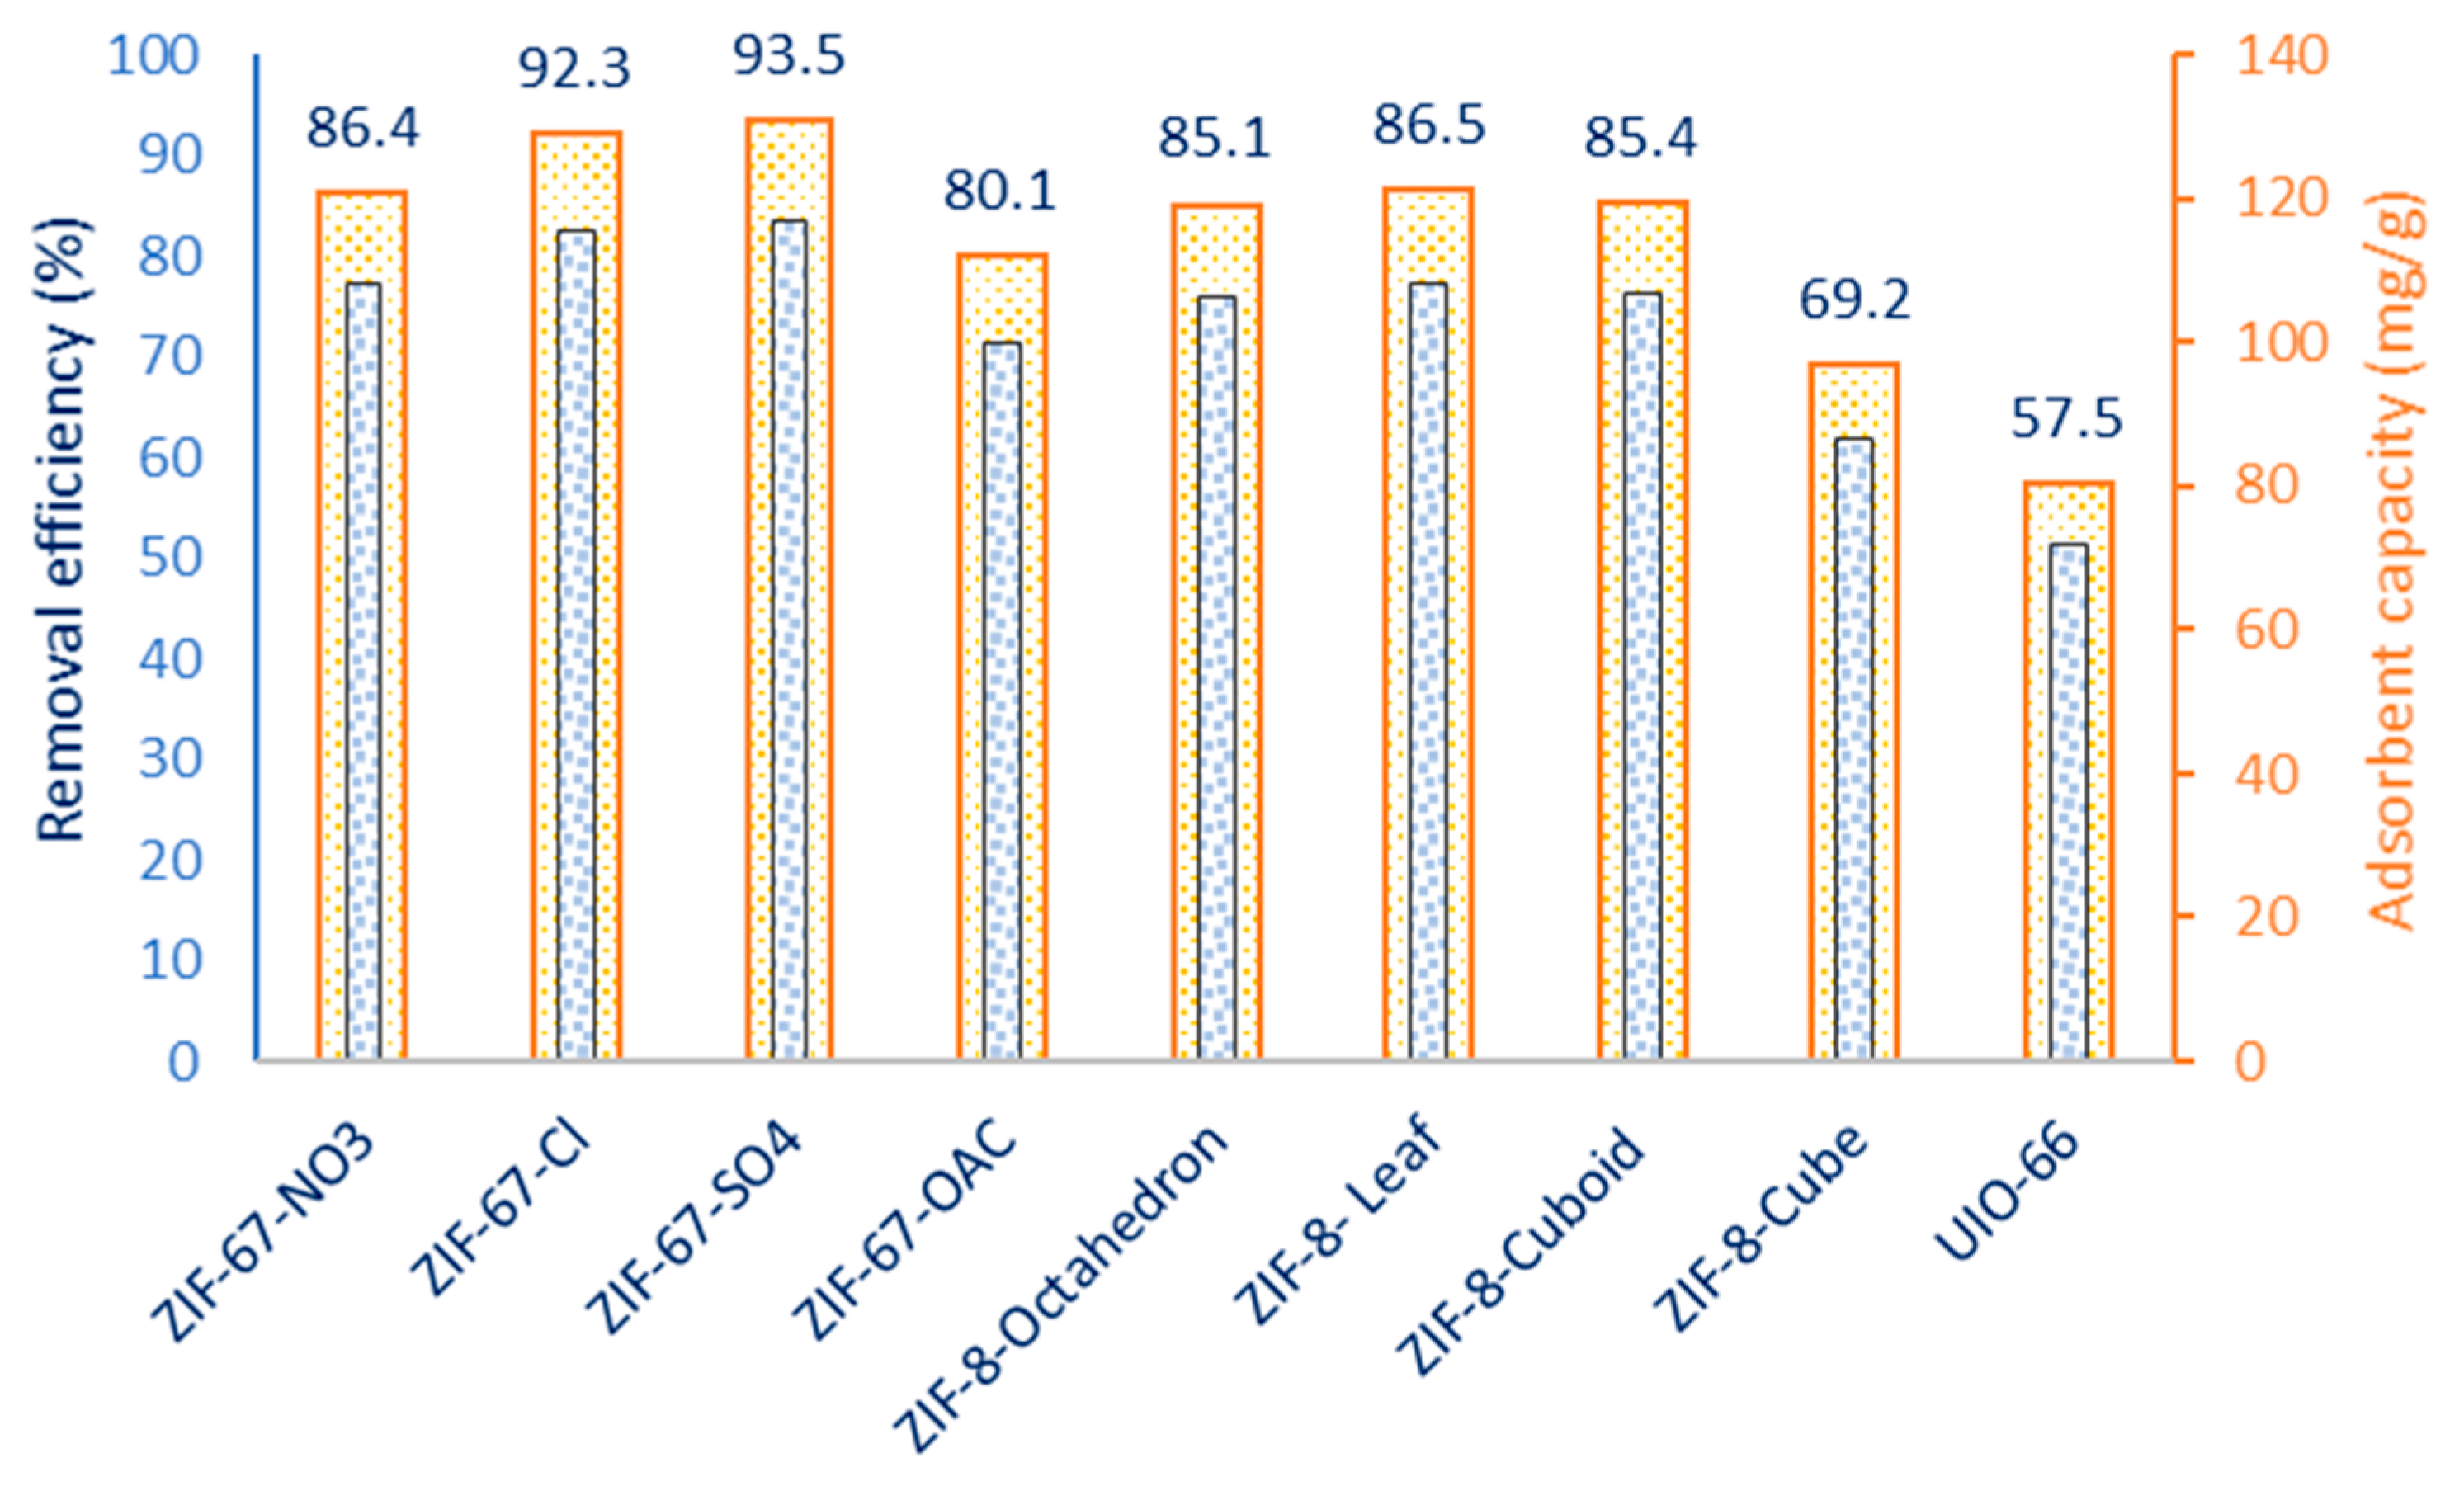
The affinity of as-synthesized MOFs for CIP was evaluated in a batch system by observing their removal efficiency in the presence of a fixed 500 mg MOF per L. Furthermore, the capacity of adsorbents for CIP in the equilibrium, after 30 min, were determined. The results presented in
Figure 2 show that the CIP removal was highest for ZIF-67-SO
4, and the level of MOF affinity decreased by ZIF-67-Cl > ZIF-8-NO
3 > ZIF-8 leaf = ZIF-8 octahedron > ZIF-8-OAc > ZIF-8-cube > UIO-66. ZIF-67-SO
4 also shows the highest capacity for CIP in this stage.
3.3. Model Development Using Response Surface Methodology (RSM)
To evaluate the suitability of linear, interaction (2Fl), quadratic and cubic models, the statistical indicators from the sequential model were compared, as seen in
Table S1 in Supplementary Materials. The simplest model which also featured an acceptable statistical fitness was recognized as the best model. The larger amount of F-value and smaller p-value coefficients in
Table S1 demonstrate the quadratic model as the best fit.
ANOVA could explain how the change in independent variables influences the response values. The results of ANOVA are given in
Table S2. For the model, both R
2 (0.97) and adjusted R
2 (0.95) are close to one and within ± 0.2 range of each other. Moreover, the F-value (41.85), P-value (5.718 × 10
–9), and non-significant value for lack of fit (0.1155) indicate that the model is statistically adequate.
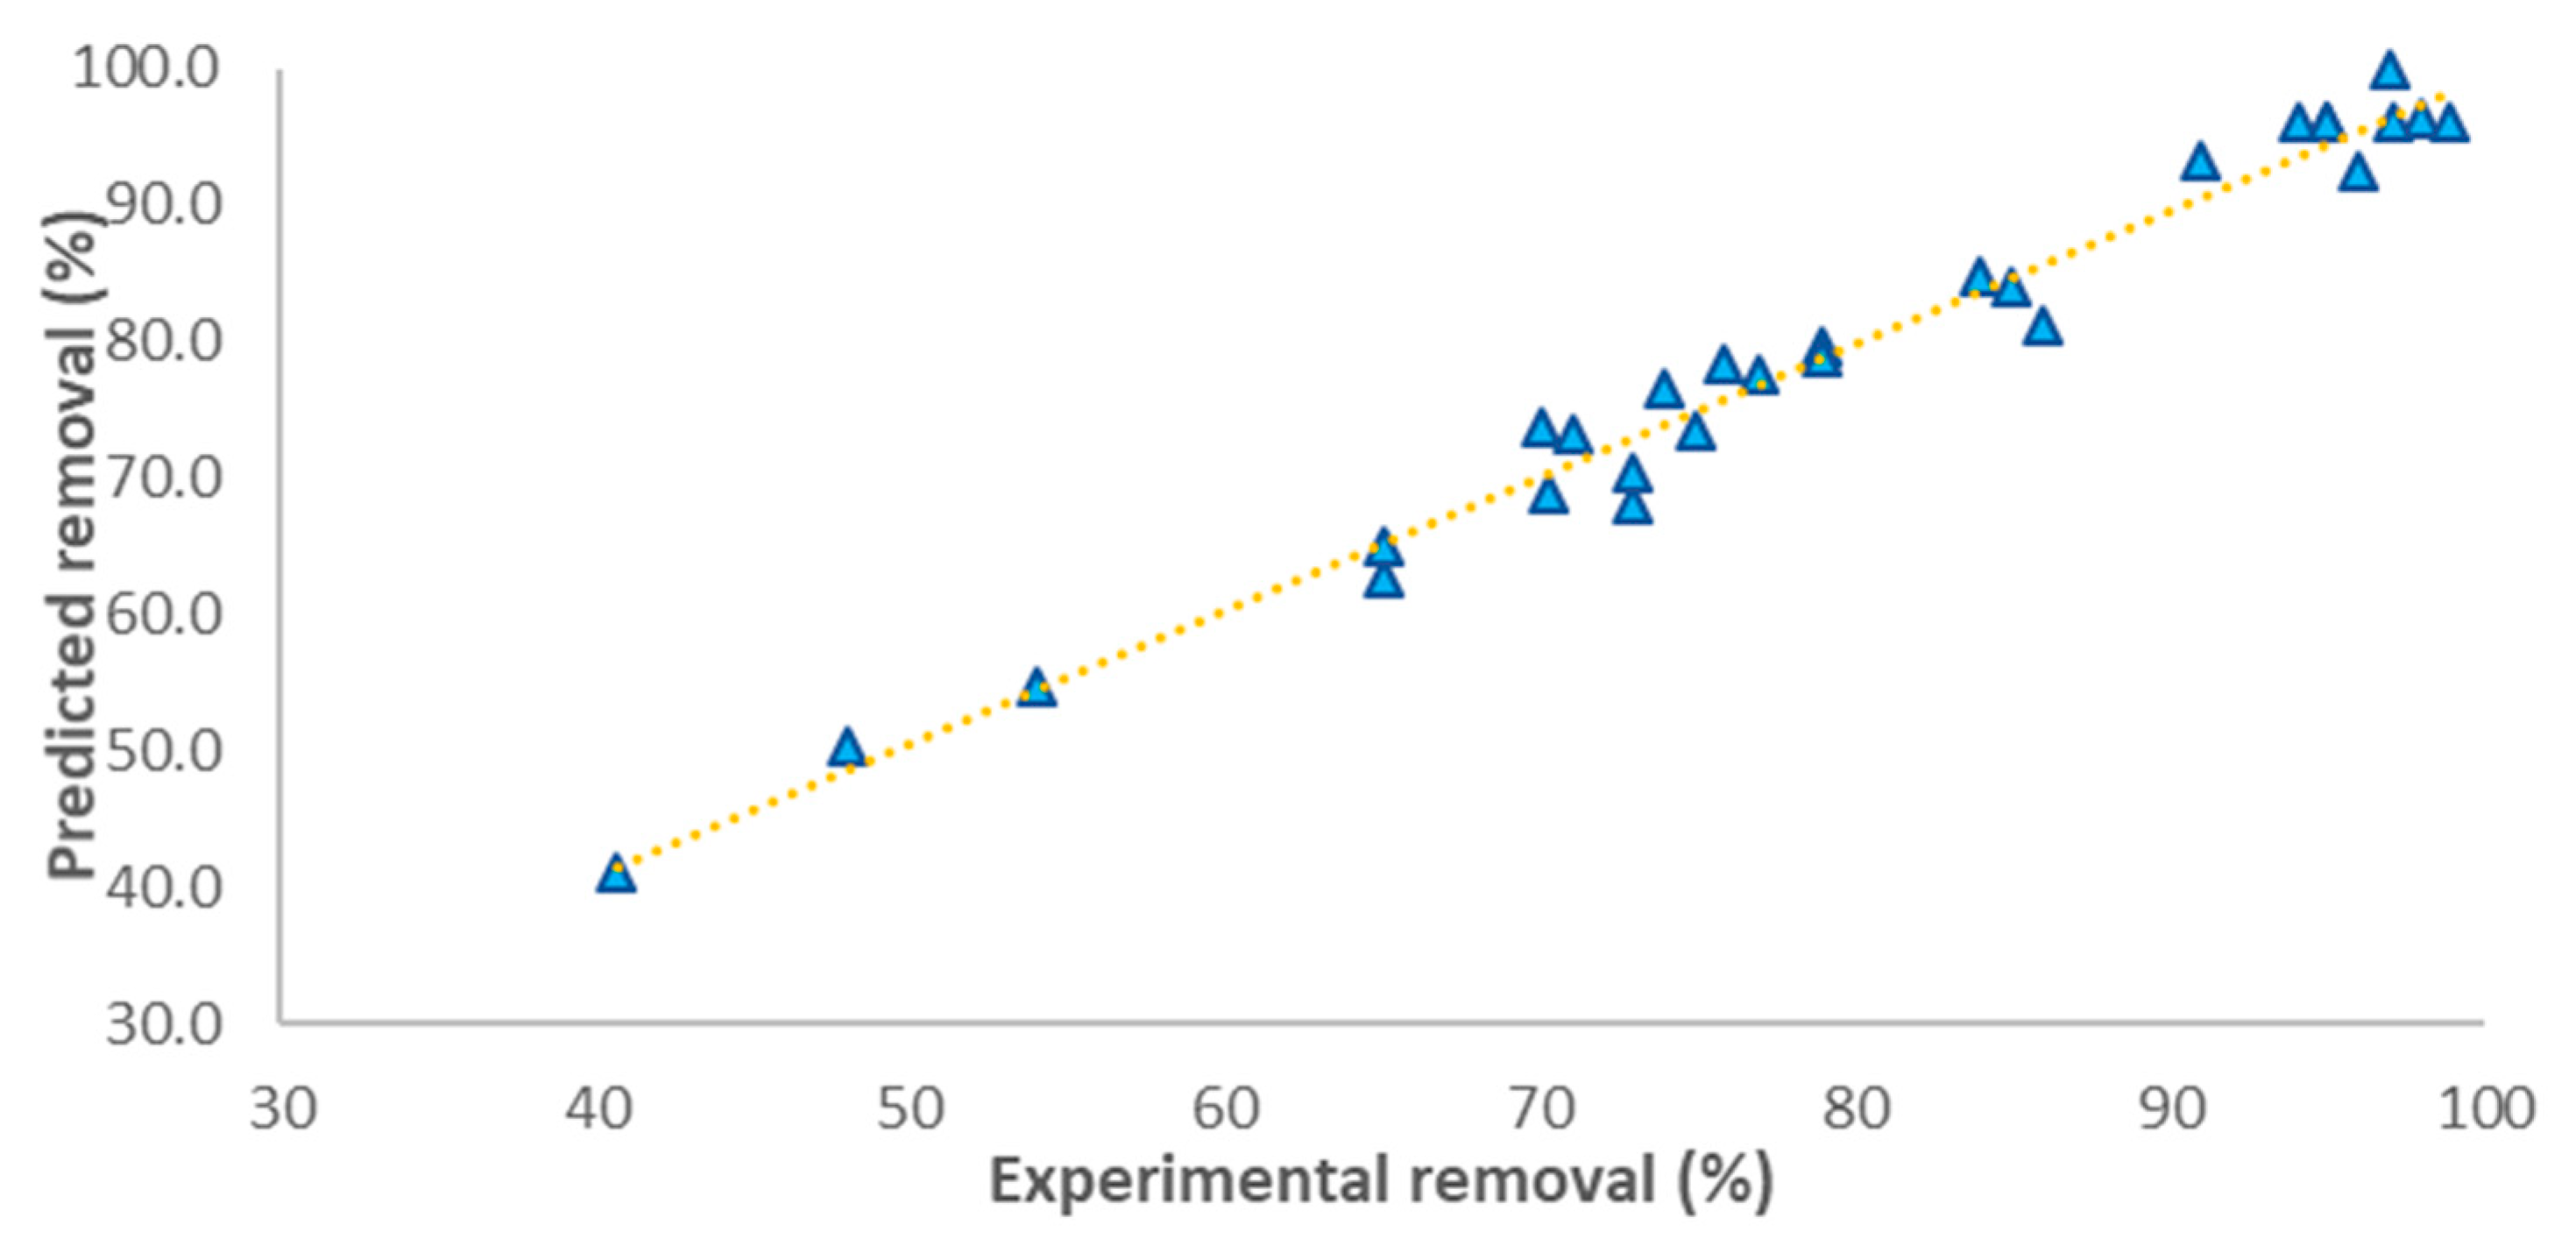
The preciseness of the model for predicting the CIP removal under experimental conditions is apparent from the uniform distribution of experimental points close to the regression line as seen in
Figure 3.
According to the coefficients obtained for each term presented in
Table 5, the following equation was developed for the prediction of CIP removal values:
In the above quadratic model, the level of impaction for each individual variable and their interactions on CIP removal is attainable. The positive and negative sign of terms in the model demonstrates that the adsorption increased and decreased by variable value, respectively [
13].
3.4. Effects of Model Variables and Their Interactions
A solid-to-solution ratio is one of the main factors in a batch adsorption process to determine the efficiency of an adsorbent [
3,
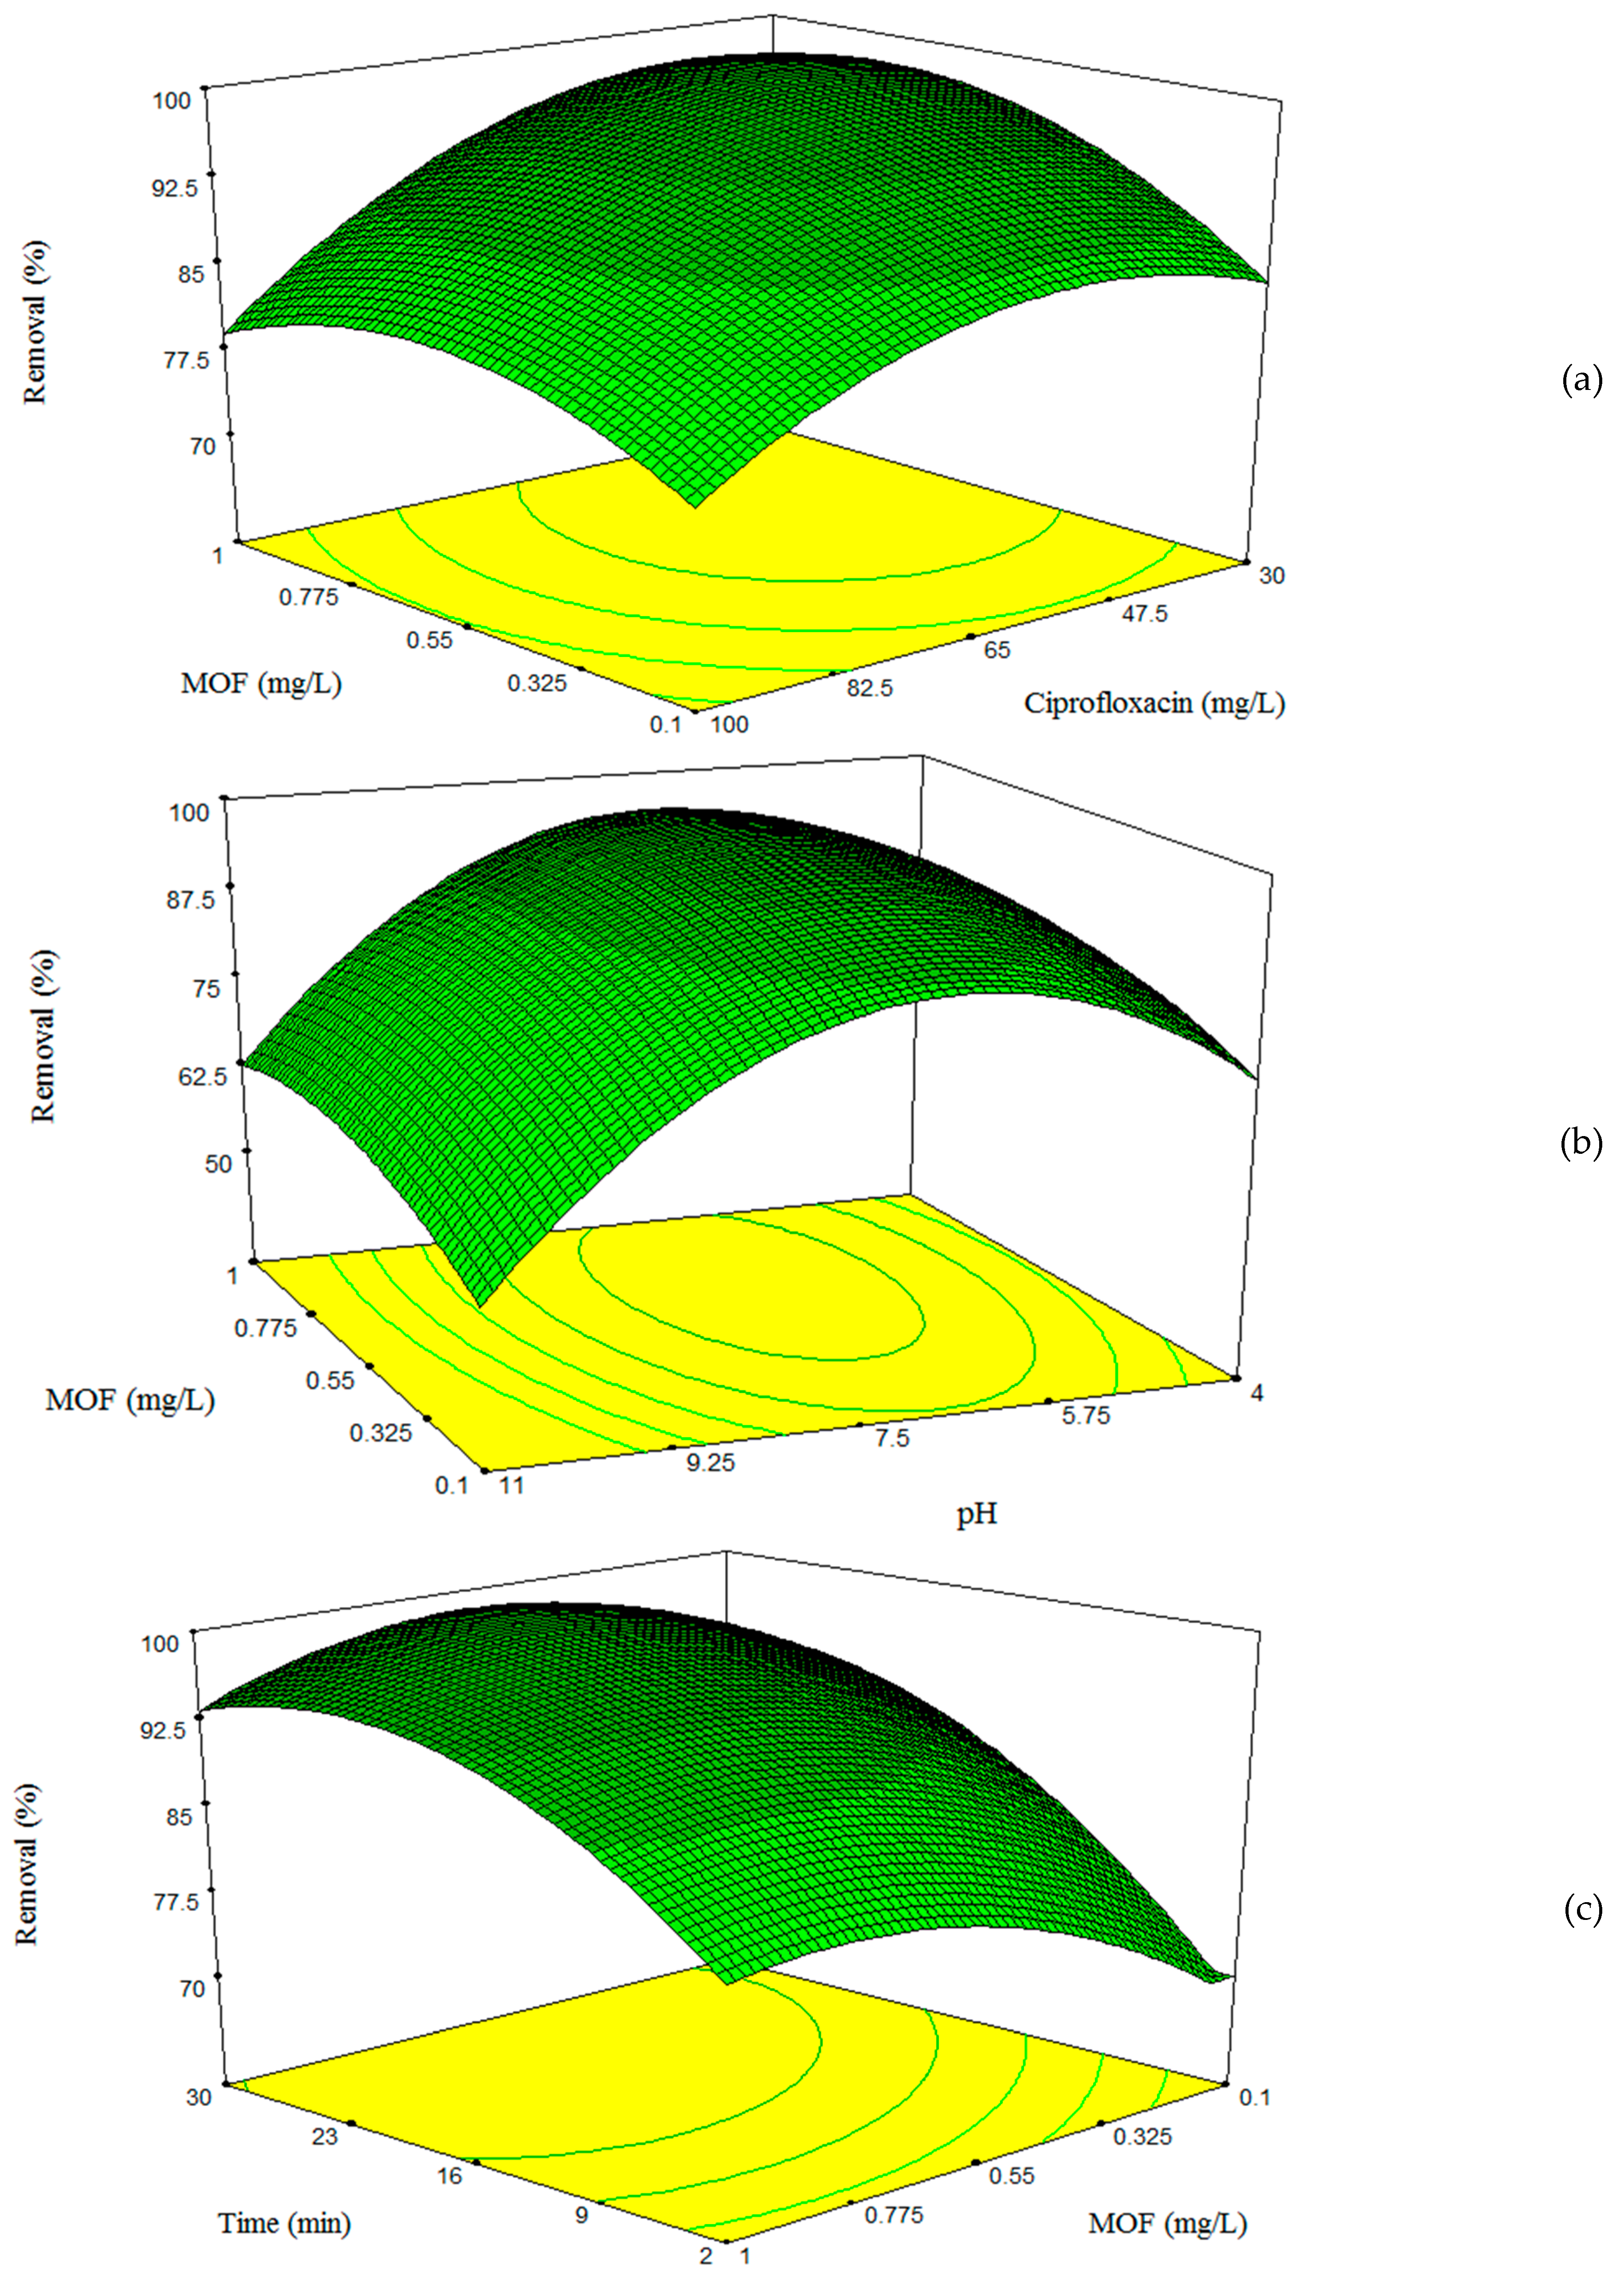
20]. The effect of MOF dosage on removal efficiency of CIP is displayed in
Figure 4a. With increasing MOF dosage from 0.1 to 0.55 g/L, firstly, removal of CIP increased in all of the initial concentration of CIP because of the more available active sites on the adsorbent; however, when MOF dosage was more than 0.55 g/L, a decrease was observed, which can be related to the increase in the pH of the solution by MOF dose.
Solution pH can change the surface speciation of both the adsorbate and adsorbent. It is necessary to explore the effect of solution pH on removal efficiency to understand the mechanism of adsorption between them [
20]. The interaction plot of pH and MOF dosage is illustrated in
Figure 4b. When the pH of the solution increases from 3 to 7.5, adsorption of CIP on MOF also increased. However, at pH values above 7.5, it decreased. The root of this adsorption behavior can be attributed to protonation–deprotonation reactions in groups of CIP molecule including cationic species (pH < 5.9), zwitterionic species (5.9 < pH < 8.9), or anionic species (pH > 8.9), as shown in
Table 1. In previous studies, the point of zero charges of MOF was found to be at 8.7 [
21], showing a positively charged surface at pH < 8.7 and negatively charged surface of ZIF-67 at pH > 8.7 [
21]. As shown in
Figure 4c, removal percentage increased when the CIP molecules had forms of cationic or zwitterionic species, likely a result of electrostatic attraction between more numbers of negatively charges on the surface of CIP and positively charged surface of the adsorbent. While in the presence of anionic species of CIP, the surface of CIP and MOF were both negative, leading to repulsion between them and decreasing removal efficiency [
3,
22]. Maximum adsorption of CIP was obtained at pH 7.3, which was selected for further study.
3.5. Model Optimization and Adequacy Checking
Optimization is the final goal in modeling a sorption process that provides the condition in which the sorption proceed under highest efficiency. By using Equation (5), the optimum values for the operating variables in the current study were achieved and are presented in
Table 6. Confirmatory tests were conducted by simulating the optimum conditions and subsequently, the obtained CIP removal value was compared with those predicted by the model.
3.6. Isotherm Modeling
Adsorption time was prolonged to 8 h for determining the equilibrium time of adsorbent. Five two-parameter and six three-parameter isotherm models were employed to fit the experimental data. Nonlinear form of isotherm models was used for data fitting duo to lack of ability of linear regression to describe experimental data in isotherm models with more than two parameters.
Table S3 in the supplementary file shows the list of nonlinear isotherm models [
23,
24].
Table 7 shows the parameters of isotherm models.
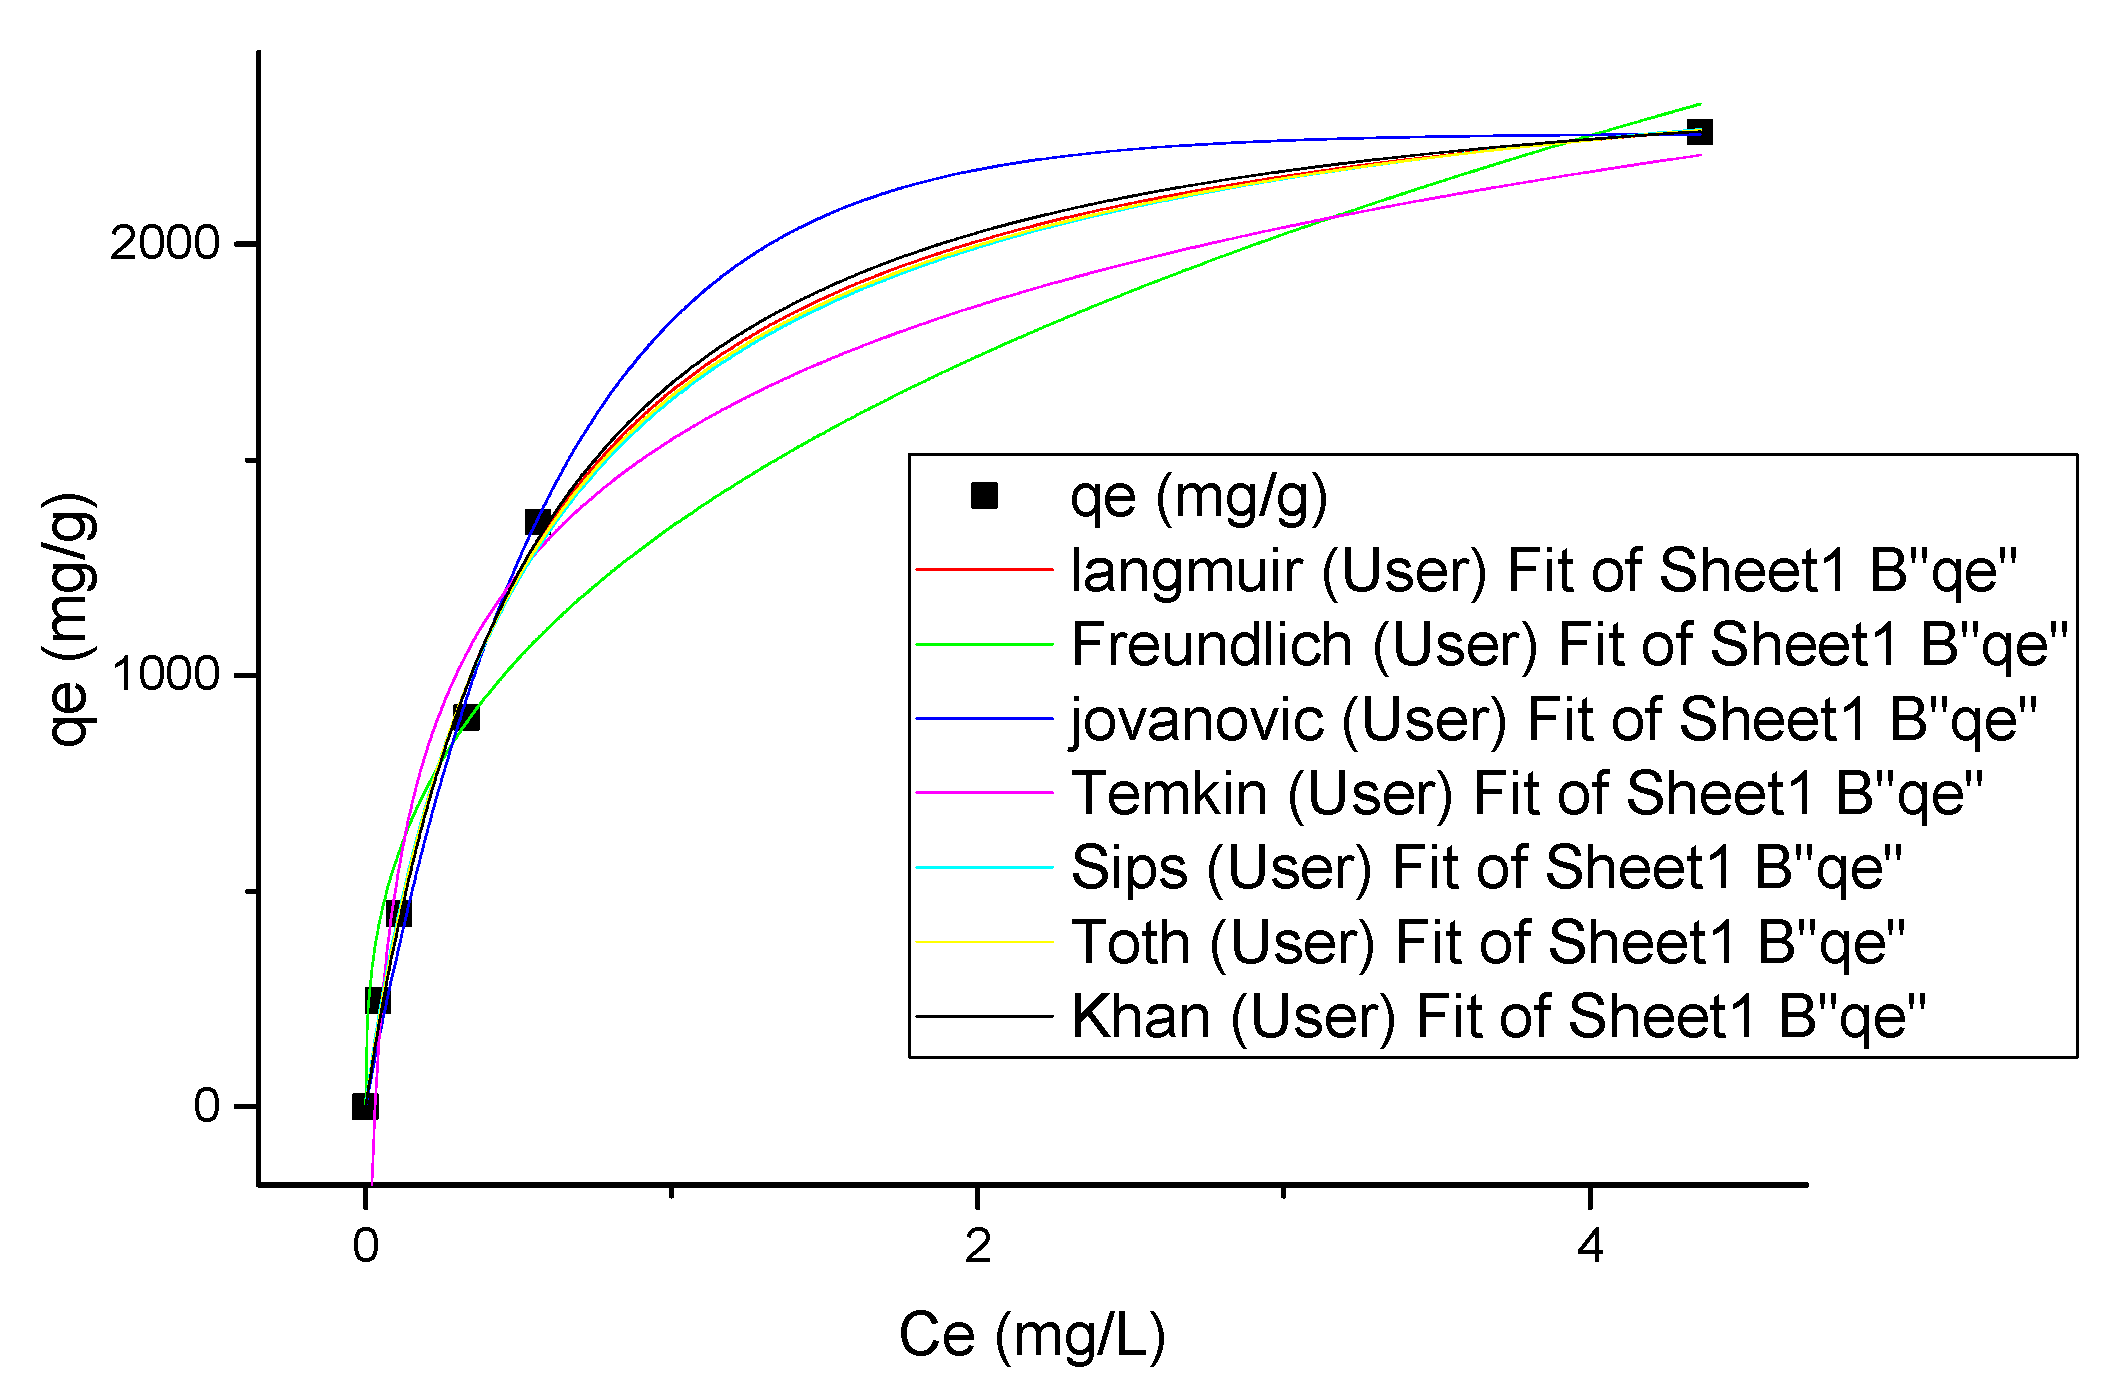
Nonlinear plots of the selected isotherm models are shown in
Figure 5. As can be seen, both of two-parameter and three-parameter isotherm models are capable of fitting the experimental data. However, among the selected isotherm models, the Langmuir model could describe isotherm data better than other models because of the higher
. The maximum adsorption capacity of the adsorbent was obtained to be 2.537 g/g according to Langmuir isotherm model, which is close to those suggested by Jovanovic (2.256 g/g), Sips (2.593 g/g), and Khan (2.772 g/g) isotherms. The sum of the square errors (SSE), adjusted linear coefficient of determination (R
2Adj), and Chi-square (x
2) tests were used to check and compare the validity of the models. The ability of the model to predict experimental data could be concluded from the lower values of SSE and x
2 and higher values of R
2 [
25]. As a result, Langmuir isotherm was selected as the best model for fitting data due to the lower SSE and x
2 and higher R
2 values.
3.7. Kinetics Modeling under Convectional Mixing and Sonication
Kinetic parameter values of CIP adsorption on ZIF under mechanical mixing and sonication are reported in
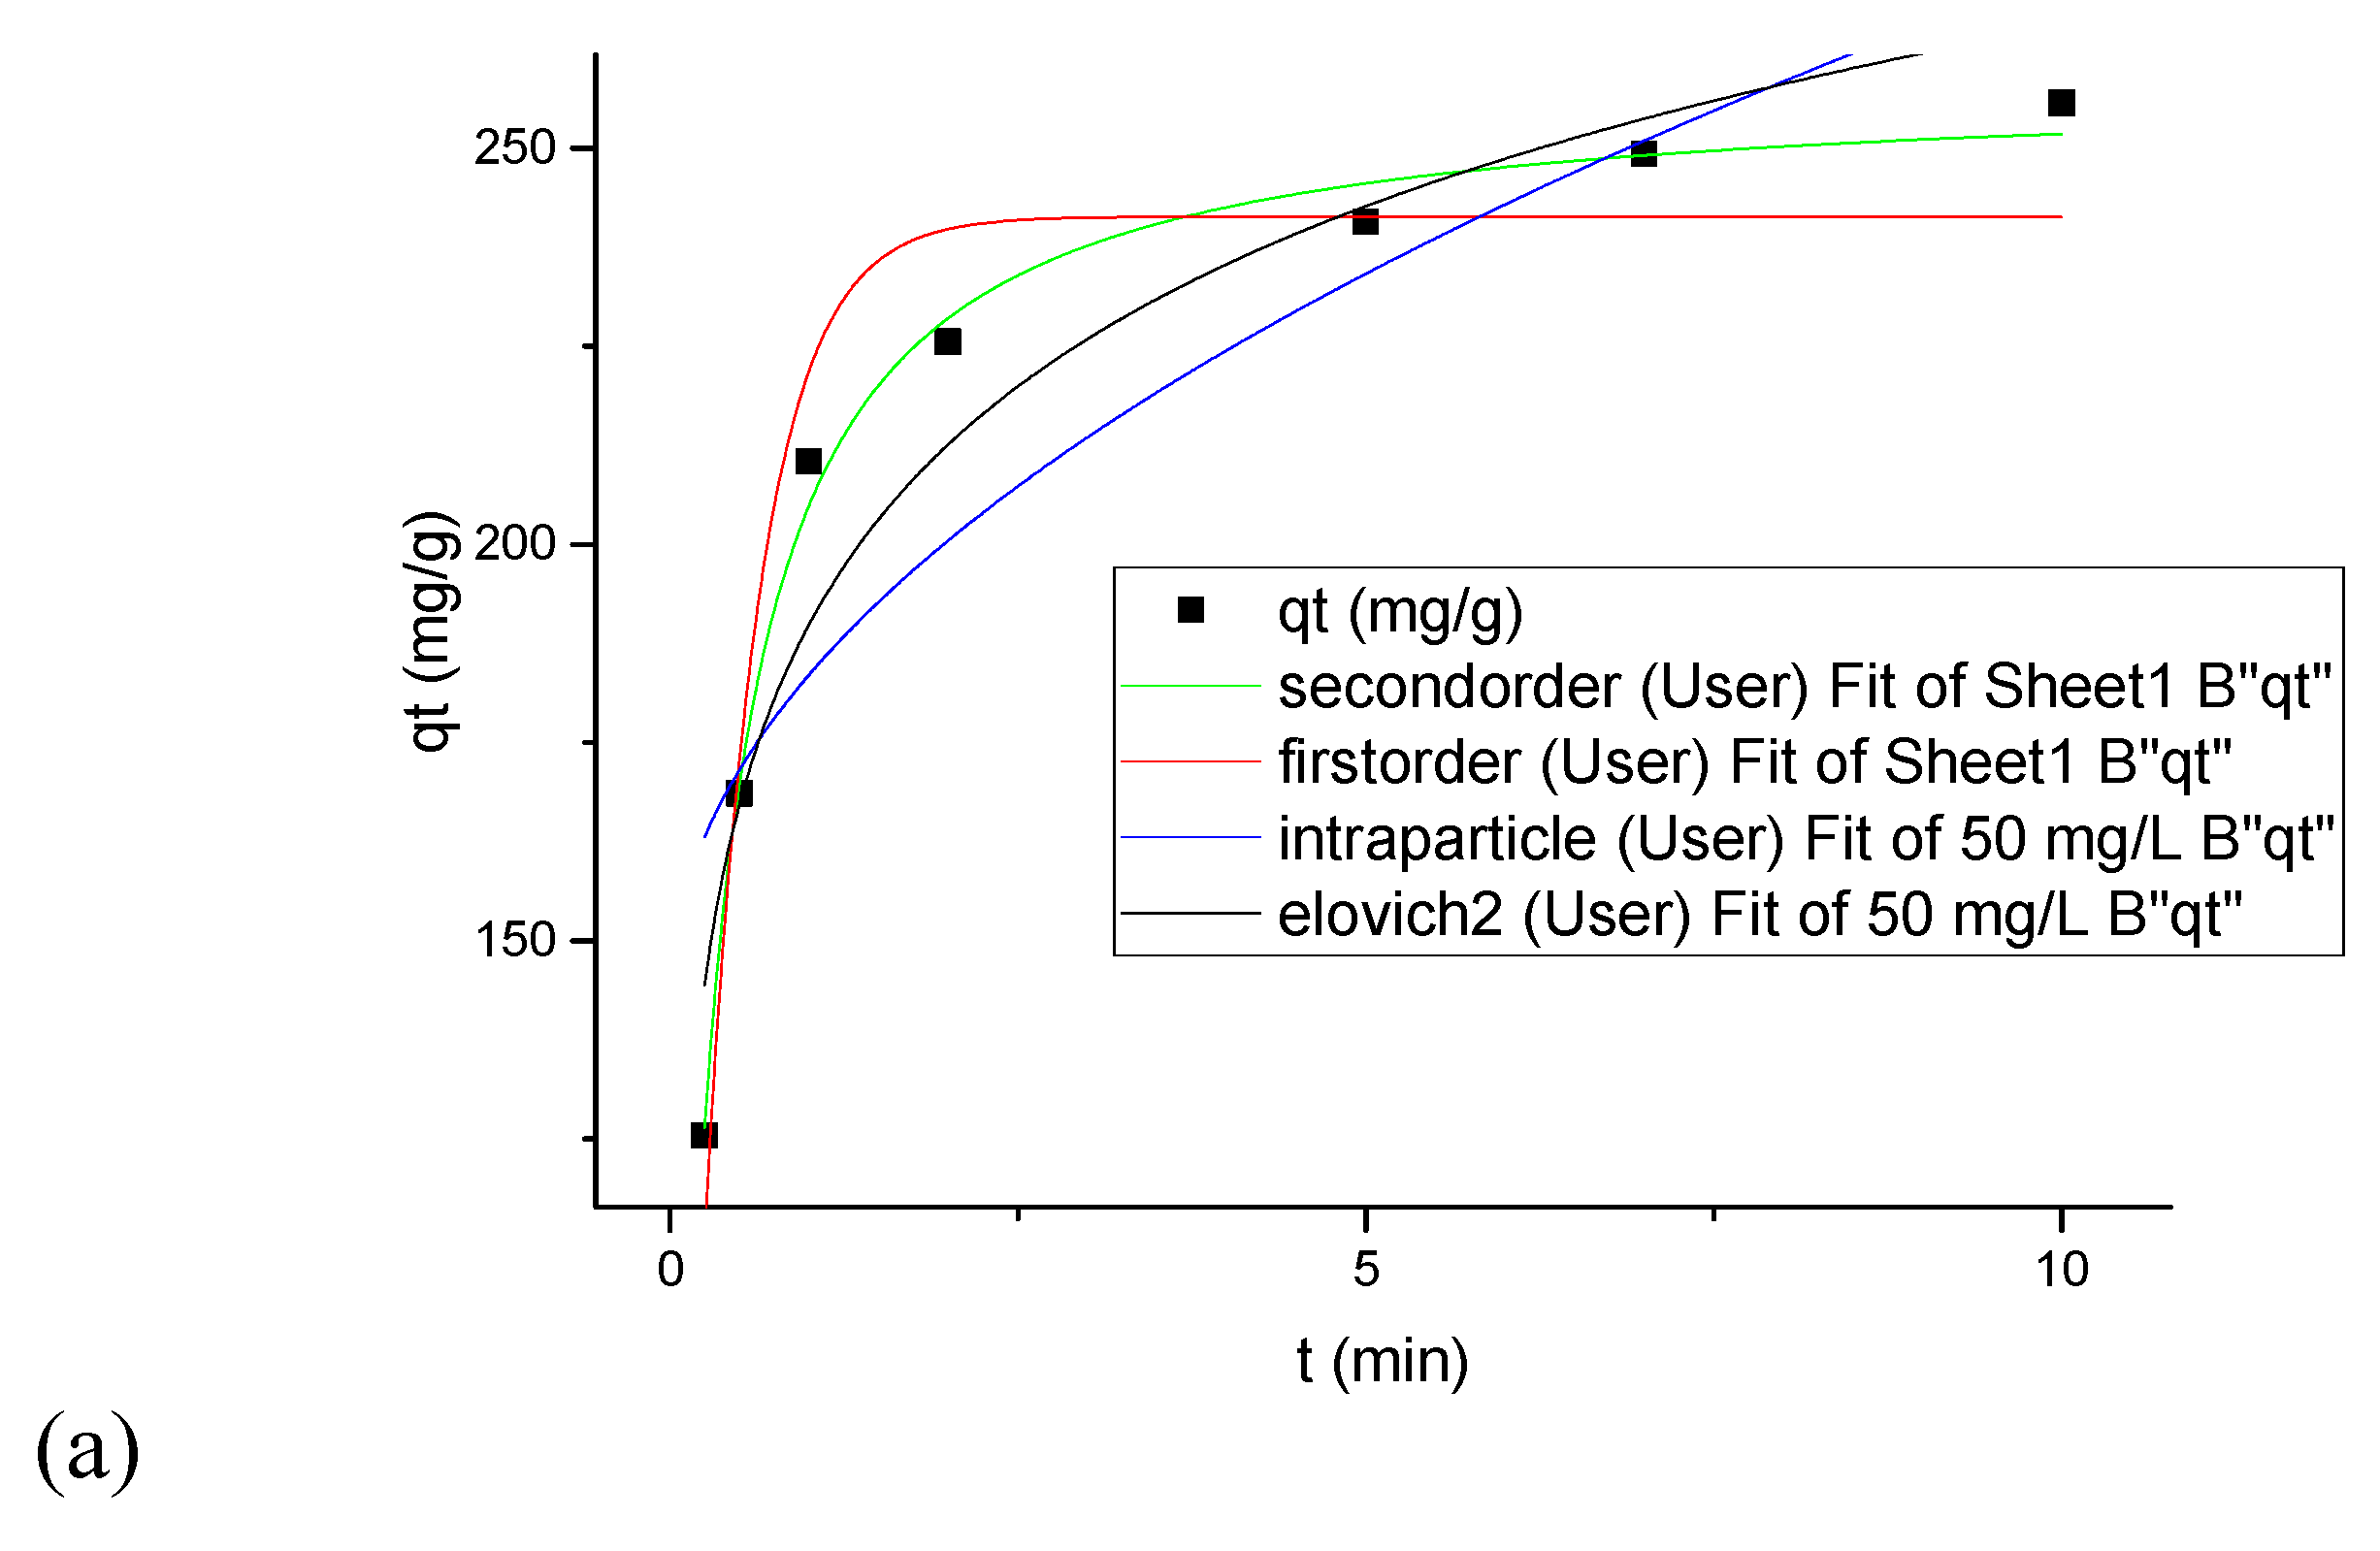
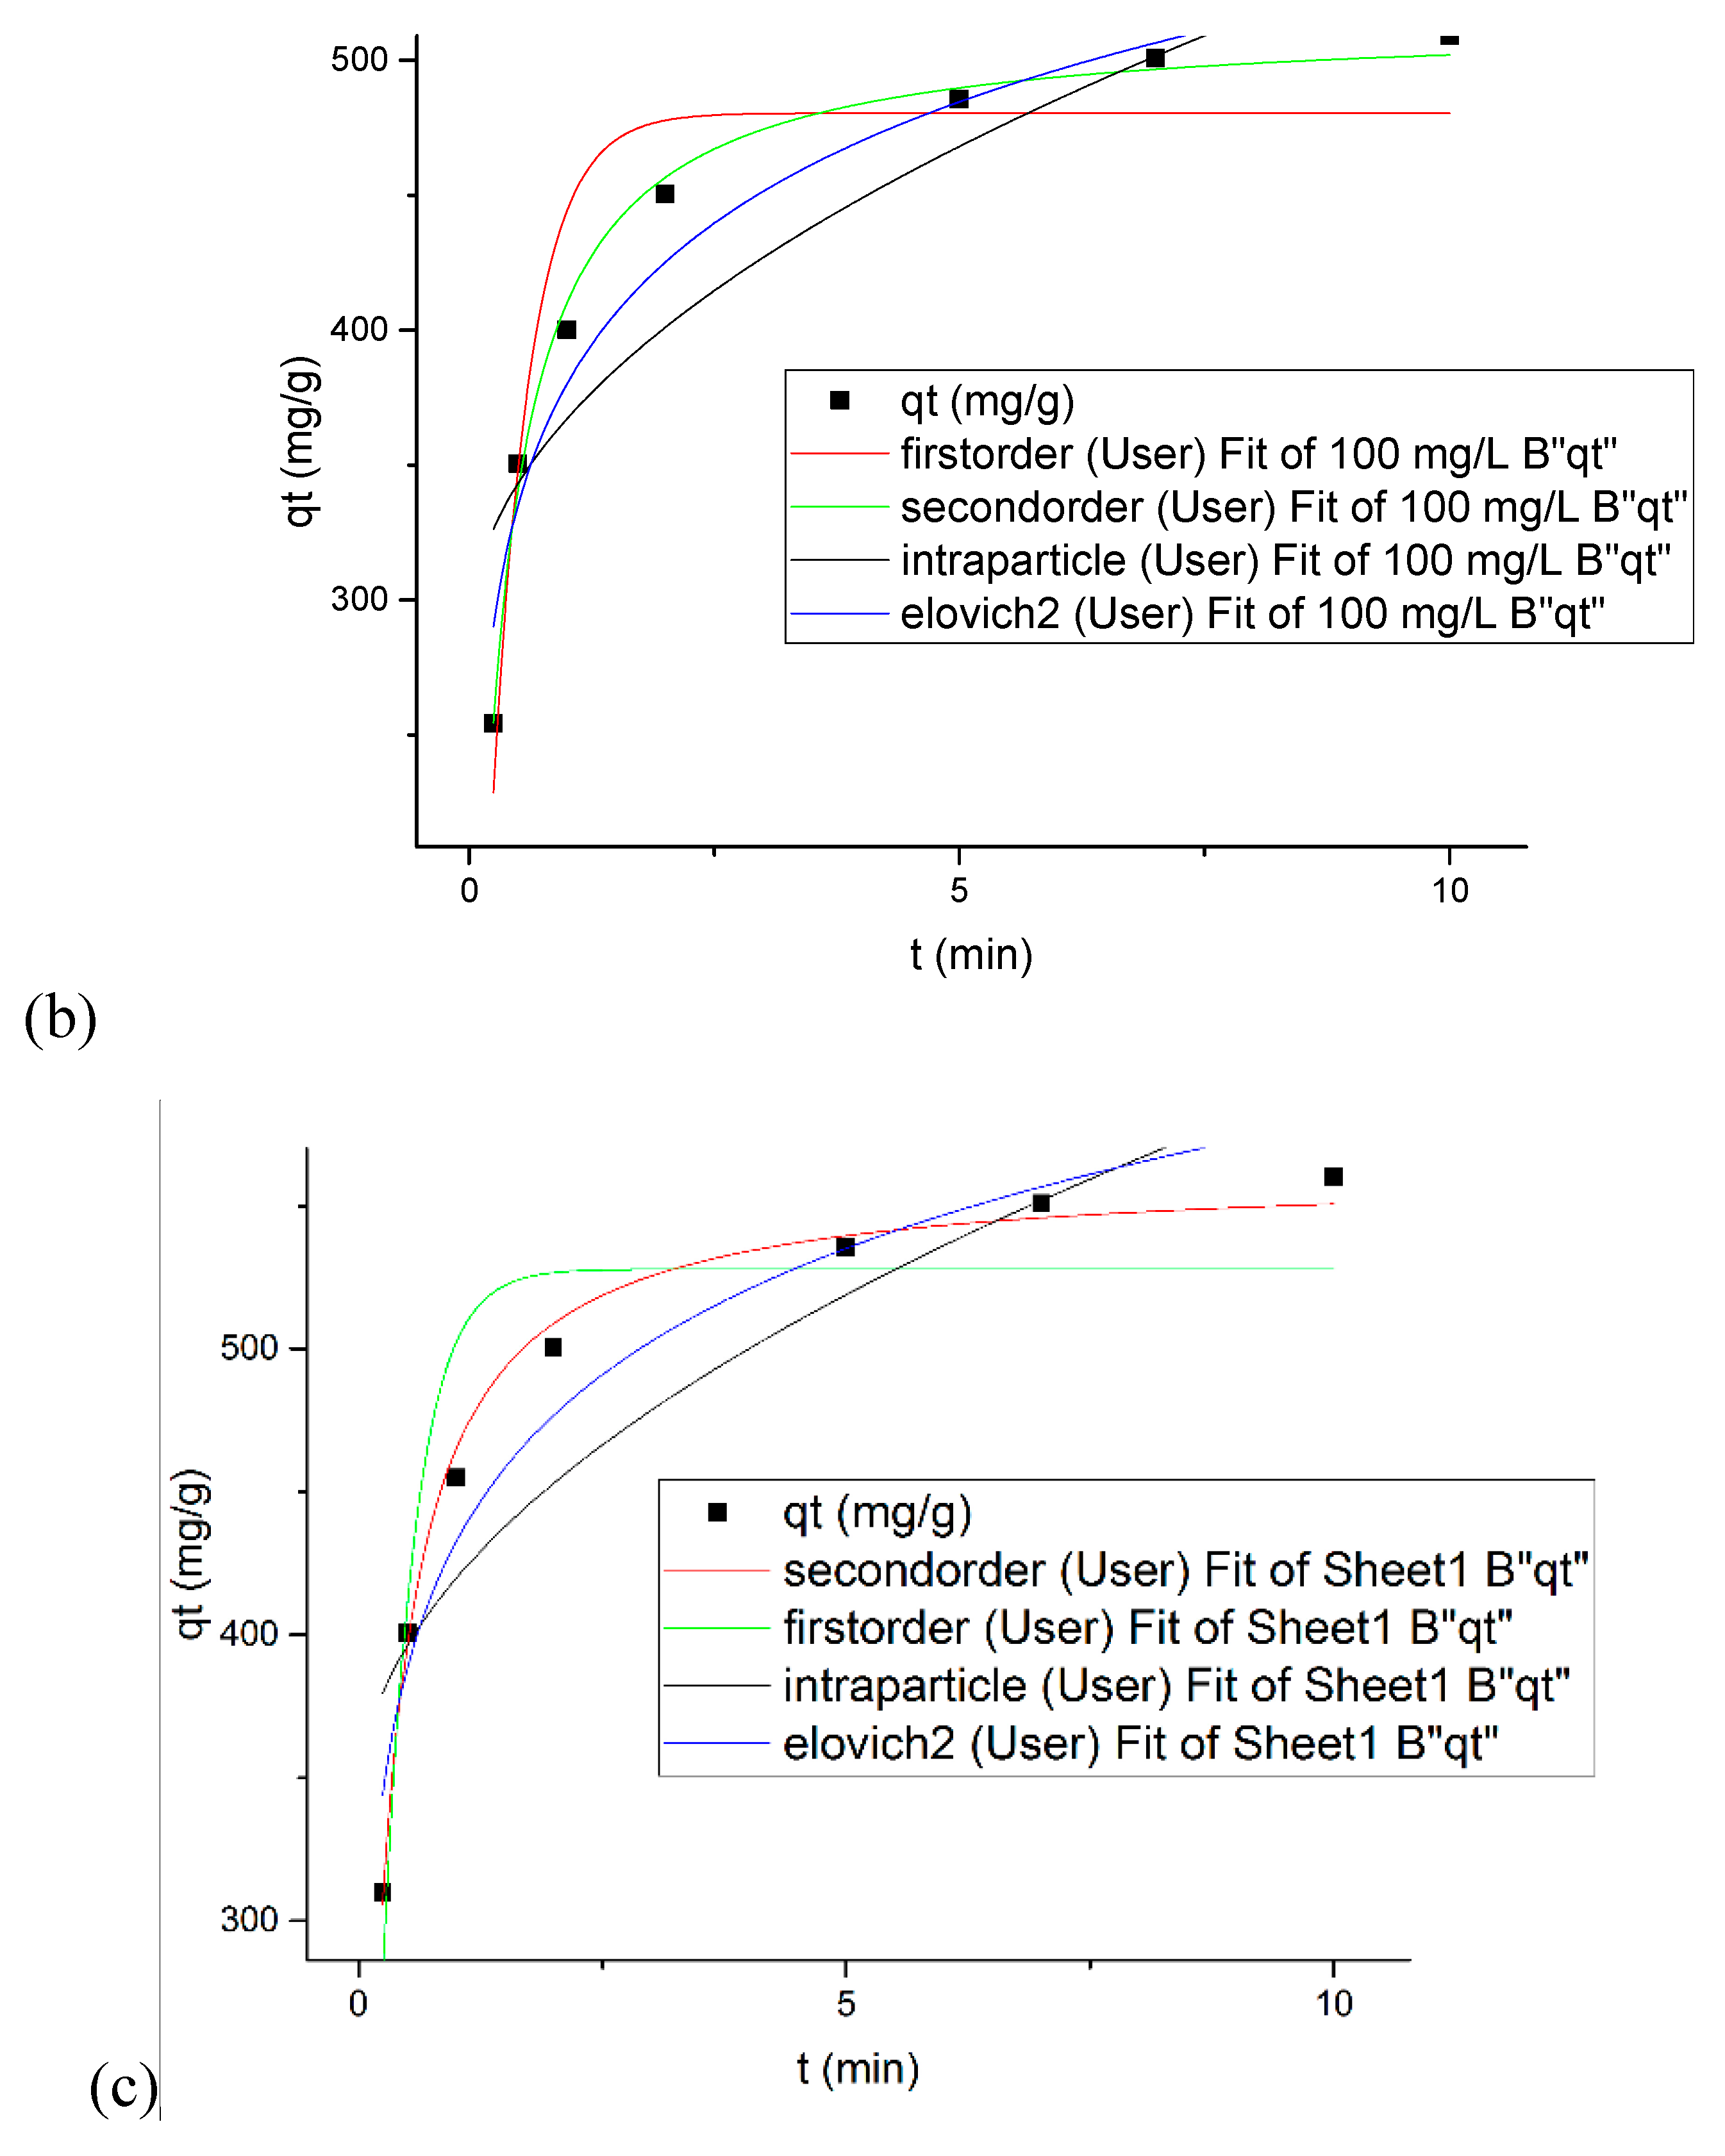
Table 8. Fitting plots of CIP adsorption capacity (q
t) of ZIF against time (t) are shown in
Figure 6. Pseudo-second-order model was found to be the best fitting model because it provided the highest determination coefficients (R
2 ≥ 0.992) in comparison with the others in all of CIP initial concentration. In addition, the maximum adsorption capacity of ZIF predicted by the pseudo-second-order model (514.8 mg/g) is closer to experimental ones (509.06 mg/g) when compared with those calculated by other models. Rate constant values of pseudo-second-order model (k
2) decreased with an increasing initial concentration of CIP, suggesting that the adsorption rate decreased as CIP concentration increased [
21].
The effect of mechanical mixing and sonication on CIP adsorption was studied by performing the kinetic experiments under the magnetic string at an initial concentration of CIP 50 and 100 mg·L
−1 and in an ultrasonic bath at an initial concentration of CIP 100 mg·L
−1. As seen in
Table 8, experimental q
e and rate constant of the pseudo-second-order model in the ultrasonic bath were higher than those reported under mechanical mixing. The formation of micro jets and high-pressure zones during the sonication could promote the migration of CIP molecules into the nano-sized pores of ZIF-67-SO
4. Similar findings were also obtained for the removal of blueberry anthocyanins [
26], congo red [
27], phosphate [
28], and different dyes [
29]. Studies also demonstrated that sonication can be used as a modifier to promote the structural properties of adsorbents to reach higher capacity for target contaminants [
30,
31].
3.8. Thermodynamic of Adsorption
All the chemical, physical, and biological processes could be influenced by the temperature of the environment in which they occur. The thermodynamic study aimed to investigate the feasibility of process progressiveness by studying changes in environmental temperature. Thermodynamic parameters also reveal the nature of adsorption in term of physisorption or chemo-sorption. The description of a sorption behavior in a thermodynamic study could be done by using the most widely used standard enthalpy (∆H°), standard entropy (∆S°), and Gibb’s free energy (∆G°) which are obtainable using the Van’t Hoff plot (Ln K
0 vs 1/T) according to the following:
where R and T are universal gas constant (8.314 J/mol·K) and temperature (K), respectively. Thermodynamic parameters for CIP removal under different temperature are presented in
Table 9. The negative values for ∆G° reveal the spontaneous nature of adsorption. Decreasing the CIP removal by temperature and the positive sign of ∆H° and ∆S° present the endothermic nature of adsorption. Furthermore, the absolute ∆G° in the table is higher than 40 kJ/mol, indicating that chemisorption is the predominant mechanism for the CIP adsorption [
32,
33].
3.9. ZIF-67-SO4 Structural Stability
Due to the presence of cobalt in the structure of ZIF-67, levels of this heavy metal may be present in treated waters. Thus, it is crucial to investigate the level of cobalt leach in the solution. Cobalt concentration in the treated water also could provide an indirect indication for the structural stability of ZIF-67-SO
4 under environmental agitation. The stability test was conducted under different initial pH for 30 and 60 min under conventional mechanical agitation and sonication at 35 KHz.
Figure 7 shows the concentration of Co ions in the final solution when ZIF-67-SO
4 was applied to the solutions. As expected, the concentration of Co ions increased dramatically by increasing the corrosiveness as a result of higher H
+ in low pH. Our previously published work showed that ZIFs were completely dissolved in strong acidic environments (with a pH of about 3) [
28]. Moreover, the concentration of Co ions increases by mixing time (~30–60 min), which may be attributed to an increased opportunity for metal ions to leach from the ZIF-67-SO
4 structure. As
Figure 7 shows, sonication could result in much higher Co ions when compared with conventional mixing. This could be attributed to higher shear forces during sonication which results in de-agglomeration of crystals and the probable break-down in the structure of ZIF-67-SO
4 [
26,
27].
4. Conclusions
Environmental pollution with antibiotics poses great concerns to both humans and the ecosystem. Control of ciprofloxacin as a toxic, bio-accumulative, and persistent antibiotic is crucial for the pharmaceutical industry. Herein, the potential of nine members of MOFs for ciprofloxacin (CIP) removal was investigated and observed to be in the order of ZIF-67-SO4 ˃ ZIF-67-Cl > ZIF-8-NO3 > ZIF-8 leaf > ZIF-8 octahedron > ZIF-8-OAc > ZIF-8-cube > and UIO-66. A prediction model for CIP removal was developed by performing the experiments according to BBD. Optimization of the model yield the highest CIP removal (99.2%) to occur at 6.82, 832.4 mg/L, and 39.95 min for adsorbent dose, pH, and agitation time, respectively. Among nonlinear form of two-parameter and three-parameter isotherm models, the Langmuir model described the data well according to SSE, R2Adj, and x2. The maximum adsorption capacity of the adsorbent was 2.537 g/g according to the Langmuir model. Kinetic constants were improved in the sonication at 35 KHz when compared with mechanical agitation mode, and in both cases followed the pseudo-second-order model. The level of cobalt leached from ZIF-67-SO4 was influenced by solution pH, mixing time, agitation type, and was observed to be in the range of 1.2–4.5 mg/L. Thermodynamic parameters (minus signs of ∆G° (7.8 to 14.2), positive signs of ∆H° (58.9 KJ/mol), and ∆S° (0.23 KJ/mol·K)) demonstrate the spontaneous, endothermic, and chemisorption nature of the process. In short, ZIF-67-SO4 shows outstanding capacity and excellent affinity toward CIP and thus is a promising candidate for preventing CIP discharge into the aquatic environment.
Supplementary Materials
The following are available online at
https://www.mdpi.com/2079-4991/9/10/1422/s1, Table S1: Adequacy of the model tested, Table S2: Analysis of variance (ANOVA) for CIP removal by ZIF-67-SO4, Table S3: Nonlinear isotherm models and their parameters.
Author Contributions
Conceptualization, methodology supervision, writing—original draft preparation, M.S.; investigation, software, data curation, A.D.; resources, formal analysis, validation, M.Y.; writing—review and editing, S.R., A.A.M.; visualization, funding acquisition, project administration, A.A.N.”
Funding
The authors would like to appreciate the financial support provided by Mashhad University of Medical Sciences under grant number 961098.
Conflicts of Interest
The authors declare no conflict of interest.
References
- Hasan, Z.; Khan, N.A.; Jhung, S.H. Adsorptive removal of diclofenac sodium from water with Zr-based metal–organic frameworks. Chem. Eng. J. 2016, 284, 1406–1413. [Google Scholar] [CrossRef]
- Gao, Q.; Xu, J.; Bu, X.-H. Recent advances about metal–organic frameworks in the removal of pollutants from wastewater. Coord. Chem. Rev. 2019, 378, 17–31. [Google Scholar] [CrossRef]
- Yu, F.; Sun, S.; Han, S.; Zheng, J.; Ma, J. Adsorption removal of ciprofloxacin by multi-walled carbon nanotubes with different oxygen contents from aqueous solutions. Chem. Eng. J. 2016, 285, 588–595. [Google Scholar] [CrossRef]
- Wang, F.; Yang, B.; Wang, H.; Song, Q.; Tan, F.; Cao, Y. Removal of ciprofloxacin from aqueous solution by a magnetic chitosan grafted graphene oxide composite. J. Mol. Liq. 2016, 222, 188–194. [Google Scholar] [CrossRef]
- Abu Tarboush, B.J.; Chouman, A.; Jonderian, A.; Ahmad, M.; Hmadeh, M.; Al-Ghoul, M. Metal–Organic Framework-74 for Ultratrace Arsenic Removal from Water: Experimental and Density Functional Theory Studies. ACS Appl. Nano Mater. 2018, 1, 3283–3292. [Google Scholar] [CrossRef]
- Zhu, X.-H.; Yang, C.-X.; Yan, X.-P. Metal-organic framework-801 for efficient removal of fluoride from water. Microporous Mesoporous Mater. 2018, 259, 163–170. [Google Scholar] [CrossRef]
- Ayati, A.; Shahrak, M.N.; Tanhaei, B.; Sillanpää, M. Emerging adsorptive removal of azo dye by metal–organic frameworks. Chemosphere 2016, 160, 30–44. [Google Scholar] [CrossRef]
- Ezugwu, C.I.; Asraf, M.A.; Li, X.; Liu, S.; Kao, C.-M.; Zhuiykov, S.; Verpoort, F. Selective and adsorptive removal of anionic dyes and CO2 with azolium-based metal-organic frameworks. J. Colloid Interface Sci. 2018, 519, 214–223. [Google Scholar] [CrossRef]
- Lin, S.; Song, Z.; Che, G.; Ren, A.; Li, P.; Liu, C.; Zhang, J. Adsorption behavior of metal–organic frameworks for methylene blue from aqueous solution. Microporous Mesoporous Mater. 2014, 193, 27–34. [Google Scholar] [CrossRef]
- Liu, B.; Yang, F.; Zou, Y.; Peng, Y. Adsorption of Phenol and p-Nitrophenol from Aqueous Solutions on Metal–Organic Frameworks: Effect of Hydrogen Bonding. J. Chem. Eng. Data 2014, 59, 1476–1482. [Google Scholar] [CrossRef]
- Dehghan, A.; Zarei, A.; Jaafari, J.; Shams, M.; Mousavi Khaneghah, A. Tetracycline removal from aqueous solutions using zeolitic imidazolate frameworks with different morphologies: A mathematical modeling. Chemosphere 2019, 217, 250–260. [Google Scholar] [CrossRef] [PubMed]
- Zhou, H.-C.; Long, J.R.; Yaghi, O.M. Introduction to Metal–Organic Frameworks. Chem. Rev. 2012, 112, 673–674. [Google Scholar] [CrossRef] [PubMed]
- Zhang, B.; Han, X.; Gu, P.; Fang, S.; Bai, J. Response surface methodology approach for optimization of ciprofloxacin adsorption using activated carbon derived from the residue of desilicated rice husk. J. Mol. Liq. 2017, 238, 316–325. [Google Scholar] [CrossRef]
- Guo, X.; Xing, T.; Lou, Y.; Chen, J. Controlling ZIF-67 crystals formation through various cobalt sources in aqueous solution. J. Solid State Chem. 2016, 235, 107–112. [Google Scholar] [CrossRef]
- Massoudinejad, M.; Shahsavani, A.; Kamarehie, B.; Jafari, A.; Ghaderpoori, M.; Amini, M.M.; Ghaderpoury, A. Highly efficient adsorption of fluoride from aqueous solution by metal organic frameworks modeling, isotherms, and kinetics. Fluoride 2018, 51, 355–365. [Google Scholar]
- Liu, B.; Jian, M.; Liu, R.; Yao, J.; Zhang, X. Highly efficient removal of arsenic(III) from aqueous solution by zeolitic imidazolate frameworks with different morphology. Colloids Surf. A 2015, 481, 358–366. [Google Scholar] [CrossRef]
- Ghadiri, S.K.; Nasseri, S.; Nabizadeh, R.; Khoobi, M.; Nazmara, S.; Mahvi, A.H. Adsorption of nitrate onto anionic bio-graphene nanosheet from aqueous solutions: Isotherm and kinetic study. J. Mol. Liq. 2017, 242, 1111–1117. [Google Scholar] [CrossRef]
- Dehghani, M.H.; Zarei, A.; Mesdaghinia, A.; Nabizadeh, R.; Alimohammadi, M.; Afsharnia, M. Response surface modeling, isotherm, thermodynamic and optimization study of arsenic (V) removal from aqueous solutions using modified bentonite-chitosan (MBC). Korean J. Chem. Eng. 2017, 34, 757–767. [Google Scholar] [CrossRef]
- Dehghani, M.H.; Dehghan, A.; Alidadi, H.; Dolatabadi, M.; Mehrabpour, M.; Converti, A. Removal of methylene blue dye from aqueous solutions by a new chitosan/zeolite composite from shrimp waste: Kinetic and equilibrium study. Korean J. Chem. Eng. 2017, 34, 1699–1707. [Google Scholar] [CrossRef]
- Bhadra, B.N.; Jhung, S.H. A remarkable adsorbent for removal of contaminants of emerging concern from water: Porous carbon derived from metal azolate framework-6. J. Hazard. Mater. 2017, 340, 179–188. [Google Scholar] [CrossRef]
- Goudarzi, G.; Geravandi, S.; Mohammadi, M.J.; Vosoughi, M.; Angali, K.A.; Zallaghi, E.; Neisi, A.K.; Saeidimehr, S.; Mohammadi, B. Total number of deaths and respiratory mortality attributed to particulate matter (PM 10) in Ahvaz, Iran during 2009. Int. J. Environ. Health Eng. 2015, 4, 33. [Google Scholar]
- Peng, X.; Hu, F.; Lam, F.L.Y.; Wang, Y.; Liu, Z.; Dai, H. Adsorption behavior and mechanisms of ciprofloxacin from aqueous solution by ordered mesoporous carbon and bamboo-based carbon. J. Colloid Interface Sci. 2015, 460, 349–360. [Google Scholar] [CrossRef] [PubMed]
- Dehghani, M.H.; Dehghan, A.; Najafpoor, A. Removing Reactive Red 120 and 196 using chitosan/zeolite composite from aqueous solutions: Kinetics, isotherms, and process optimization. J. Ind. Eng. Chem. 2017, 51, 185–195. [Google Scholar] [CrossRef]
- Rangabhashiyam, S.; Anu, N.; Giri Nandagopal, M.S.; Selvaraju, N. Relevance of isotherm models in biosorption of pollutants by agricultural byproducts. J. Environ. Chem. Eng. 2014, 2, 398–414. [Google Scholar] [CrossRef]
- Hameed, B.H.; Din, A.T.M.; Ahmad, A.L. Adsorption of methylene blue onto bamboo-based activated carbon: Kinetics and equilibrium studies. J. Hazard. Mater. 2007, 141, 819–825. [Google Scholar] [CrossRef] [PubMed]
- Wu, Y.; Han, Y.; Tao, Y.; Fan, S.; Chu, D.-T.; Ye, X.; Ye, M.; Xie, G. Ultrasound assisted adsorption and desorption of blueberry anthocyanins using macroporous resins. Ultrason. Sonochem. 2018, 48, 311–320. [Google Scholar] [CrossRef] [PubMed]
- Dil, E.A.; Ghaedi, M.; Asfaram, A.; Bazrafshan, A.A. Ultrasound wave assisted adsorption of congo red using gold-magnetic nanocomposite loaded on activated carbon: Optimization of process parameters. Ultrason. Sonochem. 2018, 46, 99–105. [Google Scholar] [CrossRef]
- Shams, M.; Dehghani, M.H.; Nabizadeh, R.; Mesdaghinia, A.; Alimohammadi, M.; Najafpoor, A.A. Adsorption of phosphorus from aqueous solution by cubic zeolitic imidazolate framework-8: Modeling, mechanical agitation versus sonication. J. Mol. Liq. 2016, 224, 151–157. [Google Scholar] [CrossRef]
- Dastkhoon, M.; Ghaedi, M.; Asfaram, A.; Goudarzi, A.; Mohammadi, S.M.; Wang, S. Improved adsorption performance of nanostructured composite by ultrasonic wave: Optimization through response surface methodology, isotherm and kinetic studies. Ultrason. Sonochem. 2017, 37, 94–105. [Google Scholar] [CrossRef]
- Li, P.; Liu, C.; Zhang, L.; Zheng, S.; Zhang, Y. Enhanced boron adsorption onto synthesized MgO nanosheets by ultrasonic method. Ultrason. Sonochem 2017, 34, 938–946. [Google Scholar] [CrossRef]
- Dotto, G.L.; Santos, J.M.N.; Rodrigues, I.L.; Rosa, R.; Pavan, F.A.; Lima, E.C. Adsorption of Methylene Blue by ultrasonic surface modified chitin. J. Colloid Interface Sci. 2015, 446, 133–140. [Google Scholar] [CrossRef] [PubMed]
- Li, H.; Zhang, D.; Han, X.; Xing, B. Adsorption of antibiotic ciprofloxacin on carbon nanotubes: pH dependence and thermodynamics. Chemosphere 2014, 95, 150–155. [Google Scholar] [CrossRef] [PubMed]
- Mutavdžić Pavlović, D.; Ćurković, L.; Grčić, I.; Šimić, I.; Župan, J. Isotherm, kinetic, and thermodynamic study of ciprofloxacin sorption on sediments. Environ. Sci. Pollut. Res. Int. 2017, 24, 10091–10106. [Google Scholar] [CrossRef] [PubMed]
Figure 1.
Characteristics of the as-synthesized MOFs: scanning electron microscope (SEM) image of MOFs; (a) ZIF-67-OAC, (b) ZIF-67-Cl, (c) ZIF-67-NO3, (d) ZIF-67-SO4, (e) ZIF-8-Cuboid, (f) ZIF-8-Leaf, (g) ZIF-8-Cube, (h) ZIF-8-Octahedron, (i) UIO-66, (j) x-ray diffraction (XRD) pattern.
Figure 1.
Characteristics of the as-synthesized MOFs: scanning electron microscope (SEM) image of MOFs; (a) ZIF-67-OAC, (b) ZIF-67-Cl, (c) ZIF-67-NO3, (d) ZIF-67-SO4, (e) ZIF-8-Cuboid, (f) ZIF-8-Leaf, (g) ZIF-8-Cube, (h) ZIF-8-Octahedron, (i) UIO-66, (j) x-ray diffraction (XRD) pattern.
Figure 2.
Removal efficiency and adsorption capacity of as-synthesized MOFs for CIP (CIP: 62.5 mg/L, MOF: 0.5 g/L, time: 30 min).
Figure 2.
Removal efficiency and adsorption capacity of as-synthesized MOFs for CIP (CIP: 62.5 mg/L, MOF: 0.5 g/L, time: 30 min).
Figure 3.
Experimental versus predicted removal values for CIP adsorption onto ZIF-67-SO4.
Figure 3.
Experimental versus predicted removal values for CIP adsorption onto ZIF-67-SO4.
Figure 4.
Effect of sorption variables on CIP removal: (a) the effect of MOF and CIP concentration, (b) MOF and pH, (c) MOF and agitation time.
Figure 4.
Effect of sorption variables on CIP removal: (a) the effect of MOF and CIP concentration, (b) MOF and pH, (c) MOF and agitation time.
Figure 5.
Nonlinear plots of isotherm models used for adsorption of CIP.
Figure 5.
Nonlinear plots of isotherm models used for adsorption of CIP.
Figure 6.
Nonlinear plots of kinetic models used for adsorption of CIP (a) 50 mg/L, (b) 100 mg/ L, (c) 100 mg/L sonication.
Figure 6.
Nonlinear plots of kinetic models used for adsorption of CIP (a) 50 mg/L, (b) 100 mg/ L, (c) 100 mg/L sonication.
Figure 7.
Leaching of Co from ZIF-67-SO4 structure as a function of time, pH, and mixing type.
Figure 7.
Leaching of Co from ZIF-67-SO4 structure as a function of time, pH, and mixing type.
Table 1.
Structural and chemical properties of ciprofloxacin and its pKa [
3,
13].
Table 1.
Structural and chemical properties of ciprofloxacin and its pKa [
3,
13].
Ciprofloxacin Structure | Molecular Formula | pKa |
---|
| C17H18FN3O3 | pKa1 = 5.9 |
pKa2 = 8.9 |
Table 2.
Summary of synthesis condition and structural properties of as-synthesized metal-organic frameworks (MOFs).
Table 2.
Summary of synthesis condition and structural properties of as-synthesized metal-organic frameworks (MOFs).
MOFs | Ligand | Metal Source | Ligand/ Metal Mole Ratio | Structural Morphology | BET Surface Area (m2/g) | Total Pore Volume (cm3/g) |
---|
UIO-66 | Terephthalic acid | ZrCl4 | 1 | Plate | 765 | 0.44 |
ZIF-67 | 2-methylimidazole | Co(NO3)2 | 20 | Granular | 734 | 0.34 |
2-methylimidazole | Co(OAC)2 | 20 | Rhombic Dodecahedron | 1323 | 0.57 |
2-methylimidazole | CoSO4 | 20 | Rhombic Dodecahedron | 1375 | 0.62 |
2-methylimidazole | CoCl2 | 20 | Rhombic Dodecahedron | 1278 | 0.52 |
ZIF-8 | 2-methylimidazole | Zn(NO3)2 | 29.4 | Octahedron | 1151.2 | 0.58 |
2-methylimidazole | Zn(OAc)2 | 7.9 | Leaf | 12.7 | 0.04 |
2-methylimidazole | Zn(NO3)2 | 7.9 | Cuboid | 890.4 | 0.48 |
2-methylimidazole | Zn(NO3)2 | 2 | Cube | 978 | 0.51 |
Table 3.
Experimental range and levels of independent variables.
Table 3.
Experimental range and levels of independent variables.
Factor | Variable Level |
---|
Code | −1 | 0 | +1 |
---|
contact time (min) | X1 | 2 | 16 | 30 |
MOF dosage (g/L) | X2 | 0.1 | 0.55 | 1 |
pH | X3 | 4 | 7.5 | 11 |
ciprofloxacin (mg/L) | X4 | 30 | 62.5 | 100 |
Table 4.
BBD design and removal levels for ciprofloxacin (CIP).
Table 4.
BBD design and removal levels for ciprofloxacin (CIP).
Run No. | Coded Variable | Response (% Removal) | Run No | Coded Variable | Response (% Removal) |
---|
X1 | X2 | X3 | X4 | Observed | Predicted | X1 | X2 | X3 | X4 | Observed | Predicted |
---|
1 | −1 | 1 | 0 | 0 | 80 | 81 | 16 | 1 | 0 | 0 | −1 | 97 | 100 |
2 | −1 | −1 | 0 | 0 | 73 | 68.2 | 17 | −1 | 0 | 0 | 1 | 70 | 68.9 |
3 | 0 | 1 | −1 | 0 | 79 | 79.7 | 18 | 0 | 0 | 0 | 0 | 94 | 96 |
4 | 1 | 0 | 1 | 0 | 75 | 73.6 | 19 | 0 | 1 | 0 | 1 | 79 | 79 |
5 | 0 | 1 | 1 | 0 | 65 | 62.7 | 20 | 1 | 0 | −1 | 0 | 77 | 77.5 |
6 | 0 | 0 | 1 | 1 | 48 | 50.4 | 21 | 1 | −1 | 0 | 0 | 96 | 92.5 |
7 | 0 | −1 | 0 | 1 | 74 | 76.6 | 22 | 0 | 0 | 0 | 0 | 95 | 96 |
8 | 0 | 1 | 0 | −1 | 98 | 96.2 | 23 | 0 | 0 | 1 | −1 | 65 | 65.1 |
9 | 0 | 0 | 0 | 0 | 95 | 96 | 24 | −1 | 0 | −1 | 0 | 71 | 73.3 |
10 | −1 | 0 | 1 | 0 | 41 | 41.1 | 25 | −1 | 0 | 0 | −1 | 76 | 78.4 |
11 | 1 | 1 | 0 | 0 | 91 | 93.4 | 26 | 0 | 0 | −1 | −1 | 86 | 81.2 |
12 | 0 | −1 | −1 | 0 | 70 | 73.9 | 27 | 0 | 0 | −1 | 1 | 73 | 70.4 |
13 | 0 | 0 | 0 | 0 | 97 | 96 | 28 | 1 | 0 | 0 | 1 | 85 | 84 |
14 | 0 | −1 | 1 | 0 | 54 | 54.8 | 29 | 0 | −1 | 0 | −1 | 84 | 84.9 |
15 | 0 | 0 | 0 | 0 | 99 | 96 | - | - | - | - | - | - | - |
Table 5.
Estimated coefficients of the fitted polynomial model for CIP adsorption onto ZIF-67-SO4.
Table 5.
Estimated coefficients of the fitted polynomial model for CIP adsorption onto ZIF-67-SO4.
Model Term | Coefficient Estimate | Std. Error | t-Value | p-Value |
---|
Intercept | 96.02 | 1.47 | 65.30 | <0.0001 |
| 9.18 | 0.95 | 9.68 | 1.40 × 10⁻⁷ |
| 3.42 | 0.95 | 3.60 | 0.0028997 |
| −9.03 | 0.95 | −9.51 | 1.74 × 10⁻⁷ |
| −6.38 | 0.95 | −6.72 | 9.84 × 10⁻⁶ |
| −3.00 | 1.64 | −1.82 | 0.0894262 |
| 7.08 | 1.64 | 4.30 | 0.0007283 |
| −1.63 | 1.64 | −0.99 | 0.3396952 |
| 0.50 | 1.64 | 0.30 | 0.7654894 |
| −2.25 | 1.64 | −1.37 | 0.1926667 |
| −1.00 | 1.64 | −0.61 | 0.5527336 |
| −6.82 | 1.29 | −5.28 | 0.000116 |
| −5.42 | 1.29 | −4.20 | 0.0008955 |
| −22.83 | 1.29 | −17.69 | 5.66 × 10⁻¹¹ |
| −6.41 | 1.29 | −4.96 | 0.0002087 |
Table 6.
Optimum values for each independent variable.
Table 6.
Optimum values for each independent variable.
Factor | Time (min) | MOF Dose (g/L) | pH | CIP (mg/L) | Removal (%) |
---|
Predicted | Experimental |
---|
Value | 30 | 0.22 | 7.31 | 100 | 100 | 99.9 |
Table 7.
The values of isotherm parameters.
Table 7.
The values of isotherm parameters.
Isotherm | Parameters | Values |
---|
Langmuir | b (L/mg) | 1.89166 |
qe (mg/g) | 2537.52777 |
χ2 | 3024.69308 |
SSE | 12,098.77233 |
| 0.99567 |
Freundlich | Kf (mg/g)/(mg)1/n | 1345.1812 |
n | 2.69053 |
χ2 | 30,900.26595 |
SSE | 123,601.06379 |
| 0.9558 |
Jovanovic | qm (mg·g−1) | 2256.44168 |
Kj (L·mg−1) | −1.64853 |
χ2 | 4439.2249 |
SSE | 17,756.89959 |
| 0.99365 |
Temkin | AT (L/mg) | 31.62846 |
bT | 447.91592 |
B (J/mol) | - |
χ2 | 15,237.21971 |
SSE | 60,948.87886 |
| 0.9782 |
Sips | qms (mg/g) | 2593.86316 |
KS (L/mg)ms | 1.71831 |
ms | 0.94708 |
χ2 | 3786.66401 |
SSE | 11,359.99203 |
| 0.99458 |
Toth | KT | 2577.35956 |
AT | 0.52871 |
TT | 0.94943 |
χ2 | 3995.17545 |
SSE | 11,985.52634 |
| 0.99428 |
Khan | qs (mg/g) | 2772.45949 |
bK | 1.67977 |
aK | 1.03572 |
χ2 | 3999.75536 |
SSE | 11,999.26609 |
| 0.99428 |
Table 8.
Kinetic values of CIP adsorption onto ZIF.
Table 8.
Kinetic values of CIP adsorption onto ZIF.
Concentration (mg/L) | 50 | 100 | 100 |
---|
Agitation Type | Magnetic Stirrer | Sonication |
qe, exp (mg/g) | 256.4 | 509.06 | 560 |
Pseudo-First Order |
qe (mg/g) | 6.13223 | 480.42467 | 527.8629 |
k1 (min−1) | 2.51783 | 2.58553 | 3.0163 |
χ2 | 156.19152 | 918.66385 | 1109.7541 |
SSE | 780.95761 | 4593.31927 | 5548.7708 |
| 0.93144 | 0.89479 | 0.86801 |
Pseudo-Second Order |
qe (mg/g) | 258.37326 | 514.80069 | 562.129 |
k2 (g/mg·min) | 0.01483 | 0.0076 | 0.00849 |
χ2 | 16.21654 | 62.69378 | 65.9758 |
SSE | 81.08269 | 313.4689 | 329.8794 |
| 0.99288 | 0.99282 | 0.99215 |
Intraparticle Diffusion |
k3 | 40.94423 | 81.66703 | 80.3091 |
C | 142.60978 | 285.45518 | 339.36581 |
χ2 | 618.10256 | 2061.48156 | 1950.1885 |
SSE | 3090.51278 | 10,307.40782 | 9750.9426 |
| 0.72867 | 0.76391 | 0.7680 |
Elovich |
a | 10,708.00341 | 22,609.6118 | 56,005.9375 |
b | 0.03048 | 0.0154 | 0.0156 |
χ2 | 214.18997 | 605.792 | 558.3242 |
SSE | 1070.94984 | 3028.9600 | 2791.6209 |
| 0.90598 | 0.9306 | 0.9335 |
Table 9.
Thermodynamic parameters for CIP adsorption by ZIF-67-SO4.
Table 9.
Thermodynamic parameters for CIP adsorption by ZIF-67-SO4.
Temperature K | Ce mg/L | −∆G° kJ/mol | ∆H° KJ/mol | ∆S° KJ/mol.K |
---|
293 | 3.65 | 7.88 | 58.9 | 0.23 |
303 | 2.55 | 9.12 |
313 | 0.7 | 12.88 |
323 | 0.5 | 14.2 |
© 2019 by the authors. Licensee MDPI, Basel, Switzerland. This article is an open access article distributed under the terms and conditions of the Creative Commons Attribution (CC BY) license (http://creativecommons.org/licenses/by/4.0/).