3.2. Rotational Rheology
In this section, scrutiny of the rotational tests and non-linear behavior of the designed nanofluids are presented. Thus, the obtained experimental flow curves at different concentrations and temperatures are analyzed.
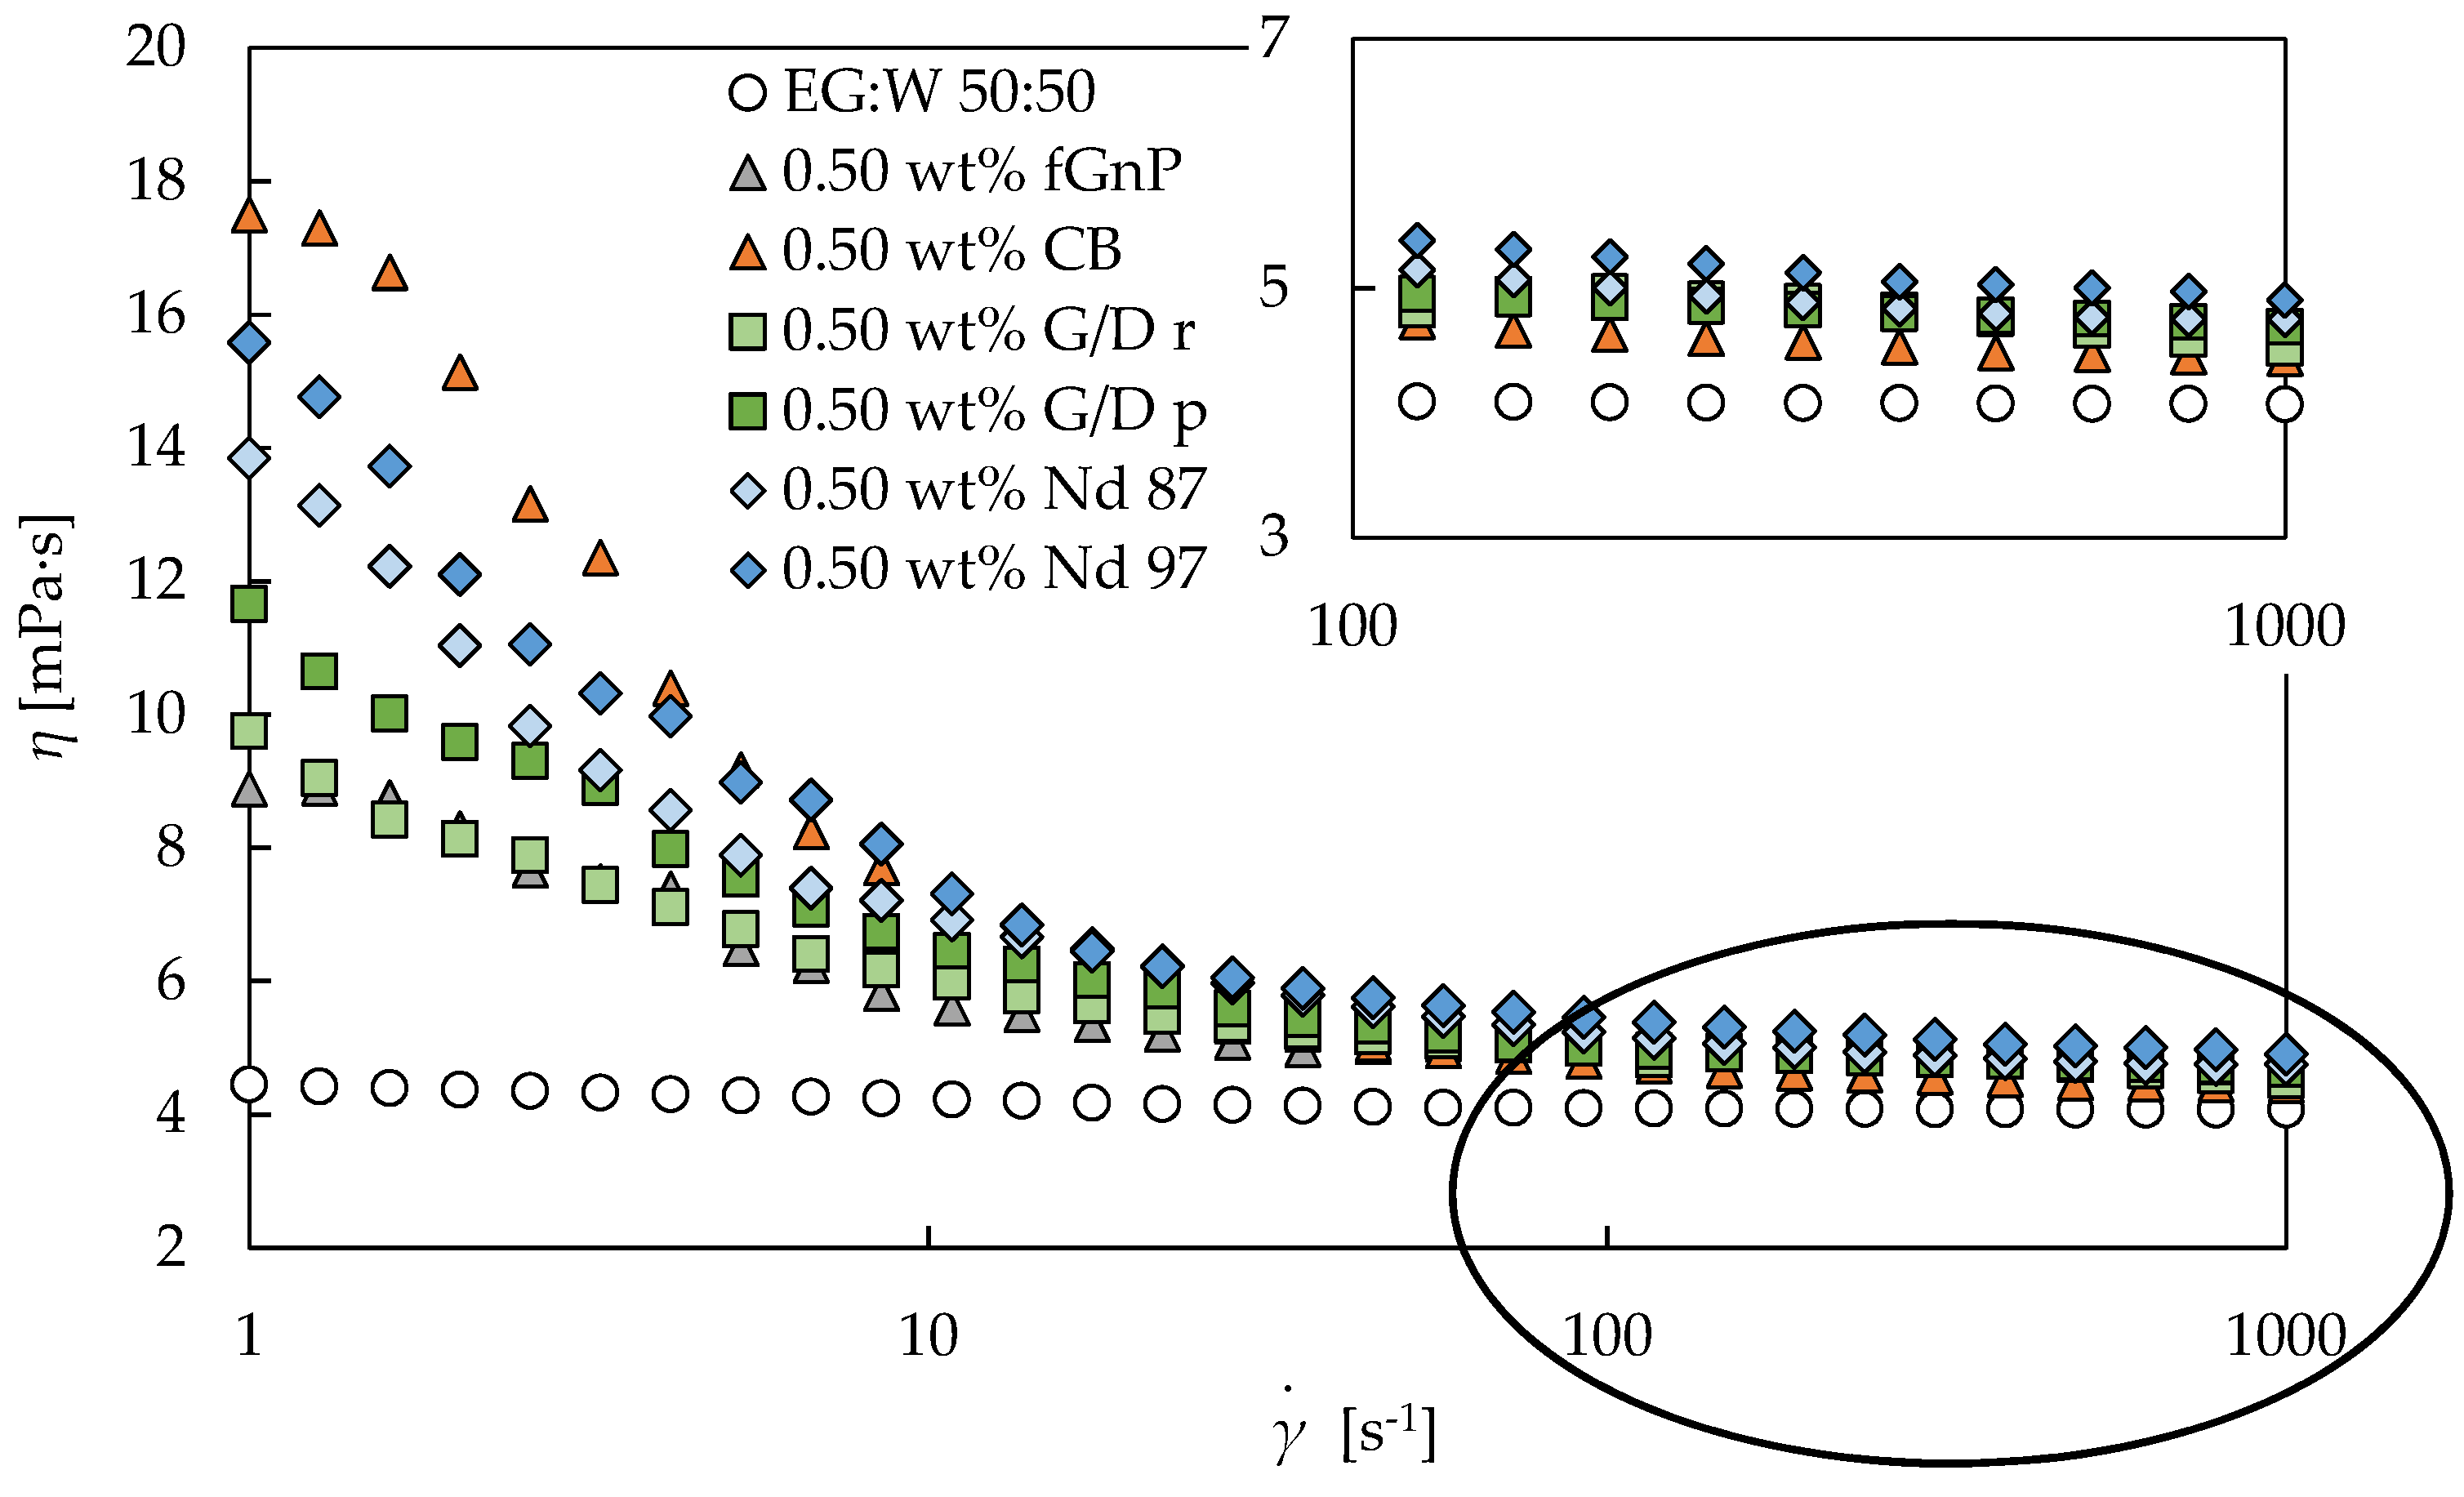
Figure 3 shows the obtained data for the base fluid and six different nanofluid sets for the 0.50 wt% nanoadditives concentration at 293.15 K, as an example.
Figure 3 presents the non-Newtonian shear thinning or pseudoplastic behavior observed for all nanofluids at low shear rates in contrast to the well-known Newtonian behavior of the base fluid, EG:W 50:50 vol%. It can be observed that the first Newtonian plateau at the lowest shear rates is not appreciated for the different-phase Nd and the different-pure G/d nanofluids, while an incipient Newtonian region can be observed for the CB and fGnP nanofluids. The same behavior was detected for all the analyzed concentrations and temperatures. The appearance of shear thinning behavior for nanoadditive dispersions in Newtonian base fluids has been explained in the literature by the modifications in the arrangement of the involved agglomerates or particles [
48,
49,
50]. According to this, some agglomerates of nanoadditives could break once oriented in the flow direction of the shear, reducing the quantity of bound solvent among the nanoparticles. Thus, the interaction forces could then be weaker, decreasing the flow resistance and, consequently, the apparent viscosity of the dispersion [
48,
49,
50].
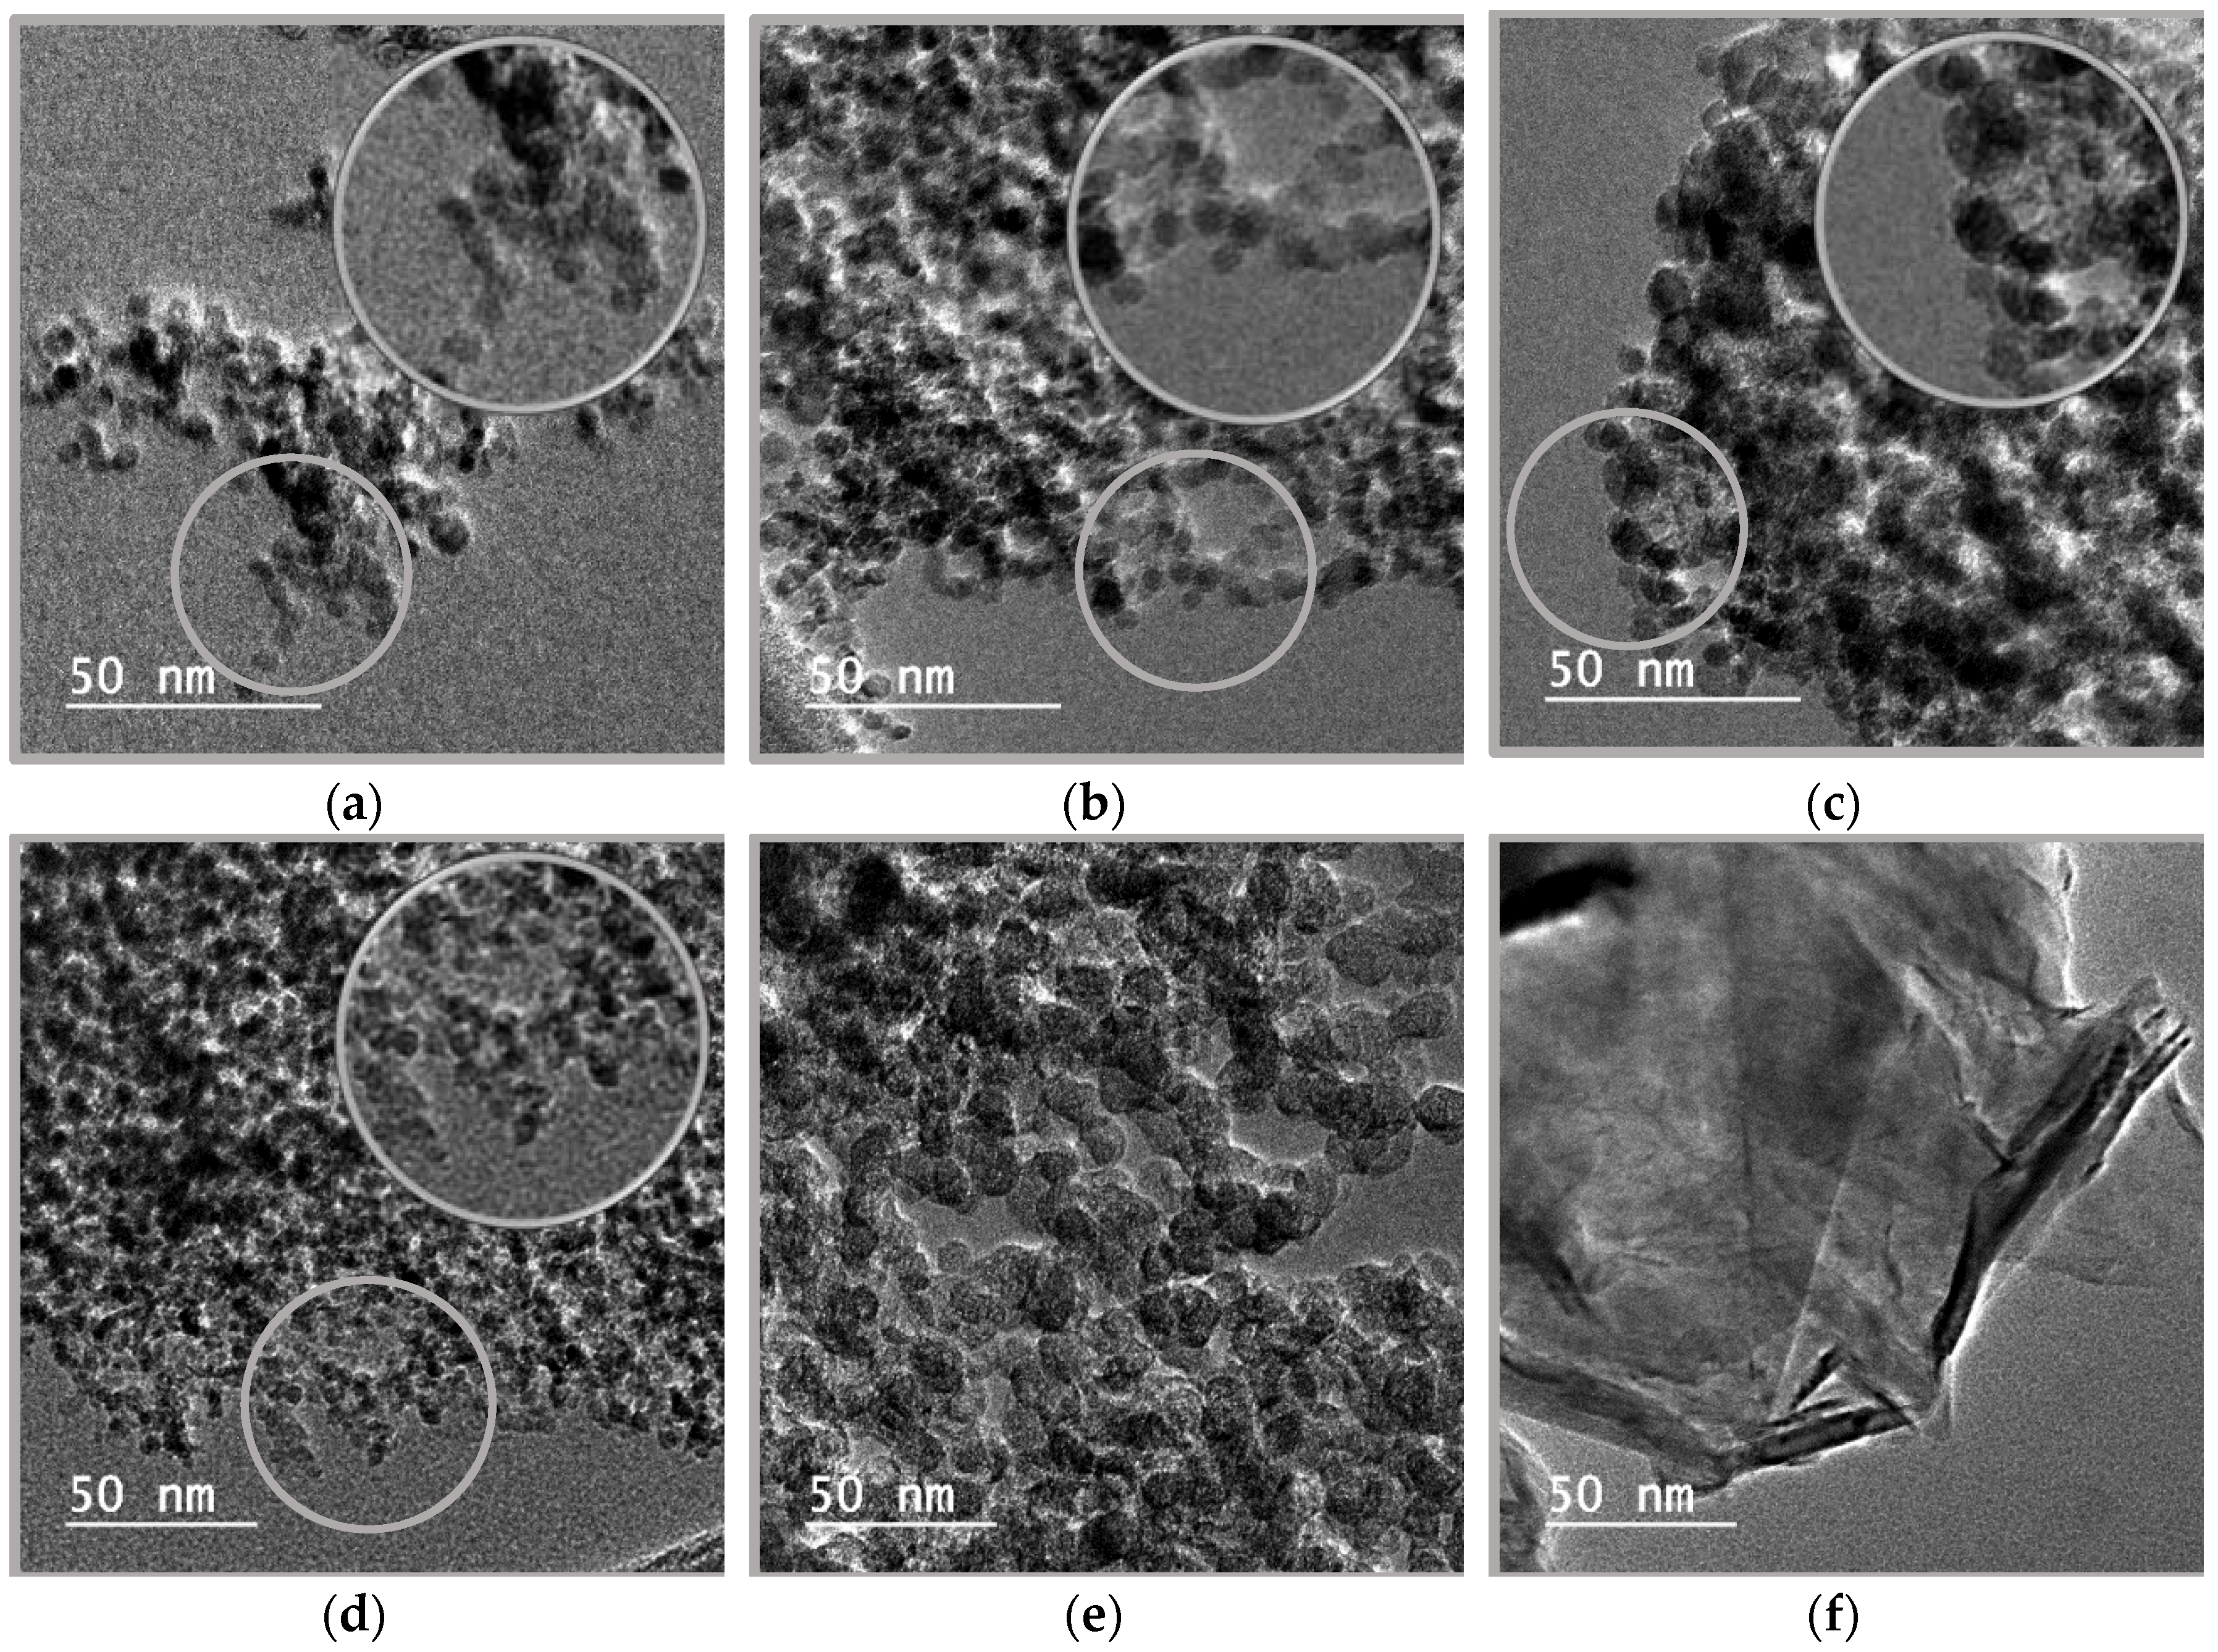
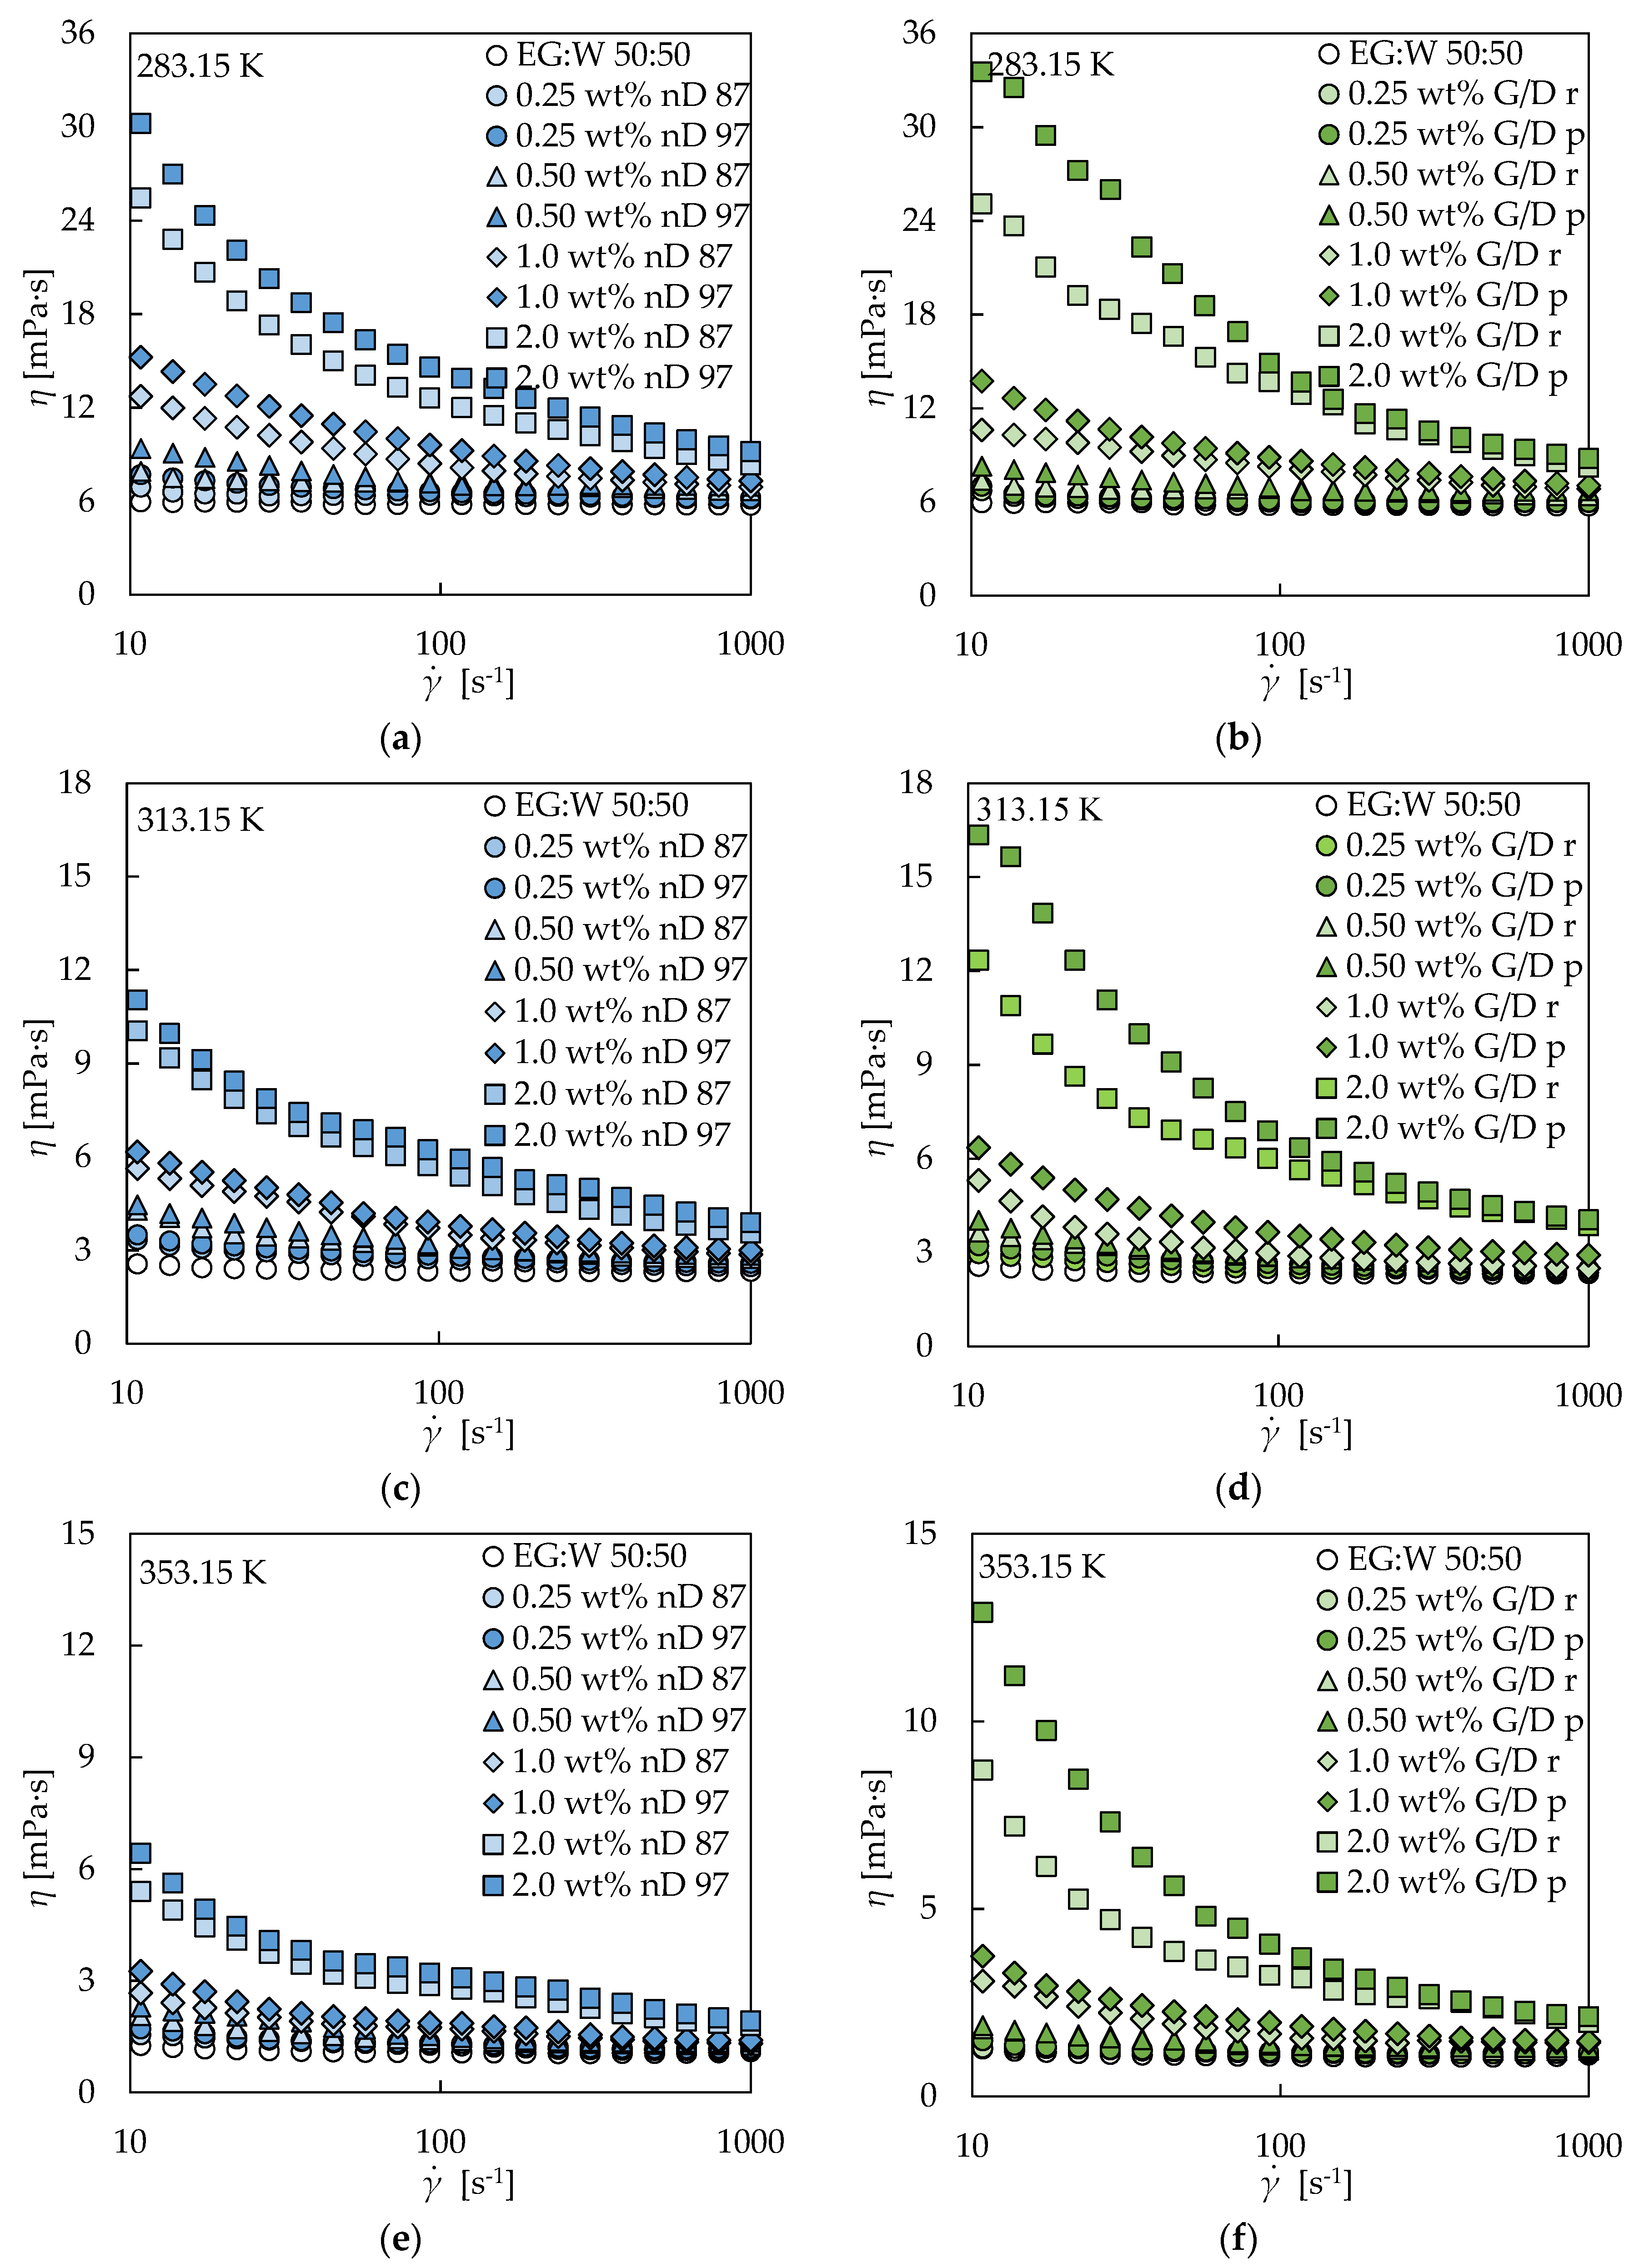
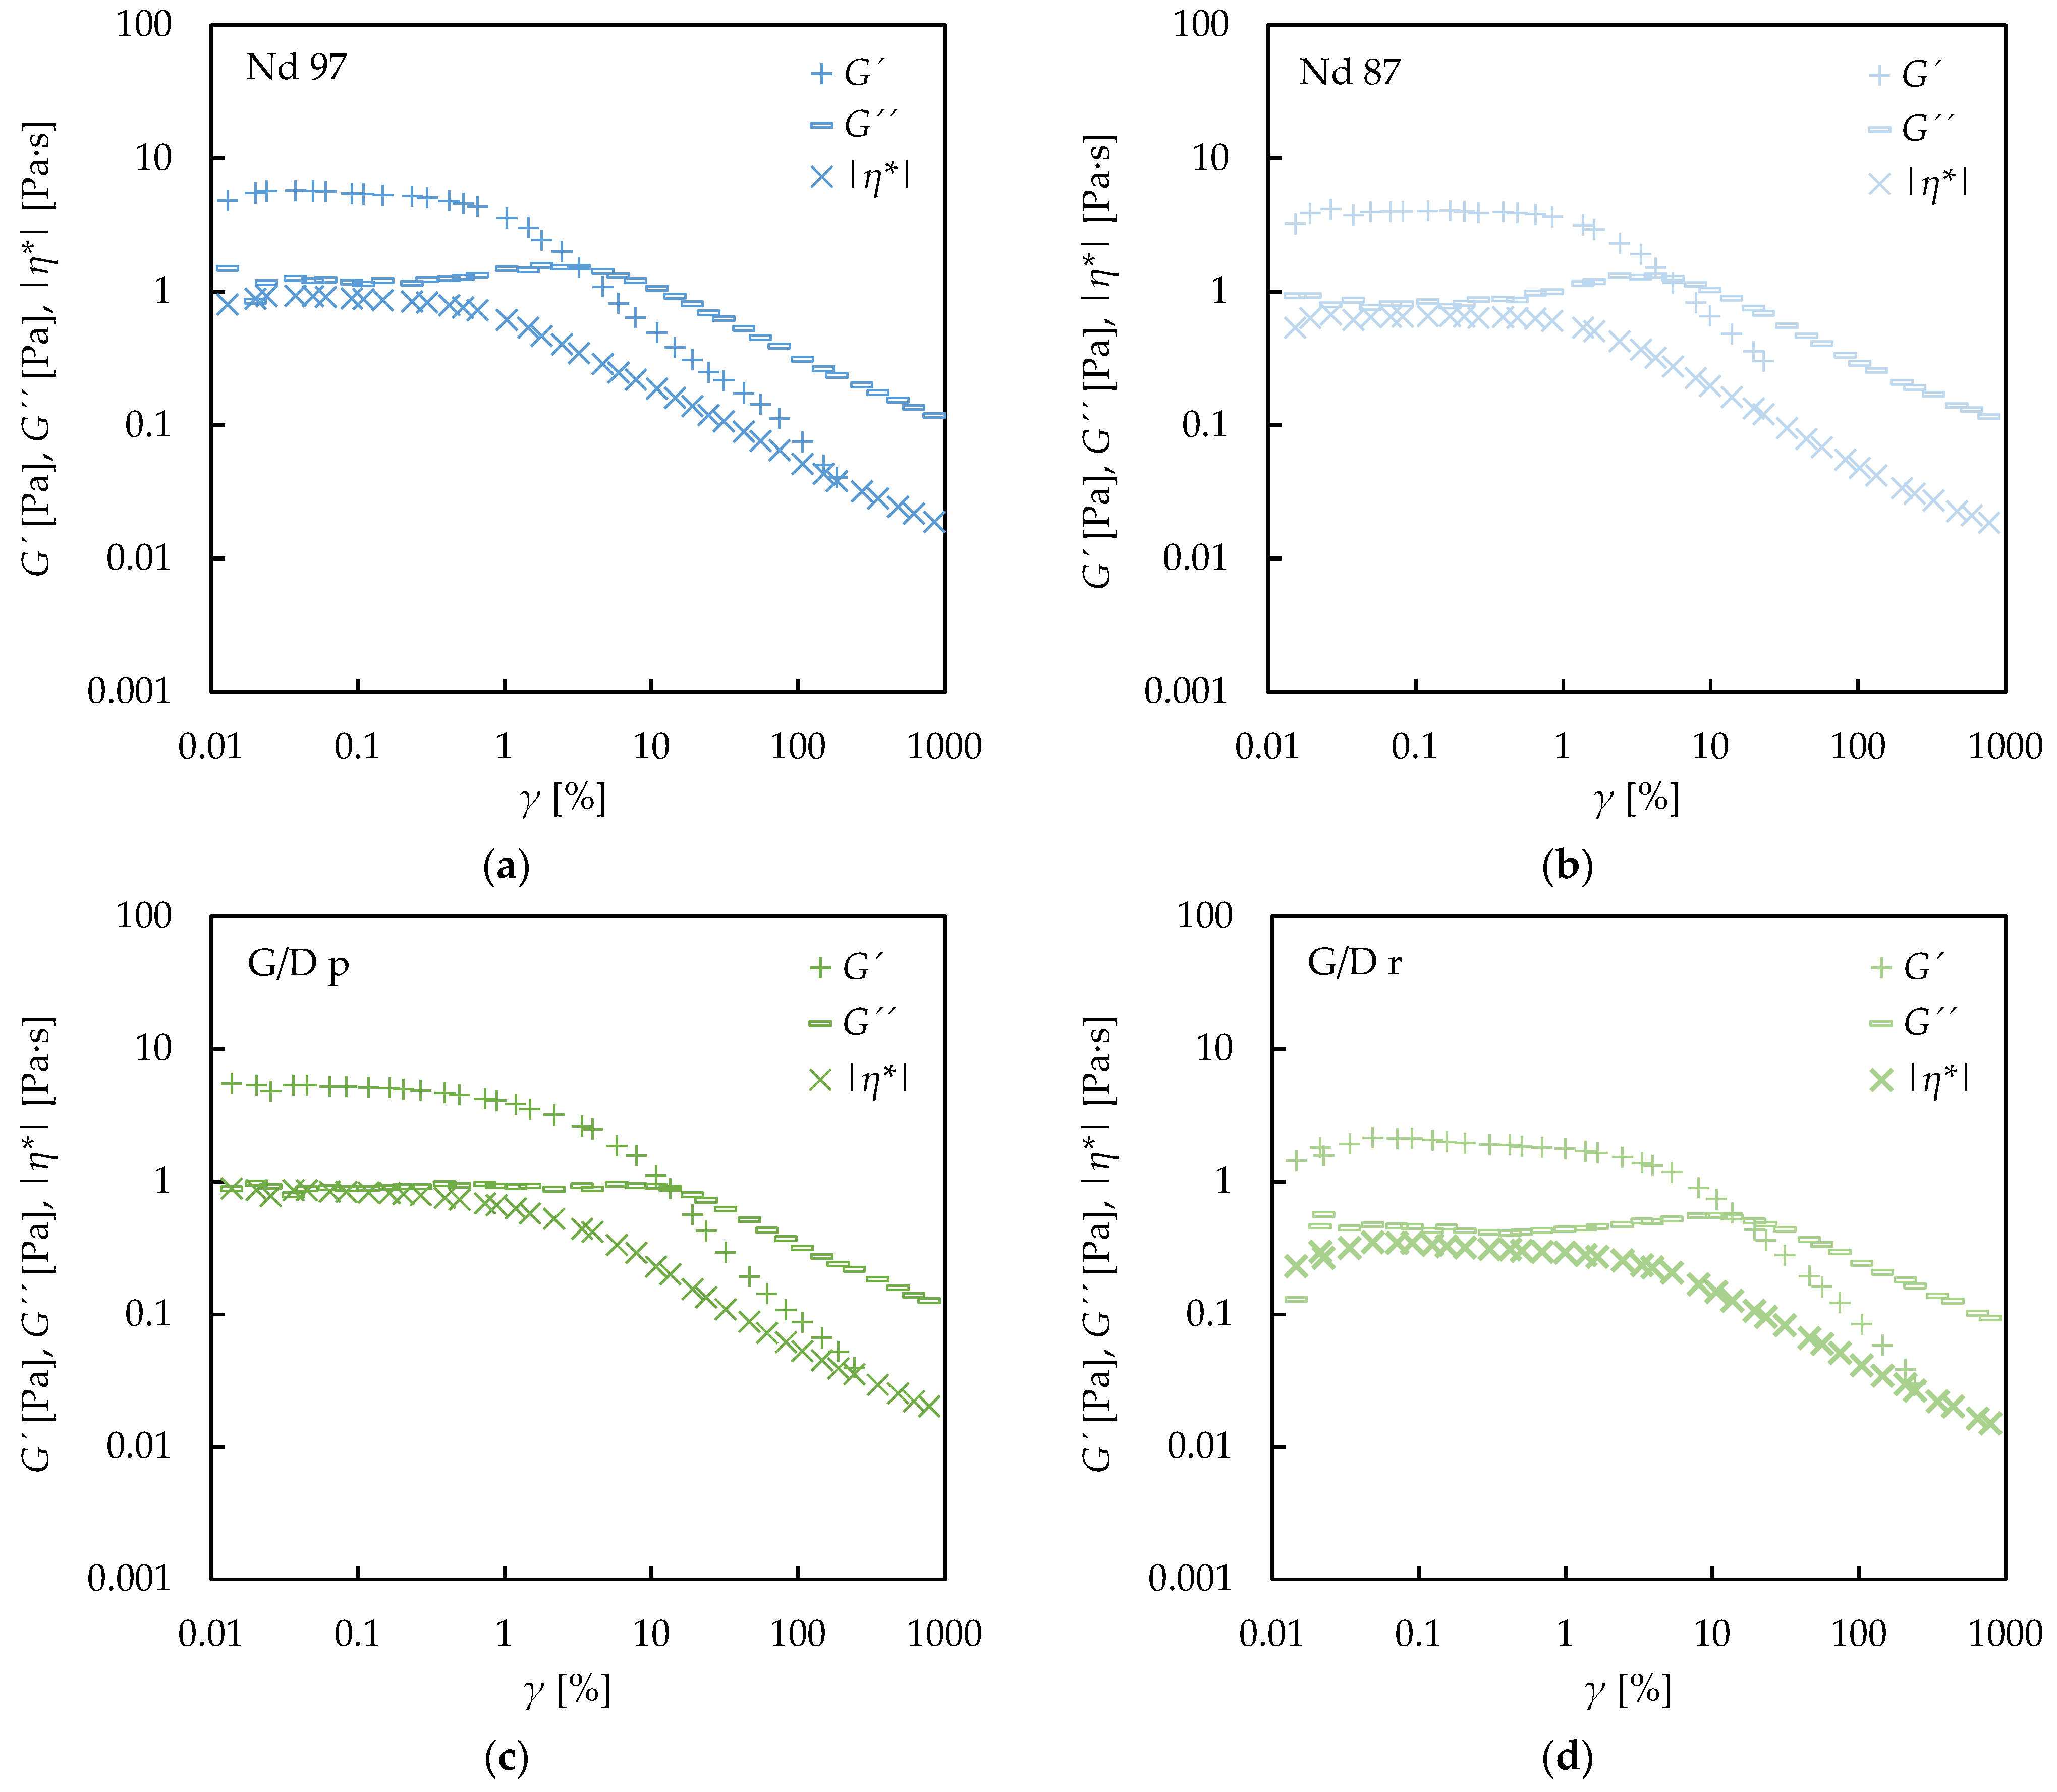
Figure 4 shows that the two different-phase nD nanofluid sets (
Figure 4a,c,e) and the two different-pure G/d nanofluid sets (
Figure 4b,d,f) exhibit a higher pseudoplasticity as the nanoadditive loading increases. As evidenced, this behavior was obtained at all the analyzed temperatures. The first Newtonian plateau is not observable for any concentration of the four nanofluid sets, as it was previously stated from
Figure 3, while the second is only clearly evidenced for the two lowest, 0.25 and 0.50 wt%. On the other hand,
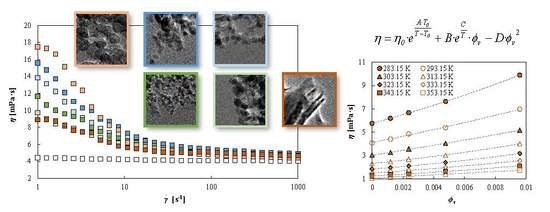
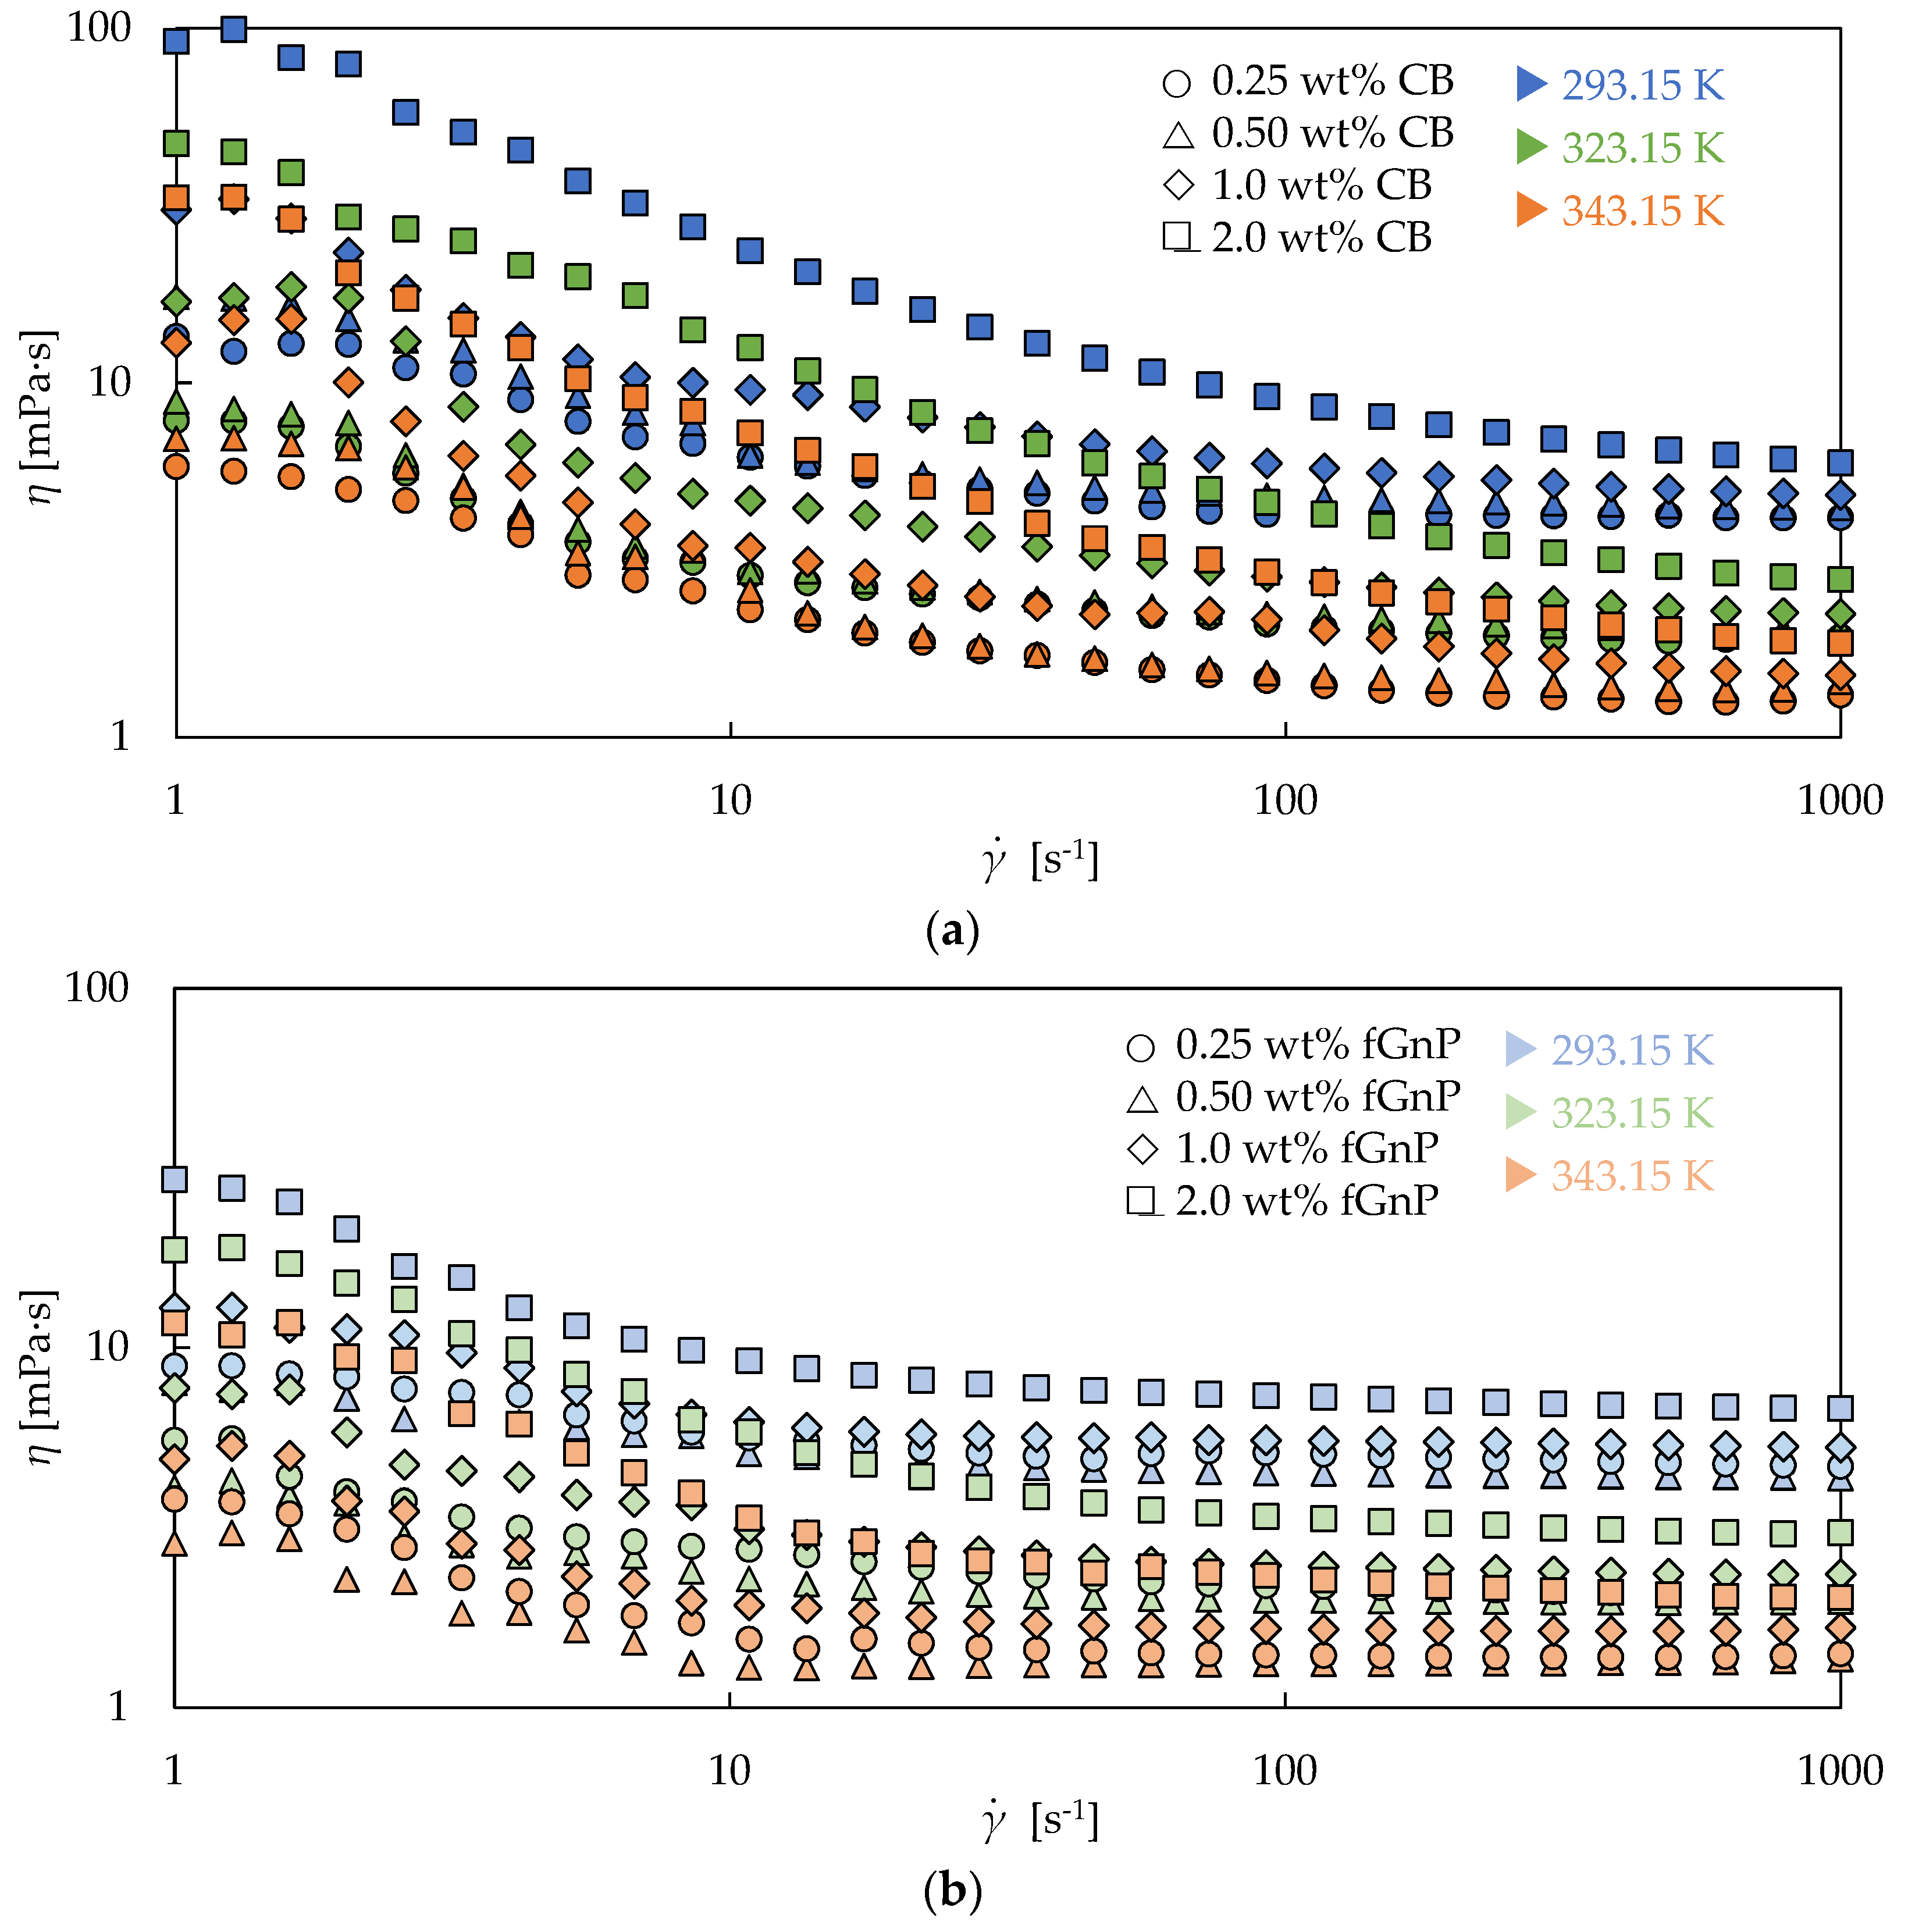
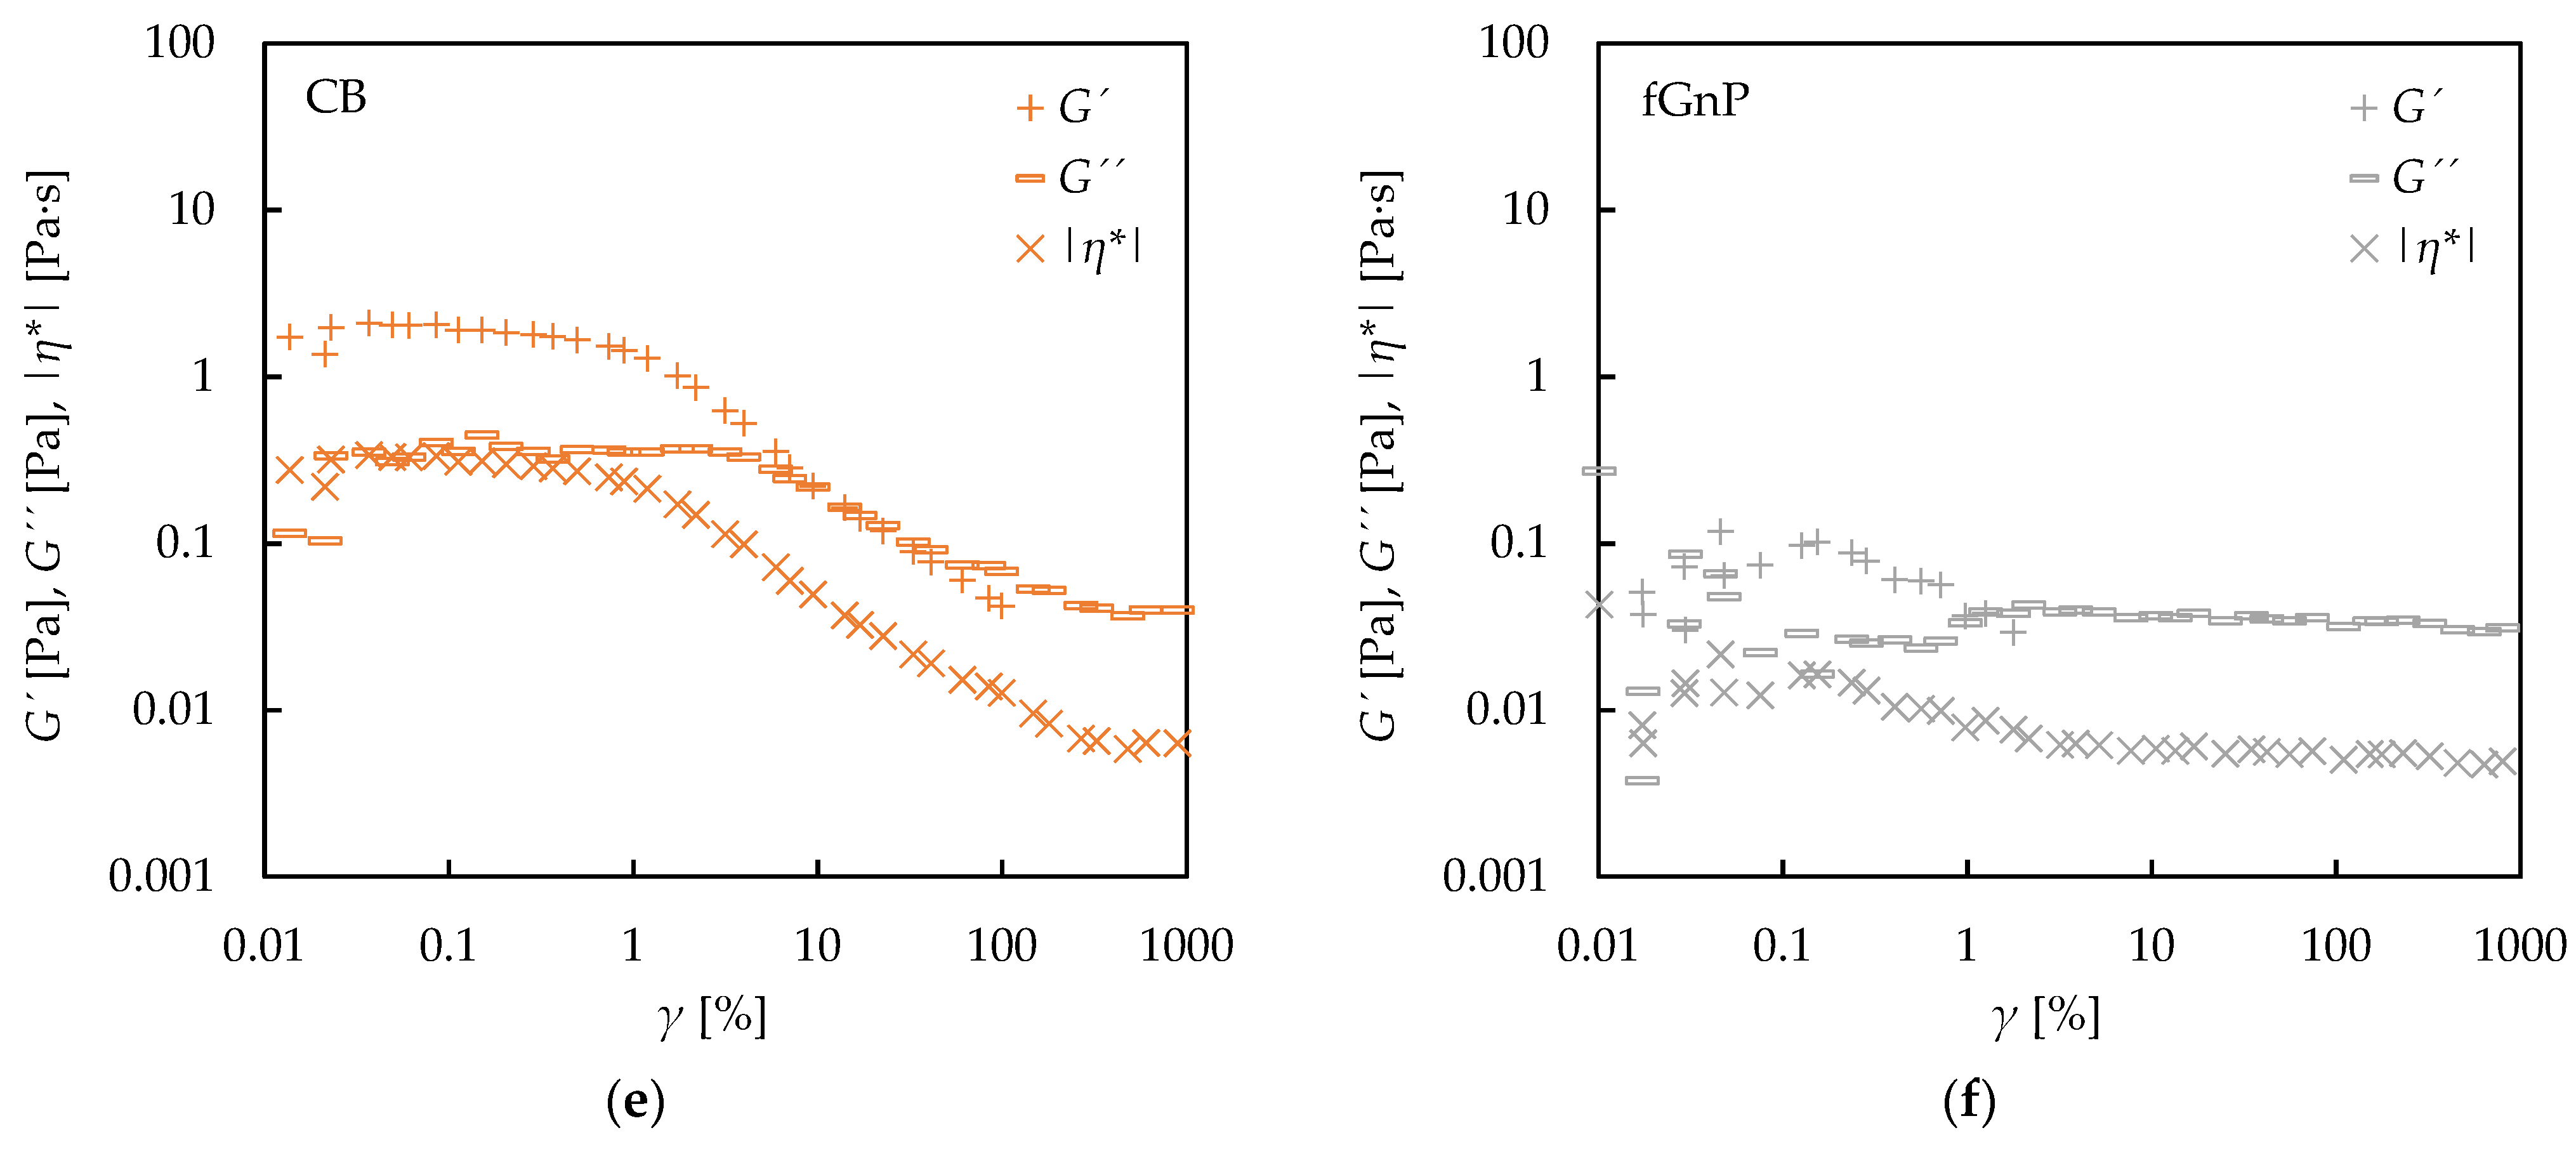
Figure 5 shows that CB and fGnP sets also present a higher pseudoplasticity as the nanoadditive concentration rises for different analyzed temperatures. This behavior is consistent with the previous described theory for the shear thinning behavior of dispersions, with the agglomerates being more difficult to orient in the flow direction as the nanoadditive amount increases.
Figure 5a shows an incipient region of the first Newtonian plateau for all the concentrations of CB nanofluids at several temperatures. The second plateau is again only reached for the lowest concentrations, 0.25 wt% and 0.50 wt%, like for the Nd and G/D nanofluid sets. The figure shows that the dynamic viscosity decreases between both Newtonian plateaus in the range 220–370% for the 0.25 wt% nanofluid and in the range 280–420% for the 0.50 wt% nanofluid. It should be noted that the CB set shows the highest slope in the shear thinning region for all nanoadditive loadings, as
Figure 3 depicts for the 0.50 wt% concentration.
Figure 5b exhibits an emerging region of the first Newtonian plateau for all the concentrations, as the CB set, and also reaches the second Newtonian plateau for all the analyzed concentrations and temperatures, in contrast with the rest of the sets. The figure shows dynamic viscosity decreases between Newtonian plateaus in the ranges 82–120%, 83–170%, 140–220%, and 150–240% for the 0.25 wt%, 0.50 wt%, 1.0 wt%, and 2.0 wt% fGnP nanofluids, respectively. As observed, the highest decrease for fGnP nanofluids, at 2.0 wt%, is similar to the lowest decrease for CB nanofluids, at 0.25 wt%, which allows different magnitudes between the shear thinning behaviors to be observed.
Taking into account the different pureness samples, it can be noticed that generally, the discrepancies in the shear-thinning region are higher for the G/D nanofluids than for the Nd nanofluids. From
Figure 4a,c,e, it can be pointed out that nanofluids constituted by the higher Nd phase present higher viscosity values than the ones construed by the lower Nd phase, with maximum differences of 13%, 18%, 29%, and 43% for the 0.25, 0.50, 1.0, and 2.0 wt% nanofluids, respectively. These results are in accordance with those presented by Zyła at al. [
36] for ethylene glycol-based nanofluids containing the same two types of Nd. They showed the flow curves for various mass concentrations in the 1.0 wt% to 10 wt% range at 298.15 K, with slightly higher viscosity values for the higher Nd phase samples.
Figure 3 and
Figure 4b,d,f also show that in the case of the different-pure G/D nanofluids, the higher the purity, the higher the viscosity values of the corresponding nanofluids for the same concentration, with maximum differences of 17%, 29%, 36%, and 47% for the 0.25, 0.50, 1.0, and 2.0 wt% nanofluids, respectively. Zyła at al. [
37] presented flow curves at 298.15 K for different mass concentrations between 1.0% and 5.0% of the same G/D nanopowders in ethylene glycol, with similar viscosities for the different pure samples. Furthermore, we can observe that for the highest concentrations and at lower shear rates, G/D nanofluids present higher dynamic viscosities than Nd nanofluids, while for the lowest concentrations, dynamic viscosities of Nd nanofluids are always higher than those of G/D nanofluids. The combined effect of graphite and nanodiamonds leads to lower viscosities than nanodiamonds at 0.25 wt% and 0.50 wt% concentrations, while for the highest, this trend starts to change.
Viscosity decreasing with increasing temperature was observed for all samples, as expected. The movement of the fluid particles is higher as the temperature increases, entailing a weakening of the inter-molecular cohesive forces and the consequent lower resistance of the fluid to flow [
33,
51]. It should be noticed that a quasi-constant relative decreasing was observed for the different carbon-based nanofluids, not dependent on concentration or shear rate. As an example, the dynamic viscosity values of the twenty-four nanofluids present decreases with the temperature ranging between 76 and 84% at a shear rate of 57.4 s
−1, while at a shear rate of 489 s
−1, the corresponding decreases range between 79 and 83%. It should be noted that these comparisons are made in some cases between the shear thinning region and Newtonian plateau, reinforcing the strength of this conclusion. This ~80% dynamic viscosity decrease for the 70 K step is similar to that of the base fluid, 82%. This behavior was also described in our previous work [
34] for polycarboxylate chemically modified graphene nanoplatelet dispersions in water, a propylene glycol:water mixture at 30:70 wt%, and a propylene glycol:water mixture at 50:50 wt%, where nearly constant decreases for the same 70 K step of around 73%, 84%, and 88%, respectively, were described. These results would confirm the unique dependence of the temperature-related variations of viscosity on the base fluid for carbon-based nanofluids.
One of the most well-known equations to model Non-Newtonian behaviors in the flow curves is the Ostwald-de Waele model or Power law [
52,
53]:
where the fitting parameters
K and
n stand for the flow consistency index and the flow behavior index, respectively. The distance from 1 of
n indicates the degree of deviation from Newtonianity. Thus,
n < 1 denotes shear-thinning behavior and
n > 1 denotes shear-thickening behavior [
53]. Nevertheless, this equation strictly models the shear-thinning or shear-thickening regions, not including Newtonian plateaus. The entire shape of the flow curve for shear-thinning fluids can be defined by the Cross model [
52,
54]:
where
η0 and
η∞ are the asymptotic values of viscosity corresponding to the Newtonian plateaus at lower and higher shear rates, respectively, while
k and
m are called the time constant and the rate constant, respectively [
55,
56]. The
m value is related to the degree of dependence on the shear rate of the viscosity in the shear thinning region [
57]. When
m = 0, the system behaves as a Newtonian fluid [
58]. On the other hand, the inverse of the time constant, 1/
k, provides an order of magnitude of the critical shear rate for the end of the first Newtonian plateau and the onset of the shear-thinning region [
57,
59]. Other models that can be considered approximations of the Cross equation allow different parts of the curve to be described. The Sisko equation [
60] is useful when
η0 >>
η, excluding the first Newtonian plateau of the modelling, and implies adding the
η∞ value in the right term of the Power law equation (
η =
η∞ +
K·
n−1). Nevertheless, the Williamson equation [
61] is applicable when
η >
η∞, excluding the second Newtonian plateau of the modelling, and implies subtracting the right term of the Power law equation from the
η0 value (
η =
η0 −
K·
n−1).
The Power law equation, Equation (2), was employed to strictly model the shear thinning region in the 1 to 100 s
−1 shear rate range of nD 97, nD 87, G/D p, and G/D r nanofluids at 298.15 K. As it can be observed in
Table 2, low deviations were obtained for the lowest concentrations, 0.25 and 0.50 wt%, with AADs under 6.2% and 4.0% for the different-phase nD and the different-pure G/D nanofluids, respectively. Nevertheless, AAD increases as the concentration rises.
The
n values obtained show a clear decreasing trend with the increasing concentration, evidencing a higher deviation from Newtonianity. Furthermore, the results are in accordance with the described behaviors with respect to the distinct pureness, with lower n values for the nanofluids constituted by the higher pure nanopowders. It is usually assumed that the flow behavior index varies between 0.2 and 0.8 for polymer melts and concentrated solutions [
55]. It can be affirmed that our samples are within that range.
As the flow curves of the 0.25 and 0.50 wt% CB nanofluids and of all the different-concentrated fGnP nanofluids include the shear thinning region and both Newtonian plateaus, it was decided to test the accuracy of the Cross model, Equation (2), with the experimental data at 293.15 K. For each fitting process, the
η0 value was directly assumed as the experimental dynamic viscosity at 1 s
−1, while the
η∞ value was adopted as the average value of the dynamic viscosities in the 100–1000 s
−1 range. AADs lower than 3.5% were reached for all nanofluids, as it can be observed in
Table 3. It should be noted that the goodness of the adjustments gets worse as the nanoadditive concentration increases for both nanofluid sets.
The
m values obtained show a higher displacement from zero with the increasing concentration, a symptom of more deviation from Newtonianity and a higher dependence on the shear rate of the viscosity values in the shear thinning region. Furthermore, the inverse of the time constant, 1/
k, offers values between 4 and 5 s
−1, in agreement with the critical shear rate between the first Newtonian plateau and shear-thinning region, as can be seen in
Figure 5 and
Figure 6 for the corresponding samples.
The higher shear rates analyzed in this study are the most connected with levels of turbulence of the usual flow rates in heat transfer applications. Thus, the effective dynamic viscosity values employed in the analysis of these processes correspond to the second Newtonian plateau for several of the analyzed nanofluids. As it was previously stated, it can be considered that for all the analysed carbon-based nanofluid sets, the 0.25 wt% and 0.50 wt% concentrations present quasi constant dynamic viscosity values in the 100–1000 s
−1 shear rate range, while this can also be affirmed for the 1.0 and 2.0 wt% concentrations of fGnP. Thus, subsequently, the dynamic viscosity values of the second plateau were analyzed, considering them as the average of the experimental values in the cited shear rate range.
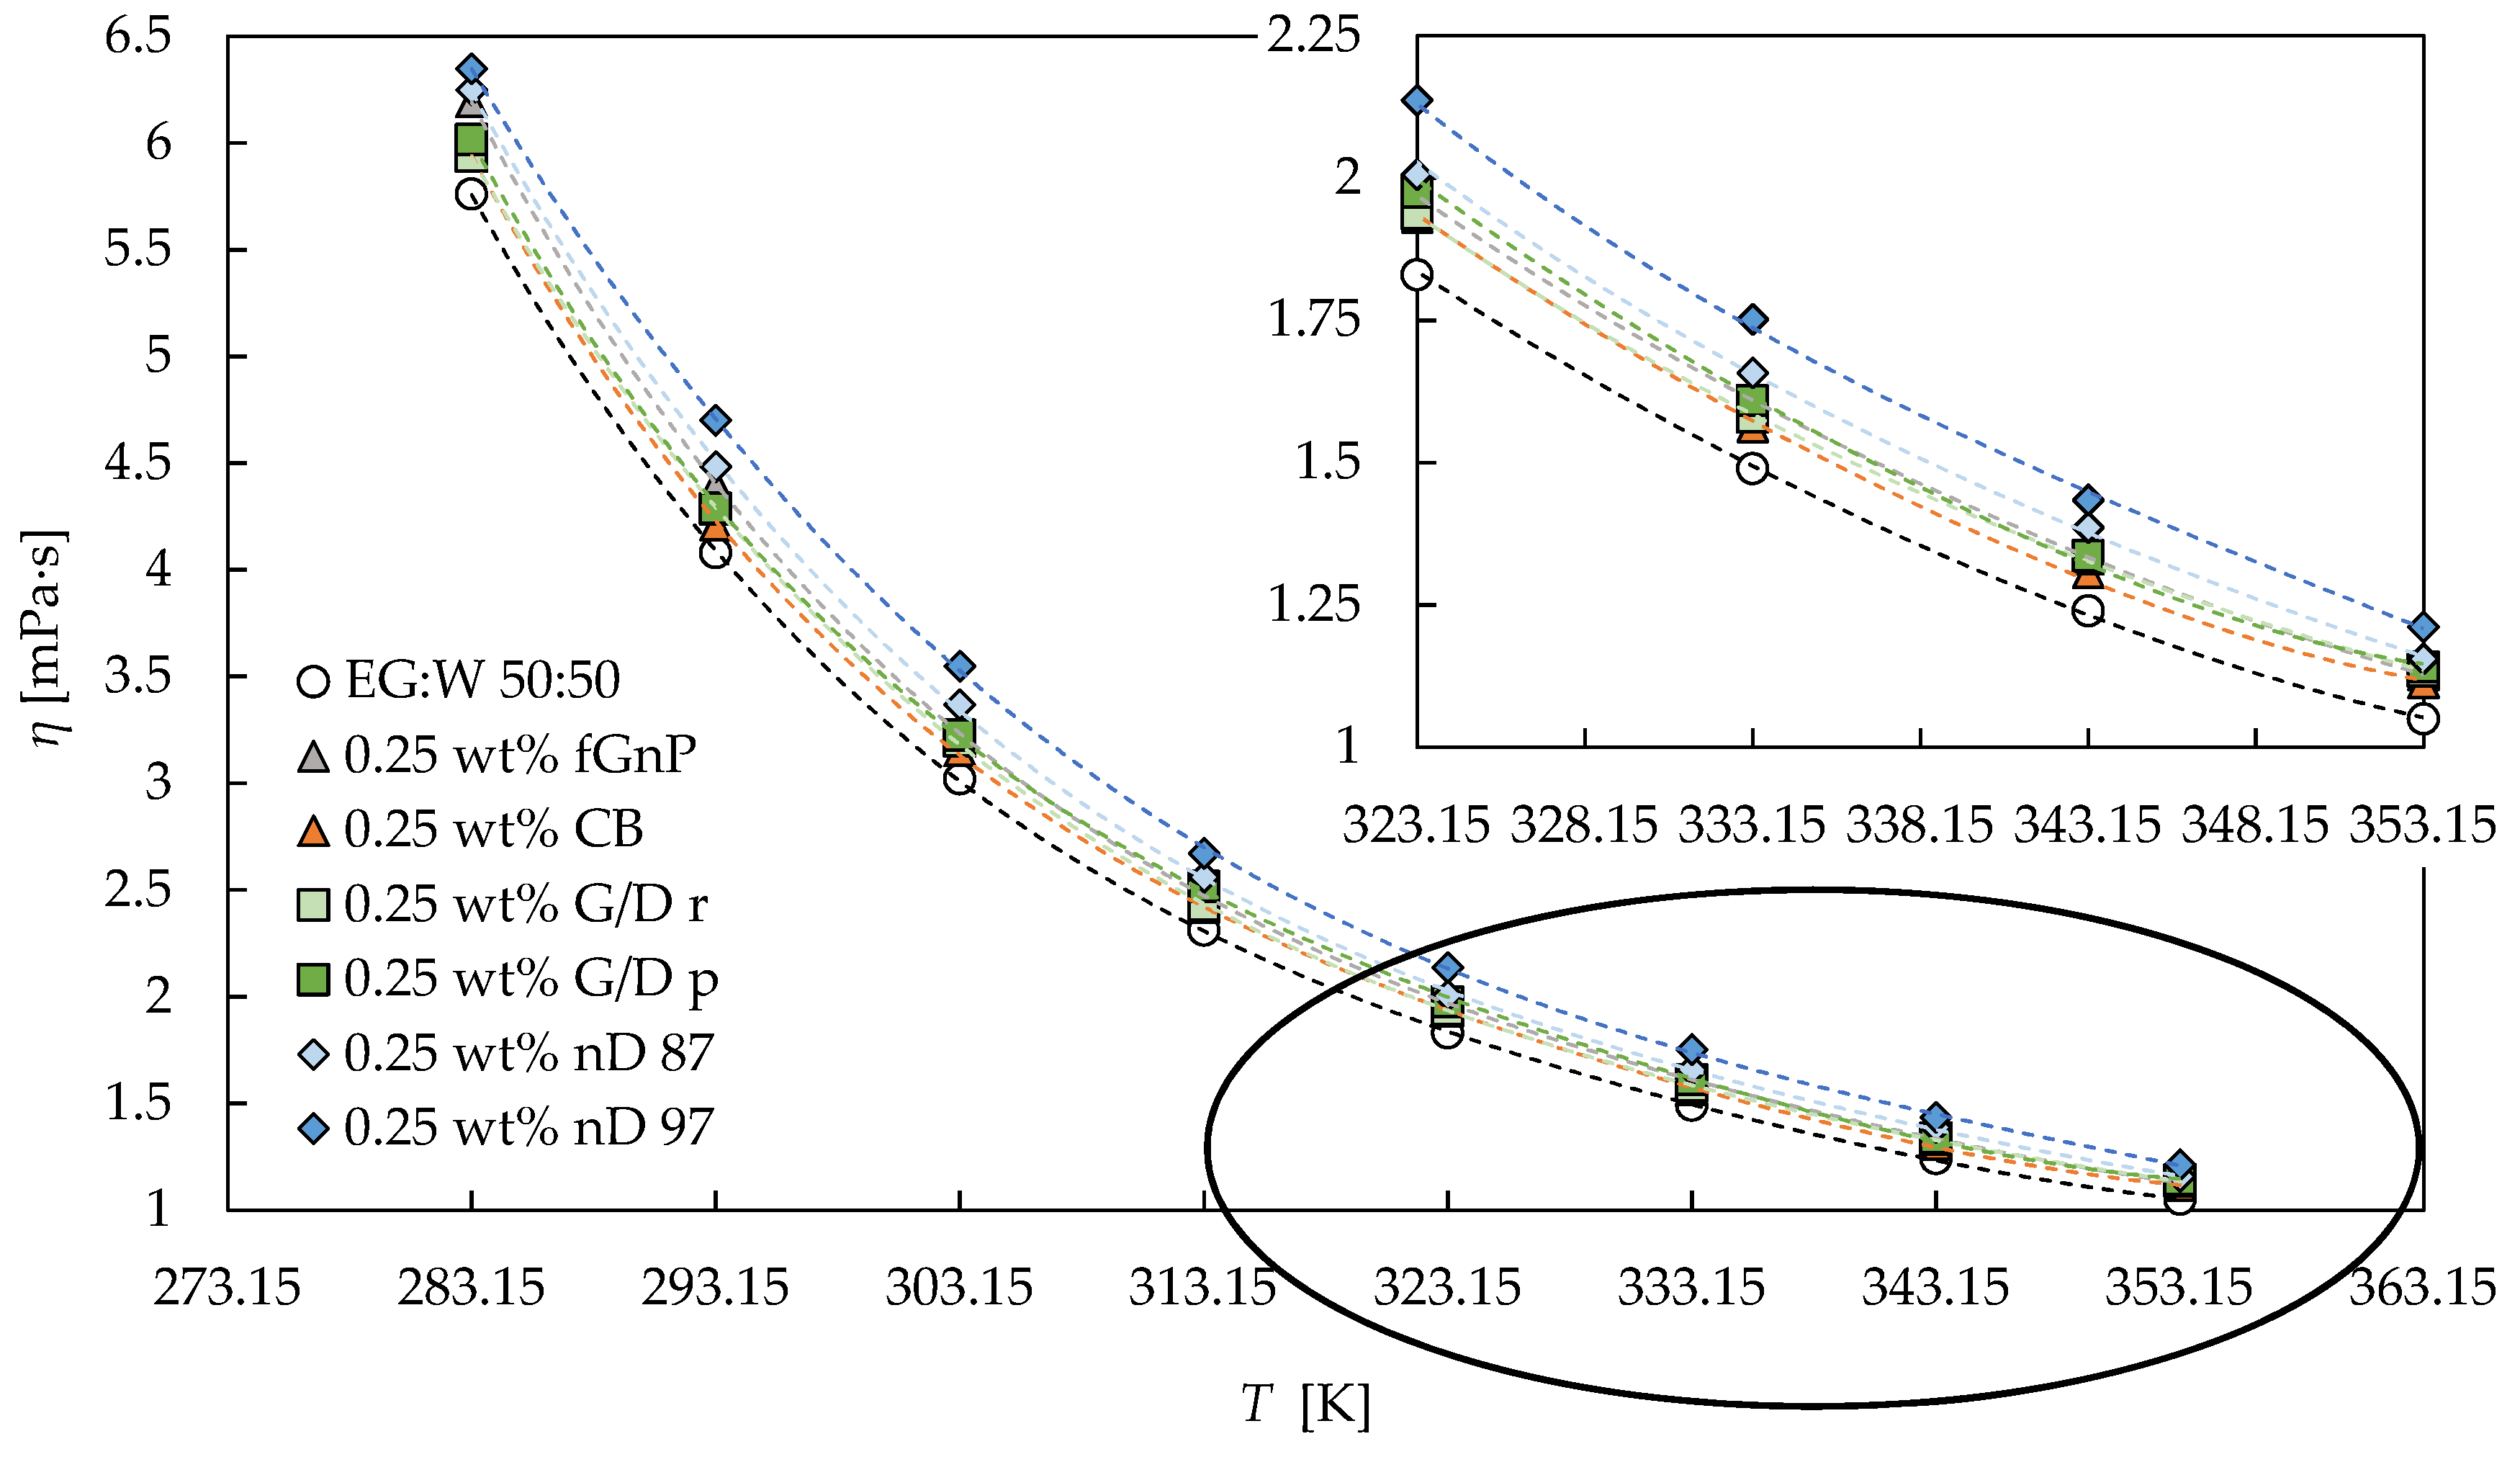
Table 4 presents the aforementioned values for the 0.25 wt% and 0.50 wt% nanofluids. The following comparison between viscosity values can be established:
ηnD 97 >
ηnD 87 ≥
ηG/D p >
ηG/D r >
ηCB, as can also be observed in
Figure 6. The viscosity of the fGnP occupies different positions, depending on the concentration and temperature.
Average viscosity increases for the 0.50 wt% nanoadditive concentration with respect to the base fluid of 27%, 22%, 19%, 17%, 16%, and 13% for Nd 97, Nd 87, G/D p, G/D r, fGnP, and CB, respectively, were obtained. No clear temperature dependence of these increases was found. The dispersion of nanoparticles into a base fluid increases its internal resistance to flow due to the higher level of friction within it, leading to higher dynamic viscosity values [
34,
62].
The Vogel–Fulcher–Tammann (VFT) equation [
63,
64,
65], also named the Vogel–Fulcher–Tammann–Hesse equation, is one of the most used models describing the temperature dependence of viscosity:
where
η0,
A, and
T0 are the fitting parameters. The results of the fitting process can also be observed in
Table 4 for the base fluid and the 0.25 wt% and 0.50 wt% nanofluids. Low AADs between 0.17% and 1.3% were obtained, with standard deviations under 0.09 mPa·s.
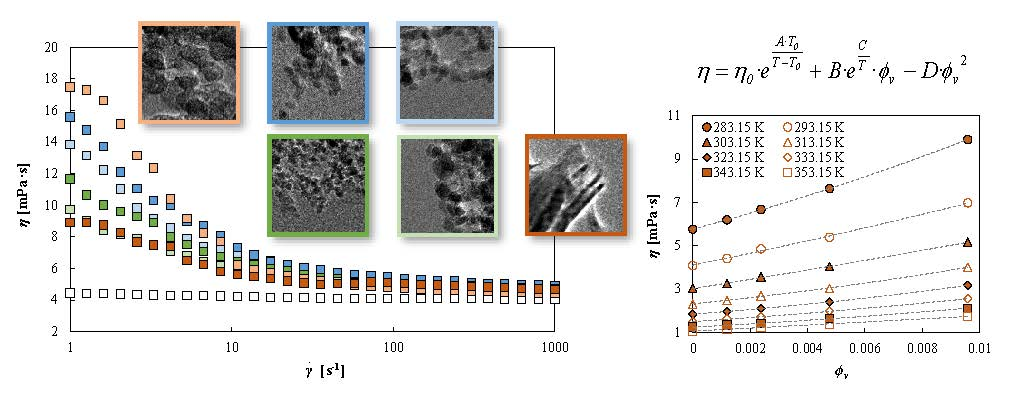
The dynamic viscosity values in the second plateau for the fGnP nafluid set were modelled by means of Vallejo et al.’s equation [
33], which includes, in the same expression, the concentration and temperature dependences of viscosity:
with
B,
C, and
D as the fitting parameters;
η0,
A, and
T0 as the previously fitted parameters from the VFT equation, Equation (3), for the corresponding base fluid; and
ϕv as the volume fraction. This equation was tested in previous works [
33,
34,
66] for experimental viscosities of GnP-water dispersions [
34,
39], GnP-propylene glycol water 10:90 wt% dispersions [
33], GnP-propylene glycol water 30:70 wt% dispersions [
33,
34,
66], and GnP-propylene glycol water 50:50 wt% dispersions [
34], obtaining very good results.
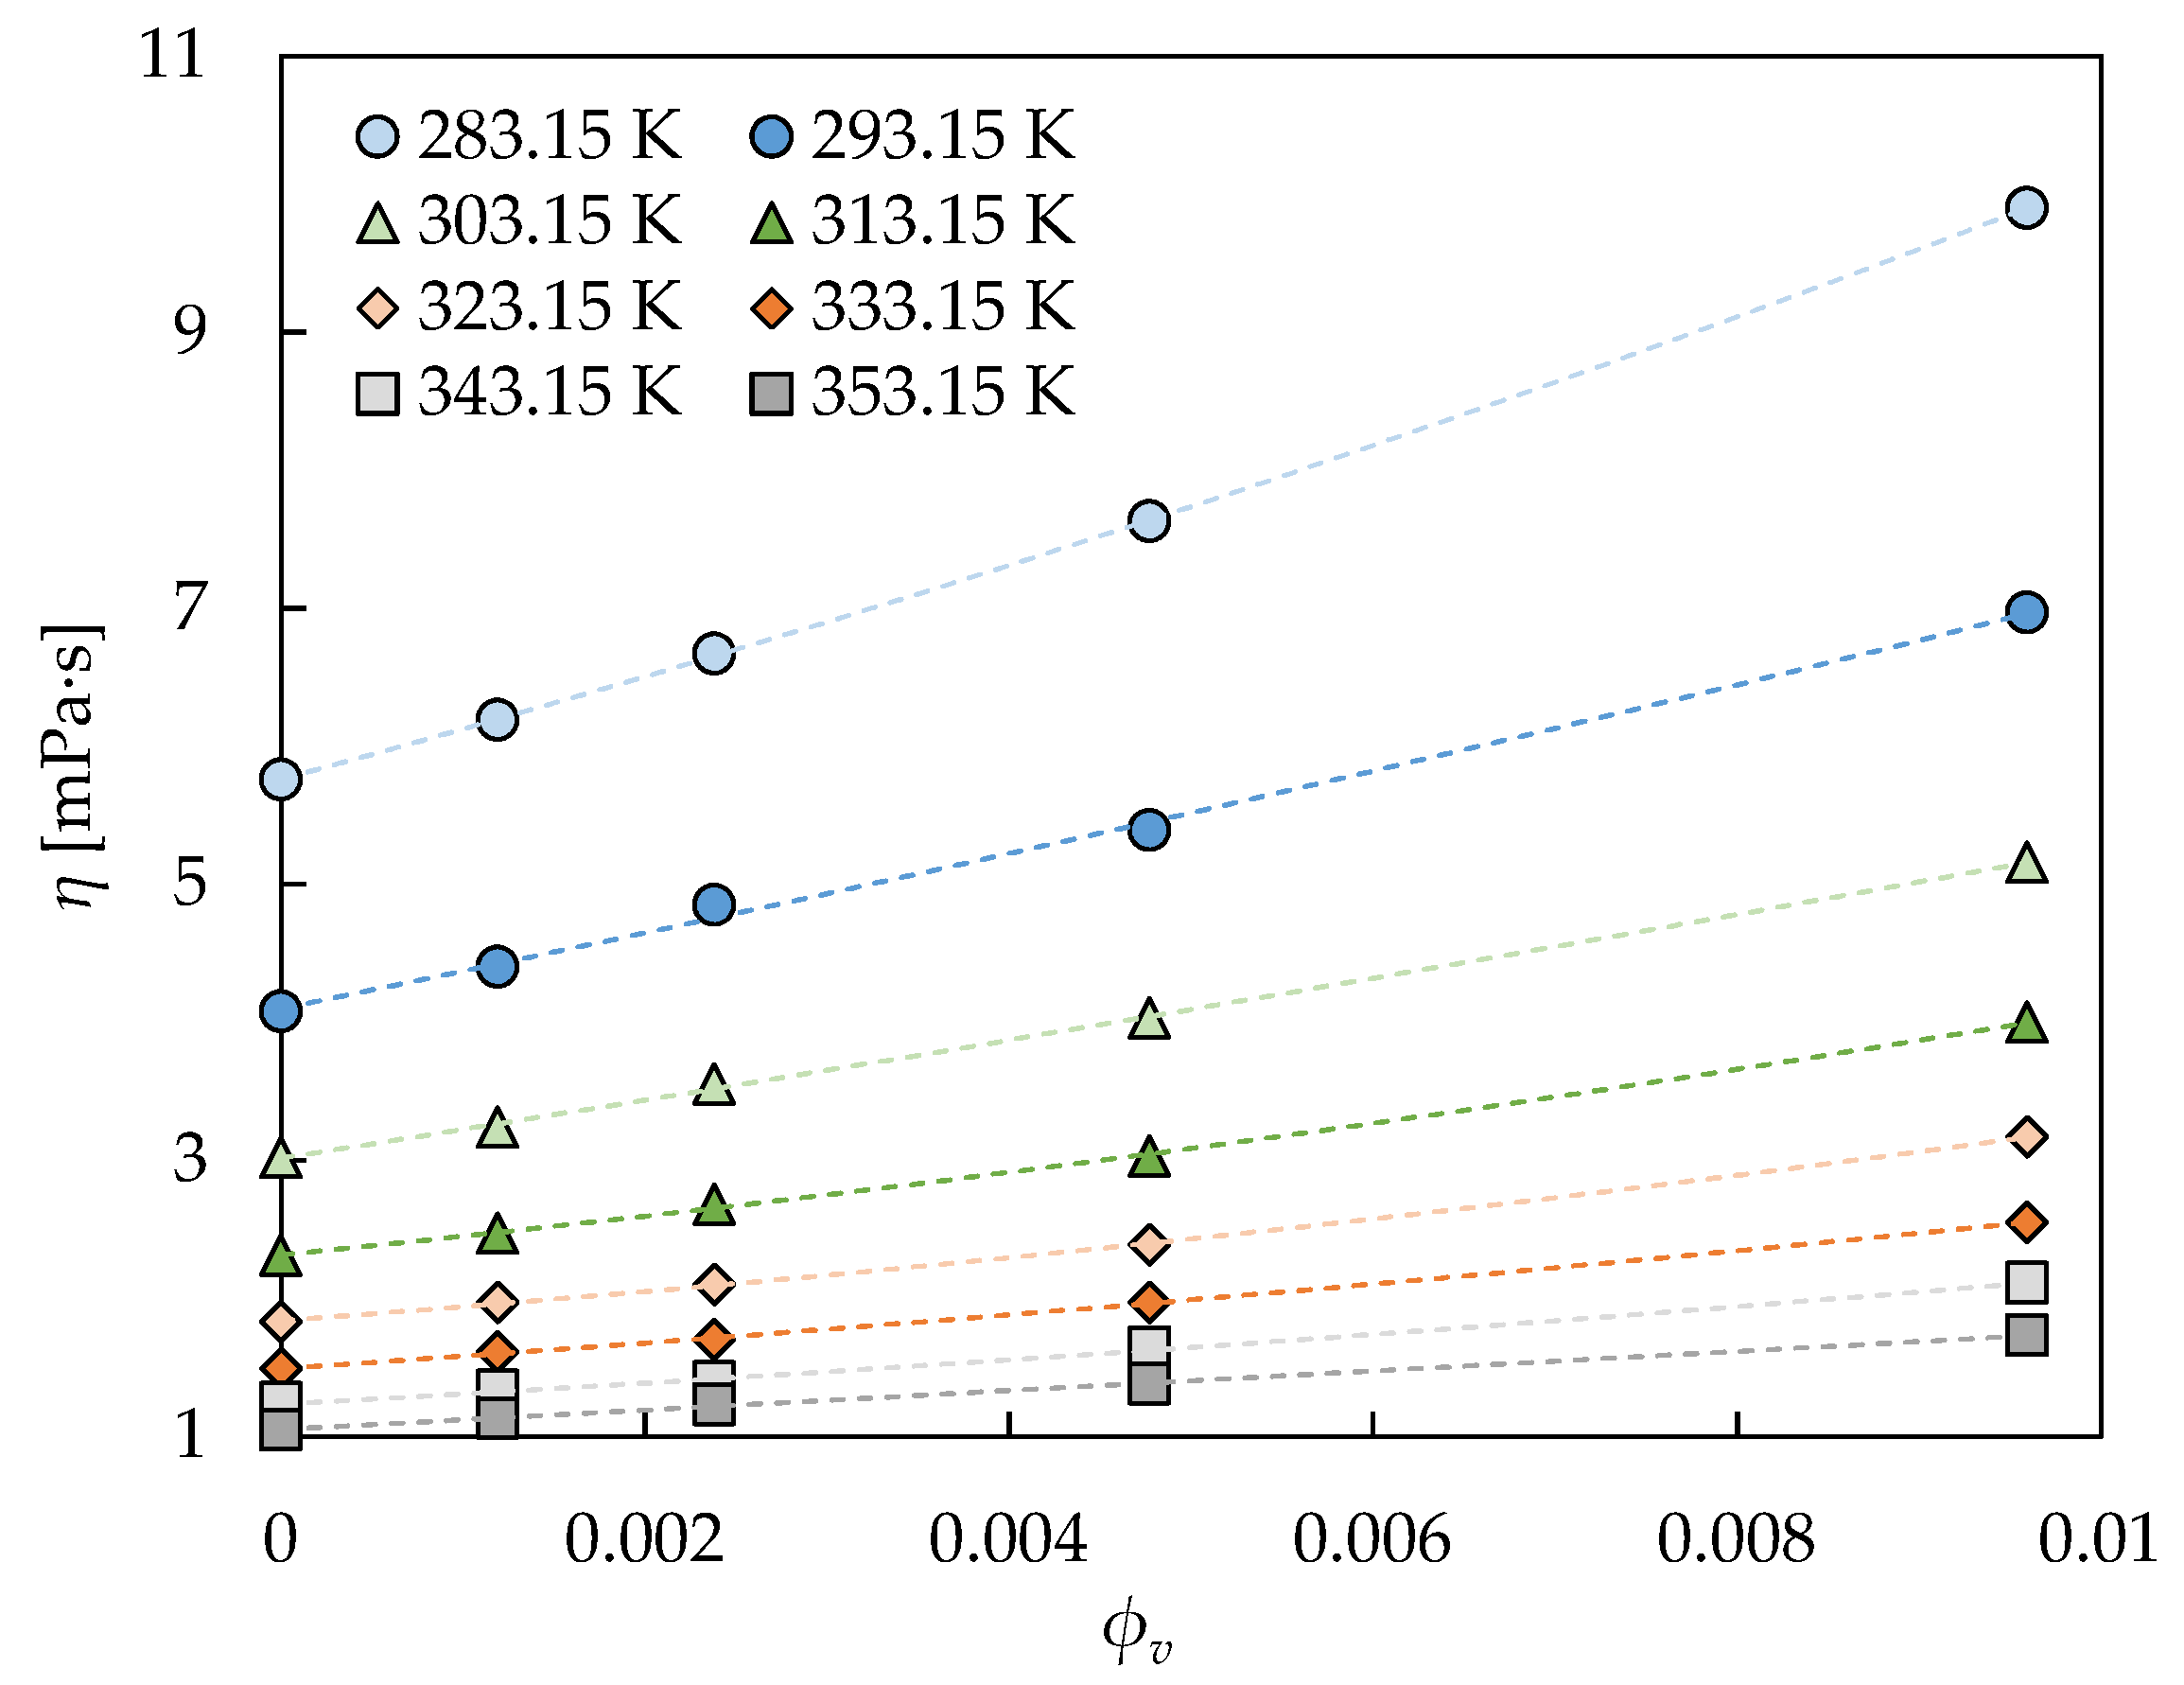
Table 5 and
Figure 7 show the goodness of Equation (4) for the fGnP nanofluids of this study, the reached AAD being lower than 0.9%. The reduction in the number of employed fitting parameters with respect to the VFT equation for the entire nanofluid set (6 for Vallejo et al.’s equation versus 15 for VFT equations) should be noted. These results allow the validity of this equation to be tested for nanofluids when using an ethylene glycol:water mixture as a base fluid, and their good results for GnP as a nanoadditive to be consolidated.
The flow curves of fGnP nanofluids generally behave differently from the rest of the studied nanofluid sets, which are more similar among them despite the aforementioned differences. The fGnP nanofluid set presents the following particularities: the shear-thinning region is smaller than in other cases and the relative positions of the viscosity values at lower shear rates are different than at higher rates (see
Figure 3 and
Figure 6 and
Table 4). The noticeable differences in the size and shape of fGnPs (up to 500 nm) are orders of magnitude larger than for the rest of the carbon-based nanomaterials (below 100 nm) employed, leading us to determine noticeable differences in the rheological behavior.
The small size of the training dataset leads to imprecise predictions of nanofluid thermophysical properties by artificial neural networks, making the conventional prediction models more suitable in many occasions [
67,
68]. The huge dataset provided by this study, 200 flow curves (25 different samples at eight temperatures), can be employed in future works to train neural networks for the prediction of nanofluids in different applications.


