Abstract
A novel, facile sensor was further developed for microcystin-LR (MC-LR) determination by visible spectroscopy. Antibody-functionalized SiO2-coated magnetic nanoparticles (Fe3O4@SiO2) and aptamer-functionalized polydopamine nanospheres decorated with Cu nanoparticles (PDA/CuNPs) recognized specific sites in MC-LR and then the sandwich-type composites were separated magnetically. The Cu in the separated composites was converted to Cu2+ ions in solution and turn-on visible absorption was achieved after reaction with bis(cyclohexanone)oxaldihydrazone (BCO) (λmax = 600 nm). There was a quantitative relationship between the spectral intensity and MC-LR concentration. In addition, under the optimum conditions, the sensor turns out to be a linear relationship from 0.05 to 25 nM, with a limit of detection of 0.05 nM (0.05 μg/L) (S/N = 3) for MC-LR. The sensitivity was dependent on the low background absorption from the off-to-on spectrum and label amplification by the polydopamine (PDA) surface. The sensor had high selectivity, which shows the importance of dual-site recognition by the aptamer and antibody and the highly specific color formed by BCO with Cu2+. The bioassay was complete within 150 min, which enabled quick determination. The sensor was successfully used with real spiked samples. These results suggest it has potential applications in visible detection and could be used to detect other microcystin analogs.
1. Introduction
Microcystins (MCs) are mainly formed as products of cyanobacterial metabolism. They are widely present in water. Structurally, MCs are monocyclic heptapeptides, that is, cyclo(d)-Ala-X-(d)-erythro-b-methyl-iso-Asp-Y-Adda-(d)-iso-Glu-N-methyldehydro-Ala and via peptide bonds, the seven amino acids are connected [1]. The unusual (2S,3S,8S,9S)-3-amino-9-methoxy-2,6,8-trimethyl-10-phenyldeca-4,6-dienoic acid (Adda) unit is unique to MCs. Besides it is associated with maternal toxicity and biological activity [2]. When leucine and arginine respectively occupied the positions, the corresponding MC-LR can not only strongly inhibit the bioactivities of phosphatases type 2A (PP2A) but also can inhibit type 1 (PP1), which have great importance in protein dephosphorylation. MC-LR is highly toxic even at low concentrations and is associated with most MC-induced toxic incidents [3,4]. The World Health Organization has already categorized MC-LR as a kind of neurotoxin and carcinogen. In addition, a maximum permissible limit of 1 μg/L has been established in drinking water [5]. Therefore, it is important to develop sensitive, specific, rapid and dependable methods for monitoring MC-LR.
In the past decade, more and more analytical techniques have been investigated for MC-LR detection. These methods, which include electroanalysis [6,7,8,9], photoelectrochemical [10,11,12,13], surface plasmon resonance [14], fluorescence [15,16] and colorimetric methods [3,17,18]. Colorimetric sensors are attracting increasing attention because of their simple construction, cost effectiveness, ease of use, potential for miniaturization and portability. Knopp’s group reported a competitive colorimetric method using MC-LR-functionalized magnetic beads and antibody-immobilized AuNPs, which could be stained for further detecting MC-LR [19]. Magnetic Fe3O4 is prominent for the rapid separation and other biocompatible nanoparticles also show potential application, such as CuNPs [20,21]. The signal source is important in achieving a good detection performance by a sensor and enzyme labels have been widely studied. However, the limited stability of enzyme labels restricts the applications of such sensors. There is therefore an urgent need to develop alternative enzyme-free labels that offer high reproducibility, ease of use, accuracy and portable detection to manage the health risks associated with MC-LR [22,23].
In this study, we used a relatively novel, convenient and efficient non-enzymatic strategy for detecting MC-LR (Scheme 1). MC-LR was captured via a dual recognition method by using an aptamer-coated Cu composite and antibody-coated magnetic nanospheres. The sandwich-type composite was then magnetically separated and the Cu was converted to Cu ions, which gave a turn-on ultraviolet-visible (UV-Vis) response with bis(cyclohexanone)oxaldihydrazone (BCO). The colorimetric complex provided a highly amplified and at the same time, it provided a reproducible signal for MC-LR analysis. In the detection process, MC-LR was captured in one step and it was also enriched using magnetic nanoparticles. Such particles provide a proper platform for eliminating pretreatment, with signal amplification and removal of matrix effects from many samples, leading to an off-to-on colorimetric complex. This straightforward assay enables effective detection with high sensitivity and specificity, with a performance that is better than those of previous analytical methods.
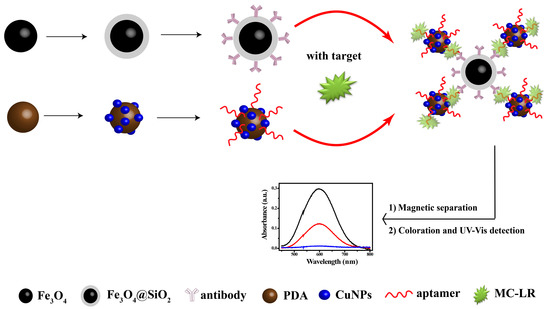
Scheme 1.
Schematic diagram of microcystin-LR (MC-LR) detection with sensor.
2. Materials and Methods
2.1. Materials
Dopamine hydrochloride, copper chloride, BCO, tetraethyl orthosilicate (TEOS), NaOH, tris(hydroxymethyl)aminomethane (Tris), poly(diallyldimethylammonium chloride) (PDDA, 20%, w/w in water, MW = 200,000–350,000), poly(acrylic acid) (PAA, 35%, w/w in water, MW = 100,000), 1-ethyl-3-(3-dimethylaminopropyl)carbodiimide hydrochloride (EDC), N-hydroxysuccinimide (NHS), ethanol and methanol were bought from the Aladdin Reagent Co., Ltd. (Shanghai, China). Tris–HCl buffer solution (0.2 M), phosphate–buffered saline (PBS, 0.2 M) and NH3–NH4Cl buffer solution (0.2 M) were used in the experiments. Milk, orange juice and drinking water were bought from a supermarket. River water was obtained from Jiaxing rivers. All these aqueous solutions were all prepared under the condition of doubly distilled water.
A monoclonal antibody (MC8C10) against MC-LR was bought from the Beijing Puhuashi Technology Development Co., Ltd. (located in Beijing, China); this antibody recognizes the Adda chain of the cyclic peptide. Microcystins (MC-LR and MC-RR), besides, okadaic acid (OA) were also bought from the corporation. Microcystins (MC-LF, MC-LW and MC-YR) were all purchased from Shanghai Enzo Life Sciences, Inc. As for Bovine serum albumin (BSA), it was purchased from the Beijing J & K Scientific Co., Ltd. (Beijing, China). The aptamer of MC-LR was synthesized by the Shanghai Sangon Biotechnology Co., Ltd. (located in Shanghai, China) and it was purified by HPLC; the sequence of it was 5′-NH2-GGC GCC AAA CAG GAC CAC CAT GAC AAT TAC CCA TAC CAC CTC ATT ATG CCC CAT CTC CGC-3′ [24]. Other chemicals, which were of analytical grade, were used without further purification and were purchased from the Shanghai Chemical Reagent Co. (Shanghai, China).
2.2. Equipment
UV-Vis absorption spectra were completely recorded with a UV2550 spectrophotometer. At the same time, transmission electron microscopy (TEM) was carried out with a Tecnai-G20 instrument (FEI, Hillsboro, Oregon, OR, USA). The magnetic behavior was investigated with a vibrating sample magnetometer (called Lake Shore 7410). Fourier-transform infrared (FTIR) spectroscopy was performed with a Nicolet Nexus-470 FTIR spectrometer (Thermo Scientific, Waltham, MA, USA). Thermal gravimetric analysis (TGA; STA-409PC, Netzsch Scientific Instruments, Ltd., Selb, Germany) and differential scanning calorimetry (DSC; 200PC, Netzsch Scientific Instruments, Ltd., Selb, Germany) were performed from ordinary room temperature to 800 °C and 450 °C, respectively (10 °C/min), in a nitrogen atmosphere.
2.3. Label Preparation
PDA nanospheres were prepared using a modified version of a previously reported procedure [25]. Ammonia aqueous solution (NH4OH, 1.0 mL, 28–30%) was mixed with ethanol (40 mL) and deionized water (90 mL) under the circumstance of mild stirring at room temperature for 30 min. Dopamine hydrochloride (0.5 g) was dissolved in deionized water (10 mL), then it was injected into the solution. The color of the mixture rightly changed to pale brown and then became dark brown. The whole reaction proceeded for 30 h. The PDA nanospheres were separated by centrifugation. After that, they were washed three times with water.
Cu nanoparticles (CuNPs) were prepared using a modified version of a previously reported method [26]. 800 μL of ammonia aqueous solution was added to copper chloride dihydrate solution (50 mL, 11.16 mmol) and at room temperature for 6 h under vigorous stirring. The products were purified by washing with water. Finally, CuNPs were obtained and dispersed in 20 mL water.
PDA/CuNP hybrids were prepared as follows [27]. PDA nanospheres were dispersed in an aqueous solution of 0.20% PDDA. And this solution contained 0.2 M Tris and 0.2 M NaCl. The dispersion was always stirred for 20 min for surface functionalization with PDDA. Residual PDDA can be removed by high-speed centrifugation and the complex was also rinsed with water at least three times. The composite (0.06 g) was dispersed in a CuNP solution (10 mL). What’s more, the mixture was stirred for 20 min. Centrifugation and further washing gave PDA/CuNPs.
PDA/CuNPs-aptamer labels were prepared as follows. PDA/CuNPs were dispersed under the above condition. And the dispersion was stirred for 30 min. The composite was separated by centrifugation and then it was washed with water to remove residual PDDA. It was dispersed under agitation in a solution containing 0.50% PAA for 30 min. Residual PAA was removed by high-speed centrifugation. The resulting composite was self-assembled with PDDA and PAA by the way of repeating the above steps. To activate the carboxyl groups of PAA, after surface modification, the obtained PDA/CuNPs were immersed in a solution containing EDC (1 mg/mL) and NHS (0.5 mg/mL) for 30 min. The hybrid was then immediately immersed in a mixture of 5 μM aptamer solution for 2 h at the temperature of 37 °C to yield biolabels (PDA/CuNPs-aptamer). The remaining active sites of PDA/CuNPs-aptamer were blocked by incubation in BSA (5%) for 2 h at 37 °C. The nanocomposite was separated and washed three times with Tris-HCl buffer (pH 7.4) and it was stored in pH 7.4 Tris-HCl buffer solution at 4 °C.
2.4. Preparation of Magnetic Probes
Fe3O4 nanospheres were synthesized by a solvothermal method that was modified [28]. FeCl3·6H2O (1.35 g) was dissolved in glycol (40 mL) to form a solution, followed by addition of sodium acetate (3.6 g) and poly(ethylene glycol) (1.0 g). After that, the mixture was stirred vigorously for 30 min and finally it was sealed in a Teflon-lined stainless-steel autoclave (50 mL capacity). This kind of autoclave was heated and maintained at 200 °C for 8 h and then it was cooled naturally. The product was collected with an external magnet and it was washed with ethanol and water.
Fe3O4@SiO2 nanoparticles were all prepared using a modified version of a previously reported method [29]. Fe3O4 (300 mg) was dispersed in a type of mixture of ethanol (40 mL) and water (4 mL). The mixture was sonicated for 15 min and ammonia (5 mL) and TEOS (2 mL) were gradually added under stirring. The series of reaction was performed for 12 h. In addition, the product was separated magnetically and it was washed three times with HCl (0.1 mol/L) and water and vacuum dried at the temperature 40 °C for 12 h.
A Fe3O4@SiO2@PAA nanocomposite was prepared using a previously reported procedure [30]. Fe3O4@SiO2 (1 g) was dispersed in dimethylformamide (DMF, 33 mL) and mixed with a solution of PAA (2 g) in DMF (33 mL). After sonication for 30 min, the mixture was heated to 110 °C under the condition of vigorous stirring. 4-Dimethylaminopyridine (0.033 g) dissolved in DMF (3.3 mL) and dicyclohexylcarbodiimide (0.33 g) dissolved in DMF (6.6 mL) were added dropwise. The mixture was stirred at 110 °C for 12 h. And the product was separated magnetically and washed three times with ethanol and water.
Fe3O4@SiO2-antibody immune probes were prepared by an established method [30]. Fe3O4@SiO2@PAA (6 mg) was dispersed in a solution that contained EDC (1 mg/mL) and NHS (0.5 mg/mL) for 30 min. After activation, the Fe3O4@SiO2@PAA was rinsed with Tris-HCl (pH 7.4) and immediately dispersed in an antibody solution (0.2 mg/mL) for 2 h to yield Fe3O4@SiO2-antibody. The composite was magnetically washed five times with Tris-HCl to remove residual antibodies. The remaining active sites of Fe3O4@SiO2@PAA-antibody were blocked by incubating with 5% BSA at 37 °C for 2 h. The composite was magnetically washed three with Tris-HCl. The probes were stored in Tris-HCl (5 mL, pH 7.4) at 4 °C before it was used.
2.5. Sensor Fabrication
Fe3O4@SiO2-antibody (20 μL, 0.6 mg/mL) and PDA/CuNPs-aptamer (15 μL, 12 mg/mL) were added to a solution containing an unknown concentration of MC-LR (65 μL). A schematic diagram of all the process can be found in Scheme 1. The mixture was shaken vigorously in a thermostatic shaker at the temperature of 37 °C for 2 h. Subjected the mixture to a magnetic field of a magnet for one minute and the non-magnetic constituents including unreacted biolabel were discarded in the process. The magnetically separated complexes were clearly washed three times with distilled water. Nitric acid (100 μL, 1.2 M) was added dropped to the composite (20 min) to dissolve the labeled CuNPs to give Cu ions. The solution pH was adjusted to weakly acidic with 1 M NaOH (110 μL). Sodium citrate solution (20 μL, 0.4 g/mL) and Tris-HCl (40 μL, pH 9.0) were added to the mixture. BCO (40 mL, 2 g/L) was added to the solution and reacted for 10 min. The colorimetric absorbance was used to determine the MC-LR concentration.
3. Results and Discussion
3.1. Characterization of Magnetic Beads and PDA/CuNP Hybrids
TEM images of Fe3O4@SiO2 and Fe3O4 are shown in Figure 1. The figure shows spherical Fe3O4 particles of average diameter 200 nm, with a narrow size distribution. Fe3O4@SiO2 is quasi-spherical and wrapped in a layer of thickness 35 nm. The magnetic properties of Fe3O4 and Fe3O4@SiO2 were investigated (Figure 1F). The corresponding hysteresis loops show that the magnetic saturations were 67.8 and 47.9 emu/g, respectively. This indicates that the SiO2 shells decreased the magnetic strength. The FTIR spectra are shown Figure 1G. The characteristic peak at 589 cm−1 keeps in line with the Fe–O stretching vibration of Fe3O4 (Figure 1G,a). The characteristic peak at 1088 cm−1 is in line with the Si–O–Si stretching vibration. The peak at 980 cm−1 arises from Si–OH groups. In addition, the peaks at 3430 and 1630 cm−1 correspond to the O–H stretching and H–O–H bending vibration (Figure 1G,b and c). The results show that surface functionalization gave a flexible surface with functional groups and biocompatibility and adjusted the magnetic strength to give decreased bird-nesting; these effects are beneficial for bioapplications.
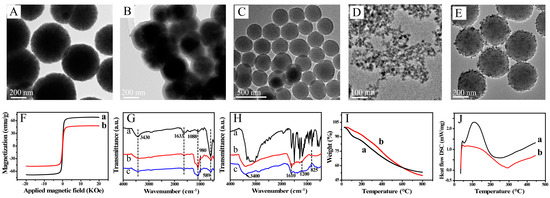
Figure 1.
Transmission electron microscopy (TEM) images of Fe3O4 (A), Fe3O4@SiO2 (B), PDA (C), CuNPs (D) and PDA@CuNPs (E); (F) vibrating sample magnetometry curves for (a) Fe3O4 and (b) Fe3O4@SiO2; (G) Fourier transform infrared (FTIR) spectra of (a) Fe3O4, (b) Fe3O4@SiO2 and (c) Fe3O4@SiO2@PAA; (H) FTIR spectra of (a) dopamine hydrochloride, (b) PDA and (c) PDA@CuNPs; thermogravimetric analysis (TGA) (I) and differential scanning calorimetry (DSC) (J) curves for (a) PDA and (b) PDA@CuNPs.
PDA is attracting increasing interest because of its special properties. The synthesized PDA nanospheres were uniformly spherical and of diameter ~300 nm (Figure 1C). The isoelectric point of PDA is at pH 4. In a weak alkali, the PDA spheres have a negative potential surface because of deprotonation of the phenol group, which can electrostatically adsorb cationic PDDA; a surface with homogeneously distributed positive charges is obtained. To enable rapid dissolution and a good sensing performance, CuNPs of diameter 8–12 nm were synthesized (Figure 1D). These negatively charged CuNPs were effectively anchored on the surfaces of the PDA nanospheres by electrostatic attraction (Figure 1E). The FTIR spectrum of the PDA nanospheres shows the characteristic peaks from several functional groups, for example, N–H, –OH, C–O and C–N (Figure 1H). The peak at 3400 cm−1 corresponds to O–H and N–H stretching. The peaks at 1610, 825 and 1200 cm−1 are attributed to the stretching vibrations of C=C, C–H and C–O, respectively. The TGA and DSC curves for PDA and PDA/CuNPs are shown in Figure 1I,J. The rate of weight loss for PDA/CuNPs was slower than that for PDA; the weight losses at 800 °C were approximately 50.28 and 46.81 wt%, respectively. The slower weight loss was mainly caused by the anchored CuNPs. The endothermal capacity decreased and the exothermal process was postponed by the introduction of CuNPs.
3.2. Proof of Concept for Proposed Sensor
Recently, off-to-on probes have attracted intense interest. As show in Figure 2A, Cu ions or BCO in a solution of sodium citrate and triethanolamine gave no UV-Vis absorption peak at 450 to 800 nm (Figure 2A,a and b). However, an intense absorbance was observed after mixing Cu2+ with BCO in solution, as a result of complex formation. The selectivity, which is important for metal ion probes, was explored by introducing various metal ions into a BCO solution, namely K+, Na+, Ag+, Mg2+, Ca2+, Cd2+, Co2+, Al3+ and Fe3+. As show in Figure 2B, coloration and colorimetric absorption were only observed in the presence of Cu2+; when other metal ions were added to BCO, the colorimetric absorption and solution color did not change compared with those of the substrate solution. These results indicate that the colorimetric probe has excellent selectivity and has high anti-interference when used in Cu-based analytical labels.
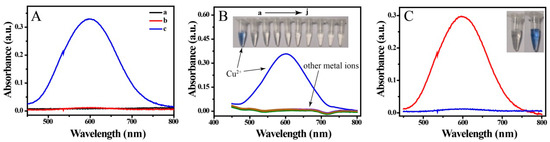
Figure 2.
(A) Absorbance spectra of (a) Cu2+ and (b) bis(cyclohexanone)oxaldihydrazone (BCO) in solution of sodium citrate and triethanolamine and (c) mixture of Cu2+ and BCO in the solution; (B) absorbance spectra and photographs of BCO mixed with various metal ions, namely Cu2+, K+, Na+, Ag+, Mg2+, Ca2+, Cd2+, Co2+, Al3+ and Fe3+ (20 μM); and (C) absorbance spectra and photographs of sensing solution in absence (blue curve) and presence of MC-LR (15 nM, red curve).
Here, Cu was used in a biolabel, as shown in Scheme 1. Proof of concept is necessary for a novel method. PDA/CuNPs-aptamer and Fe3O4@SiO2-antibody were added to a solution of MC-LR and incubated for 120 min. A magnet was then applied to the mixture and the non-magnetic components were discarded. Nitric acid was added and the pH was changed slightly to 9 Tris-HCl buffer solution and with NaOH. BCO was added and the mixture color changed to clear blue; the absorption spectrum λmax was at 600 nm. This provided proof of concept and confirmed the feasibility of constructing a colorimetric sensor for MC-LR (Figure 2C). However, we observed a small peak at 600 nm for the immunosensor in the absence of MC-LR solution (Figure 2C). The detection conditions were therefore optimized as follows.
3.3. Optimization of Conditions
The concentrations of Fe3O4@SiO2-antibody and PDA/CuNPs-aptamer in analytic solution were first optimized to improve the MC-LR-sensing performance. Figure 3A shows that the absorbance intensities gradually increased with increasing Fe3O4@SiO2-antibody concentration (single variable) from 0.03 to 0.12 mg/mL and then became relatively stable; a similar trend was observed for PDA/CuNPs-aptamer (Figure 3B). These results indicate that the concentration of the label and magnetic probe were pivotal factors in the sensor performance. In subsequent experiments, Fe3O4@SiO2-antibody and PDA/CuNPs-aptamer concentrations of 0.12 and 1.8 mg/mL, respectively, were used. Next, the pH of the detection solution was optimized. The results show that the absorbance gradually increased with increasing pH from 6.0 to 9.0 and then it turned out to decrease at pH 9.0 to 11.0 (Figure 3C); this was related to the conformation and stability of the constituents. Subsequent experiments were performed at pH 9.0.
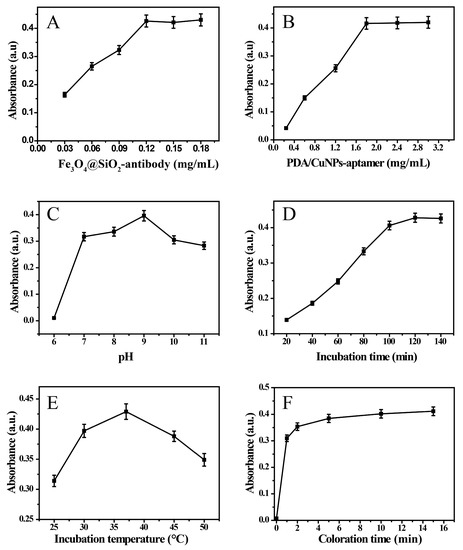
Figure 3.
Effects of various concentration of Fe3O4@SiO2-antibody (A) and PDA/CuNPs-aptamer (B), pH (C), incubation time (D), incubation temperature (E) and coloration time (F) on signal intensity. MC-LR concentration was 25 nM. Error bars are standard deviations across three repeated experiments.
The specific interactions between molecules are affected by the reaction period and temperature. The final absorbance first increased with incubation time and then remained stable after 120 min (Figure 3D). To achieve high efficiency, 120 min was selected as the incubation time because a longer incubation time actually did not significantly increase the signal. The incubation temperature was also an important factor in the immunological reaction. Figure 3E shows that the maximum response signal was obtained after incubating at 37 °C. The signal intensity decreased at higher temperatures, which indicates that the biomolecular activity decreased at higher temperatures. The incubation temperature of 37 °C was therefore chosen in the process for the MC-LR sensor. The coloration time was also evaluated. As show in Figure 3F, the absorbance intensity increased sharply within the first 10 min and a stable absorbance was observed after 10 min. These results indicate that the reaction between Cu2+ and BCO is a fast-kinetic process. A coloration time of 10 min was used.
4. Analytical Performance of MC-LR Sensor
4.1. Calibration Curves
Under optimized condition, the detection ability of the developed UV-Vis sensor was tested by using many different kinds of concentration of MC-LR. The photographs of the centrifuge tubes in Figure 4A show that as the MC-LR concentration increased, a distinct color change was observed: the color gradually changed from colorless to blue and then deeper blue. This indicates that the sensor has potential applications as a visual sensor. Further colorimetric results showed that the absorbance intensity at 600 nm tend to increase with increasing MC-LR concentration and a good linear relationship was obtained from 0.05 to 25 nM, with limit of detection (LOD) of 0.05 nM (0.05 μg/L) (S/N = 3) (Figure 4). The linear regression equation was A600 (a.u.) = 0.0164C [MC-LR] (nM) + 0.0381 (R = 0.9990). Under the condition that the concentration of MC-LR was higher than 25 nM, the absorbance tended to change slowly, and the relationship departed from linearity. The absorbance for 0 M MC-LR almost disappeared, compared with that in Figure 2C. Here, the background, including the non-specific signal, was negligible when considering signal enhancement in the presence of the target MC-LR, indicating an off-to-on process.
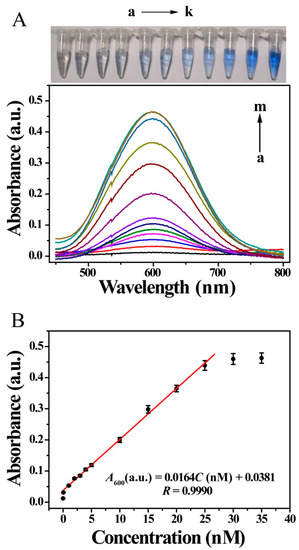
Figure 4.
UV-Vis responses of sensor to various concentrations of MC-LR. (A) photographs of MC-LR solutions of various concentrations (a–k) and colorimetric spectra of sensor for various MC-LR concentrations (nM): (a) 0, (b) 0.05, (c) 1.0, (d) 2.0, (e) 3.0, (f) 4.0, (g) 5.0, (h) 10.0, (i) 15.0, (j) 20.0, (k) 25.0, (l) 30.0 and (m) 35.0; (B) corresponding calibration curve of absorbance values at 600 nm against MC-LR concentration.
4.2. Selectivity, Reproducibility and Stability of MC-LR Sensor
MCs are the most common cyanotoxins and have many variants. The selectivity of systems for their analysis is therefore important. The selectivity of the present colorimetric system was investigated by incubation with 10 nM MC-LR and other potential coexisting species, namely common cyanotoxins (100 nM, MC-RR, MC-LF, MC-LW, MC-YR and OA), metal ions (0.01 M, Na+, K+, Ag+, Ca2+, Mg2+, Cu2+, Co2+, Cd2+, Al3+ and Fe3+) and some organic compounds (0.01 M, phenol, acetamiprid, thiamethoxam, thiacloprid and dinotefuran). Figure 5A shows that interfering substances just had little influence on the sensing signals and the sensor displayed extremely high selectivity for MC-LR. The developed colorimetric sensor showed outstanding selectivity when used in the co-presence of other pollutants.
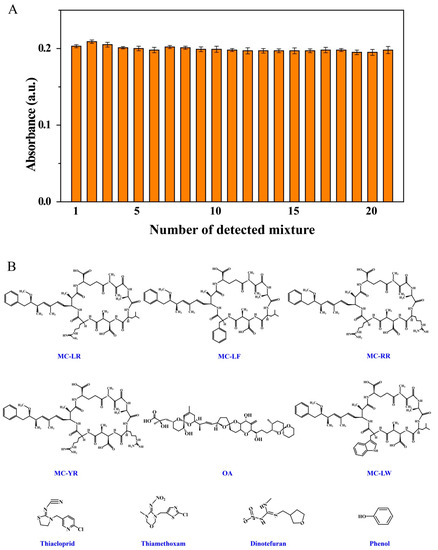
Figure 5.
Effects of coexisting substances on colorimetric response of MC-LR. Solution composition: (A) (1) 10.0 nM MC-LR in Tris-HCl buffer solution (0.2 M, pH 7.4); mixtures of 10.0 nM MC-LR with (2) MC-LF, (3) MC-RR, (4) MC-YR, (5) OA, (6) MC-LW, (7) K+, (8) Cu2+, (9) Ag+, (10) Ca2+, (11) Na+, (12) Co2+, (13) Mg2+, (14) Al3+, (15) Fe3+, (16) Cd2+, (17) thiacloprid, (18) thiamethoxam, (19) dinotefuran and (20) phenol; (21) mixture of 1 with the other 20 types of interferent. (B) Molecular structures of interferents.
In fact, not only reproducibility but also stability is a very crucial factor in an analytical strategy. In order to evaluate the reducibility of the developed sensor, MC-LR (15 nM) detection was performed six times; the relative standard deviation (RSD), that is, 2.06%, indicated good reproducibility. The stability of the sensor was further evaluated as follows. After storage at 4 °C for 30 days, PDA/CuNPs-aptamer share a common analytical system in combination with newly prepared Fe3O4@SiO2-antibody; 99.3% of the initial response of PDA/CuNPs-aptamer to MC-LR was retained and it has high specificity. When Fe3O4@SiO2-antibody was stored at 4 °C for a month and then used in the analytical system with PDA/CuNPs-aptamer, 98.5% of the initial response of it to MC-LR was retained. When PDA/CuNPs-aptamer and Fe3O4@SiO2-antibody probes were used after storage at 4 °C for a month, the UV-Vis absorption intensity retained over 97.7% of the initial response to MC-LR. All these results indicate that the capturing components of the antibody-MC-LR-aptamer sandwich have good stability and specificity. These are due to the biocompatibility of the surface microenvironment in biomolecular conjugation.
4.3. Analytical Application of Fabricated Sensor
The accuracy and applicability of the proposed method were investigated by performing real sample analysis in real time. MC-LR was detected in spiked samples, namely commercial milk, orange juice, drinking water and river water. The data in Table 1 show that MC-LR recovery was 95.50–105.00% and the RSD was 1.34–3.10% for the spiked samples; these results imply that the sensor gives good precision and repeatability. The prepared sensor performance was therefore acceptable, and the sensor has potential practical applications in MC-LR detection in real samples.

Table 1.
MC-LR detection results obtained using proposed method (n = 6).
4.4. Comparison of Analytical Performance
We studied the methods for MC-LR detection reported over the past decade; these include colorimetric analysis and fluorescence. The performance of the fabricated sensor was compared with the previously reported methods in terms of the LOD, linear interval, anti-interference ability. What’s more, recovery from real samples (Table 2). The results show that the LOD of the developed sensor was much lower than most of the previously reported values, indicating that PDA/CuNPs act as excellent biolabels in assay systems. Until now, the anti-interference ability of our sensor was the best, which suggests that the dual-recognition model is superior to other methods. In addition, the linear interval and recovery of our system were better than MC-LR that was previously reported. The comparison shows the significance of amplification by PDA/CuNPs nanocomposites in terms of the turn-on response.
Table 2.
Comparison of analytical parameters for MC-LR detection obtained in this study and those reported for previous studies.
5. Conclusions
In this study, a facile and efficient colorimetric strategy was developed for improved detection of MC-LR. PDA/CuNPs were used as biolabels and magnetic beads were used as separation probes. The special features of the sensor were the result of a dual-recognition strategy that involved an antibody-MC-LR-aptamer complex with low steric hindrance and specific color formation by interactions between Cu2+ and BCO. High sensitivity was achieved through the synergistic effect of releasable CuNPs and a low colorimetric background from off-to-on coloration. The magnetic probes provided a good platform for rapid enrichment and separation. Analysis could be accomplished within 150 min, with high selectivity, reproducibility and stability. This method performed well in real sample tests. The method has a wide range of potential applications in food security, clinical diagnosis and environmental monitoring by using different specific bioelements and could be used for visible detection.
Author Contributions
Conceptualization, Z.Y.; investigation, X.T. and X.L.; writing—original draft preparation, X.T.; writing—review and editing, Z.Y., Y.Z., Z.Z, Y.L. and G.Z.; supervision, Z.Y., L.L. and X.W.; funding acquisition, Z.Y., L.L., Y.Z. and Y.L.
Funding
This research was supported by Zhejiang Provincial Natural Science Foundation of China under Grant No. LY18B050005 and LY16B050007, the National Natural Science Foundation of China (21677060, 21507041), the Program for Science and Technology of Zhejiang and Jiaxing (2017AY33086 and 2017C37029).
Conflicts of Interest
The authors declare no conflict of interest.
References
- Fischer, W.J.; Dietrich, D.R. Toxicity of the cyanobacterial cyclic heptapeptide toxins microcystin-LR and -RR in early life-stages of the African clawed frog (Xenopus laevis). Aquat. Toxicol. 2000, 49, 189–198. [Google Scholar] [CrossRef]
- Singh, S.; Srivastava, A.; Oh, H.M.; Ahn, C.Y.; Choi, G.G.; Asthana, R.K. Recent trends in development of biosensors for detection of microcystin. Toxicon 2012, 60, 878–894. [Google Scholar] [CrossRef] [PubMed]
- Li, X.; Cheng, R.; Shi, H.; Tang, B.; Xiao, H.; Zhao, G. A simple highly sensitive and selective aptamer-based colorimetric sensor for environmental toxins microcystin-LR in water samples. J. Hazard. Mater. 2016, 304, 474–480. [Google Scholar] [CrossRef] [PubMed]
- Preece, E.P.; Hardy, F.J.; Moore, B.C.; Bryan, M. A review of microcystin detections in Estuarine and Marine waters: Environmental implications and human health risk. Harmful Algae 2017, 61, 31–45. [Google Scholar] [CrossRef]
- Eissa, S.; Ng, A.; Siaj, M.; Zourob, M. Label-free voltammetric aptasensor for the sensitive detection of microcystin-LR using graphene-modified electrodes. Anal. Chem. 2014, 86, 7551–7557. [Google Scholar] [CrossRef] [PubMed]
- Zhang, J.; Lei, J.; Xu, C.; Ding, L.; Ju, H. Carbon nanohorn sensitized electrochemical immunosensor for rapid detection of microcystin-LR. Anal. Chem. 2010, 82, 1117–1122. [Google Scholar] [CrossRef] [PubMed]
- Zhang, J.; Xiong, Z.; Chen, Z. Ultrasensitive electrochemical microcystin-LR immunosensor using gold nanoparticle functional polypyrrole microsphere catalyzed silver deposition for signal amplification. Sens. Actuators B Chem. 2017, 246, 623–630. [Google Scholar] [CrossRef]
- Gan, C.; Wang, B.; Huang, J.; Qileng, A.; He, Z.; Lei, H.; Liu, W.; Liu, Y. Multiple amplified enzyme-free electrochemical immunosensor based on G-quadruplex/hemin functionalized mesoporous silica with redox-active intercalators for microcystin-LR detection. Biosens. Bioelectron. 2017, 98, 126–133. [Google Scholar] [CrossRef] [PubMed]
- Pang, P.; Teng, X.; Chen, M.; Zhang, Y.; Wang, H.; Yang, C.; Yang, W.; Barrow, C.J. Ultrasensitive enzyme-free electrochemical immunosensor for microcystin-LR using molybdenum disulfide/gold nanoclusters nanocomposites as platform and Au@Pt core-shell nanoparticles as signal enhancer. Sens. Actuat. B Chem. 2018, 266, 400–407. [Google Scholar] [CrossRef]
- Wei, J.; Qileng, A.; Yan, Y.; Lei, H.; Zhang, S.; Liu, W.; Liu, Y. A novel visible-light driven photoelectrochemical immunosensor based on multi-amplification strategy for ultrasensitive detection of microcystin-LR. Anal. Chim. Acta 2017, 994, 82–91. [Google Scholar] [CrossRef] [PubMed]
- Chen, J.; Gao, P.; Wang, H.; Han, L.; Zhang, Y.; Wang, P.; Jia, N. PPy/Cu2O molecular imprinting composite film based visible light-responsive photoelectrochemical sensor for microcystin-LR. J. Mater. Chem. C 2018, 6, 3937–3944. [Google Scholar] [CrossRef]
- Qileng, A.; Cai, Y.; Wei, J.; Lei, H.; Liu, W.; Zhang, S.; Liu, Y. Construction of CdS/B-TiO2 nanorods photoelectrochemical immunosensor for the detection of microcystin-LR using SiO2 @G-quadruplex as multi-amplifier. Sens. Actuators B Chem. 2018, 254, 727–735. [Google Scholar] [CrossRef]
- Du, X.; Jiang, D.; Li, H.; Hao, N.; You, T.; Wang, K. An intriguing signal-off responsive photoelectrochemical aptasensor for ultrasensitive detection of microcystin-LR and its mechanism study. Sens. Actuators B Chem. 2018, 259, 316–324. [Google Scholar] [CrossRef]
- Hu, C.; Gan, N.; Chen, Y.; Bi, L.; Zhang, X.; Song, L. Detection of microcystins in environmental samples using surface plasmon resonance biosensor. Talanta 2009, 80, 407–410. [Google Scholar] [CrossRef] [PubMed]
- Lv, J.; Zhao, S.; Wu, S.; Wang, Z. Upconversion nanoparticles grafted molybdenum disulfide nanosheets platform for microcystin-LR sensing. Biosens. Bioelectron. 2017, 90, 203–209. [Google Scholar] [CrossRef] [PubMed]
- Lvova, L.; Guanais, C.G.; Prodi, L.; Lombardo, M.; Zaccheroni, N.; Viaggiu, E.; Congestri, R.; Guzzella, L.; Pozzoni, F.; Di, C.N. Non-enzymatic portable optical sensors for microcystin-LR. Chem. Commun. 2018, 54, 2747–2750. [Google Scholar] [CrossRef] [PubMed]
- Zhu, Y.; Xu, L.; Ma, W.; Chen, W.; Yan, W.; Kuang, H.; Wang, L.; Xu, C. G-quadruplex DNAzyme-based microcystin-LR (toxin) determination by a novel immunosensor. Biosens. Bioelectron. 2011, 26, 4393–4398. [Google Scholar] [CrossRef] [PubMed]
- Abnous, K.; Danesh, N.M.; Ramezani, M.; Taghdisi, S.M. Colorimetric determination of the microcystin leucine-arginine based on the use of a hairpin aptamer, graphene oxide and Methylene Blue acting as an optical probe. Microchim. Acta 2017, 184, 4451–4457. [Google Scholar] [CrossRef]
- Neumann, A.C.; Wang, X.; Niessner, R.; Knopp, D. Determination of microcystin-LR in surface water by a magnetic bead-based colorimetric immunoassay using antibody-conjugated gold nanoparticles. Anal. Method 2016, 8, 57. [Google Scholar] [CrossRef]
- Oztekin, Y.; Tok, M.; Bilici, E.; Mikoliunaite, L.; Yazicigil, Z.; Ramanaviciene, A.; Ramanavicius, A. Copper nanoparticle modified carbon electrode for determination of dopamine. Electrochim. Acta 2012, 76, 201–207. [Google Scholar] [CrossRef]
- Baniukevic, J.; Boyaci, I.H.; Bozkurt, A.G.; Tamer, U.; Ramanavicius, A.; Ramanaviciene, A. Magnetic gold nanoparticles in SERS-based sandwich immunoassay for antigen detection by well oriented antibodies. Biosens. Bioelectron. 2013, 43, 281–288. [Google Scholar] [CrossRef] [PubMed]
- Han, C.; Doepke, A.; Cho, W.; Likodimos, V.; de la Cruz, A.A.; Back, T.; Heineman, W.R.; Halsall, H.B.; Shanov, V.N.; Schulz, M.J.; et al. A Multiwalled-Carbon-Nanotube-Based Biosensor for Monitoring Microcystin-LR in Sources of Drinking Water Supplies. Adv. Funct. Mater. 2013, 23, 1807–1816. [Google Scholar] [CrossRef]
- Zanato, N.; Talamini, L.; Silva, T.R.; Vieira, I.C. Microcystin-LR label-free immunosensor based on exfoliated graphite nanoplatelets and silver nanoparticles. Talanta 2017, 175, 38–45. [Google Scholar] [CrossRef] [PubMed]
- Ng, A.; Chinnappan, R.; Eissa, S.; Liu, H.; Tlili, C.; Zourob, M. Selection, characterization and biosensing application of high affinity congener-specific microcystin-targeting aptamers. Environ. Sci. Technol. 2012, 46, 10697–10703. [Google Scholar] [CrossRef] [PubMed]
- Ai, K.; Liu, Y.; Ruan, C.; Lu, L.; Lu, G.M. Sp2 C-dominant N-doped carbon sub-micrometer spheres with a tunable size: A versatile platform for highly efficient oxygen-reduction catalysts. Adv. Mater. 2013, 25, 998–1003. [Google Scholar] [CrossRef] [PubMed]
- Young Hwan, K.; Don Keun, L.; Hyun Gil, C.; Woo, K.C.; Cheol, K.Y.; Young Soo, K. Preparation and characterization of the antibacterial Cu nanoparticle formed on the surface of SiO2 nanoparticles. J. Phys. Chem. B 2006, 110, 24923–24928. [Google Scholar]
- Cui, R.; Liu, C.; Shen, J.; Gao, D.; Zhu, J.; Chen, H. Gold Nanoparticle-Colloidal Carbon Nanosphere Hybrid Material: Preparation, Characterization and Application for an Amplified Electrochemical Immunoassay. Adv. Funct. Mater. 2008, 18, 2197–2204. [Google Scholar] [CrossRef]
- Deng, Y.; Qi, D.; Deng, C.; Zhang, X.; Zhao, D. Superparamagnetic high-magnetization microspheres with an Fe3O4@SiO2 core and perpendicularly aligned mesoporous SiO2 shell for removal of microcystins. J. Am. Chem. Soc. 2008, 130, 28–29. [Google Scholar] [CrossRef] [PubMed]
- Men, H.F.; Liu, H.Q.; Zhang, Z.L.; Huang, J.; Zhang, J.; Zhai, Y.Y.; Li, L. Synthesis, properties and application research of atrazine Fe3O4@SiO2 magnetic molecularly imprinted polymer. Environ. Sci. Pollut. Res. 2012, 19, 2271–2280. [Google Scholar] [CrossRef] [PubMed]
- Hu, R.R.; Yin, Z.Z.; Zeng, Y.B.; Zhang, J.; Liu, H.Q.; Shao, Y.; Ren, S.B.; Li, L. A novel biosensor for Escherichia coli O157:H7 based on fluorescein-releasable biolabels. Biosens. Bioelectron. 2016, 78, 31–36. [Google Scholar] [CrossRef] [PubMed]
- Long, F.; He, M.; Zhu, A.N.; Shi, H.C. Portable optical immunosensor for highly sensitive detection of microcystin-LR in water samples. Biosens. Bioelectron. 2009, 24, 2346–2351. [Google Scholar] [CrossRef] [PubMed]
- Yu, H.W.; Jang, A.; Kim, L.H.; Kim, S.J.; Kim, I.S. Bead-Based Competitive Fluorescence Immunoassay for Sensitive and Rapid Diagnosis of Cyanotoxin Risk in Drinking Water. Environ. Sci. Technol. 2011, 45, 7804–7811. [Google Scholar] [CrossRef] [PubMed]
- Li, Y.; Sun, J.; Wu, L.; Ji, J.; Sun, X.; Qian, Y. Surface-enhanced fluorescence immunosensor using Au nano-crosses for the detection of microcystin-LR. Biosens. Bioelectron. 2014, 62, 255–260. [Google Scholar] [CrossRef] [PubMed]
- Zhou, L.; Zhu, A.; Lou, X.; Song, D.; Yang, R.; Shi, H.; Long, F. Universal quantum dot-based sandwich-like immunoassay strategy for rapid and ultrasensitive detection of small molecules using portable and reusable optofluidic nano-biosensing platform. Anal. Chim. Acta 2016, 905, 140–148. [Google Scholar] [CrossRef] [PubMed]
- Taghdisi, S.M.; Danesh, N.M.; Ramezani, M.; Ghows, N.; Mousavi Shaegh, S.A.; Abnous, K. A novel fluorescent aptasensor for ultrasensitive detection of microcystin-LR based on single-walled carbon nanotubes and dapoxyl. Talanta 2017, 166, 187–192. [Google Scholar] [CrossRef] [PubMed]
- Liu, L.; Zhou, X.; Wilkinson, J.S.; Hua, P.; Song, B.; Shi, H. Integrated optical waveguide-based fluorescent immunosensor for fast and sensitive detection of microcystin-LR in lakes: Optimization and Analysis. Sci. Rep.-UK 2017, 7, 3655. [Google Scholar] [CrossRef] [PubMed]
- Zhang, Y.; Ding, X.L.; Guo, M.M.; Han, T.T.; Huang, Z.J.; Shang, H.T.; Huang, B. Quantitative and rapid detection of microcystin-LR using time-resolved fluorescence immunochromatographic assay based on europium nanospheres. Anal. Methods 2017, 9, 6430–6434. [Google Scholar] [CrossRef]
- Zhang, H.; Yang, S.; Beier, R.C.; Beloglazova, N.V.; Lei, H.T.; Sun, X.L.; Ke, Y.B.; Zhang, S.X.; Wang, Z.H. Simple, high efficiency detection of microcystins and nodularin-R in water by fluorescence polarization immunoassay. Anal. Chim. Acta 2017, 992, 119–127. [Google Scholar] [CrossRef] [PubMed]


© 2019 by the authors. Licensee MDPI, Basel, Switzerland. This article is an open access article distributed under the terms and conditions of the Creative Commons Attribution (CC BY) license (http://creativecommons.org/licenses/by/4.0/).