3.1. Dynamo-Mechanical Analysis of Sep/SBR PNCs
DMTA was utilized to preliminarily assess the fraction of rubber with reduced mobility, which affects the stress/strain behavior of cured Sep/SBR PNCs. In detail, E′, E″ and Tan δ, in the temperature range from −40 to +80 °C) were monitored as a function of the different Sep fillers.
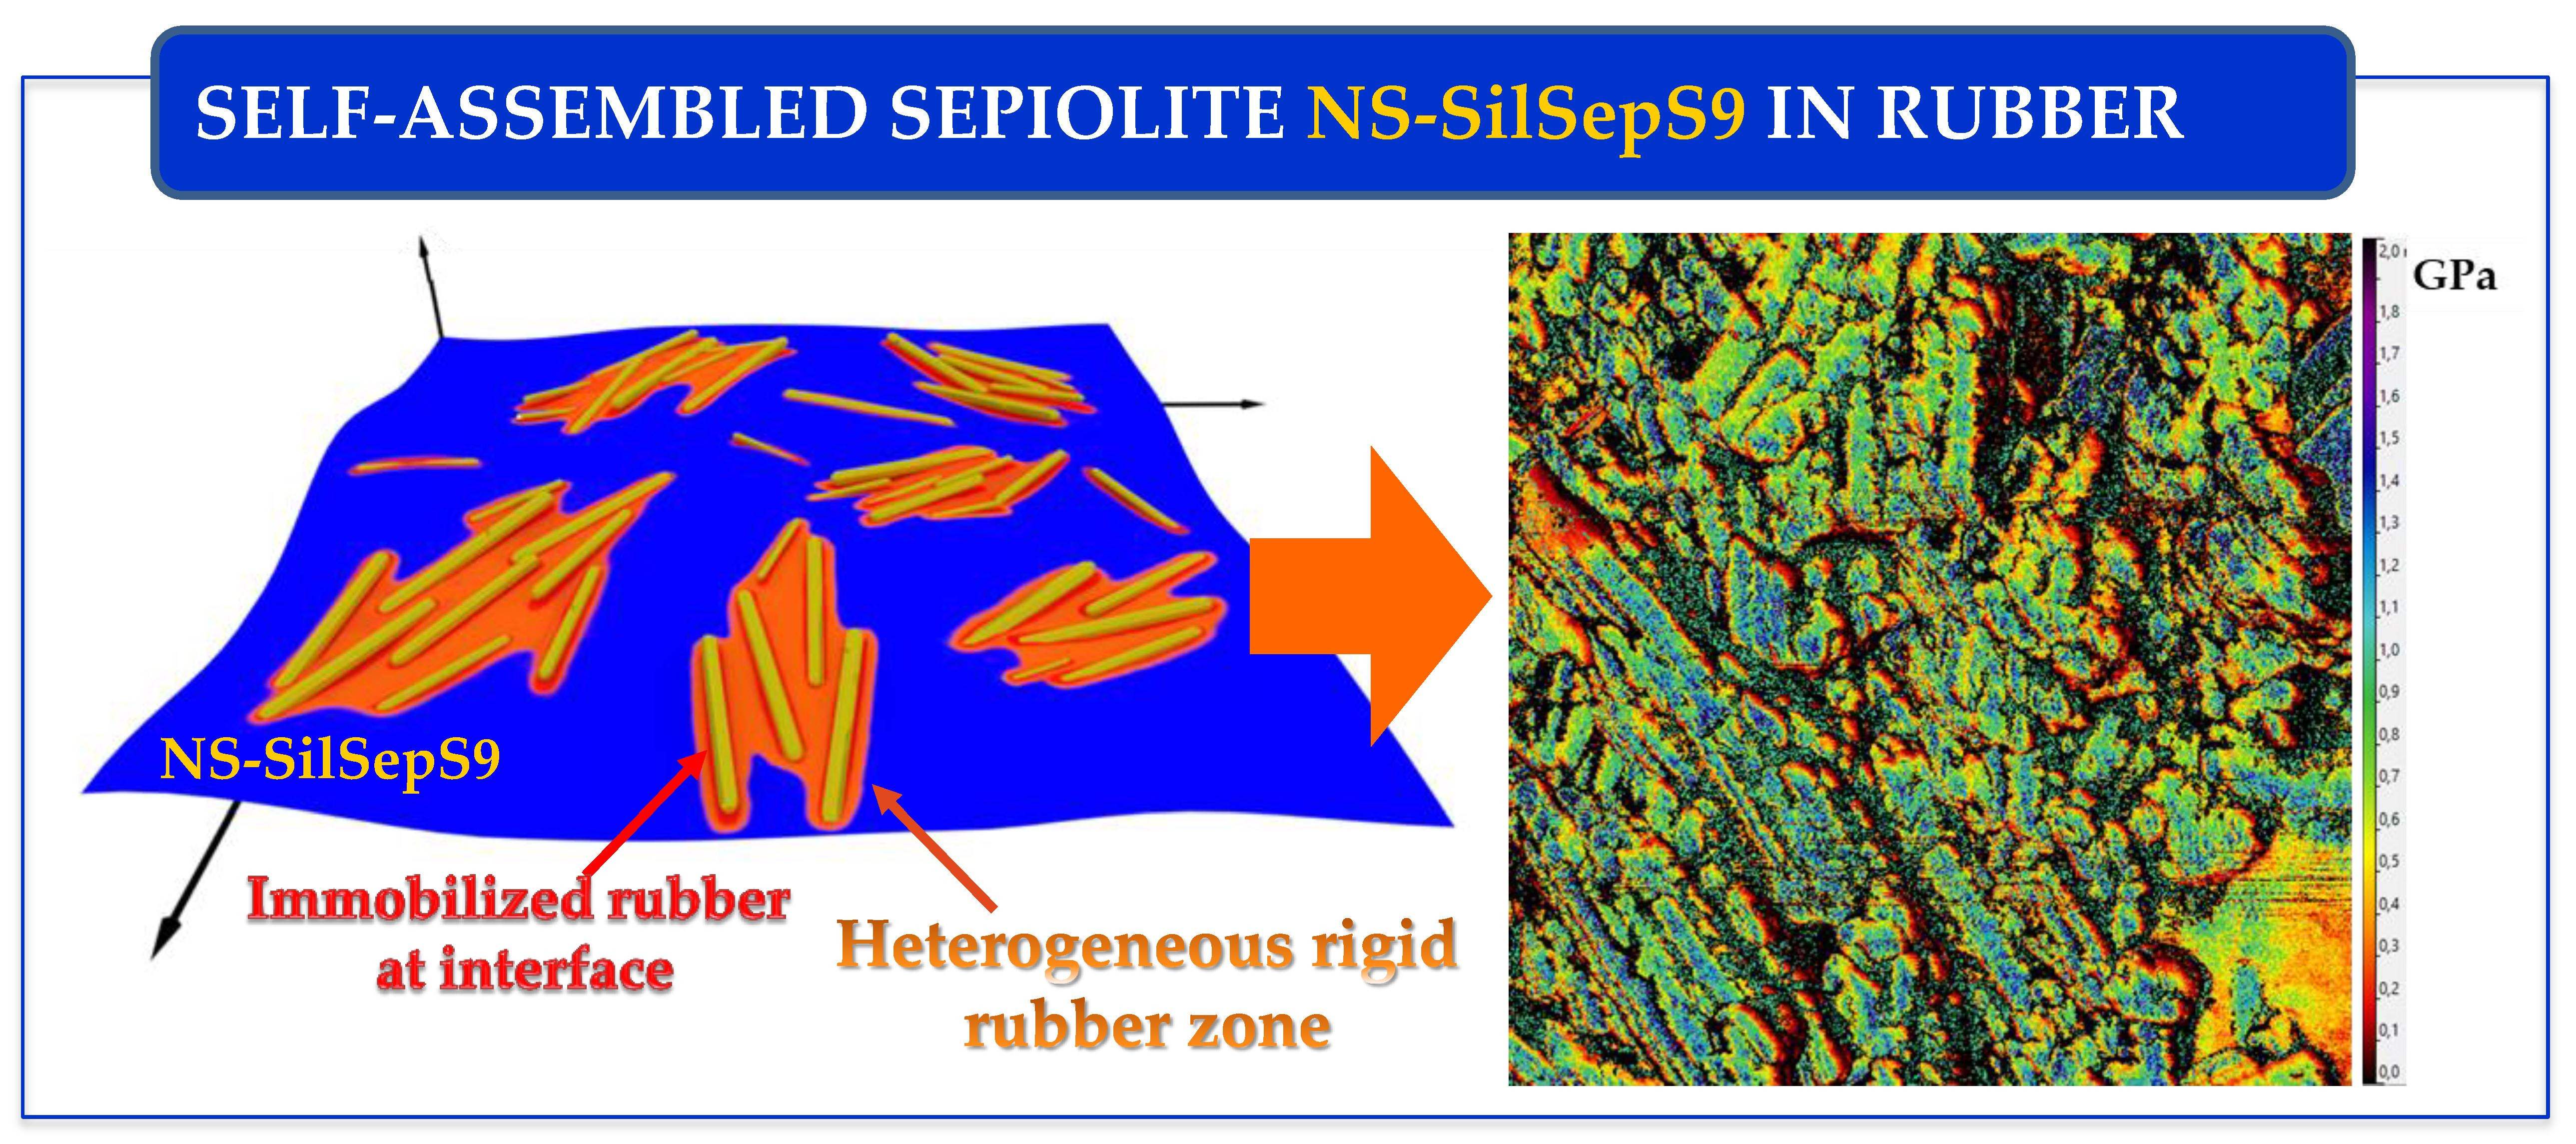
The evolution of E′ is plotted in
Figure 1 for pristine and modified SepS9 in comparison with unfilled V-SBR-REF-0 composite.
E′ reflects the elastic modulus of the rubber materials, which measures the recoverable strain energy in a deformed specimen. For all the samples, the sharp fall in E′ above −20 °C corresponds to the Tg region, as the modulus decreases drastically going from the glassy state toward the rubbery state. The modulus of the Sep/SBR composites is higher than that of neat SBR due to the reinforcing effect of the Sep fillers, which becomes more evident above Tg, T > 0 °C, when the rubber chains undergo fast segmental dynamics. Moreover, in the presence of the Sep fillers, the decreased region of E′ is shifted to higher temperatures. The reinforcement obtained for V-NS-SepS9/SBR (▲ line in
Figure 1) and V-NS-SilSepS9/SBR (▼ line in
Figure 1) is slightly lower than that of V-SepS9/SBR (● line in
Figure 1) as expected for PNCs containing anisotropic particles with a lower aspect ratio (AR) at small strains in the rubbery state (constant strain amplitude of 0.1%). In fact, after acid treatment, the AR of Sep fibers decreases from 30 for pristine SepS9 to 4 and 23, respectively, for NS-SepS9 and NS-SilSepS9, as already reported [
19]. The E′ value at 30 and 70 °C for the composites studied are listed in
Table 1.
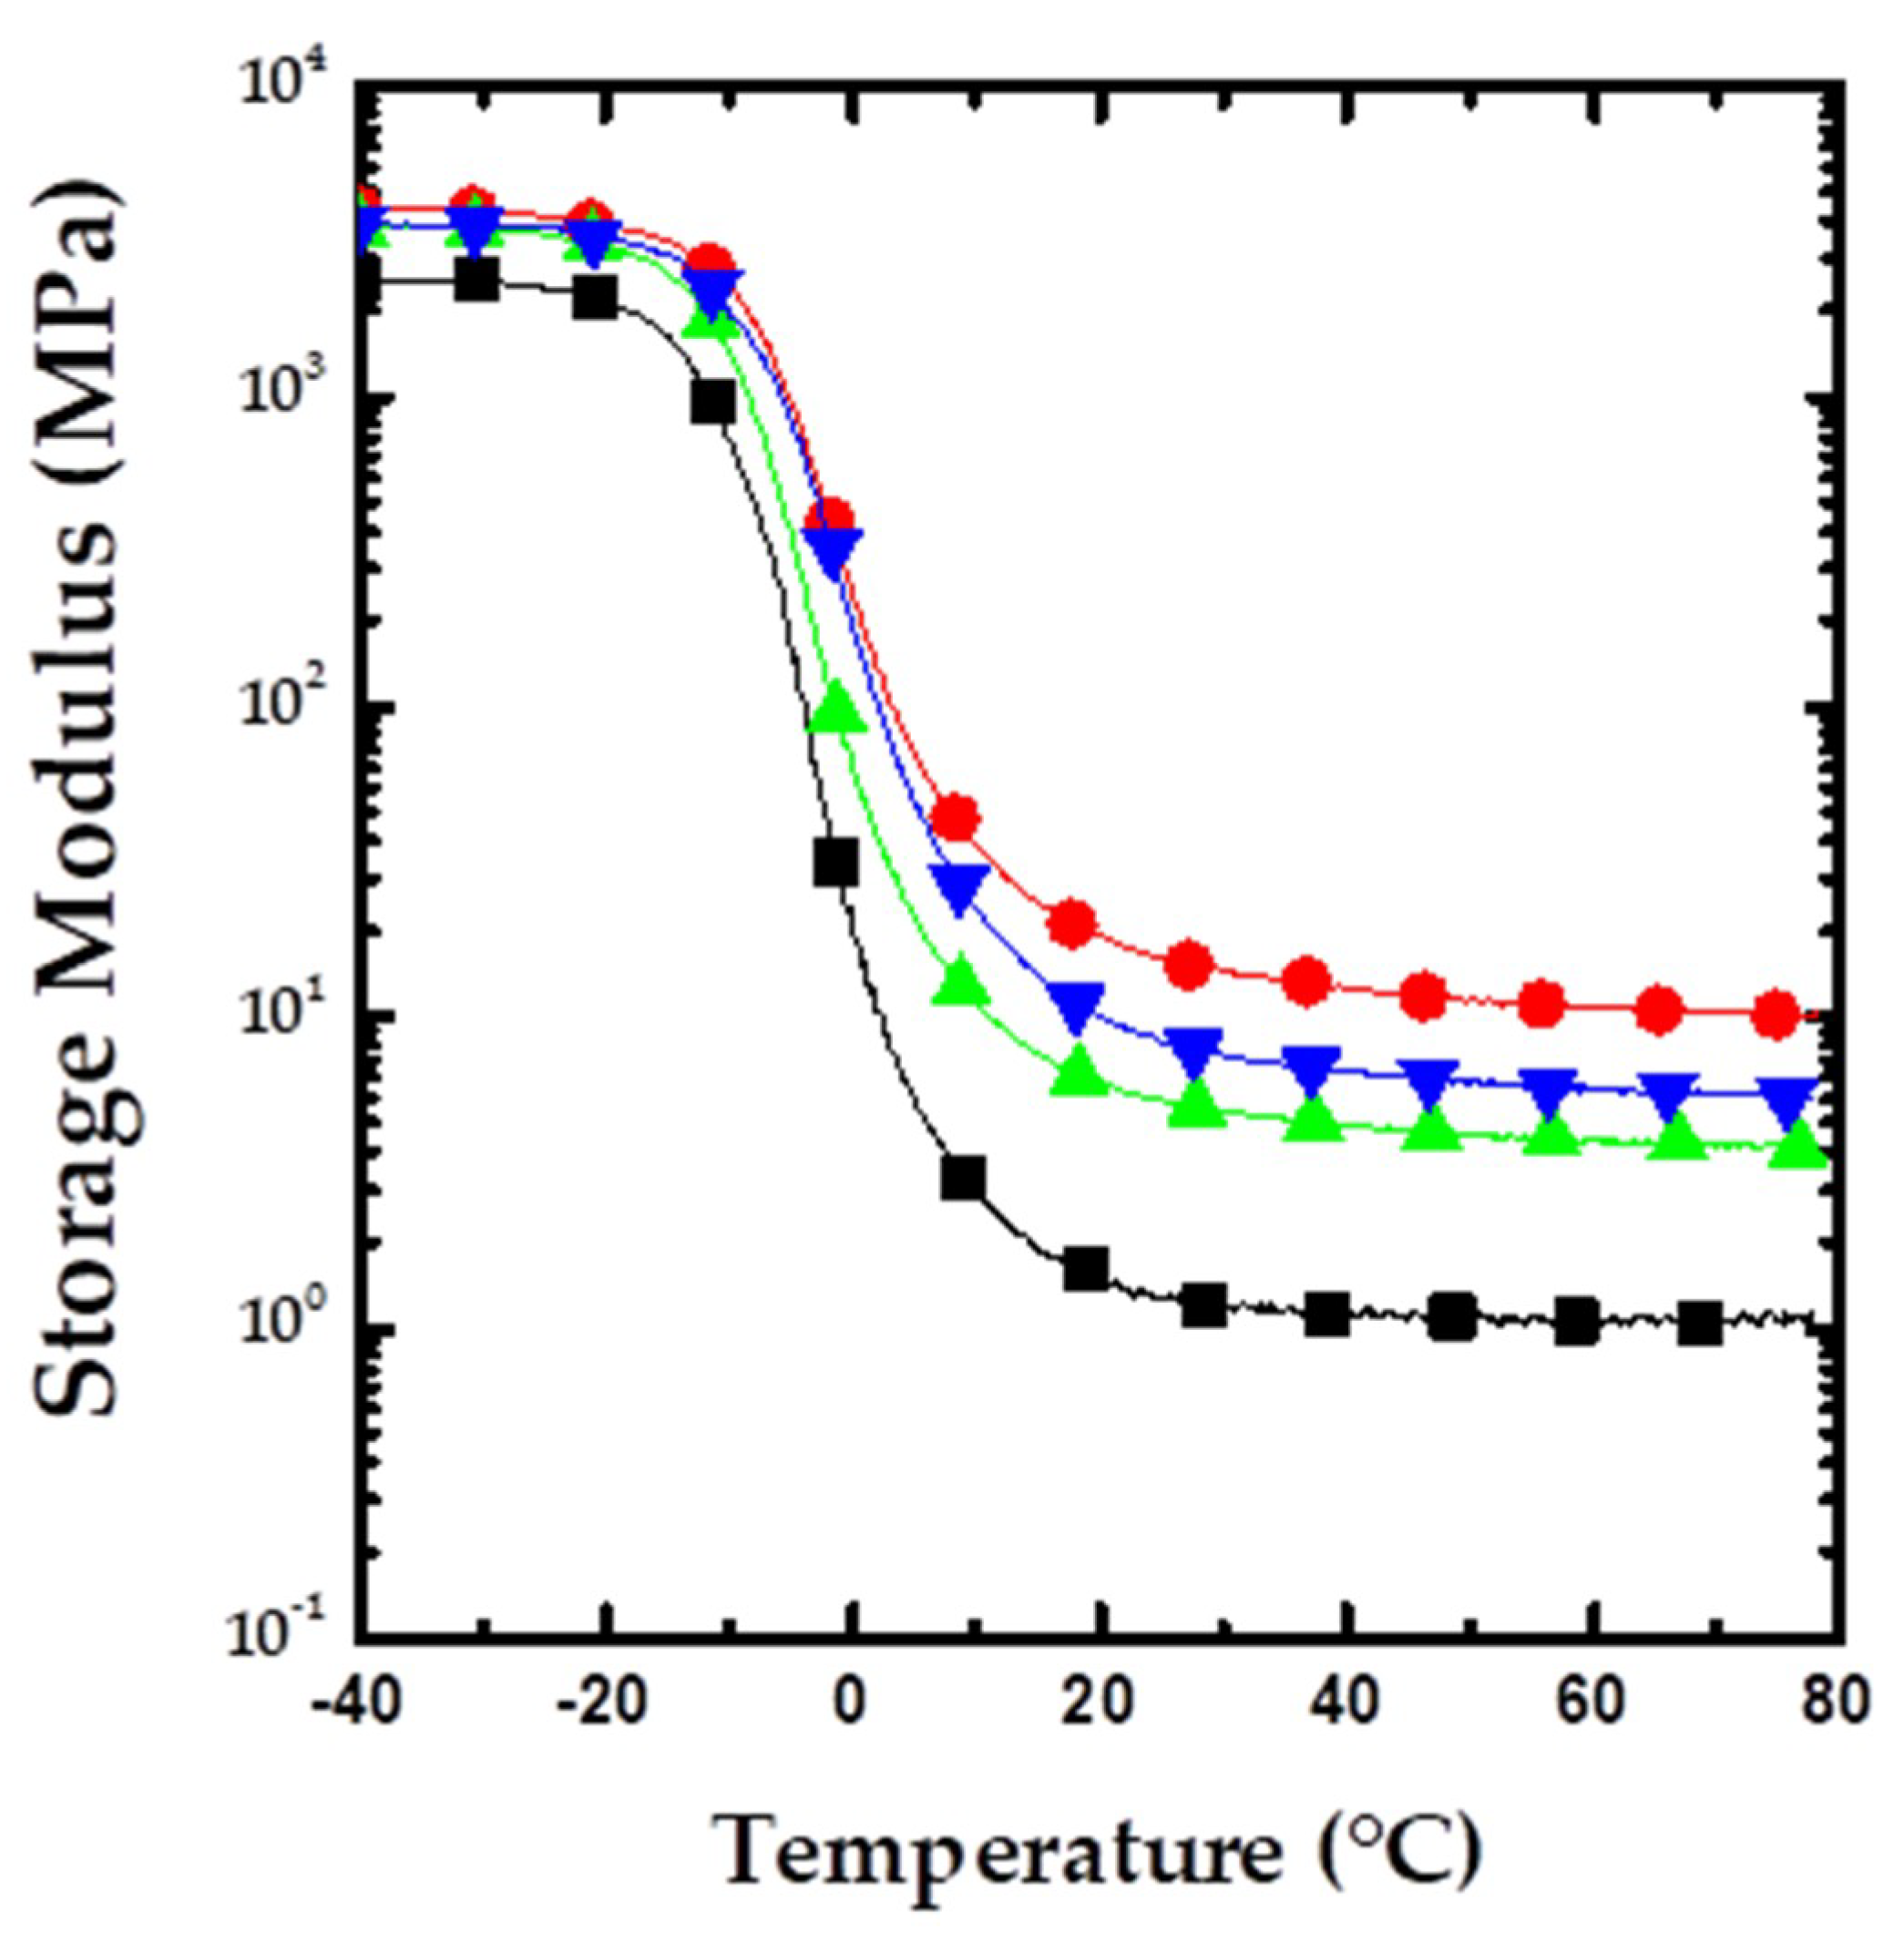
Figure 2 shows the E″ variation for the different composite systems. Generally, E″ is a measure of the dissipated energy as heat per cycle under deformation, i.e., the viscous response of the material. The peak of E″ is at Tg, the temperature at which the material undergoes the maximum change in polymer mobility [
25]. Above Tg, the E″ value decreases because of the free movement of the polymer chains. The Tg values of the Sep/SBR NPCs are reported in
Table 1. The Tg values for V-NS-SepS9/SBR and V-NS-SilSepS9/SBR are slightly lower than that of V-SepS9/SBR related to the reinforcement effect due to their lower AR.
E″ increases over the entire temperature range upon the introduction of SepS9 (● line in
Figure 2) in comparison with neat SBR (■ line in
Figure 2). This may be attributed to the inhibition of the relaxation process within the composites as a consequence of a higher number of chain segments upon fiber addition. For the samples, V-SepS9/SBR and V-NS-SilSepS9/SBR, a slight shift in Tg toward higher temperatures (
Table 1) can be observed, which can be attributed to the interaction of the SBR chains with the Sep filler [
26].
It is worth noting that V-NS-SepS9/SBR (▲ line in
Figure 2) and V-NS-SilSepS9/SBR (▼ line in
Figure 2) show a significantly lower value of E″ in the rubbery region with respect to V-SepS9/SBR. This indicates that the modification of the Sep fibers introduces remarkable interactions with the rubber matrix, reducing the dissipative process. In particular, in V-NS-SilSepS9/SBR, the presence of the grafted silane allows a stronger filler–rubber interaction. The E″ values at 30 and 70 °C are listed in
Table 1.
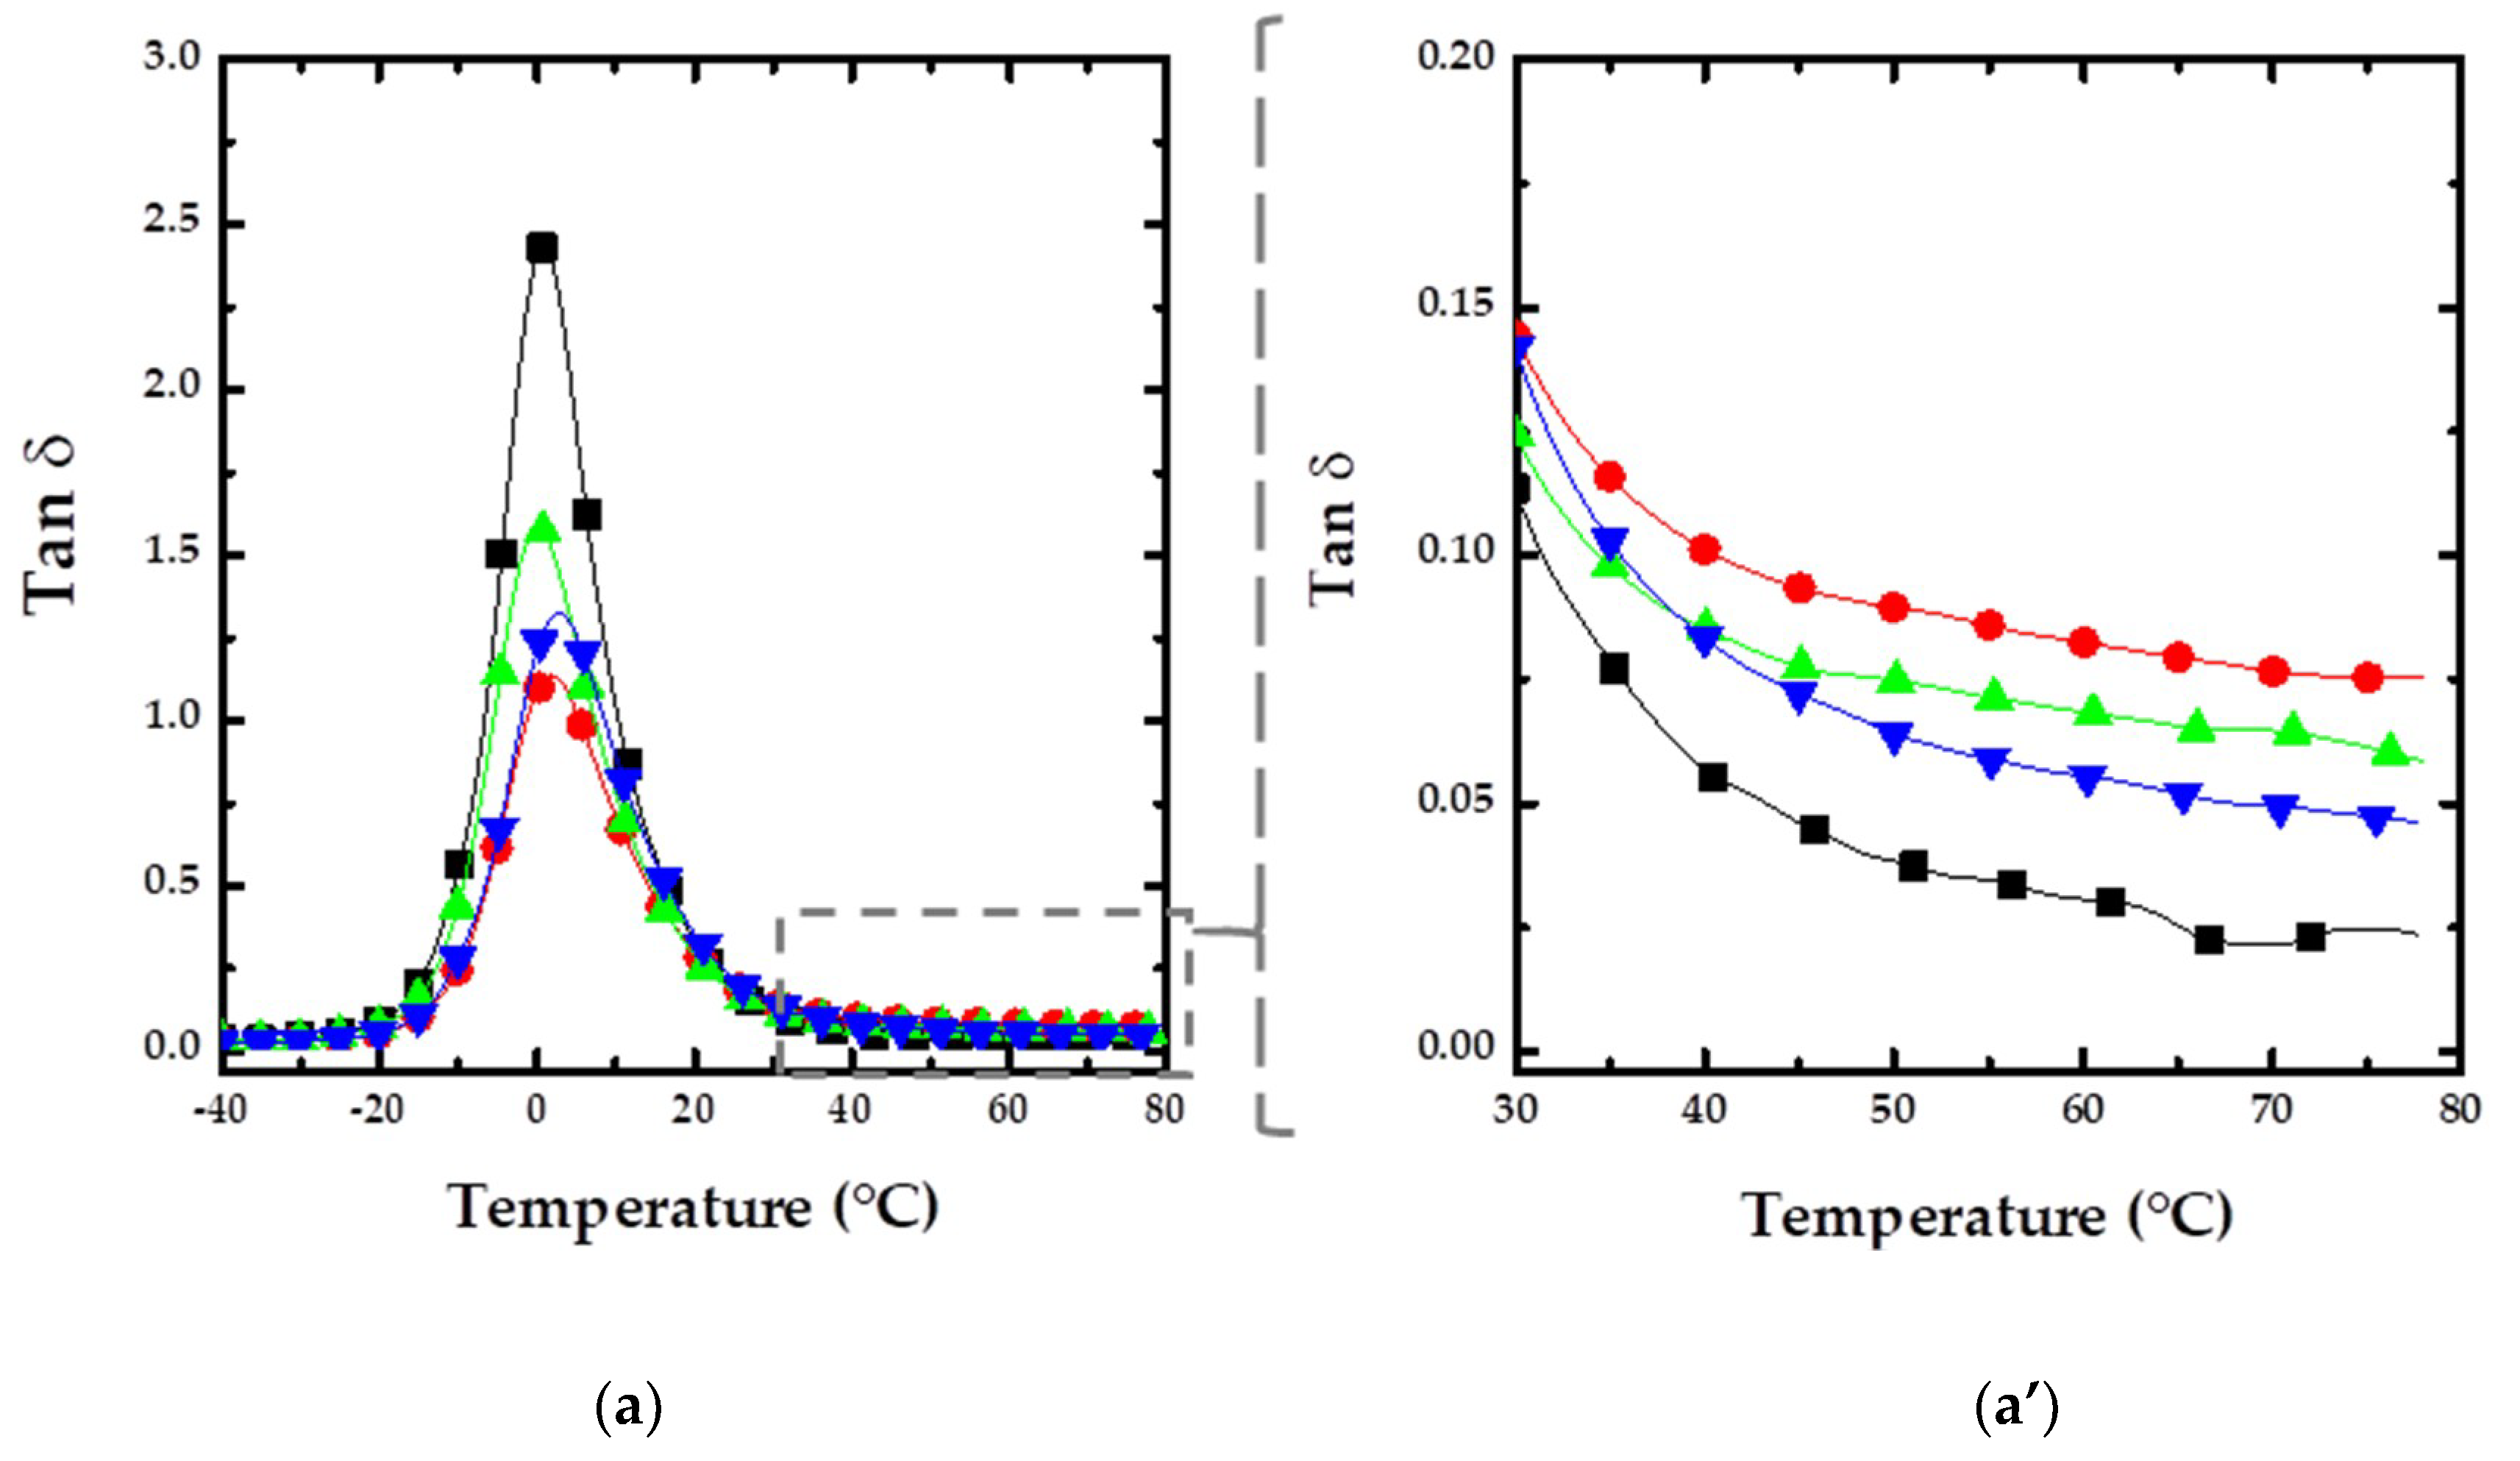
The effects of Sep fillers on damping, determined by Tan δ = E″/E′, are illustrated in
Figure 3. In the composites, damping is influenced by the incorporation, type, and distribution of fibers, as well as by the fiber–matrix interaction and the void content. It is well recognized that Tan δ values are a good indicator of rubber material hysteresis and can be associated to the rolling resistance [
27].
Interestingly, there is a significant effect of Sep fibers on the shape of the damping curve. In the presence of pristine (● line in
Figure 3a) and modified SepS9 (▲ and ▼ lines in
Figure 3a), the height of the damping maximum decreases while simultaneously the damping peak broadens.
The compounds with Sep show a strong decrease in the maximum value of Tan δ compared to pure SBR. This can be ascribed to the stronger reinforcing tendency effect of the filler and to a reduced mobility of the rubber chains close to the filler or in the confinement of the filler network, due to physical and chemical adsorption of SBR chain segments on the particle surface. This reduces the amount of free rubber and consequently the magnitude of the loss factor peak.
As an indication of skidding behavior (grip, traction) on dry roads, the level of the loss tangent in the range of 1–10 °C can be considered [
27]. The range between 25 °C and approximately 70 °C comprises the running temperatures of a tire. Under these temperature conditions, the loss factor essentially determines the degree of rolling resistance. In particular, the Tan δ value at 70 °C can be considered as a direct probe of the rolling resistance. In our case, Tan δ values at 70 °C (
Figure 3a’,
Table 1) for both the modified SepS9 samples, especially for V-NS-SilSepS9/SBR, are lower than that of pristine Sep, demonstrating a reduction of the rolling resistance. This means that on increasing the temperature, nano Sep filled materials display a larger portion of the filler network, which can be broken down and reformed during cyclic deformation with respect to unmodified SepS9/SBR.
The Payne effect, calculated as the difference between the modulus at low strain (G′
0) and the modulus at high strain (G′
∞), is in line with these observations. The Payne effect is widely accepted as a nonlinear trend of the modulus, as a consequence of the progressive destruction of the filler network under shear strain. Δ(G′
∞–G′
0) values are 0.152 for V-NS-SepS9/SBR and 0.077 MPa for V-NS-SilSepS9/SBR, significantly lower than that of the composite, V-SepS9/SBR (0.242 MPa), containing pristine SepS9 [
19]. This suggests a strong immobilization of the polymer chains close to the nanofibers’ surfaces and within their network.
3.2. SS NMR Study of Sep/SBR PNCs
In order to investigate how the dynamics of the polymer matrix are affected by the presence of the Sep fillers, a low-resolution SS NMR study, based on measurements of 1H spin-spin relaxation times (T
2), was carried out on both the unfilled SBR and Sep/SBR composites. A complete characterization of the dynamic properties was achieved by combining the SE and CPMG experiments [
28]. SE was used to refocus the signal from the dipolar-coupled protons in rigid domains characterized by very short T
2 (typically on the order of 10–20 μs), which would otherwise decay during the instrumental dead time. On the other hand, CPMG experiments were exploited to accurately measure the intrinsic T
2 relaxation times of the long-decaying liquid-like components of the
1H FID, which can be artificially shortened by non-dynamic contributions, such as the magnetic susceptibility of the sample and/or fluctuations and inhomogeneity of the external magnetic field.
The discrete analysis of a
1H FID recorded on resonance by SE allows domains with different degrees of mobility to be identified and quantified. The
1H FID is fitted to a linear combination of functions (fi), each characterized by a spin-spin relaxation time, T
2i, and a weight percentage,
wi. The value of T
2i, out of the so-called rigid lattice regime, monotonically increases with the increase of mobility, while
wi is related to the percentage of protons belonging to the
i-th domain [
26,
29,
30]. Since, in the presence of multiple
1H–
1H dipolar interactions, the efficiency of SE progressively decreases by increasing the echo delay (ED), quantitative values of
wi can be determined by performing SE experiments at different echo delays and extrapolating the intensity of each component fit to a zero delay. For all the samples, the experimental
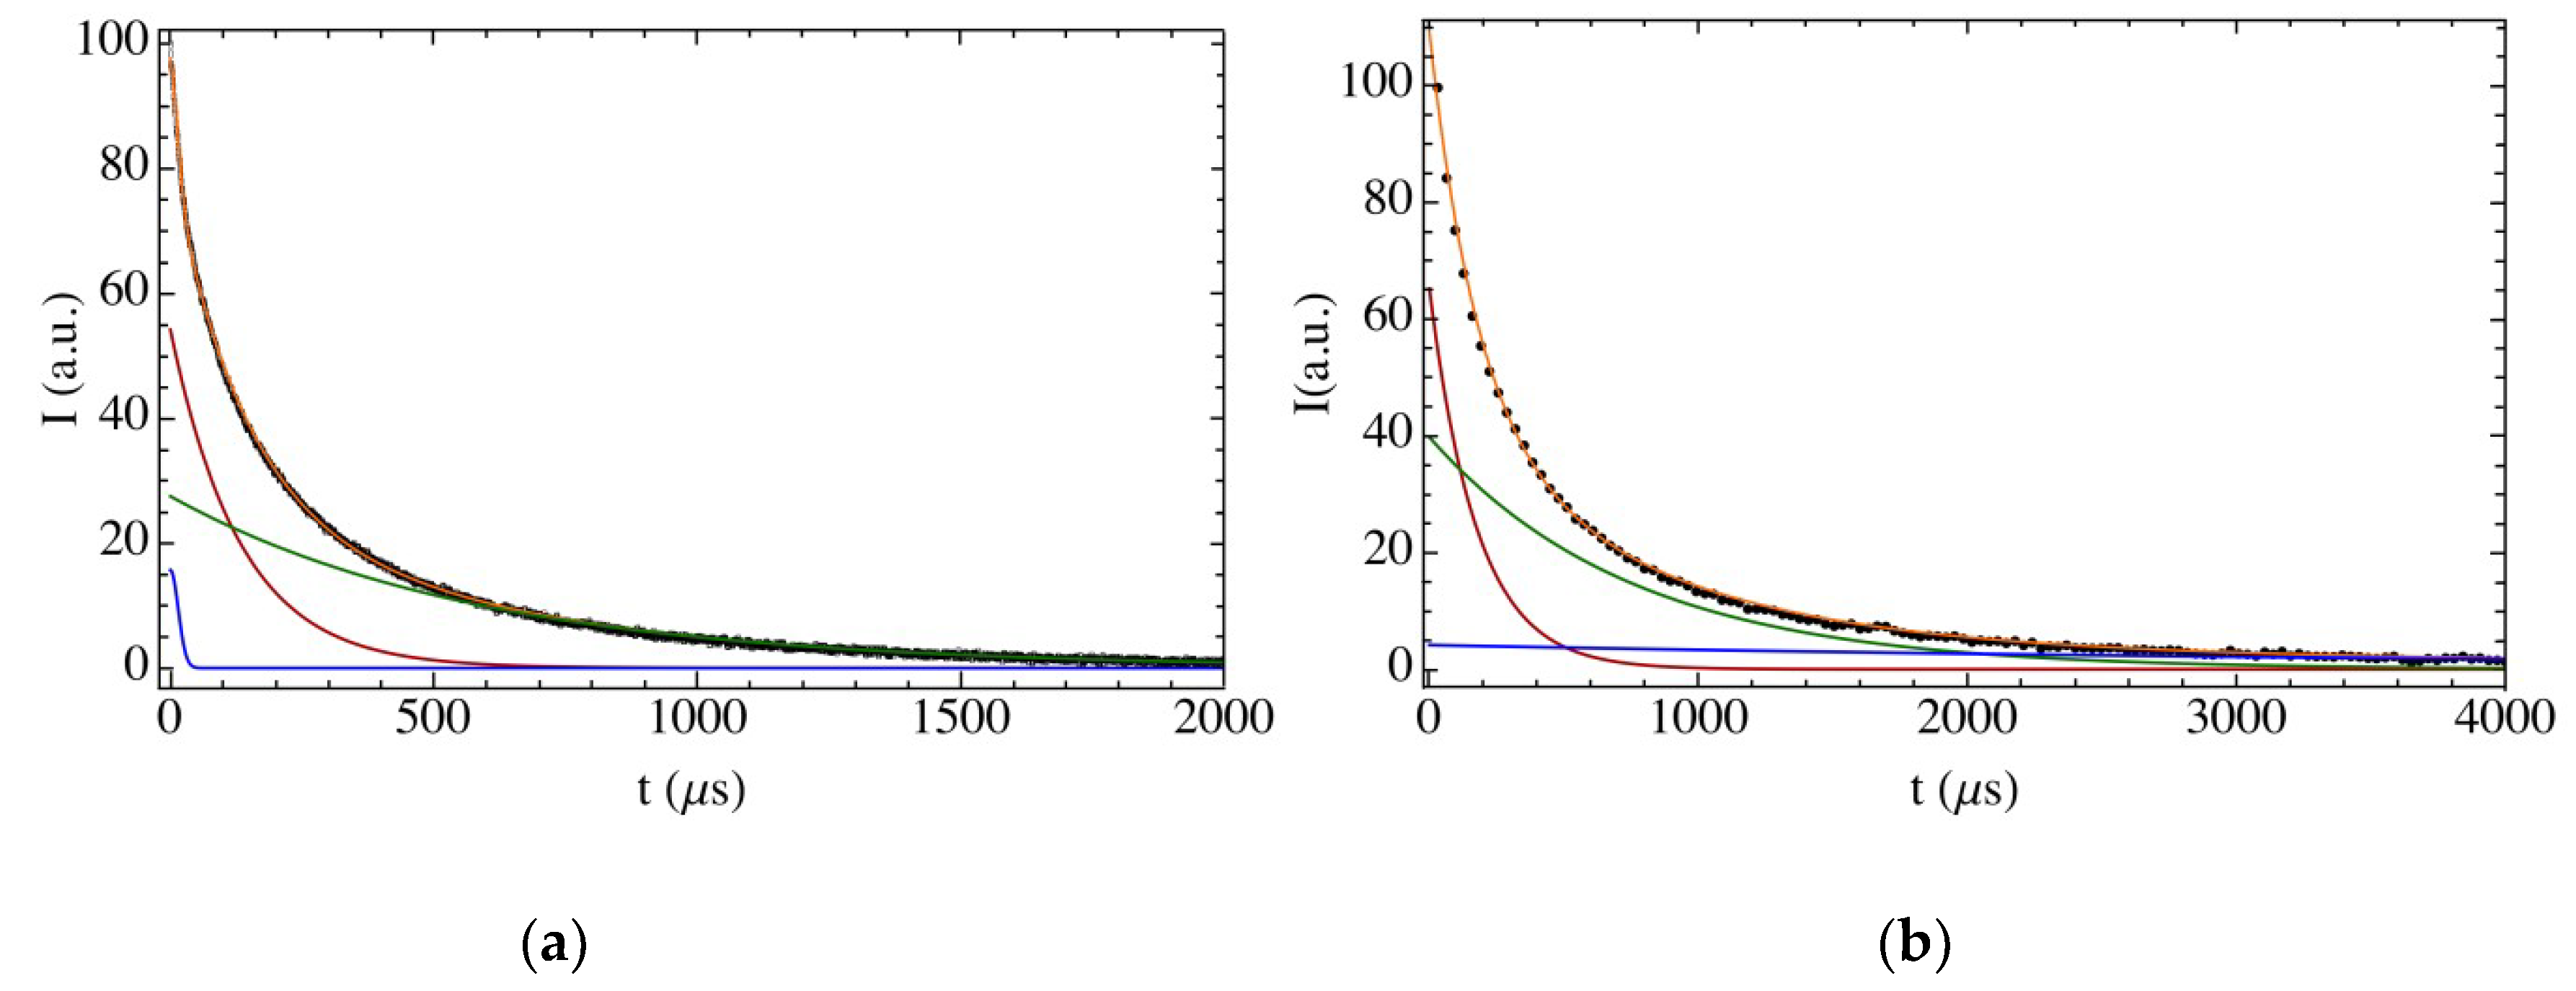
1H FID’s were well reproduced with a linear combination of two exponential and one Gaussian functions (as shown, as an example, in
Figure 4 for sample V-NS-SilSepS9/SBR. The Gaussian function (Gau) is characterized by a very short T
2 of ∼20 μs typical of protons located in rigid solid-like environments and could arise not only from rigid SBR domains, but also from protons located in Sep fibers. It is worth noticing that the rigid SBR domains can include bound immobilized rubber located at the Sep/SBR interface as well as entangled and crosslinked rubber chains [
31,
32].
On the other hand, the two exponential functions, representing from 84 to 95% of the
1H FID, are characterized by long liquid-like T
2 values in the ranges of 150–250 and 500–800 μs, and are ascribable to protons in very mobile environments and/or to isolated hydroxyl groups of the filler. A more accurate description of the T
2 relaxation behavior of these long-decaying components was obtained from the analysis of the CPMG relaxation curves. In all cases, the CPMG curves could be well fitted by a linear combination of three exponential functions, here indicated as exp1, exp2, and exp3, where T
2 increases in going from exp1 to exp3. In particular, T
2 values of ∼300, ∼1200, and ∼6500 μs and of 130–180, 580–760, and 3400–4500 μs were found for the uncured and vulcanized samples, respectively. An example of fitting is shown in
Figure 4. These three exponential components provide a more complete and reliable picture of the non-rigid environments present in the samples. In particular, exp1 and exp2 indicate the presence of a distribution of mobile environments with different mobility, mainly ascribable to the SBR matrix, while exp3 can be assigned to SBR free chain ends or dangling chains. The decrease of the T
2 values observed in passing from uncured to vulcanized samples agrees with a decrease of mobility of the rubber chains due to the formation of cross-links induced by vulcanization. In
Table S1 of the Supplementary Materials (SM), the weights,
wi, and T
2i values of the different protons fractions are reported. In particular, the reported values of
wi were obtained by combining the results from the SE and CPMG experiments, assuming that the shortest- and longest-T
2 exponential components of the
1H FID’s corresponded, respectively, to exp1 and to the sum of exp2 and exp3. The increase of the weight percentage of exp1 with respect to exp2 in passing from the uncured to the vulcanized samples further confirms the reduced mobility of SBR chains after vulcanization. For the uncured samples, neither the T
2 values nor the weights of the three exponential components significantly vary in passing from pure SBR to the Sep/SBR (
Figure 4), which are not directly involved in the interaction at the SBR/filler interface. On the other hand, in the case of the vulcanized samples, the T
2 values are found to be slightly longer for the composites, V-SepS9/SBR and V-NS-SepS9/SBR, than for the unfilled SBR sample, V-SBR-REF-0, meaning that in the presence of filler, the SBR chains experience a higher degree of mobility. This result can be explained by the lower cross-link density of the rubber matrix possibly due to the inactivation of parts of the vulcanization system by adsorption onto the high-surface Sep filler. For V-NS-SilSepS9/SBR, shorter T
2 values, more similar to the unfilled vulcanized sample, were found, possibly due to the formation of stronger SBR–filler interactions promoted by the surface silanization of Sep.
As already stated, for the SBR/Sep composites, the weight of the Gaussian component (
w values in
Table S1) accounts for all protons in rigid environments (f
HrigidTOT), from both rubber domains with restricted mobility and the filler. In order to investigate the influence of the different Sep fibers in the formation of a surface-immobilized rubber layer at the Sep/SBR interface, it was therefore necessary to separate these two contributions by determining the fraction of rigid protons belonging to the filler (f
HrigidSep). To this aim the following strategy was used, similar to what done by some other authors [
7,
28]: (a) a calibration curve was built using weighted standard samples with known hydrogen contents, where the total
1H FID intensity to sample weight ratio was plotted against the hydrogen weight percentage (% wt/wt) (
Table S2 and Figure S1 in the SM); (b) the total hydrogen content (% wt/wt) in each type of filler was determined by interpolating the calibration curve, after measuring the total
1H FID intensity of weighted pure Sep samples (
Table S3 in the SM); (c) the
1H FID’s recorded for the pure Sep fillers were then analyzed in order to evaluate the fraction of protons in rigid environments (
Table S2); (d) knowing the amount of filler in the composite samples, the fraction of protons from rigid rubber (f
HrigidSBR) was calculated as (f
HrigidTOT − f
HrigidSep).
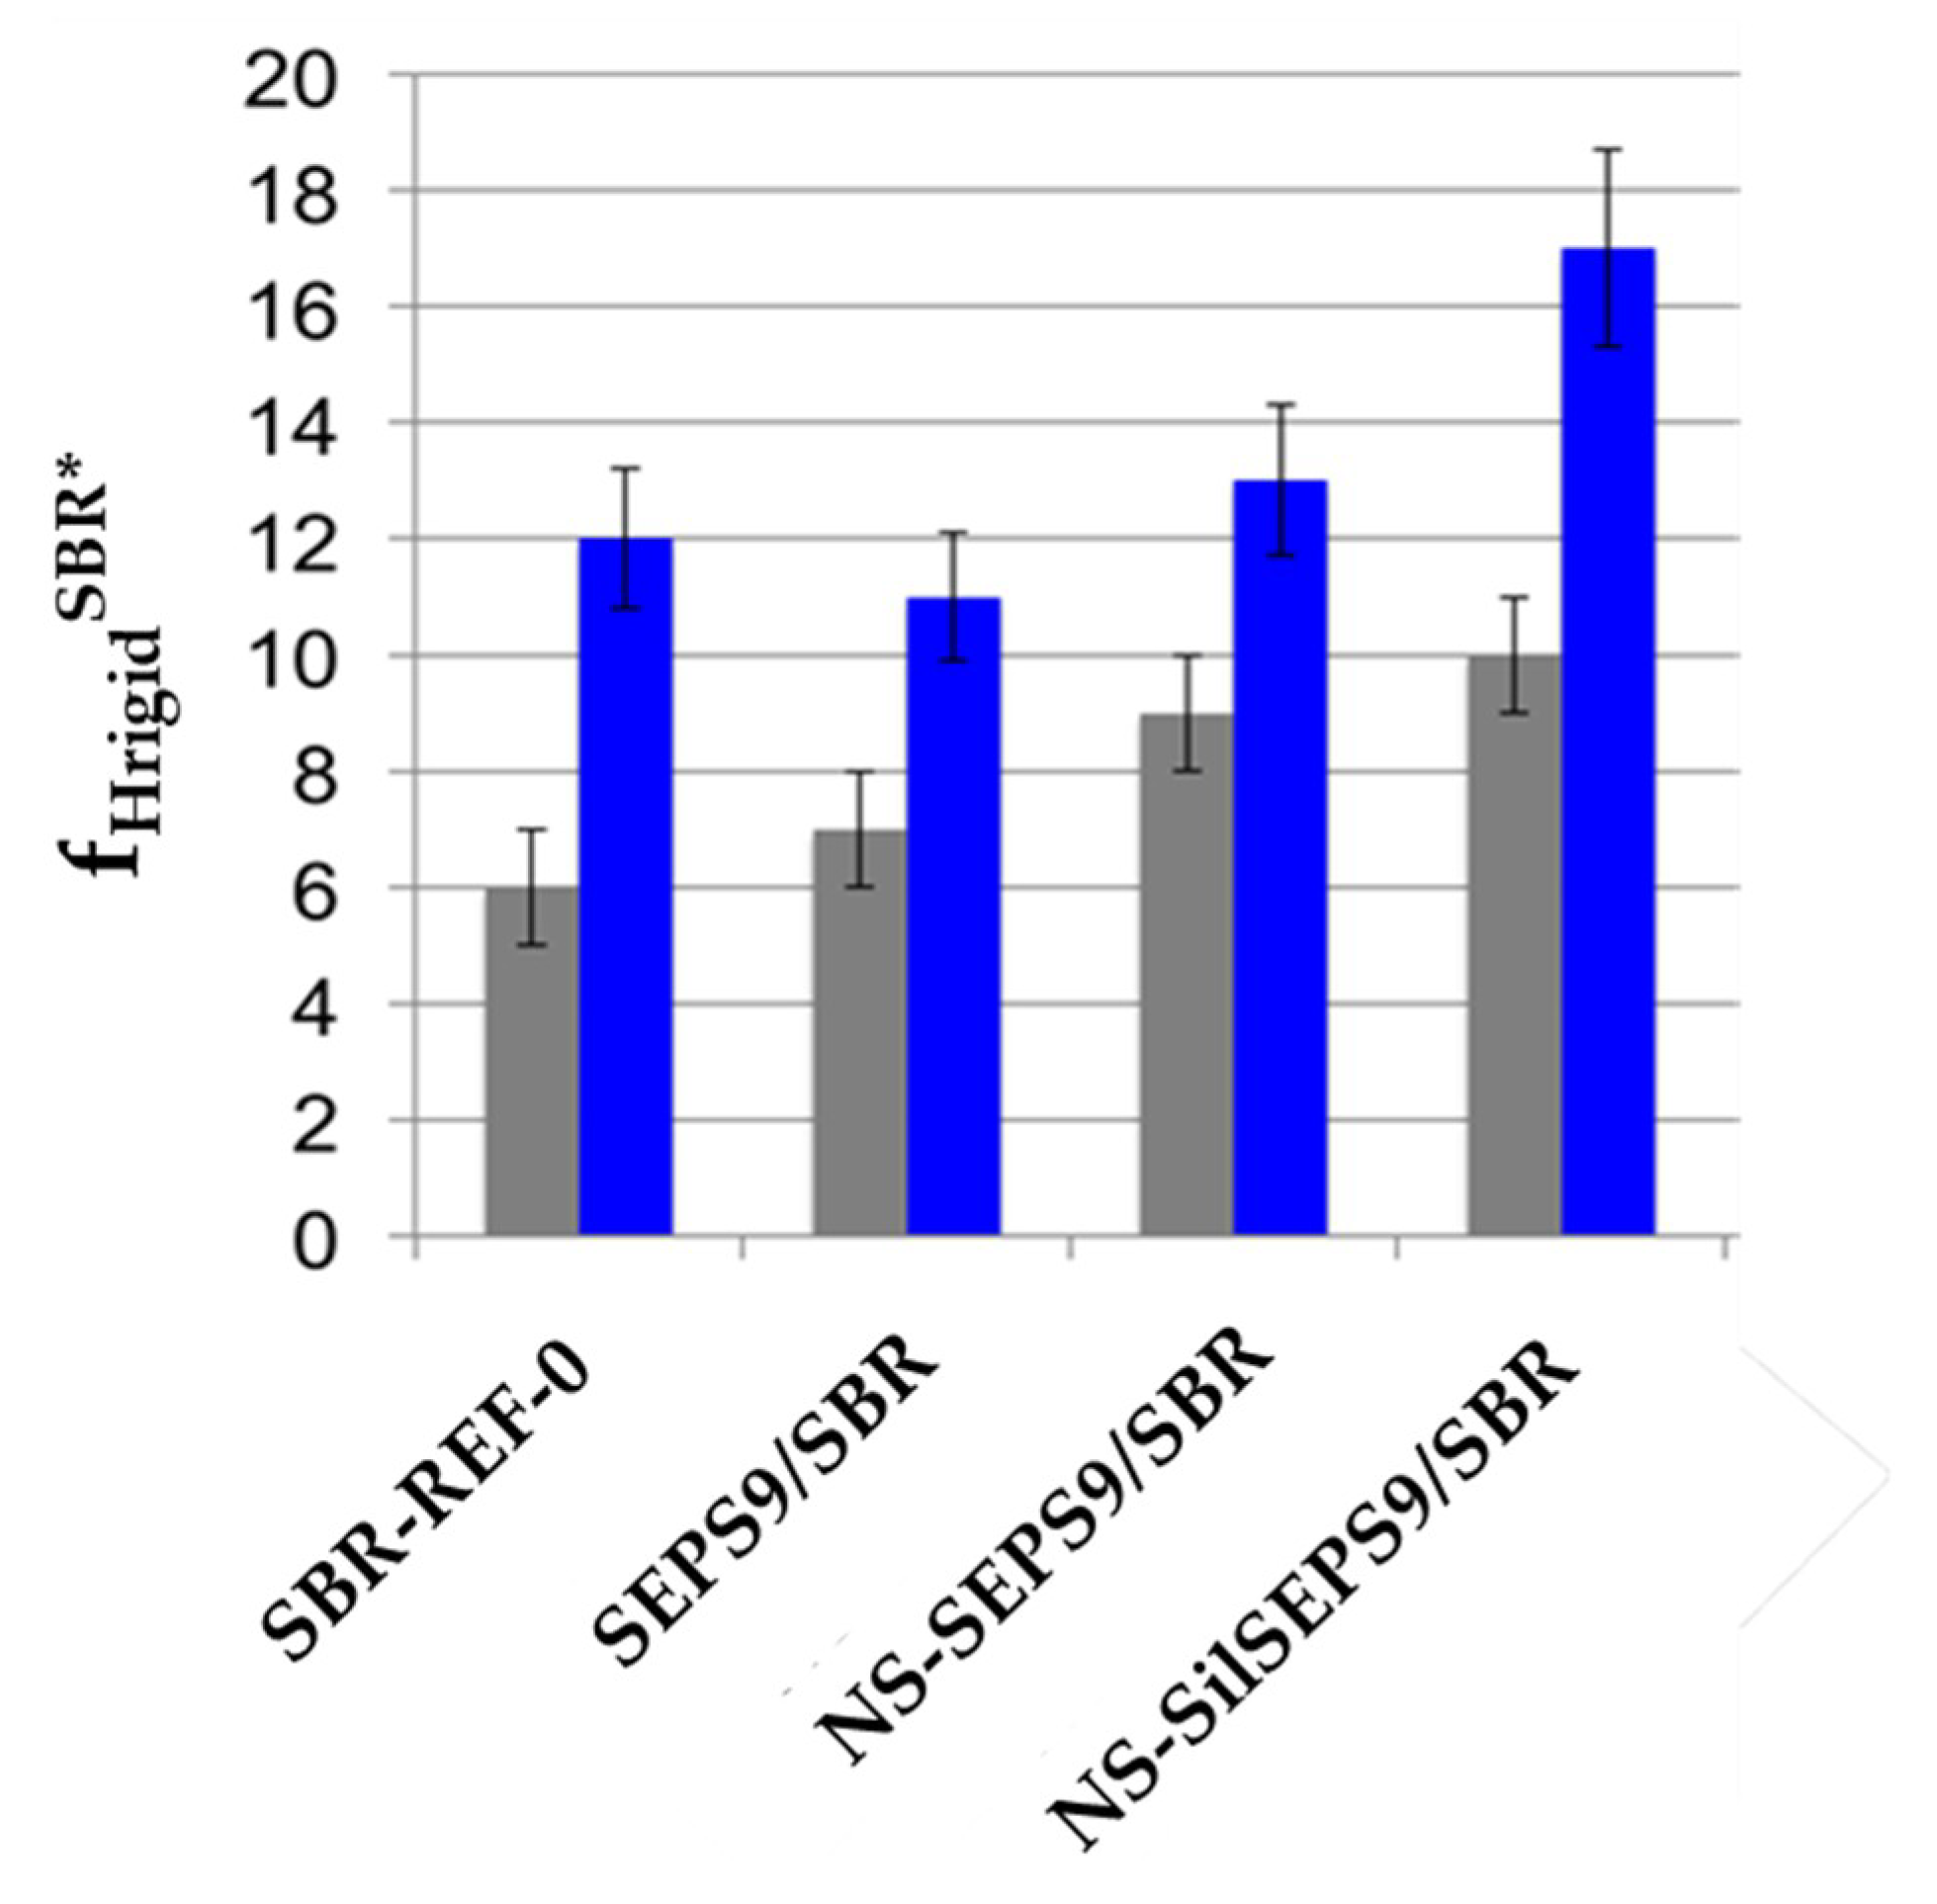
The final results are reported in
Table 2 and
Figure 5. First, it can be noticed that the percentage of rigid SBR is significantly larger in vulcanized (11–17%) than in uncured samples (6–10%). This result was expected and could be explained by the higher amount of "immobilized" rubber chains after vulcanization. For the uncured samples, the presence of Sep fillers determined a slight increase of the amount of rigid rubber, in the order NS-SilSepS9/SBR > NS-SepS9/SBR > SepS9/SBR. Assuming that a possible contribution from the entangled rubber chains does not significantly change among the samples, this increase can be ascribed to the formation of immobilized rubber at the interface with the filler, which is enhanced when the modified NS-SepS9 and, especially, NS-SilSepS9 are used.
With respect to the vulcanized samples, the NMR results indicate that surface-immobilized rubber layer forms, in particular in the presence of NS-SilSepS9 (
Figure 5). Although the surface-immobilized rubber layer is only a small fraction, about 4% of the entire polymer matrix, it can affect the entire bulk and have a tremendous influence on the mechanical properties of the PNC material, since the immobilized rubber layer significantly alters the percolation and the morphology of the composites [
32]. For example, the formation of strong interfacial interactions could be related to the strain independence of the storage modulus (
Figure 1) and to the improvement of the hysteretic behavior observed for the PNCs with the modified Sep fillers (see
Section 3.1).
Until now, it has been reported that clay particles, even if exfoliated and well dispersed, are not able to significantly interact with the rubber matrix. In fact, the mechanical properties in rubber-clay NCs, achieved without chemical bonds between the polymer and filler, have been mainly attributed to the geometric effect of stiff and well-dispersed filler particles.
In order to calculate fHSep, the presence of TDAE oil had to be taken into account, assuming an average hydrogen content of 10% (H%, wt/wt) of this oil. It was verified that by varying H% in the range of 9–11%, the calculated values of the different proton fractions remain within the experimental error. TDAE was added in the same amount to all the samples, and its contribution did not substantially affect the differences in terms of the amount of rigid rubber observed among the samples.
Therefore, the reinforcement mainly benefits from the increased modulus of the percolated mechanical network as compared to the soft matrix. On the contrary, the modification of the Sep fibers introduces a better interaction with the matrix, in particular for the NS-SilSepS9 sample and the formation of immobilized rubber, as demonstrated by NMR, thus reducing the dissipative process in the rubber NCs, as evidenced by the DMTA analysis (see
Section 3.1).
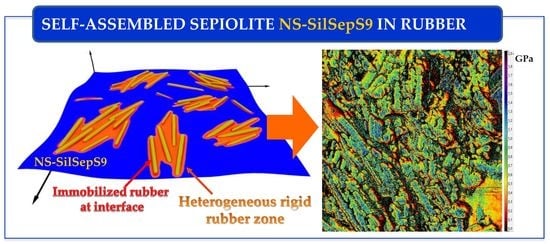
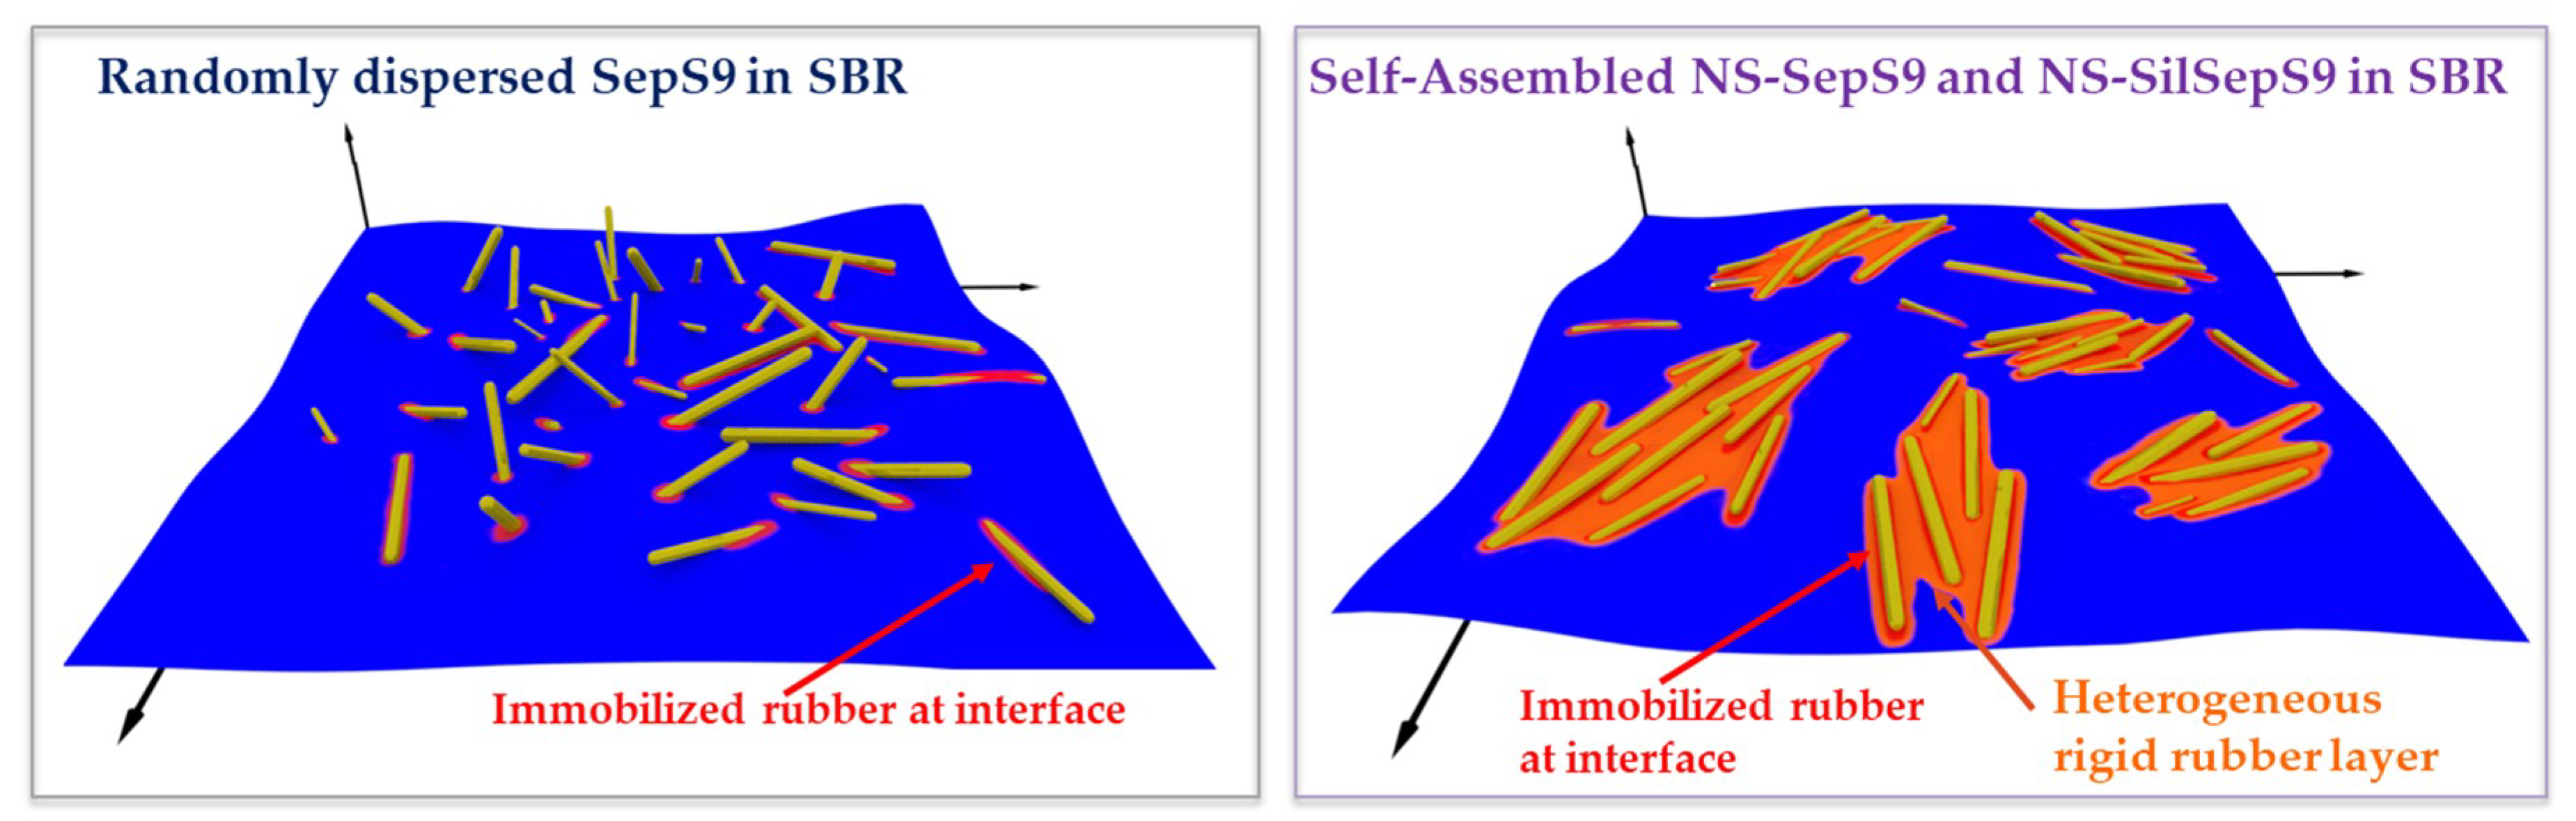
In addition, the self-assembly of nanosized Sep particles allows the organization of anisotropic fibers in filler superstructures where rubber chains are immobilized in the inter-particle region (see TEM and AFM analysis).
3.3. TEM and AFM Morphological and Nanomechanical Property Analysis of Sep/SBR PNCs
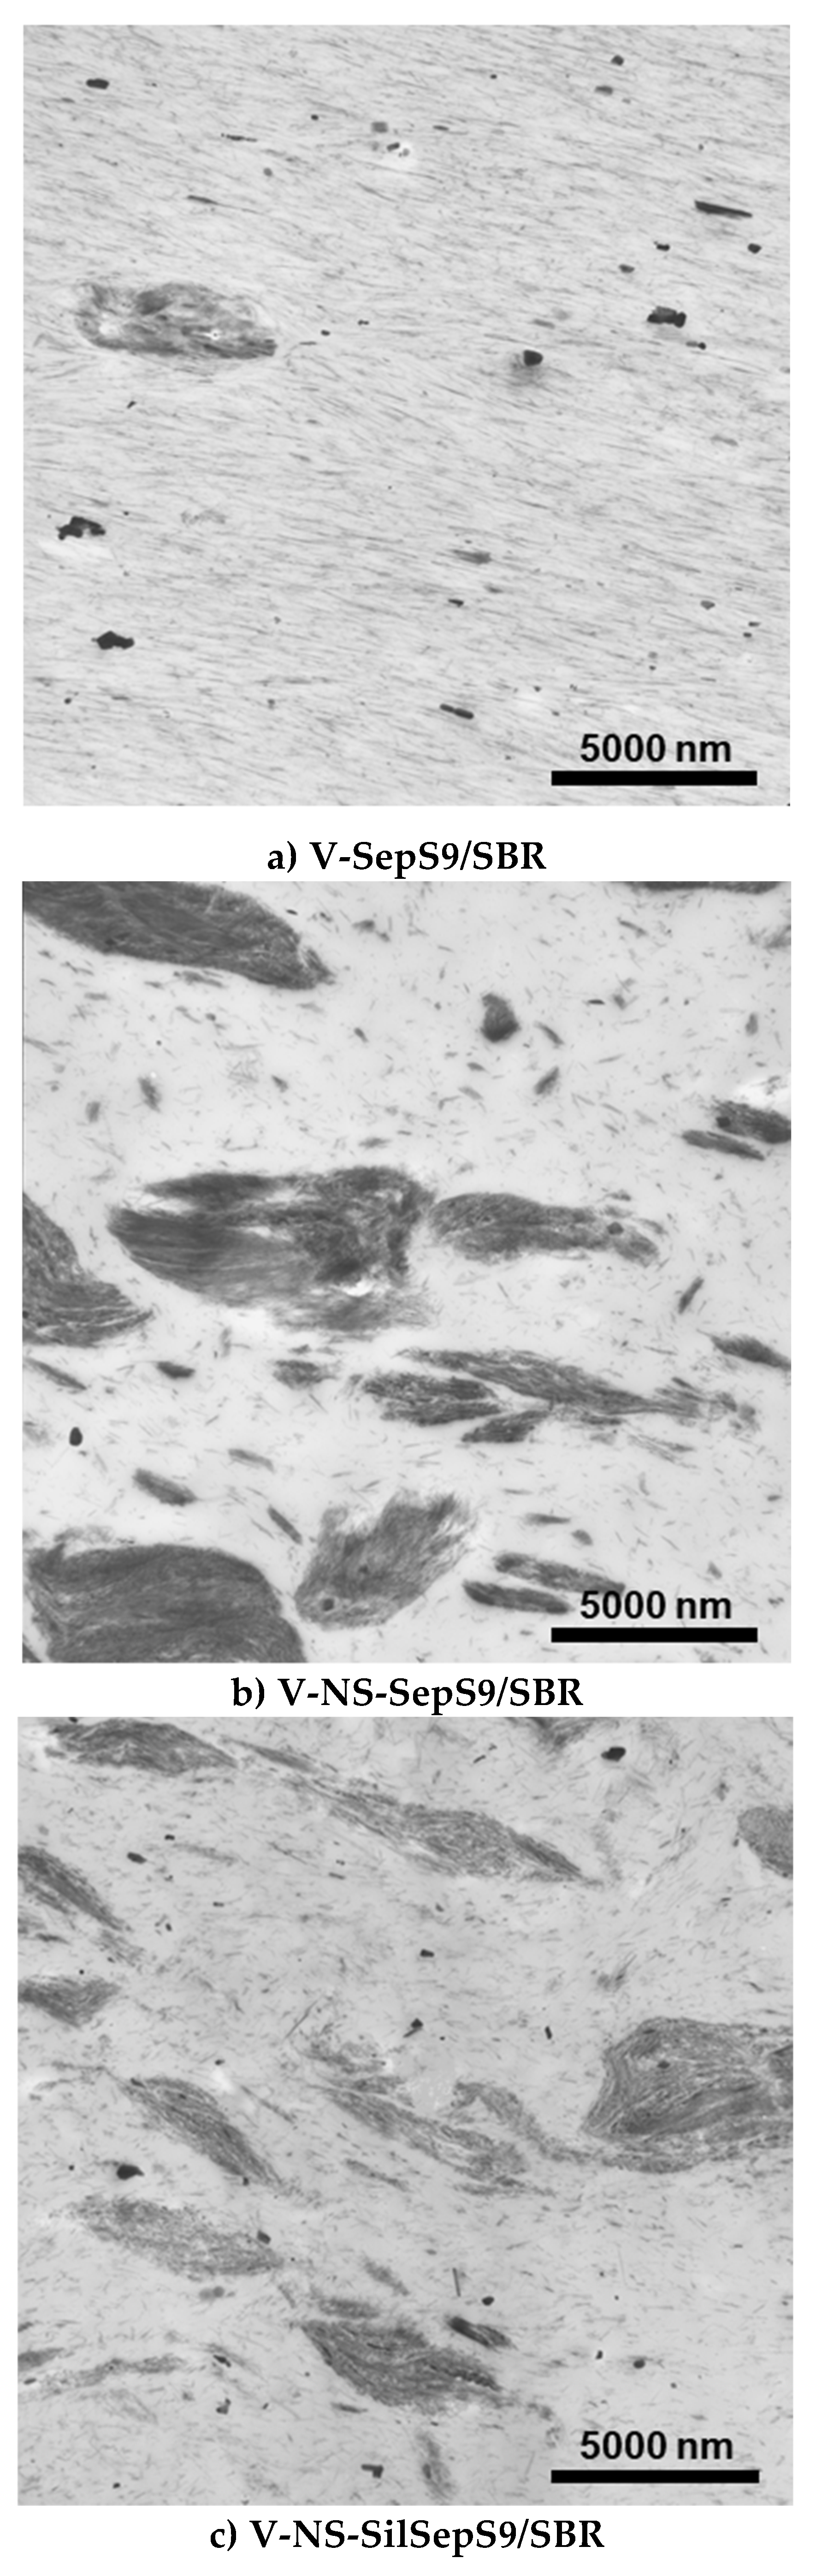
Although reported in a previous paper [
19], some novel TEM images of V-NS-SepS9/SBR and V-NS-SilSepS9/SBR samples are reported, in order to more easily discuss the effects of the particle size and self-assembly on the rubber matrix (
Figure 6). V-SepS9/SBR shows a uniform distribution and a continuous network of Sep particles (a in
Figure 6). In V-NS-SepS9/SBR and V-NS-SilSepS9/SBR, after acid treatment, the AR of the particles decreases and a preferential alignment occurs along their main axis (b and c in
Figure 6). This leads to the formation of domains of few aligned nanofibers whose orientation in the rubber matrix is different. Besides, TEM analysis of the composites shows that only the modified Sep fibers succeed in disrupting the tactoid interactions and favor the formation of a filler network.
The filler self-assembly in these nanostructures provides larger amounts of overlapping rubber layers at the filler–rubber interface, as confirmed by the improvement of the mechanical properties.
Further evidence on the filler–rubber interactions occurring in the presence of surface modified Sep fibers were gained by investigating the PNCs morphology and the rubber/Sep fiber interface by AFM on fresh surfaces after freeze-fracturing the materials.
In the context of these experiments, it should be taken into consideration that the preparation of these freeze fractured specimens could cause the cutting of fibers, lowering the probability that fiber particles completely lie on the fractured surface.
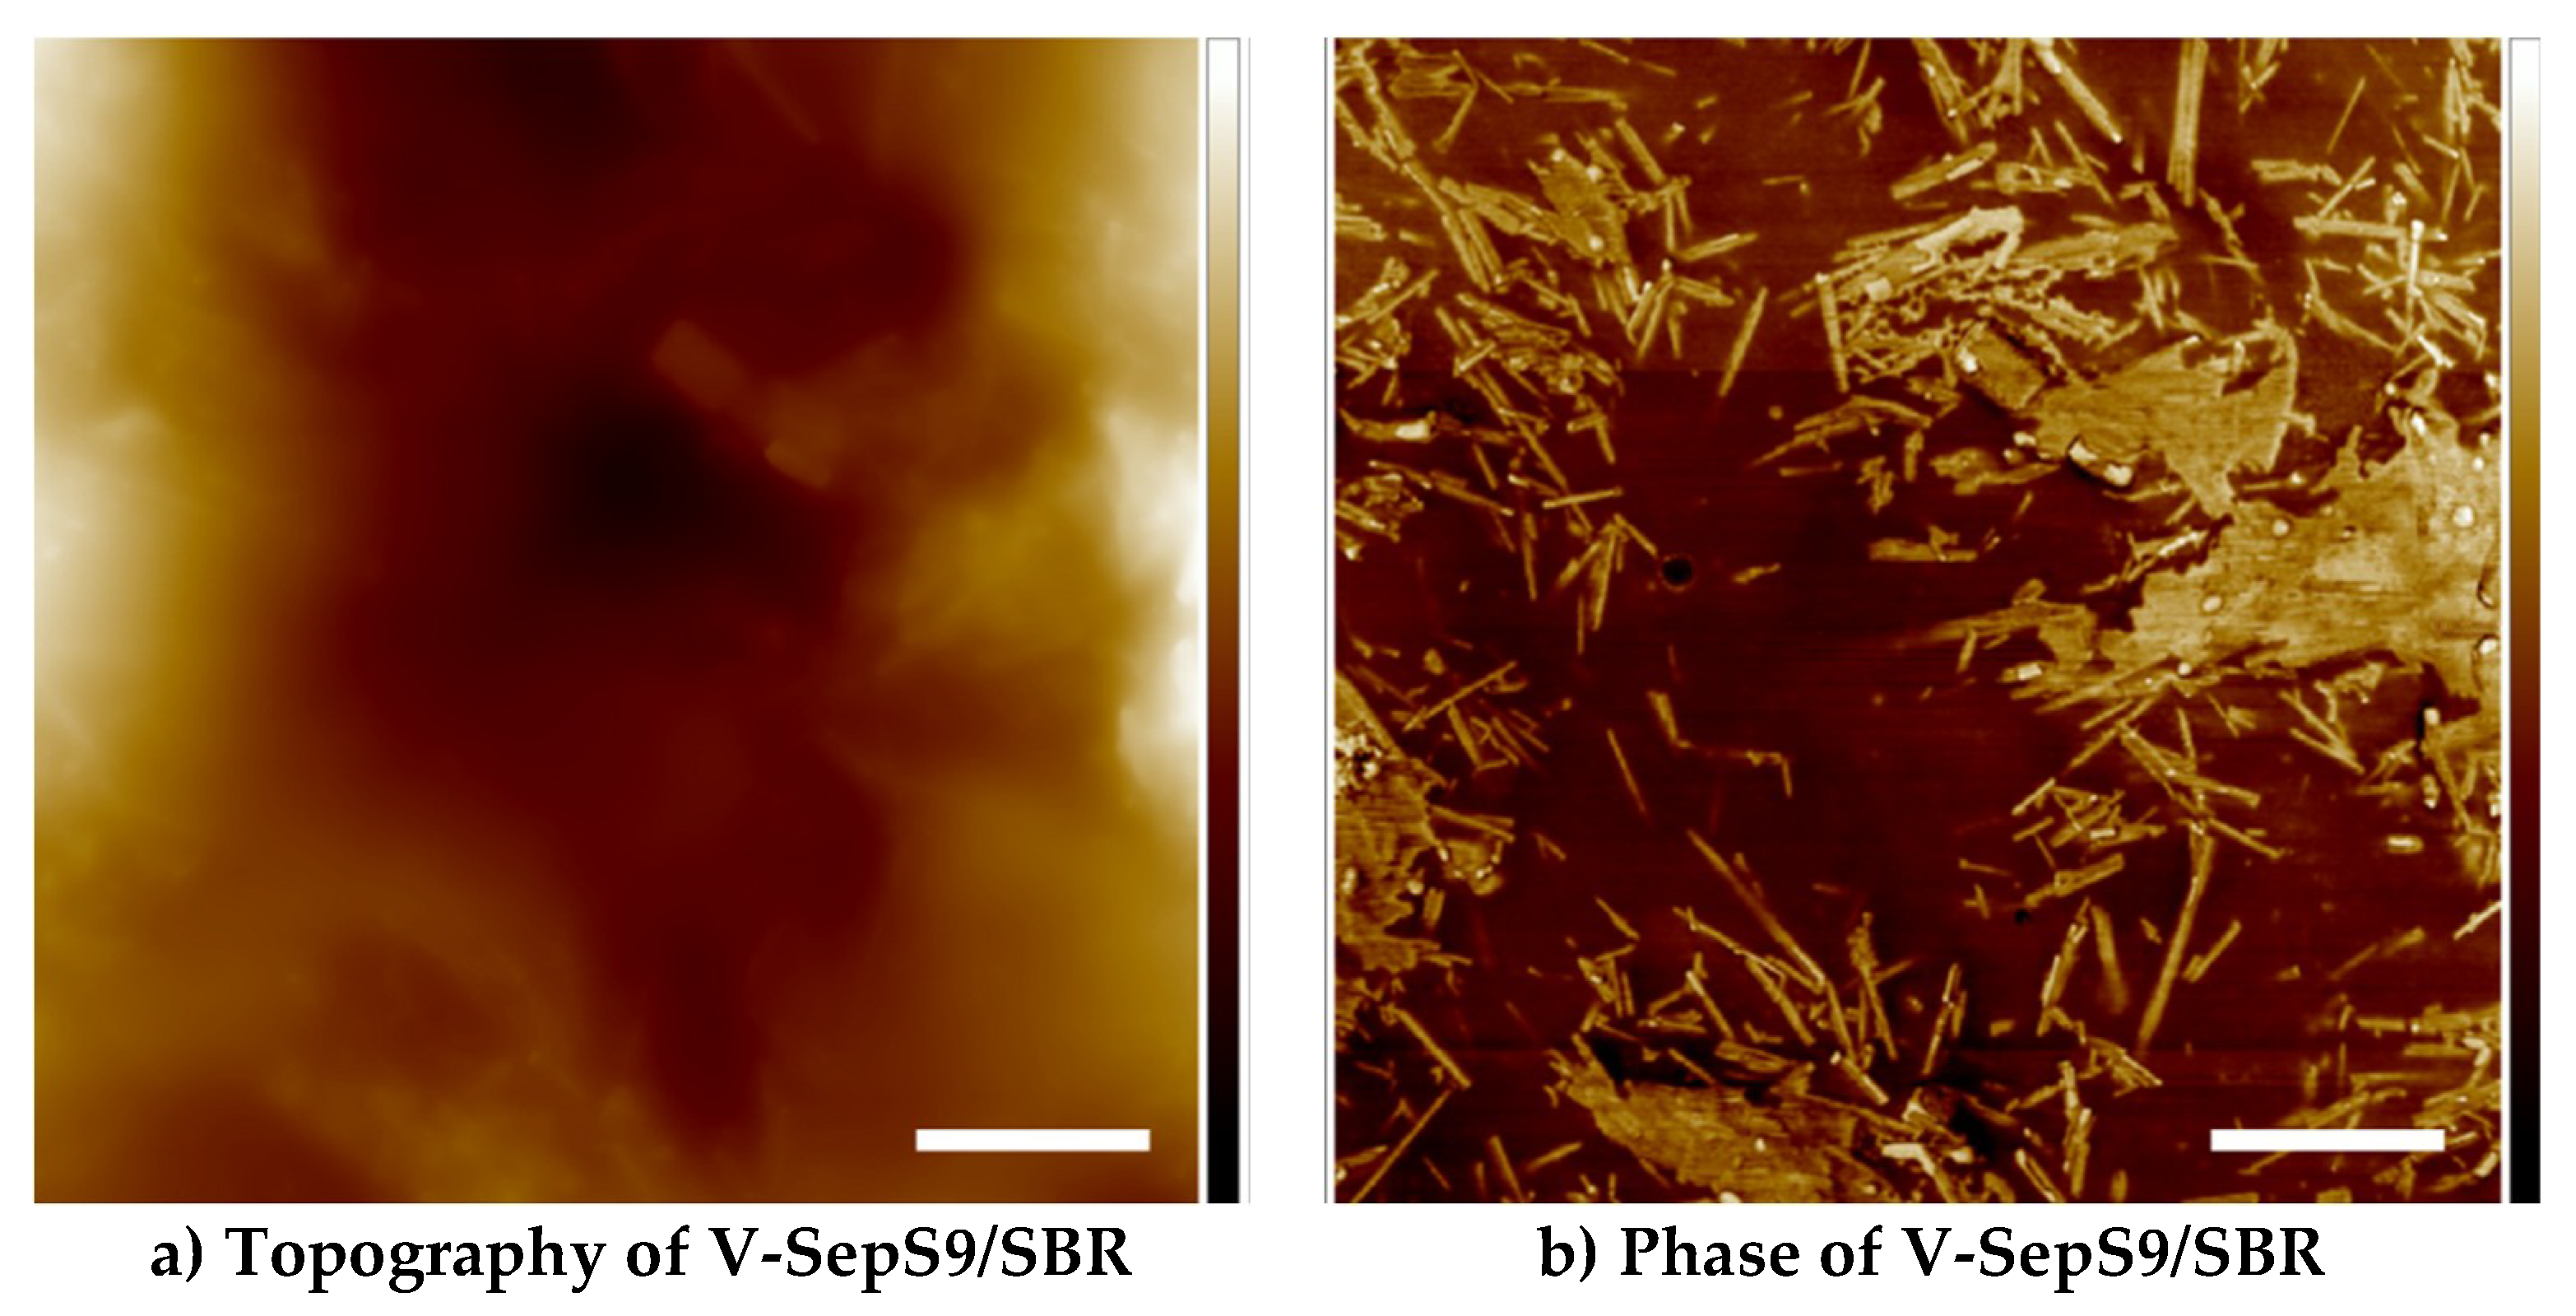
The TM-AFM analysis was performed either with height images (a in
Figure 7) or in phase contrast (b in
Figure 7), which often reveals the domain morphology of thermoplastic [
20] and other polymer materials. Phase images show a sharper contrast at the edges of the heterogeneous zones of the materials and give better evidence of the interface regions.
Figure 7 shows the AFM images of the V-SepS9/SBR composite. It is evident that a remarkable contrast exists at the edges of the heterogeneous regions of the composite, corresponding to SepS9 fibers and the softer SBR matrix. The SepS9 fibers are randomly oriented, without significant interaction with the rubber matrix. The lateral and longitudinal dimensions of the Sep rods are comparable with those obtained from the TEM images in
Figure 6.
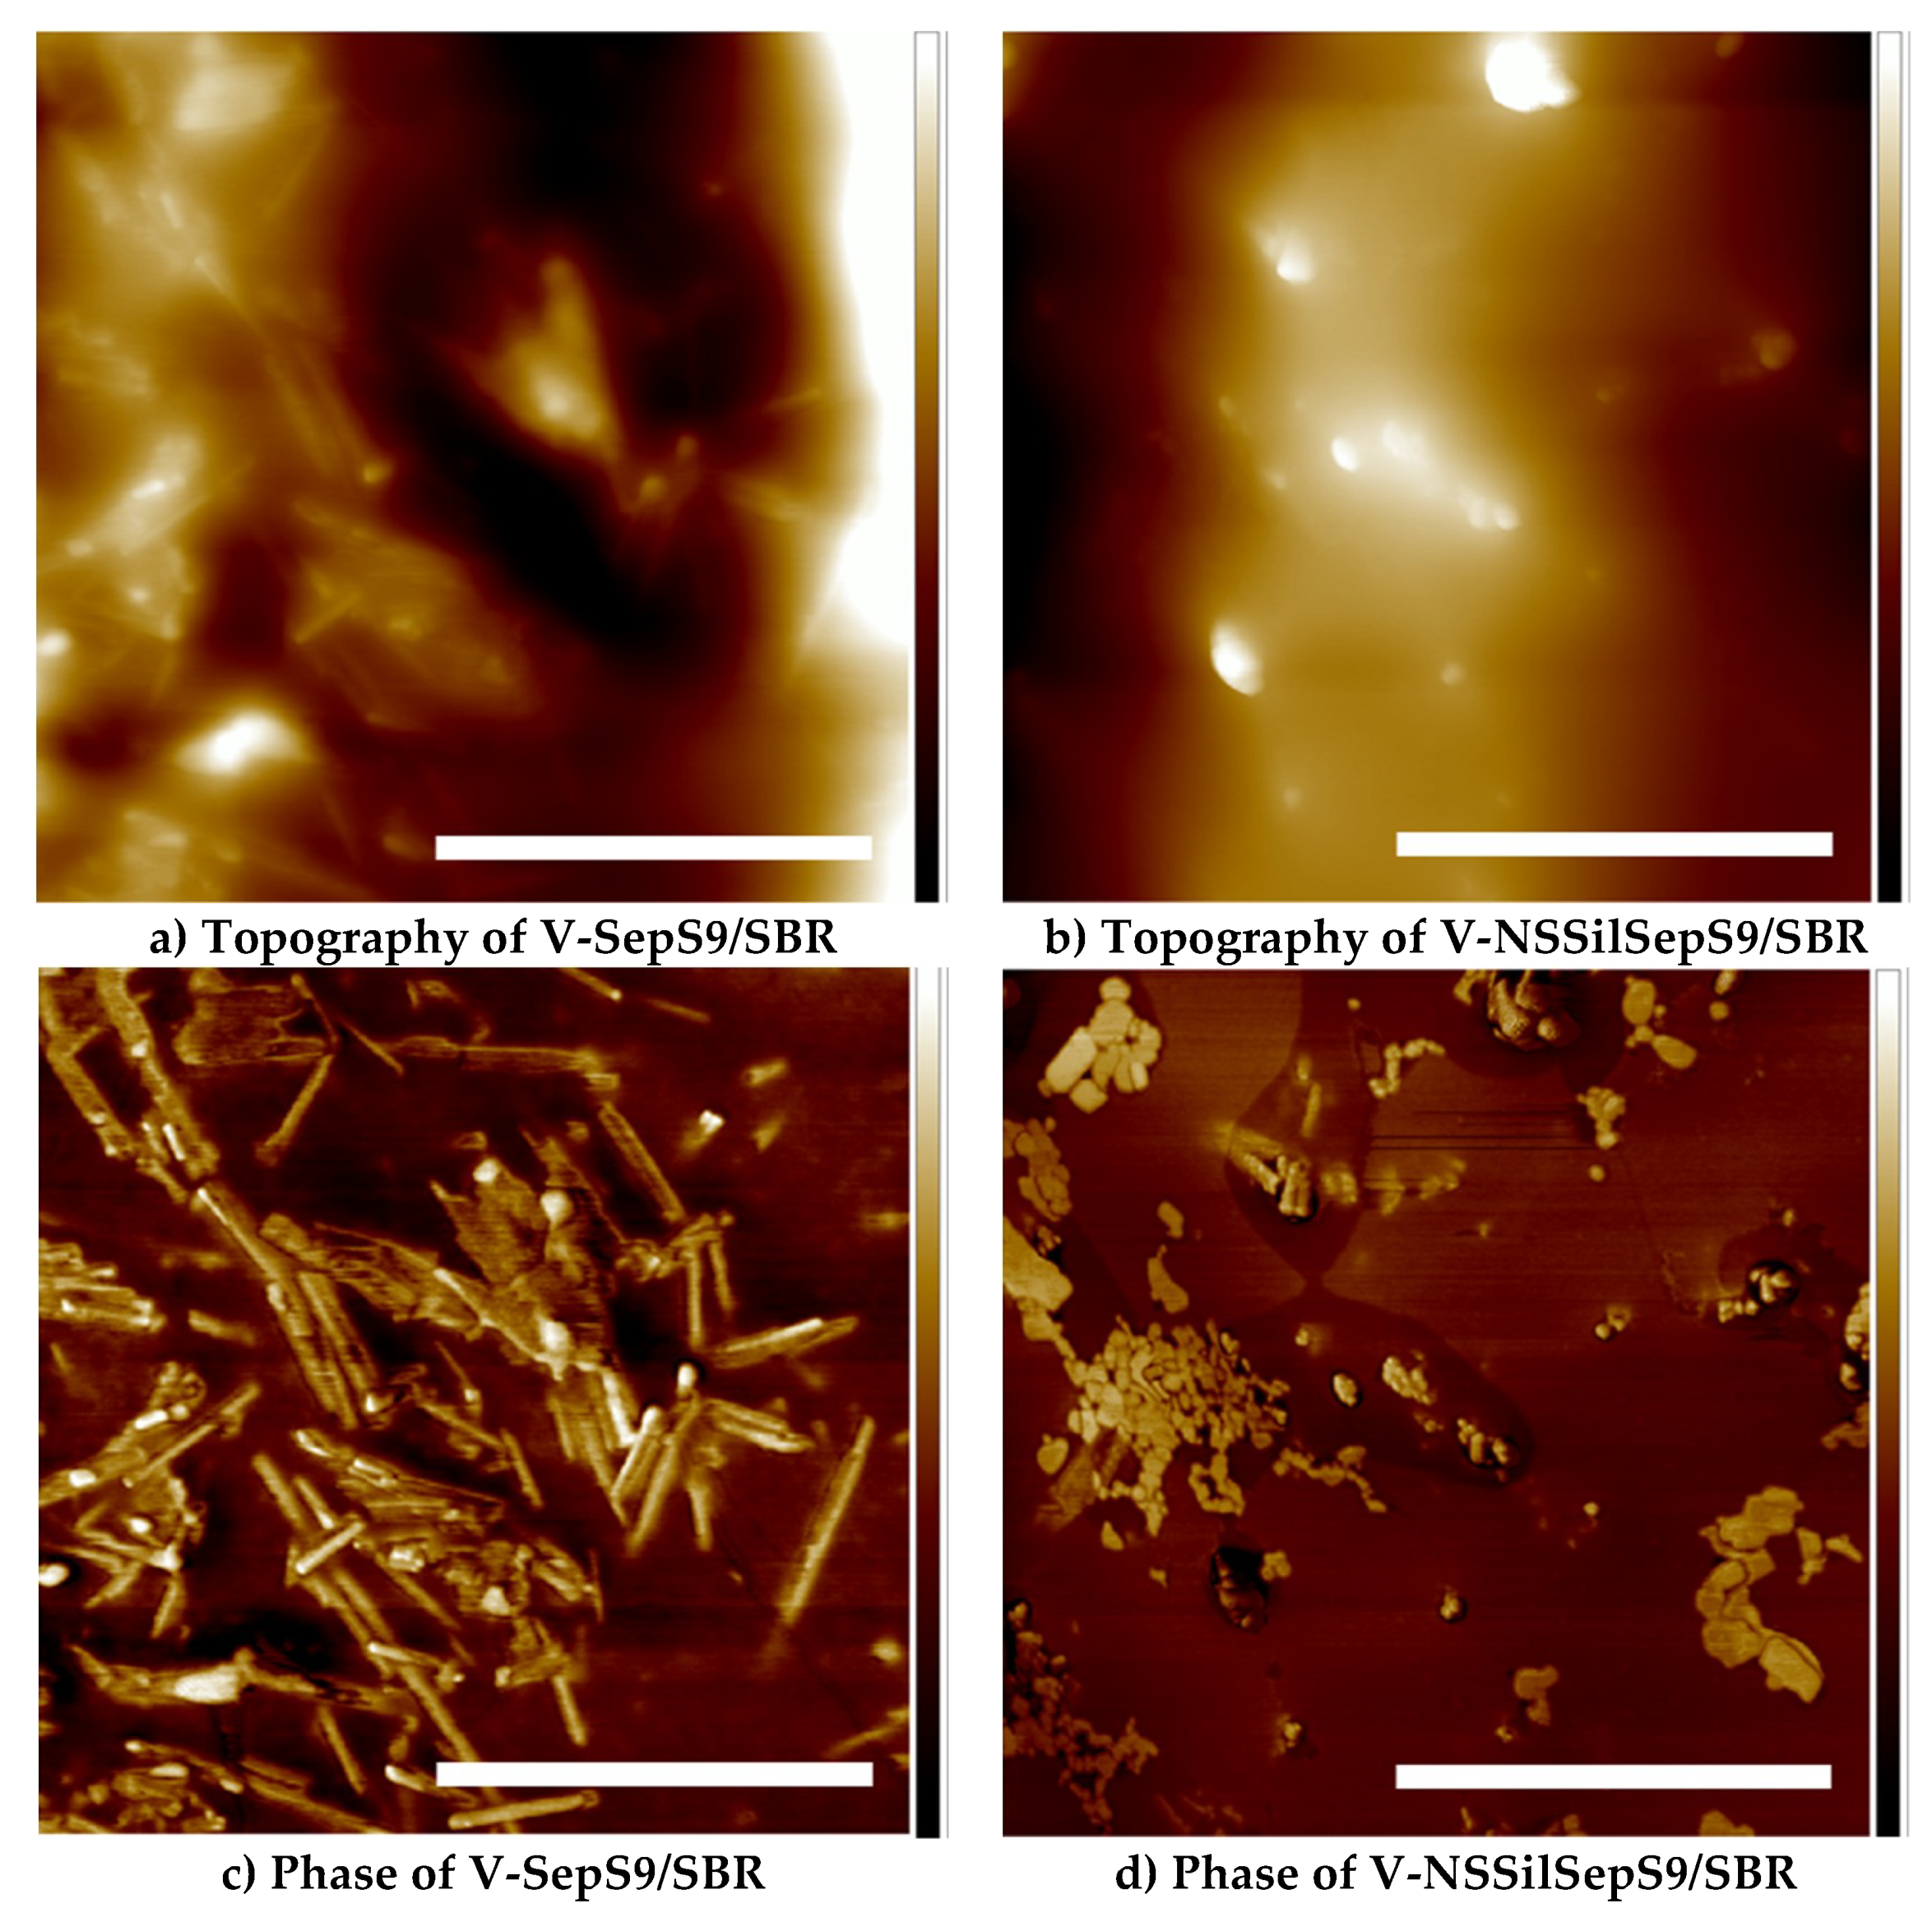
Figure 8 compares PNC prepared with pristine SepS9 with respect to that containing modified NS-SilSepS9 (AFM analyses of NS-SepS9 are reported in
Figures S2 and S3 of SM). In line with the TEM images, significant differences in the AR between SepS9 and NS-SilSepS9 are detectable. The modified Sep nanorods in V-NS-SilSepS9/SBR appear embedded in a rigid zone as the particle boundaries seem less defined and are covered by rubber material linked to the Sep surfaces (
Figure 8b,d). As recently reported in the literature [
33], the self-assembly of fillers in a sheet or in a string-like structure give rise to NCs that have better mechanical properties despite a low dispersion. In fact, the larger amount of bounded rubber at the filler–rubber interface in the self-assembled filler structures enhances the amount of overlapping rubber layers and thus improves the mechanical properties.
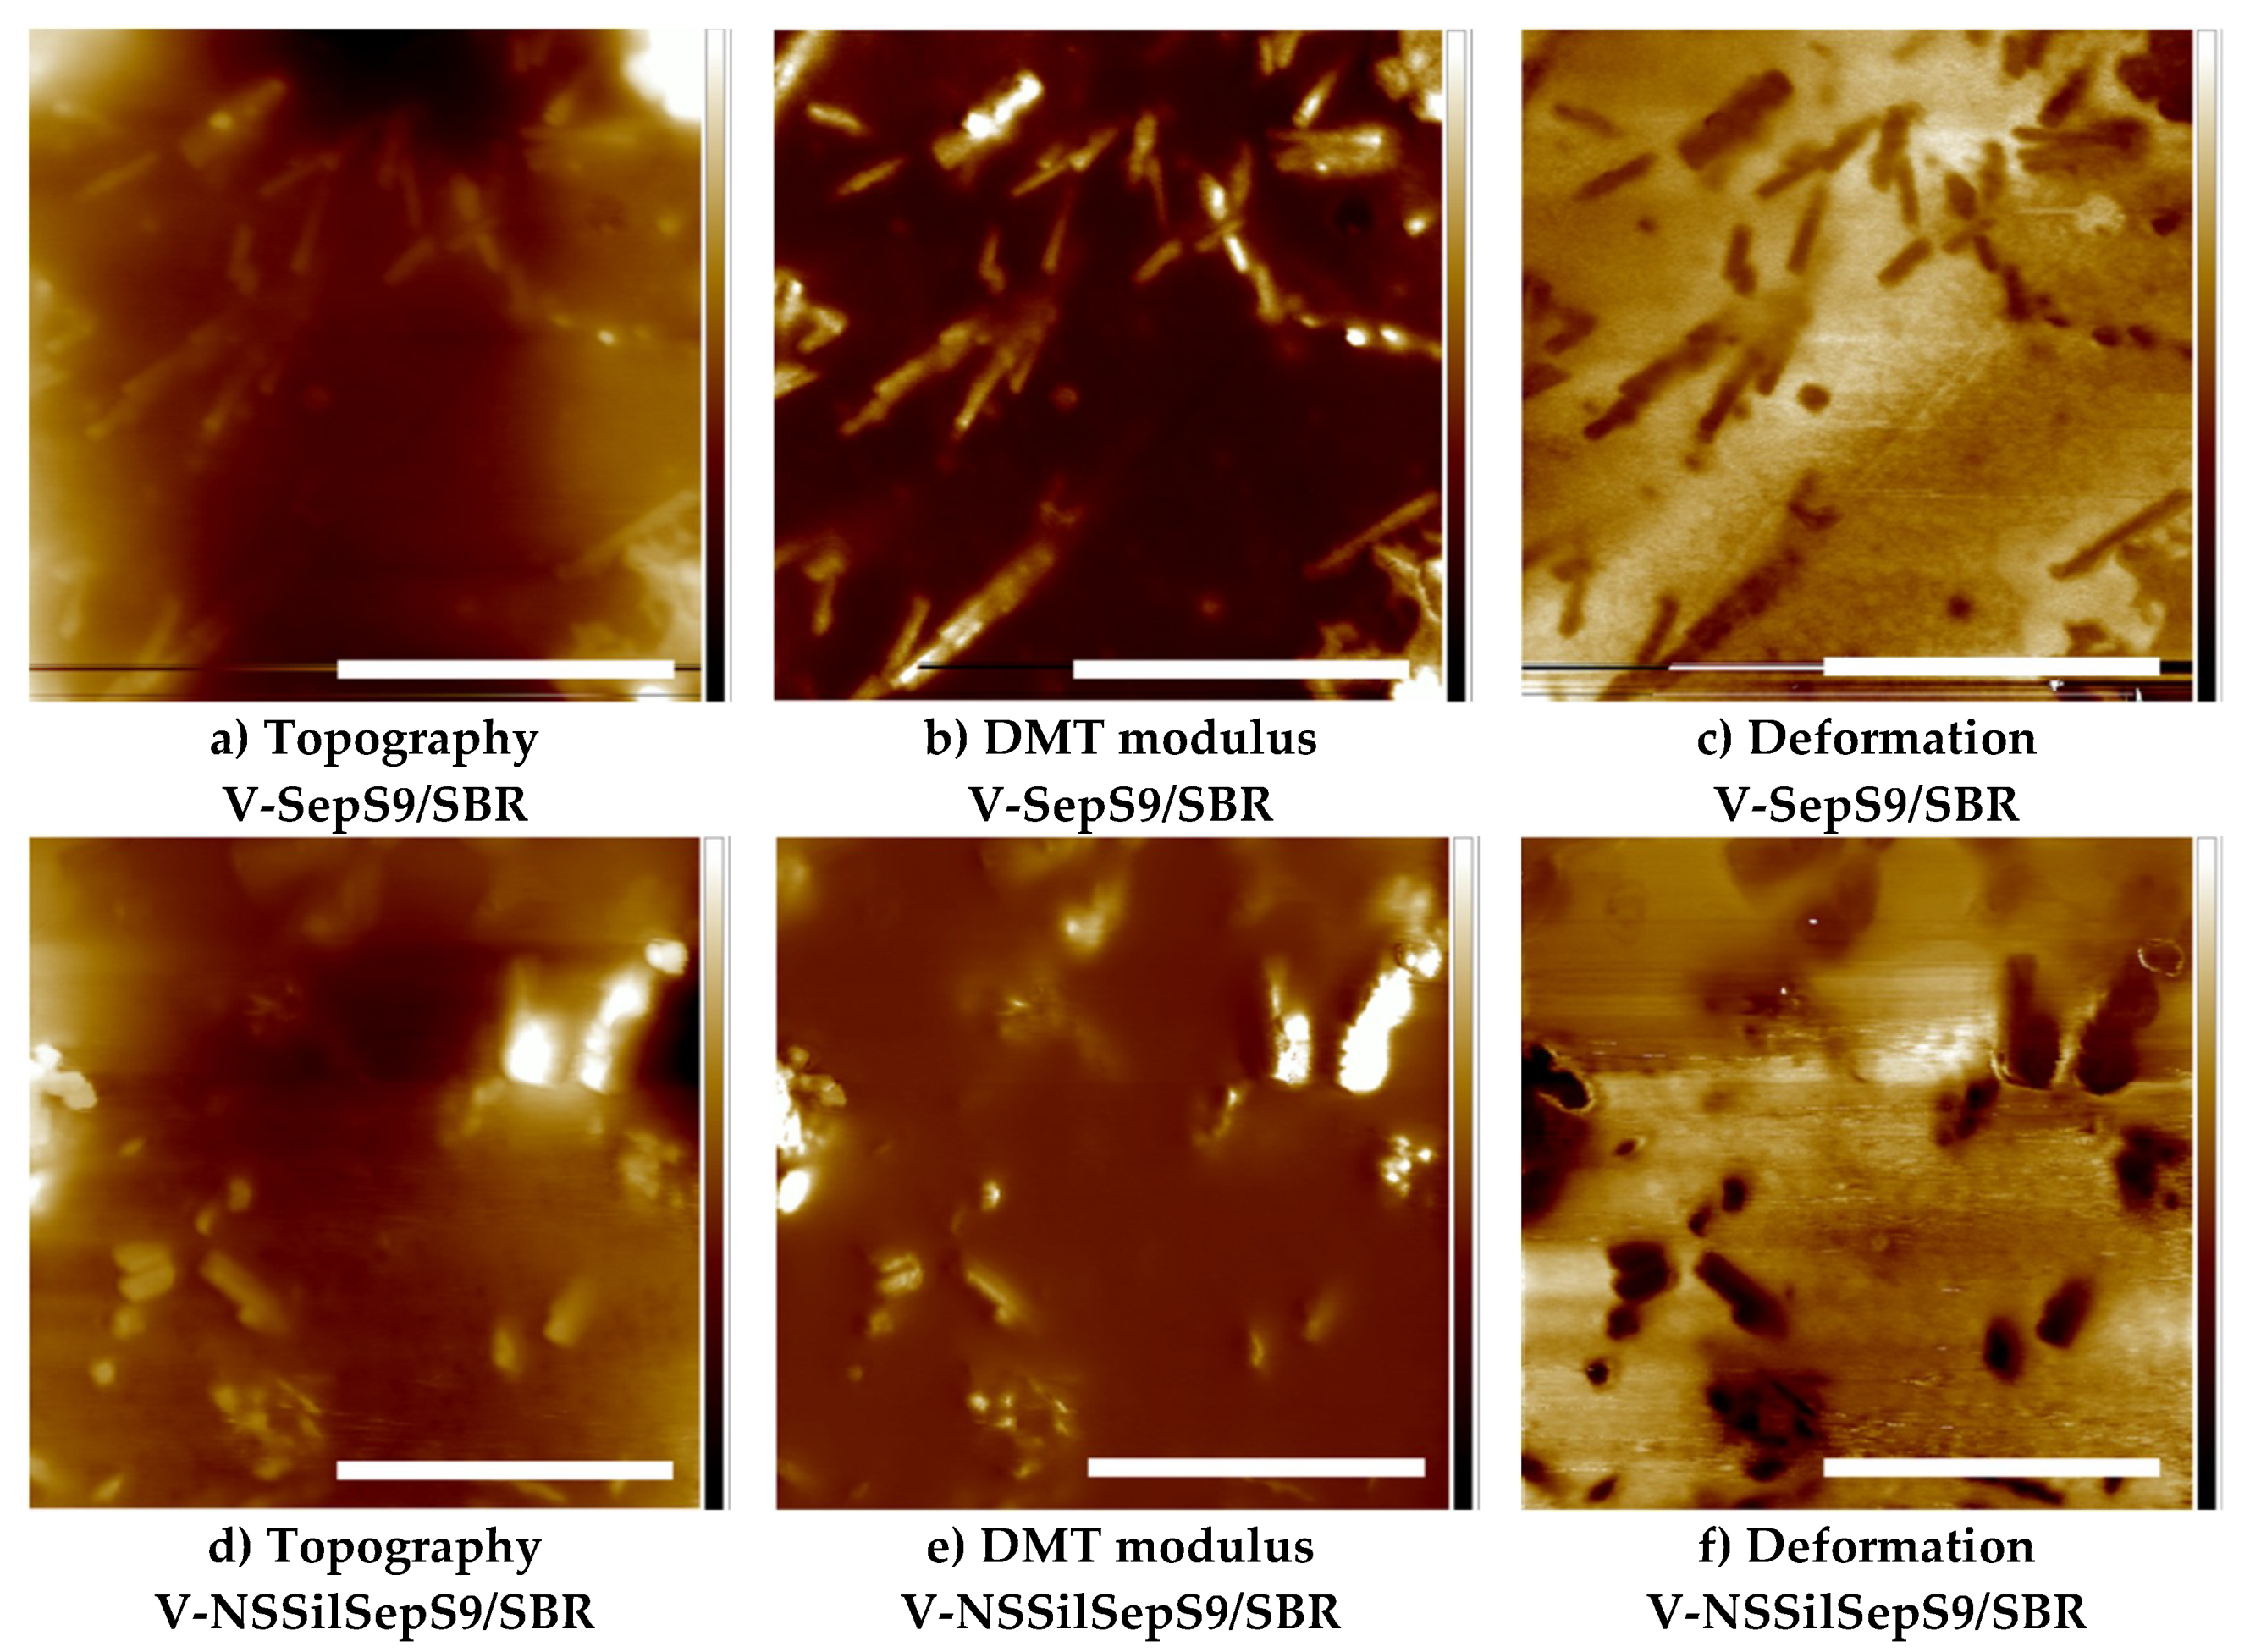
TM phase images are often very difficult to interpret since the phase signal is a convolution of several properties, such as the dissipation, stiffness, and adhesion. Thus, the PFT AFM technique was used to gain deeper insight into the nanomechanical properties of the samples.
Figure 9 shows the topography, the rigid modulus, and the samples’ deformation as determined by fitting the force curve using the Derjaguin, Muller, Toropov (DMT) model, simultaneously [
34].
From
Figure 9a,d, by comparing the PNCs with unmodified SepS9 and modified NS-SilSepS9 fibers, one can clearly conclude that in the regions where the modulus and the deformation are the lowest, the average dimensions of Sep fibers are larger than those of the unmodified filler. This suggests the presence of a rubber “layer” of about 15 to 50 nm linked to the NS-SilSepS9 surface displaying more rigid properties than the SBR matrix.
This rubber “layer” is constituted by heterogeneous rubber zones, surrounding the self-assembled Sep fibers, consisting of both the immobilized rubber chains, strongly interacting with the Sep filler through silane TESPT grafted on the surface, as detected by NMR, and the more loosely interacting outermost rubber chains, cross-linked or entangled with the primary layer.
The mapping of the deformation properties (
Figure 9c,f) confirms these observations, indicating that the chemical modification of the Sep clay drastically affects the nanomechanical properties of the final PNC.
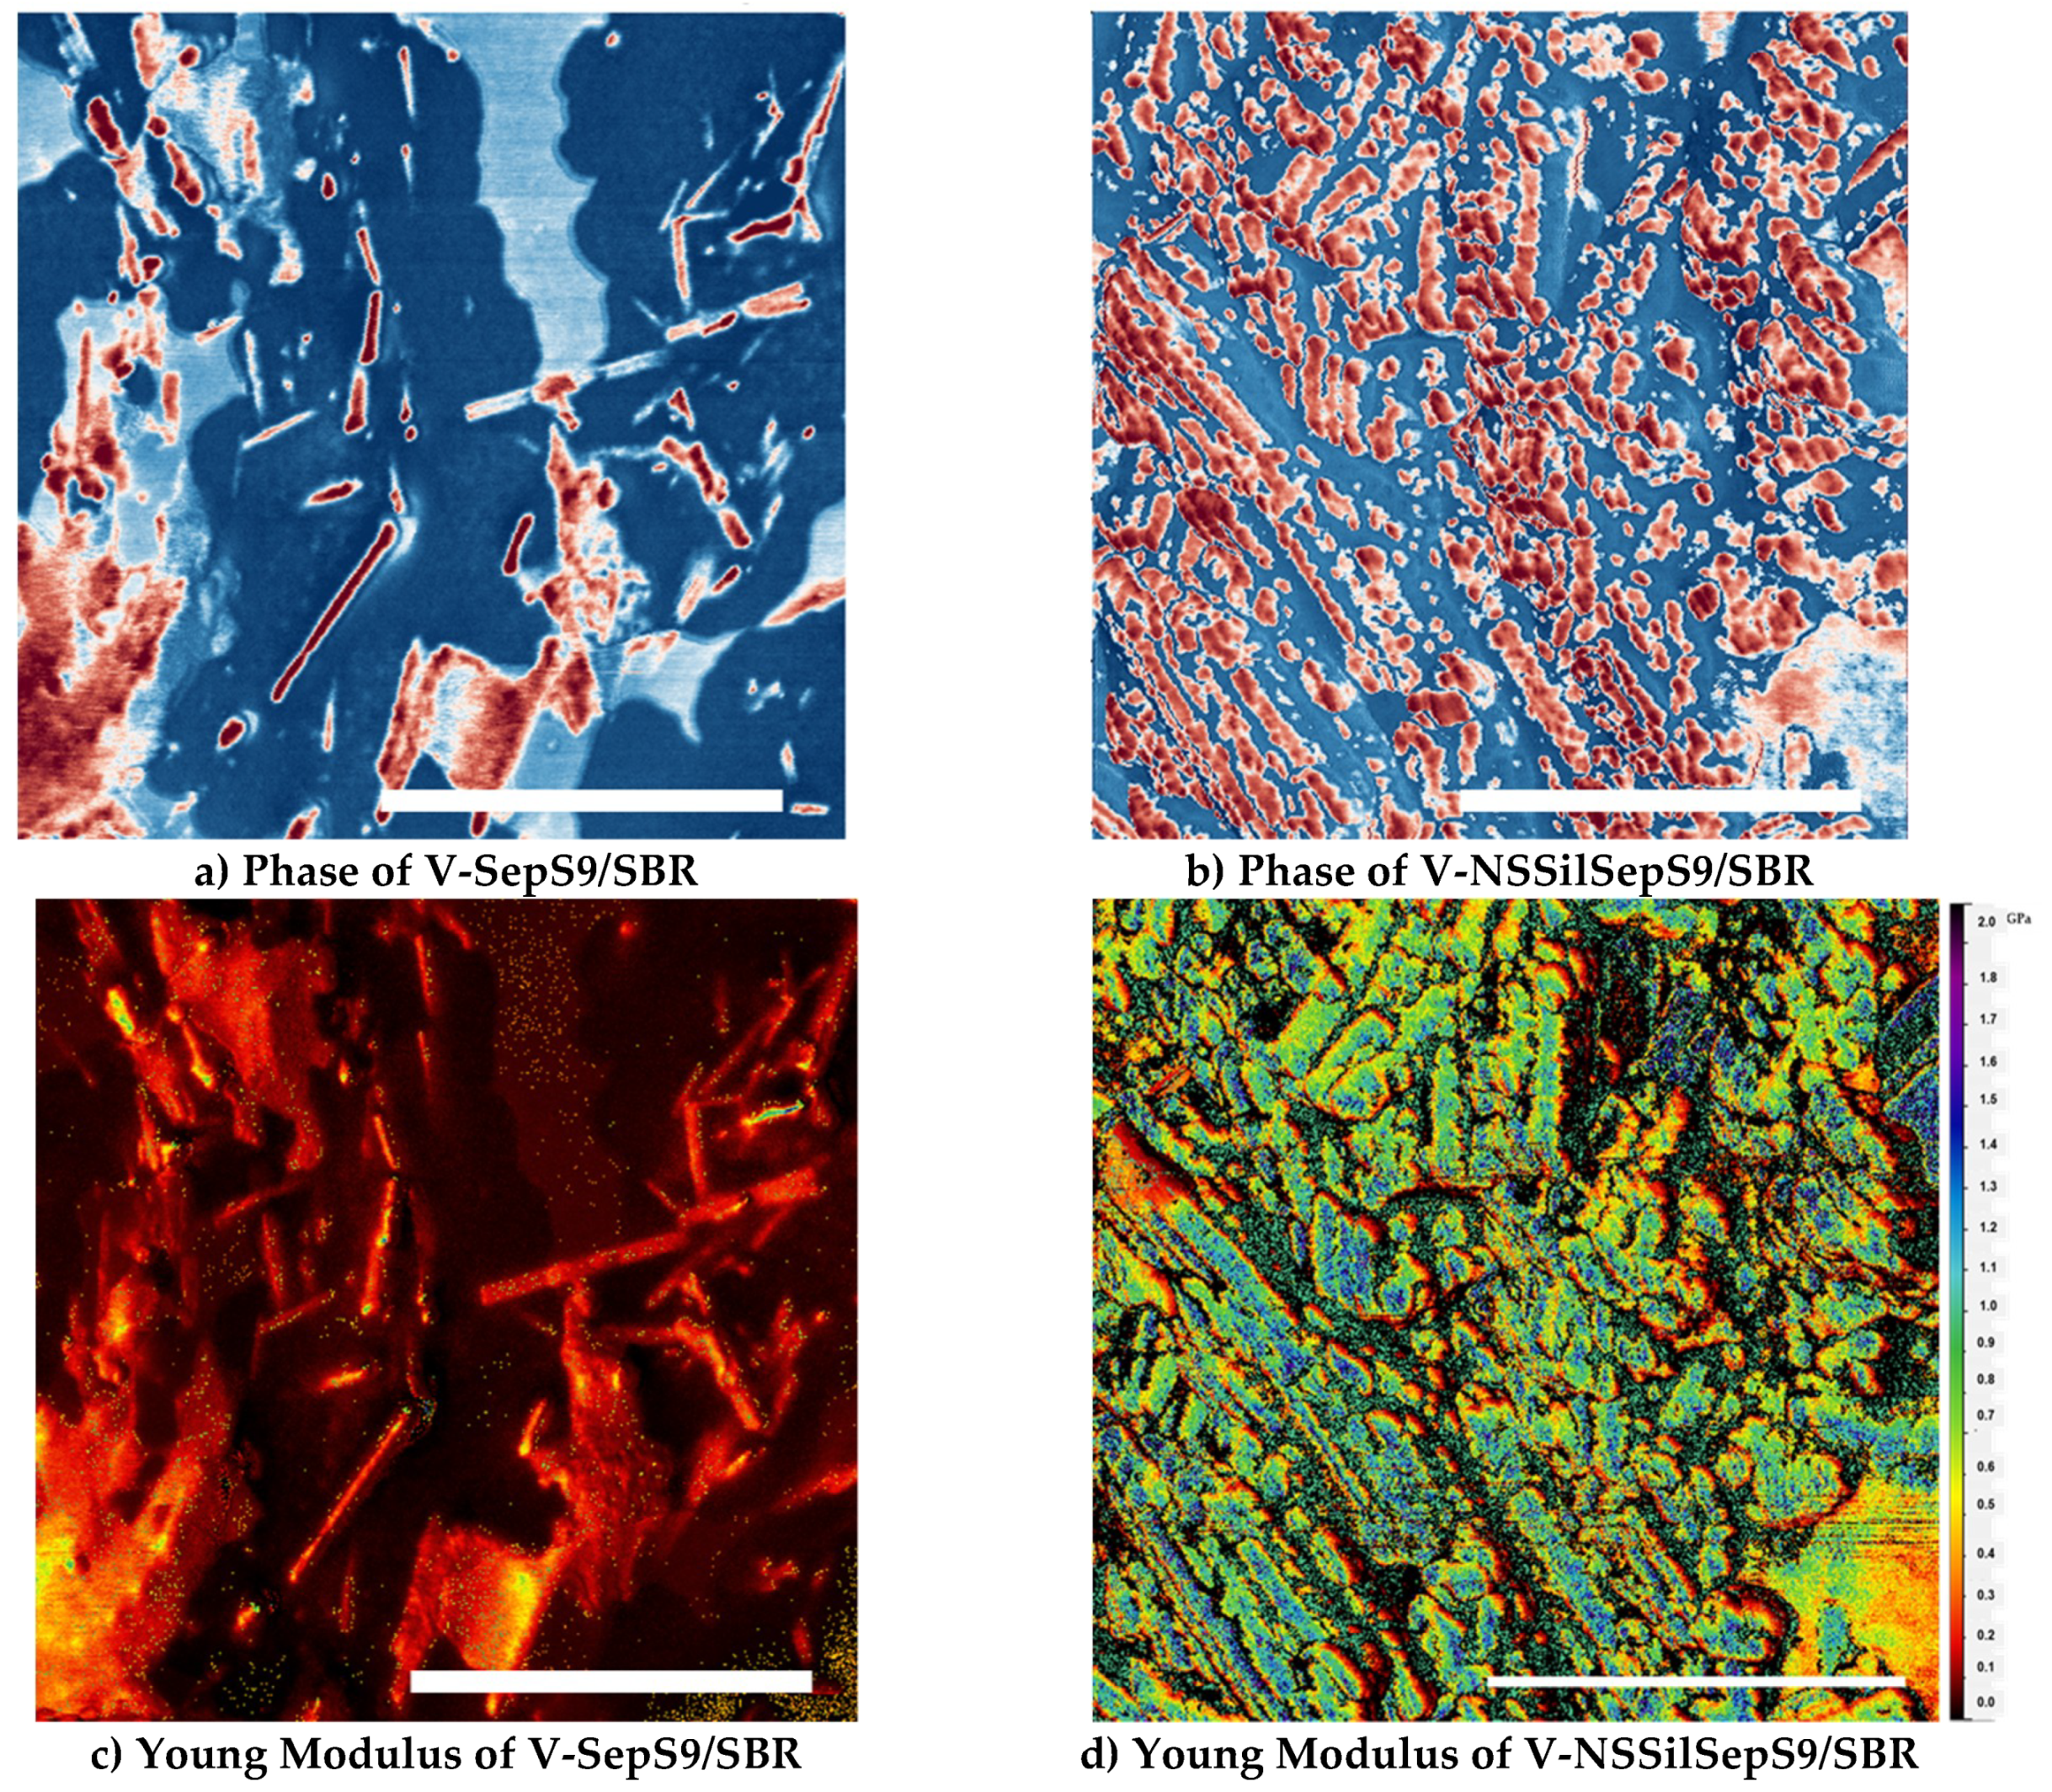
To further refine the above results, ImAFM was performed in order to determine the nanomechanical properties based on (i) the measurement of the amplitude and phase images of the intermodulation products of two close frequencies, (ii) a proper calibration of the cantilever (for instance, by using the Sader’s method), and (iii) the determination of the detection sensitivity.
Figure 10 shows the phase of the drive frequency of both V-SepS9/SBR and V-NS-SilSepS9/SBR PNCs. V-NS-SilSepS9/SBR (
Figure 10b) shows the phase of the red area related to Sep particles larger than that of the blue area corresponding to the rubber, while in V-SepS9/SBR (
Figure 10a), the blue areas have the largest phase. Moreover, as already observed from PFT AFM, for V-NS-SilSepS9/SBR, the red elongated zones are not well defined and the corresponding Sep rods present a rough surface at the filler–rubber interface due to the heterogeneous rubber zone surrounding the Sep nanoparticles.
One of the key aspects of ImAFM is the possibility to derive from the FI(A) and FQ(A) curves the nanomechanical properties and, in particular, the local Young modulus.
Figure 10c,d represent the values calculated from the force curve for each pixel of the images, respectively, for V-SepS9/SBR and V-NS-SilSepS9/SBR PNCs.
The Young modulus values are different between the zone of free rubber and the rubber close to the filler particles. In particular, V-NS-SilSepS9/SBR has an apparent Young modulus that gradually increases from the rubber matrix to the heterogeneous rubber zone around the filler and the more tight immobilized layer close to the modified Sep particles. In fact, the values change from 0.2 GPa (red in
Figure 10d) to the highest value close to 1.8 GPa (blue). On the contrary, V-SepS9/SBR shows the lowest and more constant Young modulus close to the pristine Sep particles, around 0.2 GPa (red in
Figure 10c). This confirms that modified Sep fibers supply remarkable fractions of immobilized rubber at the filler–rubber interface associated with the better mechanical properties, as described in the
Section 3.1.

 ,
, 


