1. Introduction
Research in the field of nanomaterials opens scenarios that are anything but obvious. A particular spectroscopic technique, which aims at identifying and quantifying molecular species of biomedical interest becomes feasible when materials with specifically designed optical properties are available. In principle, it is possible to recognize a chemical species by means of the inelastic scattering of a probing laser light that discloses the features of the vibrational spectrum of the target molecule to be probed. The intrinsic limit of Raman spectroscopy is the very low scattering cross-section (about 10
−30 cm
2 molecule
−1). This may be overcome when a
surface plasmon resonance (SPR) and the associated strong increase of the scattered intensity is triggered at a nanostructured metal surface (Surface Enhanced Raman Spectroscopy, SERS). The wavelength and Full Width at Half Maximum (FWHM) of the SP, as recorded in the UV-Vis spectrum of the film, are the optical characteristics of a corrugated metal surface of specific interest when exploring its behavior as an active SERS substrate. Near the metal surface, the electric field enhancement associated with the exciting light is most relevant with the noble metals silver and gold. In particular, large electromagnetic field enhancements [
1,
2] are observed at
hot spots, corresponding to specific local surface morphologies that include sharp tips, edges and thin interparticle gaps. The surface nanostructures of artificially roughened Ag and Au thin films display many hot spots [
3] making them excellent SERS substrates. Thus, the goal is to synthesize Ag and Au films with surface nanostructure engineered so as to maximize the SERS signal.
Pulsed laser ablation (PLA) makes use of two alternative methods to produce artificially corrugated nanostructured surfaces. Both methods are based on the vaporization of a solid target by high-energy laser pulses in an ambient fluid, whose role is to confine the vaporized species and to induce their mutual aggregation, obtaining clusters and nanoparticles (NPs) without chemical precursors. The fluid can be a gas or a liquid transparent to the laser radiation.
When ablation is performed using an ns-laser (nanosecond-laser) in a high pressure, neutral ambient gas, NPs are directly deposited onto appropriate inert supports where they self-arrange leading to qualitatively different surface nanostructures [
4,
5,
6]. For defined experimental conditions [
4], a path connects two extreme morphologies: isolated, sphere-like NPs, more or less crowded together, and a continuous metal film. The two relevant parameters to design the surface nanostructure of the growing film are the number of laser pulses (
) and the ambient gas pressure (
). In fact, for a progressively increasing
and
, we observe first particles more and more coalesced together whose size increases progressively while the shape departs from spherical and becomes more and more irregular. Later, islands separated by a network of randomly oriented channels with variable length and width in the few nm range develop. By increasing
, keeping constant
at low values, the support is covered by increasingly smaller, spherical NPs; at high
values, we observe islands with smaller average size and correspondingly a larger number of shorter channels (see
Figure 1a,b). The
value defines the degree of support coverage. With increasing
, keeping constant
, we observe a spatial densification of the NPs on the support. The role of
and
is illustrated in
Figure 1 for self-assembled Au NPs on (100) Si supports. The same qualitative trend is observed for Ag NPs.
Remarkably, for both metals, the average NP sizes observed in the Transmission Electron Microscope (TEM) agree with the predictions of a model for the plasma expansion through a high-pressure ambient gas [
4,
7]. Concerning the optical properties of the obtained nanostructures, for both metals, the SP wavelength decreases with increasing
at fixed
, as well as, when
is kept fixed and
is increased, the SP wavelength increases.
When a liquid is used as the confining medium through which the ablation plasma expands, a colloidal solution is obtained. By pulsed laser ablation in liquid (PLAL), using a nano/picosecond laser source, surfactant-free NPs are produced in a single-step approach within a time scale of a few minutes [
8]. In a stationary liquid, the process consists of the production of NPs by ablation of the target, and the contemporaneous fragmentation-assembling of dispersed NPs by continuous irradiation of already synthesized particles. The laser pulse duration is a relevant parameter for NP generation [
9]. With picosecond pulses (ps pulses), the relevance of melting and thermal evaporation is strongly reduced with respect to nanosecond pulses (ns pulses). With short pulses, the ablation process becomes increasingly efficient involving a nearly instantaneous vaporization with minimized heat-affected zone [
10], so that the colloidal solution is produced in a shorter time. Besides this, compared to ns pulses, ps pulses allow for mitigating primary plasma shielding that is detrimental to ablation efficiency [
11].
Recently, in the scientific literature that deals with drug dosage [
12], there emerged a promising technique based on Raman/SERS, specifically suited to low drug concentrations [
13,
14,
15,
16,
17] that is complementary to those in clinical use. In a potential application scenario, it would be possible to trace the concentration of a drug in blood plasma samples of clinical origin subjected to limited and rapid treatments (e.g., centrifugation, extraction with solvents). The SERS measurement exploits the interaction of the drug molecule with a nanostructured metal surface and the intensity of the signal, under controlled conditions, allows for tracing the quantity of molecules adsorbed on the metal, which is a function of the drug concentration in the tested solution. The analytical capability of SERS was shown to be comparable with High-Performance Liquid Chromatography (HPLC) technique [
18], thus making possible to study the potentiality of this spectroscopic technique in the field of Therapeutic Drug Monitoring (TDM). TDM is a clinical practice that involves determining the concentration of a drug in a biological fluid, usually blood plasma. This procedure is particularly relevant for drugs characterized by a narrow therapeutic index (NTI). In such drugs, the difference between the concentration at which therapeutic effects and the (slightly larger) concentration at which side effects are observed for the patient is minimal. In therapies that use NTI drugs, it is important to know the plasma concentration of the drug. This way, the patient’s clinical conditions can be associated with the required drug dose to guarantee the effectiveness of the treatment, avoiding the occurrence of side effects. TDM has been used for a long time in the clinical practice for NTI drugs. Among these drugs, we find anticancer drugs and antiepileptic drugs (AEDs). For the latter, toxicity can be induced by a small drug excess, whereas even a small reduction of the effective dosage can reduce the efficiency in controlling seizures.
Current research efforts in the SERS-TDM field point at overcoming the difficulties associated with the weakness of the signals of some drugs and/or to the background signal from much more abundant biomolecules coexisting with the drug in the fluid to be analyzed. A second relevant research direction is the development of SERS sensors (i.e., nanostructured metal surfaces) that combine a high sensitivity with spatial uniformity, control and reproducibility of the manufacturing process, not disregarding a low-cost production. Before the SERS technique can be routinely introduced into the clinical laboratory, besides the above technological issues, the treatment of the samples should also be optimized. Finally, validation procedures are required to develop quantitative SERS measurements. These imply determining drug concentration with standard reference methods (HPLC-MS or immunological assay).
In this work, we show how noble metal thin films resulting from self-assembled NPs can be produced in a controlled and reproducible way by PLA techniques. The obtained surface nanostructures are irregular and non-periodic. The peculiar morphological features of such nanostructures allow the good stability and reproducibility of the SPR of the films and lead to optimal electromagnetic enhancements in SERS [
2]. Such control on plasmonic properties is required for effective application of SERS in analytics [
14,
19]. We have employed these films in TDM, focusing on two AEDs (Carbamazepine—CBZ, Perampanel—PER). In the case of CBZ, we prove that a SERS substrate can be re-utilized at least five times by washing it with methanol. We also show the good linear dependence of the SERS signal vs. CBZ concentration in the range 2.5 × 10
−5 M to 2.1 × 10
−4 M. In the case of PER, we exploit the protonation mechanism of the drug by HCl, as suggested by observed changes of the C=O stretching transition between Raman and SERS, and UV-Vis data taken on PER in acidic conditions. This paves the way to the control of the chemical enhancement pathway in SERS, which is triggered by effective chemical interaction of the analyte and the noble metal surface.
2. Experimental
2.1. Production of Au Substrates by PLA in High-Pressure Inert Gas
Au films were prepared at room temperature in a vacuum chamber, starting from a base pressure lower than 10−4 Pa using a KrF excimer laser (wavelength 248 nm, pulse width 25 ns, repetition rate 10 Hz, incidence angle 45°) focused onto an elemental target (Au, 99.99%) mounted on a rotating holder. The films were deposited onto pieces of glass, or (100) Si placed in front of the target at a distance of 35 mm. The target holder was rotated to avoid cratering of the target surface under repetitive ablation. Ablation was performed in Ar atmosphere at 100 Pa, with fixed at 2 × 10⁴, and the laser fluence (f) kept constant at f = 2.0 J· cm−2. Sample surface nanostructuring was observed by scanning electron microscopy (SEM) using a Zeiss Supra 40 field ion microscope (Carl Zeiss NV, Via Varesina 162, 20156 Milano, Italy). UV–vis spectroscopy measurements of SPR were performed with a PerkinElmer UV-Vis/NIR Lambda 750 spectrophotometer (PerkinElmer Italia Spa, Viale dell’Innovazione 3, 20126 Milano, Italy) over the range 190–900 nm.
2.2. Production of Ag Colloids by PLAL using Water
We carried out PLAL of an elemental target (Ag, 99.9%) in deionized water using the second harmonic (532 nm) of a laser operating at 100 kHz repetition rate with pulse width of 6–8 ps. Ablation was performed at f = 1.5 J· cm−2, for an irradiation time of 10 min. The laser beam was focused with a galvanometric scanner to a spot of about 80 μm in diameter on the surface of the target that was scanned on a 10 × 10 mm2 area with a scan speed of 800 mm· s−1. The colloids were transferred on glass, or (100) Si supports by an ultrasonic spray-casting deposition method. The experimental setup consists of a deposition chamber equipped with an ultrasonic atomizer (Sonics VCX 130 W, Sonics & Materials Inc., 53 Church Hill Rd, Newtown, CT 06470, USA), a heated substrate holder and a system to remove excess vapors, thus guaranteeing standard and reproducible conditions. By ultrasonic spraying, we deposited a fraction of the produced colloids on nickel grids to perform Scanning Transmission Electron Microscopy (STEM), using an instrument operating at the primary accelerating voltage of 30 kV, at a working distance of 4 mm (Zeiss model Merlin Gemini 2).
By the same ultrasonic spraying procedure, we deposited Ag NPs onto (100) Si supports, obtaining substrates suitable for SERS measurements. In
Figure 2, we show a representative STEM image (a), the average size distribution (b), and the optical absorbance spectrum (c) of Ag colloids prepared by ps-PLAL in water at the optimized laser fluence
f = 1.5 J· cm
−2. Nearly spherical NPs, whose size is about 15 nm, result from the likely agglomeration and overlap of smaller NPs (see
Figure 2a). The UV-Vis absorption spectrum (
Figure 2c) displays a narrow SPR, as expected on the basis of the narrow size distribution of the constituent NPs. This is the outcome of the optimization of the laser fluence. In the range 0.5 J· cm
−2 1.5 J· cm
−2, the SPR peak intensity increases and its FWHM decreases on increasing the laser fluence, keeping fixed all other deposition parameters.
2.3. Raman Spectroscopy
Raman and SERS spectra were collected by a HORIBA Jobin–Yvon LabRAM HR800 Raman Spectrometer(HORIBA France SAS, 231 rue de Lille, 59650 Villeneuve d’Ascq, France) with a solid-state laser (Laser XTRA, Toptica Photonics, TOPTICA Photonics AG, Lochhamer Schlag 19, 82166 Graefelfing (Munich), Germany) operating at 785 nm, equipped with a 600 grooves· mm−1 grating, a Peltier-cooled Charge-Coupled Device (CCD) detector, and notch filters to suppress Rayleigh scattering contributions. The same Raman spectrometer can be operated also with the 458 nm excitation from an Ar-ion laser.
3. Results and Discussion
The ability to produce nanostructured surfaces with a highly uniform morphology allows for designing sensors with a SERS signal of adequate reproducibility. This condition is mandatory when such sensors are used to detect analytes at low concentrations (as for drugs). In the recent past, we developed two complementary approaches to produce SERS sensors by exploiting the remarkable control in the production of nanoparticles offered by laser ablation techniques. The high control and reproducibility of these manufacturing processes allow the production of nanomaterials with optimized morphology, high sensitivity and spatial uniformity.
The first approach discussed in
Section 3.1 below employs ablation in high-pressure inert gas to produce Au sensors, which we tested on the AED Carbamazepine (
Figure 3a). In the second approach, which we considered at a later time, Ag colloids are produced by ablation of the target in water, and are subsequently sprayed on a support to obtain the thin film SERS sensor. We show in
Section 3.2 below our early and promising results obtained by testing these PLAL sensors on a second AED, namely Perampanel (
Figure 3b). The choice of Ag allows for using HCl to control pH, fostering protonation of the drug, and providing chloride ions which are known to promote SERS action on silver [
20]. Carbamazepine (CBZ) is a well-established drug largely used in developing Countries, whereas Perampanel (PER) is a new generation AED.
3.1. Quantitative SERS Detection of Carbamazepine
Nanostructured films made of arrays of NPs produced by Pulsed Laser Deposition (PLD) of a solid Au target in high-pressure inert gas and mutually assembled on an inert (glass) support behave as SERS sensors with good performances [
16].
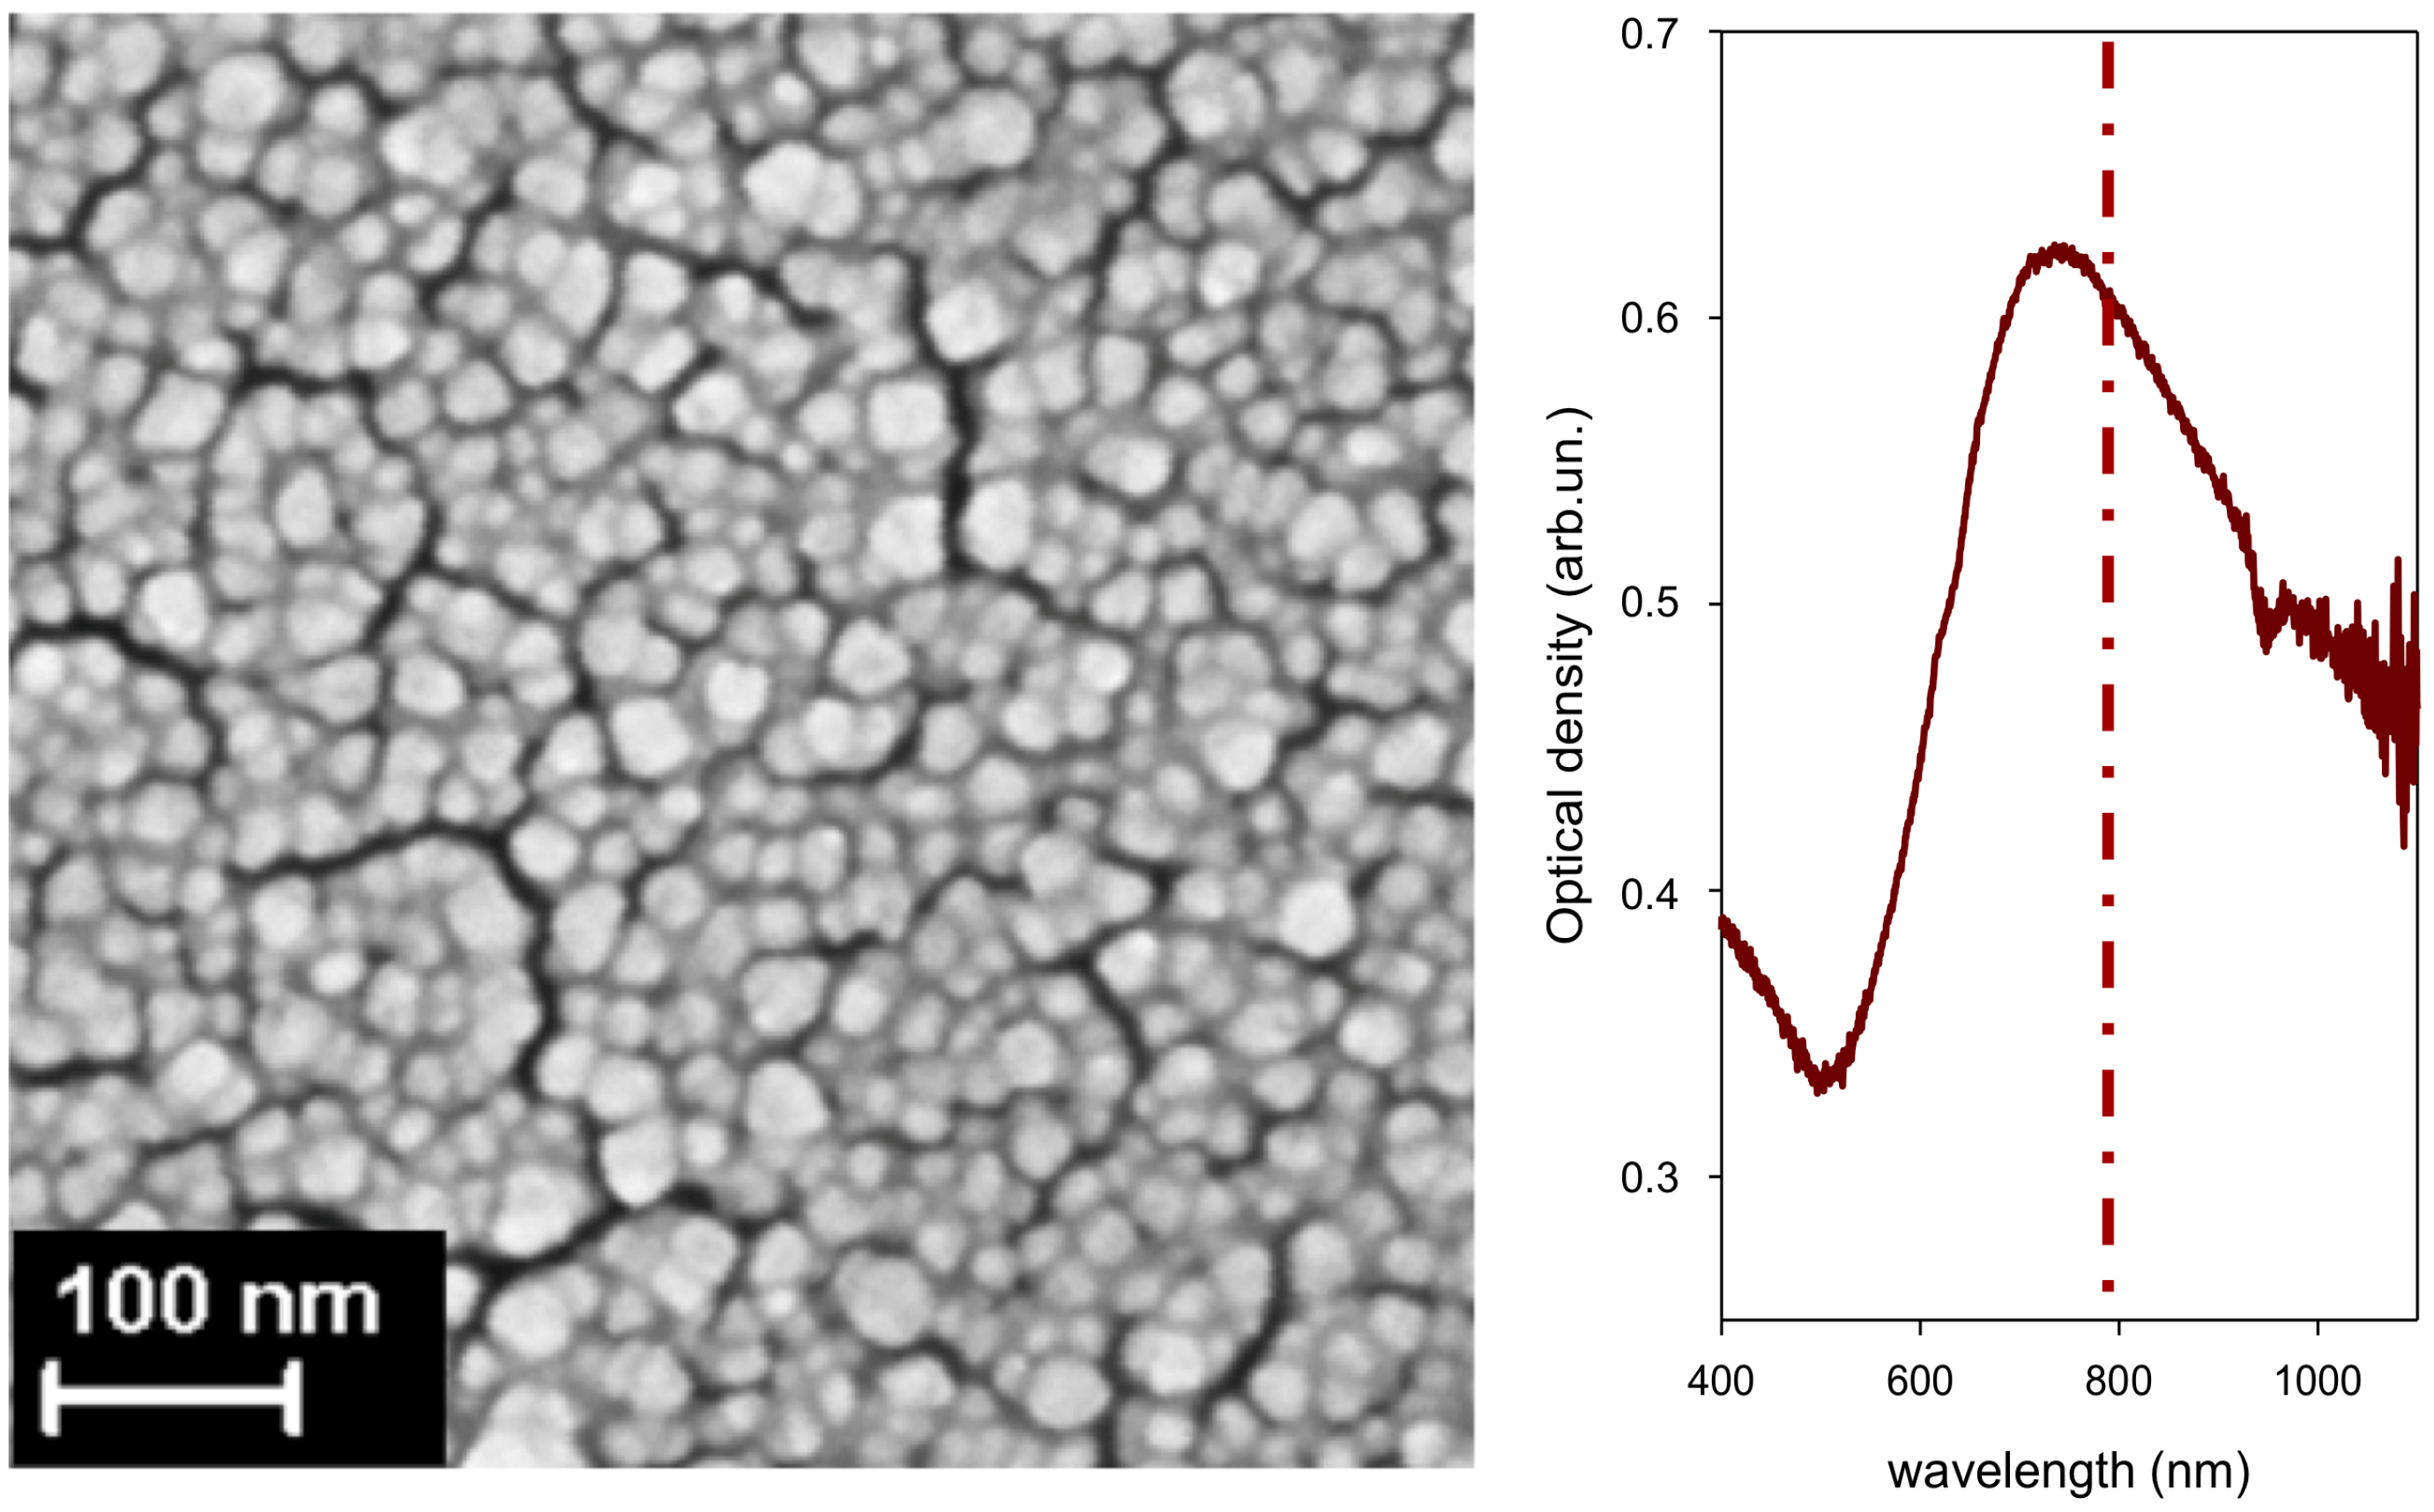
In
Figure 4, we show the surface nanostructure of an Au film deposited on (100) Si (ablation in Ar at 100 Pa;
= 2 × 10
4). As shown in
Figure 4, the SPR of films produced with this set of process parameters and deposited on glass matches the popular 785 nm laser excitation found in commercial Raman instruments, including portable ones. We used substrates of this kind, either deposited on glass, or on Si, throughout all investigations on CBZ. Part of the data we discuss on CBZ was presented in [
6]. Here, we complete the data analysis including additional SERS markers, and we show in detail the evolution of SERS markers upon the washing procedure of a sensor.
As reported elsewhere [
16], there is agreement between the Raman and SERS features of CBZ over a wide wavenumber range. This is suggestive of a comparatively weak interaction between the Au substrate and the CBZ molecule. This fact, together with the remarkable stability of the substrates opens the way to recycle them, adopting a washing procedure with MeOH between consecutive measurements of drug concentration. The results of such washing procedure are shown in
Figure 5. These results prove the following: (i) the background of the pristine sensor is blank in the spectral region of the CBZ markers; (ii) washing the sensor by immersion in MeOH for 5 min effectively removes the drug from the active surface as supported by the disappearance of the SERS markers; (iii) the successive immersion of the sensor in CBZ solution restores the initial SERS signal (i.e., the functioning of the sensor is preserved, even after five cycles of operation—which is enough to obtain the calibration curve of the sensor for four different values of concentration, see below); (iv) the interaction between CBZ and Au is weak (physisorption). Point (iv), together with the large wavelength distance between the absorption peak of CBZ (285 nm—see
Figure 6) and the plasmon resonance (735 nm, very close to the laser excitation at 785 nm), indicate that the SERS of CBZ is electromagnetic in nature [
21].
After proving the re-usability of such SERS sensors, we quantified their response as a function of CBZ concentration in a range which includes the therapeutic range (2.5 × 10
−5 M–5.1 × 10
−5 M). Out of the seven available SERS markers [
16], we selected those which show up more clearly from the background (717, 1220, 1564 and 1619 cm
−1—see
Table 1). The measurements shown in
Figure 7 were performed by using
one single substrate at increasing CBZ concentration. Spectra were recorded by taking 3 averages of 10 s each. The laser power at the sample surface was 1 mW over a spot area of 1 um in diameter. The substrate was dipped for 5 s in a 1 mL volume of the CBZ solution, and dried before recording. The substrate was washed in MeOH for 5 min after each SERS measurement. Control SERS spectra were taken after each washing procedure showing the complete disappearance of all CBZ features. The sensitivity to drug concentration is evident in
Figure 7 for all the selected CBZ markers.
In
Figure 8, we report the SERS spectrum of CBZ at the total concentration of 5.0 × 10
−5 M in blood serum from an epileptic patient. We used an Au substrate deposited on (100)Si to record the SERS spectrum adopting a higher laser power (10 mW) and a longer integration time (100 s). We observe four SERS signatures coincident with CBZ signatures, notwithstanding the large fraction (about 70%) of CBZ bound to albumin, as well as the complexity of a biological matrix such as the blood serum has. It is interesting to notice that the peculiar nanostructure of our SERS sensors produced by PLD in gas results in plasmonic hot spots localized at the narrow (few nm wide) channels that separate from each other Au islands made by agglomerated NPs on the support [
2]. When samples are composed by molecules characterized by different molecular weights, and thus different diffusivities, this unique substrate morphology may enhance the probability that small molecules (such as drugs) reach the hot spots with respect to more bulky species.
3.2. SERS of Perampanel in Acidic Water Solutions
For SERS measurements of PER, we used an Ag substrate ultrasonically sprayed on a (100)Si support starting from colloids synthesized by ps-PLAL (see Experimental). The surface nanostructure (
Figure 9a) consists of nearly spherical NPs in part coalesced to give spheroidal shapes and more complex agglomerates. The UV-Vis absorption spectrum from a companion film sprayed on glass is shown in
Figure 9b.
Moving from our previous observation that an acidic environment (using HCl) fosters SERS on such Ag substrates through the protonation of PER, extracted from Fycompa
® tablets [
22], we prepared aqueous solutions of PER (Cayman Chemical Item No. 23003; CAS 380917-97-5) at the concentration of 5 × 10
−5 M at different pH values, starting from a concentrated methanol solution of PER in water acidified with HCl. The pH was checked each time before adding the drug. Our preparation procedure of PER solutions suggests that the charge state of PER plays a relevant role to SERS measurements, thus making evident the importance of the chemical enhancement mechanism [
23].
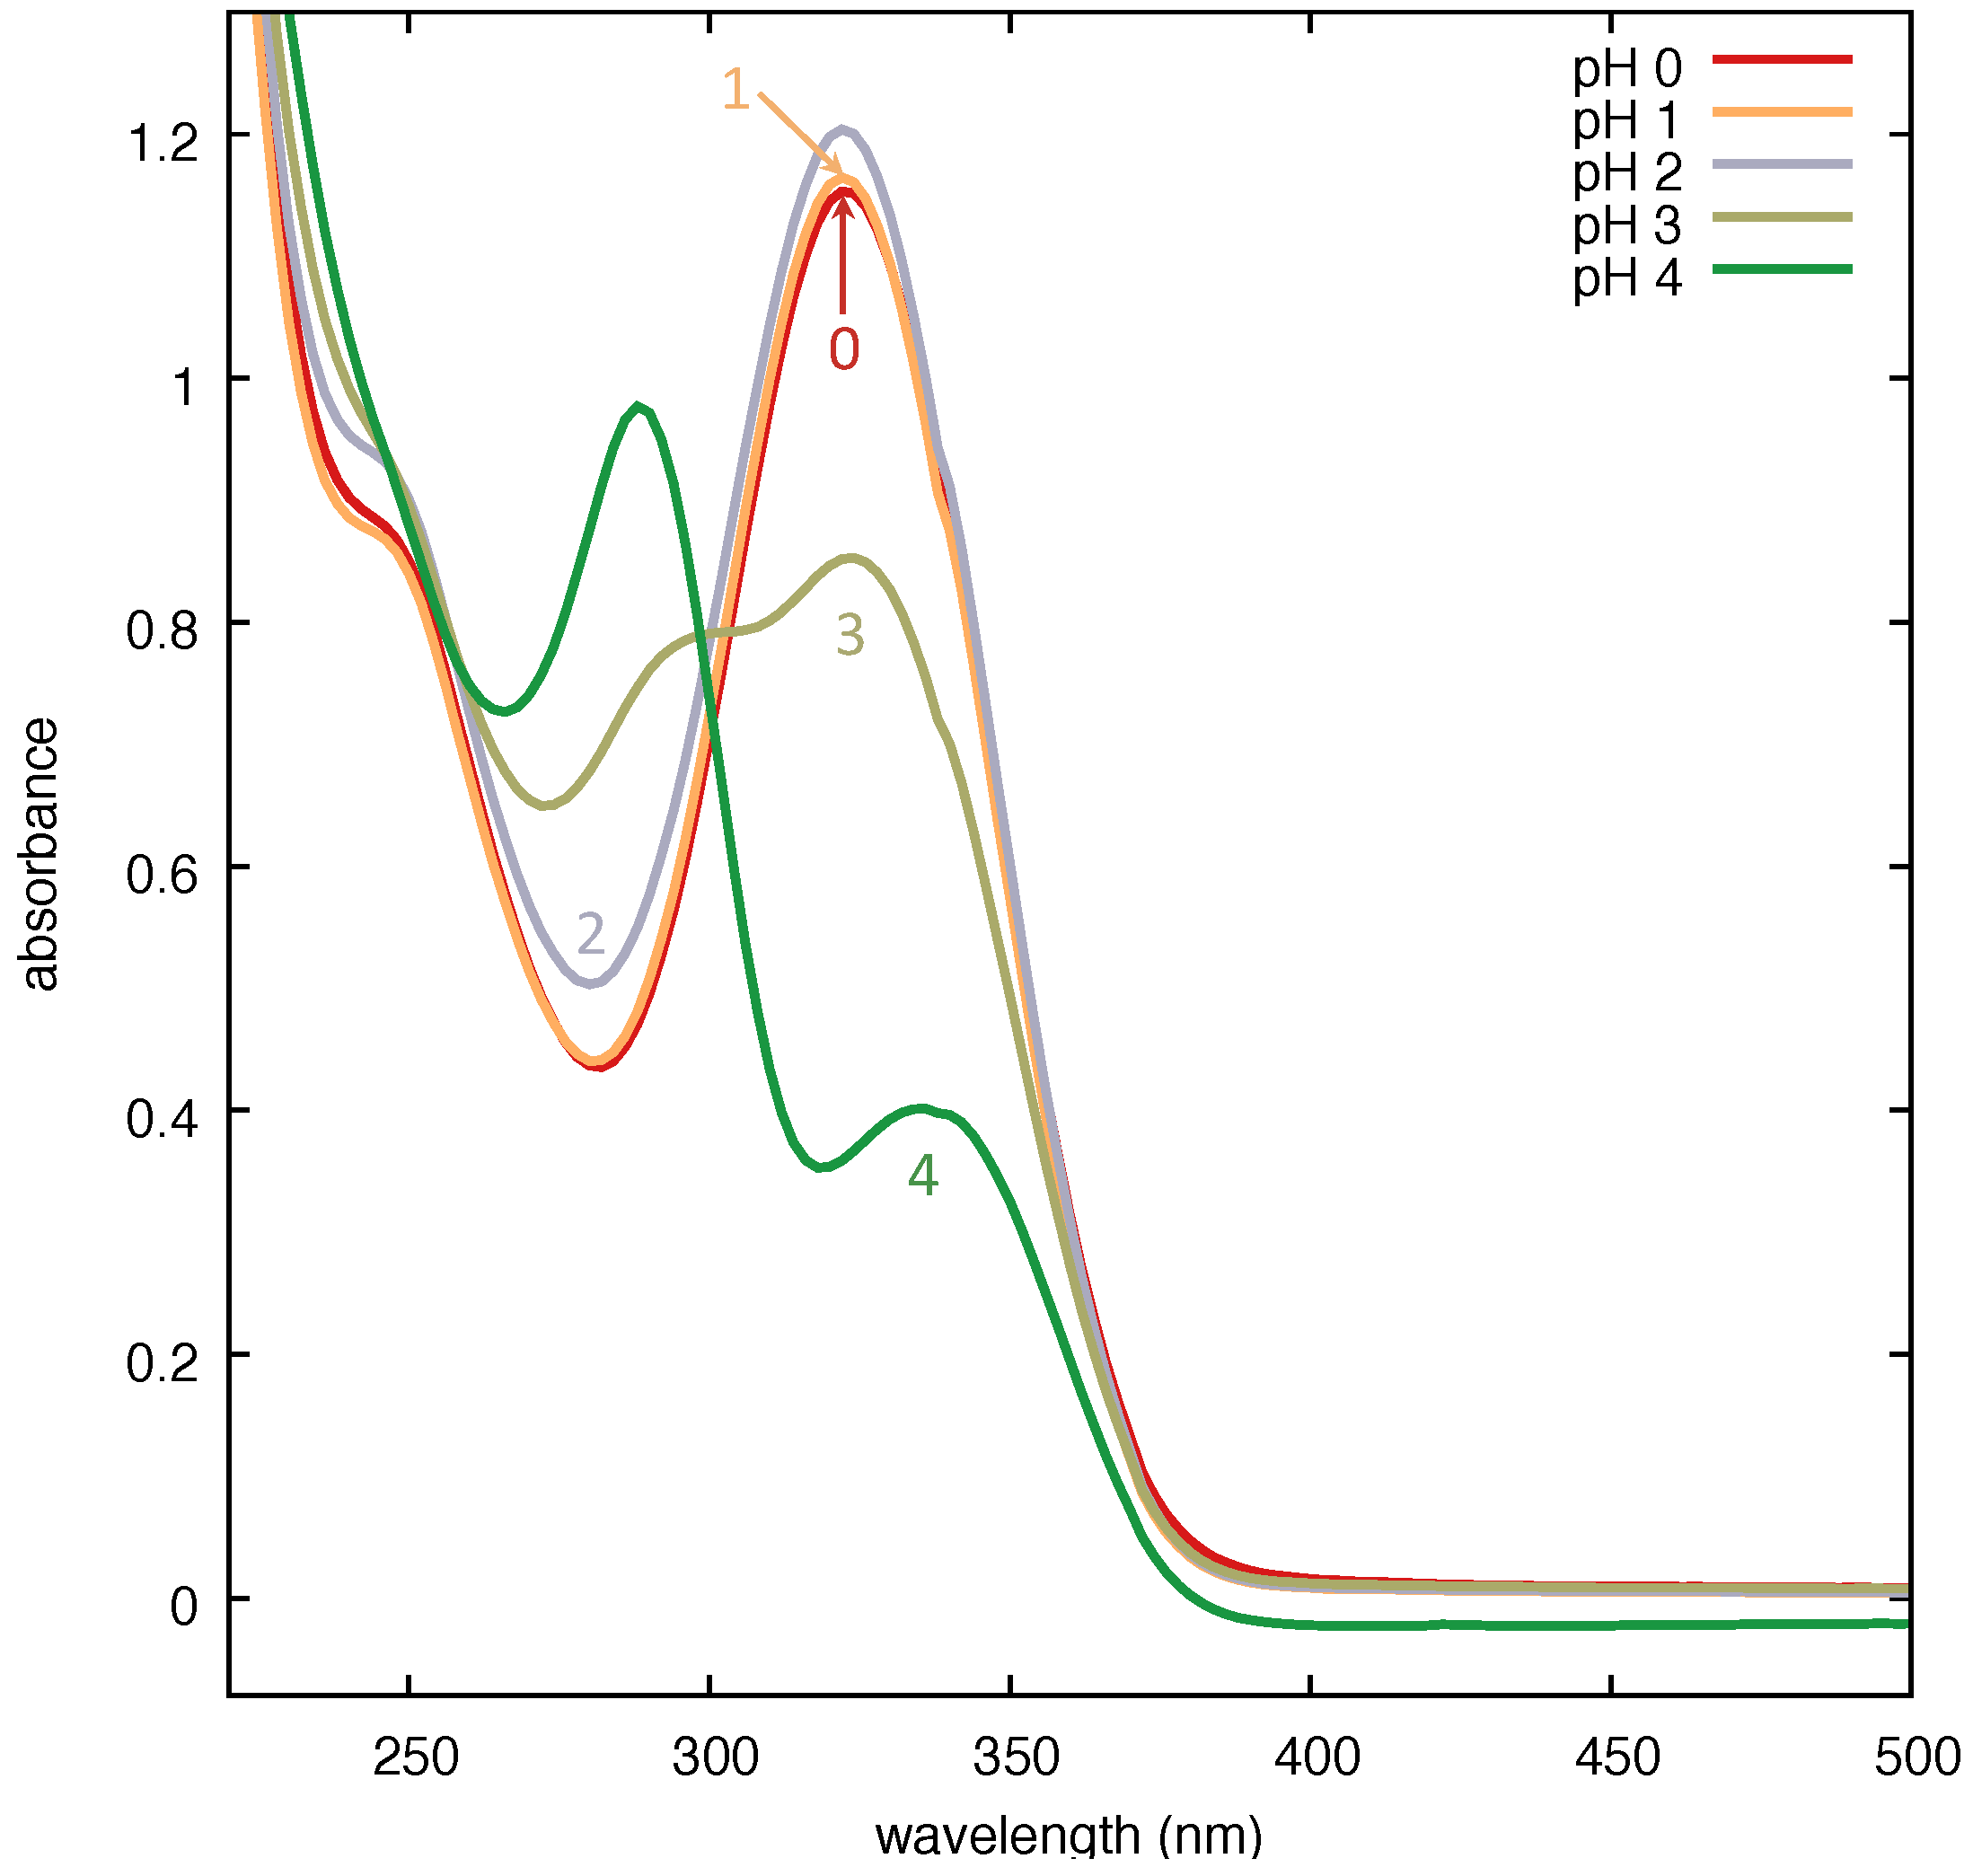
In
Figure 10, we show that the absorbance of PER displays a systematic dependence on the pH of the solution. The protonation process appears to start at pH 3, and is achieved at pH 2 (and lower). We tested the SERS performance of the Ag substrate on the aqueous solution of protonated PER at pH 2. We prepared a 3 × 10
−4 M aqueous solution of PER by mixing a suitable amount of a concentrated methanol solution of PER in water acidified with a mixture of HCl and H
2SO
4 in a 1:9 molar ratio. This expedient allows for limiting the quantity of Cl
− in the solution. Indeed, we verified that excessive amounts of Cl
− lead to the preferential formation of Ag-Cl surface bonds. The pH was checked before adding PER. The SERS spectrum was recorded with 458 nm excitation wavelength through a 50× microscope objective (NA = 0.75) at the solid–liquid interface formed by the solution droplet on the substrate, with 20 s exposure time (2 averages) and a laser power at the sample of 10 mW, on a spot area of 1 μm in diameter.
In
Figure 11, the SERS spectrum is compared with the Raman spectrum of solid PER, as received (laser excitation 785 nm). We observe that our early attempts to take SERS from
neutral PER solutions failed. Remarkably, many of the major Raman features of solid PER appear in the SERS spectrum of an
acidic PER solution (
Figure 11). In particular, the following SERS lines of PER can be observed with a good signal to noise ratio: 666, 830, 877, 1000, 1018, 1158 (broad), 1225, 1279, 1394, 1447, 1483, 1514, 1599, 2231 cm
−1. Most of these lines match with those recently measured for protonated PER on Au substrates produced by PLA [
24], namely 670 (666, this work), 875 (877), 1000 (1000), 1135 (1158) cm
−1.
Based on Density Functional Theory calculations (DFT B3LYP/6-31G(d,p)) [
24], the principal Raman lines of PER can be assigned as in
Table 2. The additional SERS lines of PER which can be detected with the Ag substrate produced by PLAL in this work are the following: 830, 1018, 1225, 1279, 1394, 1447, 1483, 1514, 1599, 2231 cm
−1 (see
Table 2 for details). Among these SERS signals, those assigned to a collective in-plane C-H bending, coupled with collective ring deformations, can be considered as a fingerprint of PER. These SERS signals find their correspondence in the Raman spectrum of the solid (1436, 1478, 1549, 1569, 1598, 1619 cm
−1). The changes in relative intensity and the slight wavenumber shifts can be explained by the fact that SERS features belong to the protonated PER, whereas the Raman spectrum was recorded on the neutral species.
Notably, the weak C=O stretching peak of solid PER (1658 cm−1) disappears in the SERS spectrum of protonated PER. We deduce that the protonation of PER most likely occurs on the carbonyl.

 ,
, 


