Article

Pulsed Laser Fabrication of TiO2 Buffer Layers for Dye Sensitized Solar Cells

1
Department of Physics, Ovidius University of Constanța, Constanța 900527, Romania
2
National Institute for Lasers, Plasma and Radiation Physics, P.O. Box MG-36, Măgurele 077125, Romania
3
National Institute of Materials Physics, P.O. Box MG-7, Măgurele 077125, Romania
*
Authors to whom correspondence should be addressed.
Nanomaterials 2019, 9(5), 746; https://doi.org/10.3390/nano9050746
Submission received: 25 April 2019 / Revised: 3 May 2019 / Accepted: 6 May 2019 / Published: 15 May 2019
(This article belongs to the Special Issue Synthesis and Modification of Nanostructured Thin Films)

Abstract

:
We report on the fabrication of dye-sensitized solar cells with a TiO2 buffer layer between the transparent conductive oxide substrate and the mesoporous TiO2 film, in order to improve the photovoltaic conversion efficiency of the device. The buffer layer was fabricated by pulsed laser deposition whereas the mesoporous film by the doctor blade method, using TiO2 paste obtained by the sol–gel technique. The buffer layer was deposited in either oxygen (10 Pa and 50 Pa) or argon (10 Pa and 50 Pa) onto transparent conducting oxide glass kept at room temperature. The cross-section scanning electron microscopy image showed differences in layer morphology and thickness, depending on the deposition conditions. Transmission electron microscopy studies of the TiO2 buffer layers indicated that films consisted of grains with typical diameters of 10 nm to 30 nm. We found that the photovoltaic conversion efficiencies, determined under standard air mass 1.5 global (AM 1.5G) conditions, of the solar cells with a buffer layer are more than two times larger than those of the standard cells. The best performance was reached for buffer layers deposited at 10 Pa O2. We discuss the processes that take place in the device and emphasize the role of the brush-like buffer layer in the performance increase.

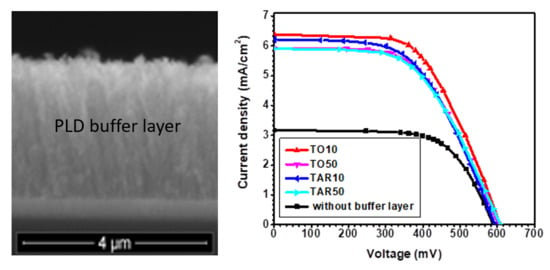
Graphical Abstract

1. Introduction

Dye-sensitized solar cell technology continues to be a key technological domain as it allows for the production of low-cost energy from renewable sources [1], particularly under ambient lighting [2]. Dye-sensitized solar cells (DSSC) are photovoltaic devices consisting of a photoelectrode with a mesoporous layer of a nanocrystalline wide band gap semiconductor (such as anatase TiO2) on transparent conducting oxide, sensitized with a dye, and a counter electrode, for example platinized conductive glass, with a liquid or solid state electrolyte in-between [3,4]. The working principle of the device is based on light absorption in the dye, followed by transfer of the resulting photoelectrons from the excited level of the dye into the conduction band of TiO2. The electron diffuses via the semiconductor to the conducting glass substrate, passes through the external circuit and is carried by the redox electrolyte from the counter electrode back to the dye, to regenerate it [5].
For DSSCs with iodide/triiodide electrolyte, conversion efficiencies, in standard air mass 1.5 global (AM 1.5G) conditions, of more than 11% have been obtained using Ru(II)-polypyridyl complexes [6,7], which are widely used dyes in the photovoltaic devices [8,9]. More recently, by using porphyrin dyes, the efficiency reached 11.5% [10] and by replacing the iodine electrolyte with cobalt based complexes the efficiency went up to 12% [11]. Even higher performance was reported when using organic silyl-anchor dyes [12]. The use of perovskite light absorbers and organic hole conductors in a solid state cell resulted in efficiencies larger than 15% [13], which was subsequently further increased by design changes away from the DSSC structure to more than 22% [14].
Current studies dedicated to the mechanism of charge transport in DSSC have indicated that progress can be achieved through understanding and controlling the secondary processes inside cell. It has been found [15,16,17,18,19,20,21] that the cell performance is enhanced when employing an intermediate nanocrystalline layer of TiO2 between the transparent conducting glass substrate (FTO—fluorine-doped tin oxide) and the mesoporous TiO2 semiconductor. The buffer layer has the role to ensure a good mechanical contact, as well as to protect the electrodes against the dye solution action and the oxidation at high temperature and to reduce the recombination of electrons at the electrode/electrolyte interface.
A compact TiO2 layer on the conductive glass substrate can be prepared by different methods. Examples are electrochemical deposition [22,23], spray pyrolysis [24,25,26], screen printing [26,27,28], sol–gel [15,29,30], sputtering [31,32,33,34], chemical vapor deposition [35], atomic layer deposition [36,37,38], dip coating [39], spin coating [21,40], etc. It has been argued that the buffer layer prevents the back transfer of electrons from the conductive substrate to the electrolyte, leading to an increase in the DSSC conversion efficiency. For that reason the thin compact buffer film of TiO2 was also called a blocking layer. The range of the efficiency enhancement is wide, reports claiming 20% in the case of the sol–gel method [29], from 15–20% [32] up to 80% [34] for sputtering, almost 30% when mixing exfoliated titania nanosheets with anatase TiO2 nanoparticles [41].
In contrast with the numerous reports on TiO2 blocking layers obtained by the methods just mentioned, pulsed laser deposition (PLD) was less used for the preparation of buffer layers. An early report claimed about 4% efficiency increase when using pure TiO2 and more than 21% for Nb-doped TiO2 [42], whereas a later one indicated 42% efficiency enhancement [43].
In our study, we present the photovoltaic performance of DSSC devices fabricated with buffer layers obtained by PLD, to take advantage of the good adherence and the control of stoichiometry, crystallinity and purity of ablated materials. These benefits have attracted considerable interest during the last years for synthesizing high quality oxide thin films by PLD [44,45]. Moreover, the number and/or intensity of the laser pulses used for ablation, allow for the accurate control of the deposition rate [46], making it a unique method for obtaining oxide semiconductor nanostructures for DSSCs. The PLD TiO2 compact film was deposited onto FTO to generate a barrier between the conducting oxide and the mesoporous TiO2 layer prepared by the sol–gel method. We report on the characterization of the TiO2 buffer interlayers fabricated by PLD in either oxygen or argon on FTO glass substrates kept at room temperature. We also studied the influence of the buffer layer on the photoelectron conversion process and the performance of DSSCs.

2. Materials and Methods

2.1. Solar Cell Fabrication

Both electrodes were obtained starting from transparent conductive glass substrates, which consisted of soda lime glass sheets of 2.2 mm thickness, covered with a conductive layer of fluorine-doped tin oxide (SnO2:F; FTO) with a 7 Ω/square resistivity (available from Solaronix). Before the preparation of the electrodes, the conductive glass was ultrasonically cleaned for 15 min in acetone, ethanol and deionized water, respectively, to remove any impurities, and then blown dry with high purity nitrogen. The first step in the preparation of the photoelectrode was the ablation of the pure TiO2 target on clean FTO glasses, using an excimer laser source KrF* (λ = 248 nm, τFWHM = 25 ns). The thin films deposition was performed inside a stainless steel irradiation chamber at room temperature. The target was produced from homogeneous anatase TiO2 powder (Sigma-Aldrich Corp., St. Louis, MO, USA, 637,254, 99.7% purity) with nanoparticle sizes of less than 25 nm mixed in agate mortar grinder. The ground TiO2 powder was initially pressed at 5 MPa and after that sintered for 6 h at 1100 °C in air, with a heating/cooling ratio of 20 °C/min, to obtain compact pellets. The laser beam incidence angle onto the target surface was about 45° and the target-substrate separation distance was set at 4 cm. For the deposition of one film 3 × 10³ subsequent laser pulses were applied, succeeding to each other with a repetition rate of 2 Hz. The targets were irradiated with a laser fluence of 2 J/cm2.
The buffer layers were obtained at 10 Pa and 50 Pa, by circulating high purity (99.999%) oxygen or argon inside the irradiation chamber, with the aid of a calibrated inlet. The dynamic pressure was monitored with an MKS 100 controller. The samples were labeled TO and TAR for layers deposited in oxygen or argon, respectively, and with two extra digits indicating the pressure, in Pa.
The electrodes obtained with a buffer layer under oxygen and argon atmosphere were used to further fabricate DSSC devices. The active layer was fabricated using a TiO2 paste prepared by the Pechini type sol–gel method [47], starting from a polyester-based titanium sol. The sol contained a mixture of precursor with molar ratio of 1:4:16 [Ti(iOPr)4:citric acid:ethylene glycol]. The paste was obtained by grinding in a mortar the nanocrystalline anatase TiO2 powder (Sigma-Aldrich Corp., St. Louis, MO, USA, 637,254). The sol–gel solution had 7:1 molar ratio between TiO2 and titanium (IV) isopropoxide [Ti(iOPr)4] (Sigma-Aldrich Corp., St. Louis, MO, USA) [48,49]. The paste was spread on the TiO2 buffer layer by the ‘doctor-blade’ technique. TiO2 films were annealed at 450 °C for 1 h in air and left until cooling to room temperature [18].
The last step in the preparation of the photoelectrodes was the sensitization of the mesoporous film of nanocrystalline TiO2 grains with the N719 (Ruthenium 535-bisTBA) dye, cis-diisothiocyanato-bis(2,20-bipyridyl-4,40-carboxylato) ruthenium(II) bis (tetrabutylammonium) [50] (from Solaronix S.A., Aubonne, Switzerland). The photoelectrodes were immersed in the dye solution (0.2 mM in absolute ethanol) at a temperature of 80 °C for 2 h, then rinsed with absolute ethanol and dried in the oven at 80 °C for 10 min.
The counter electrodes were obtained by spreading a few drops of Platisol T (Solaronix) onto the FTO and drying at 450 °C for 10 min. Both types of electrodes were stored in desiccators before use. The DSSCs were assembled by pressing the photoelectrode against the counterelectrode with small bulldog clips [51,52]. Finally, the electrolyte (Iodolyte Z-50, from Solaronix S.A., Aubonne, Switzerland) was injected between the electrodes filling up the space by capillary action.

2.2. Measurements

X-ray diffraction (XRD) was used to assess the structural properties of the samples and identify the crystalline phases. The XRD measurements were performed in Bragg-Brentano geometry with a D8 Advance diffractometer (Bruker Corp., Billerica, MA, USA), equipped with CuKα (λ = 1.5418 Å) radiation and a high efficiency one-dimensional LynxEye™ detector operated in integration mode. The patterns were recorded in the 2θ range 20°–60°, using a step size of 0.04° and a time per step of 5 s.
The surface morphology of samples was investigated by scanning electron microscopy (SEM) using a Inspect S electron microscope (FEI Co., Hillsboro, OR, USA). The SEM measurements were performed in high vacuum, at 20 kV acceleration voltage, using the secondary electrons acquisition mode. Before the SEM examination, a thin Au film was applied to coat the samples to prevent the electrical charging. The film uniformity and thickness were estimated based on cross-section SEM micrographs. The chemical analyses of the TiO2 films were carried out by means of energy dispersive spectroscopy (EDS). Additionally, transmission electron microscopy (TEM) examinations were conducted using a CM 120 ST microscope (Philips N.V., Amsterdam, The Netherlands), which operated at 120 kV and had a point-to-point resolution of 0.24 nm. The samples for the TEM investigation were dispersed in ethylic alcohol and collected on 300 mesh coated grids [53,54].
The optical transmission properties were analyzed with a Cintra 10e UV-Vis spectrophotometer (GBC Scientific Equipment Pty Ltd., Braeside VIC, Australia), in the range 300–1200 nm. The electro-optic parameters of the devices, particularly the fill factor (FF), the photovoltaic conversion efficiency (η), the short circuit current (ISC) and the open circuit voltage (VOC), were measured using a home-made small area solar simulator [55], which provided AM 1.5G standard irradiation conditions. The solar simulator illuminated the surface of the DSSCs through a circular slit of 10 mm diameter, such that the area exposed to light was of about 0.785 cm2. The measurement of current and voltage was performed using two digital MS8050 multimeters (Mastech Group International Ltd., Hong Kong, China) and a precision decade resistance box. The measurements were carried out by changing the load resistance, at intervals of about 45 s, which allowed enough time for stable reading.

3. Results

At visual inspection, PLD TiO2 films were uniform, and adherent (even at edges). TO10 and TAR10 films were compact, completely transparent, with rainbow reflection in daylight. TO50 films were faintly translucent, exhibiting a surface with porous aspect, whilst TAR50 films were slightly smoky, but compact.
Top-view SEM investigations of the TiO2 layer deposited on FTO (Figure 1a) revealed nanoparticles with homogeneous shape and size dimension, in agreement with previous studies [56,57,58]. The buffer-layers display a brush-like compact structure consisting of TiO2 nanobars (Figure 1). The cross-section SEM images allowed the estimation of the layer thickness, as shown in Table 1. The samples obtained by low pressure PLD are systematically thinner than those deposited under higher pressure. One possible explanation may be that at higher pressure, due to multiple collisions with atoms/molecules of the gas, the ablated species lose more of their kinetic energy, resulting in a more confined plasma plume and the growth of larger nanobars.
The top-view and cross-view SEM images of the deposited TiO2 layer pointed to a mesoporous morphology (Figure 2). The EDS spectrum demonstrated that no additional elements were present in the mesoporous layer, except for carbon, which often contaminates the surface of samples kept in air. Carbon was not taken into account in the quantification of the atomic number, absorption and fluorescence (ZAF) corrections.
The XRD patterns of the mesoporous TiO2 film, and the buffer layers are given in Figure 3. Except for the TAR50 sample, which seemed amorphous, all other layers suggested a monophasic structure, exhibiting the maxima only of TiO2-anatase (ICDD: 00-021-1272). This phase is characteristic to PLD films annealed at 450 °C [23], along with the peaks of the electrode substrate layer (SnO2, ICDD:01-077-0452), which covers the glass substrates. No texturing of the anatase films was noticed. However, in the case of the FTO layer, a clear texturing in the (200) crystalline direction was evident. This FTO peak was superimposing, in the case of the mesoporous film, or even obscuring the (004) line of anatase, in the buffer layer samples.
In the case of the TAR50 sample no TiO2 peaks were evidenced, thus suggesting the amorphous status of these films. TAR50 samples were amorphous likely because at high pressure the velocity of the ablated species significantly decreased due to the collisions with “huge” Ar atoms. Accordingly, the energy necessary for the nucleation of crystals was significantly reduced in the case of these films.
A simple attenuation calculus for the anatase phase, at the Cu Ka energy, based upon a hypothetical density of ~4 g/cm3, indicated that the X-ray beam scattered at 2θ ≈ 25.3° would be totally attenuated by a dense film with a thickness in excess of 5 μm. The average crystal coherence length, as estimated via Scherrer equation, is collected in Table 2. The crystal coherence length of the anatase coatings was estimated from the full width at half maximum (FWHM) of the (101) diffraction line. The instrumental broadening of the diffraction line was corrected using a CeO2 highly crystalline laboratory control. We note that Scherrer equation assumes a negligible contribution of the lattice strain to the peak broadening.
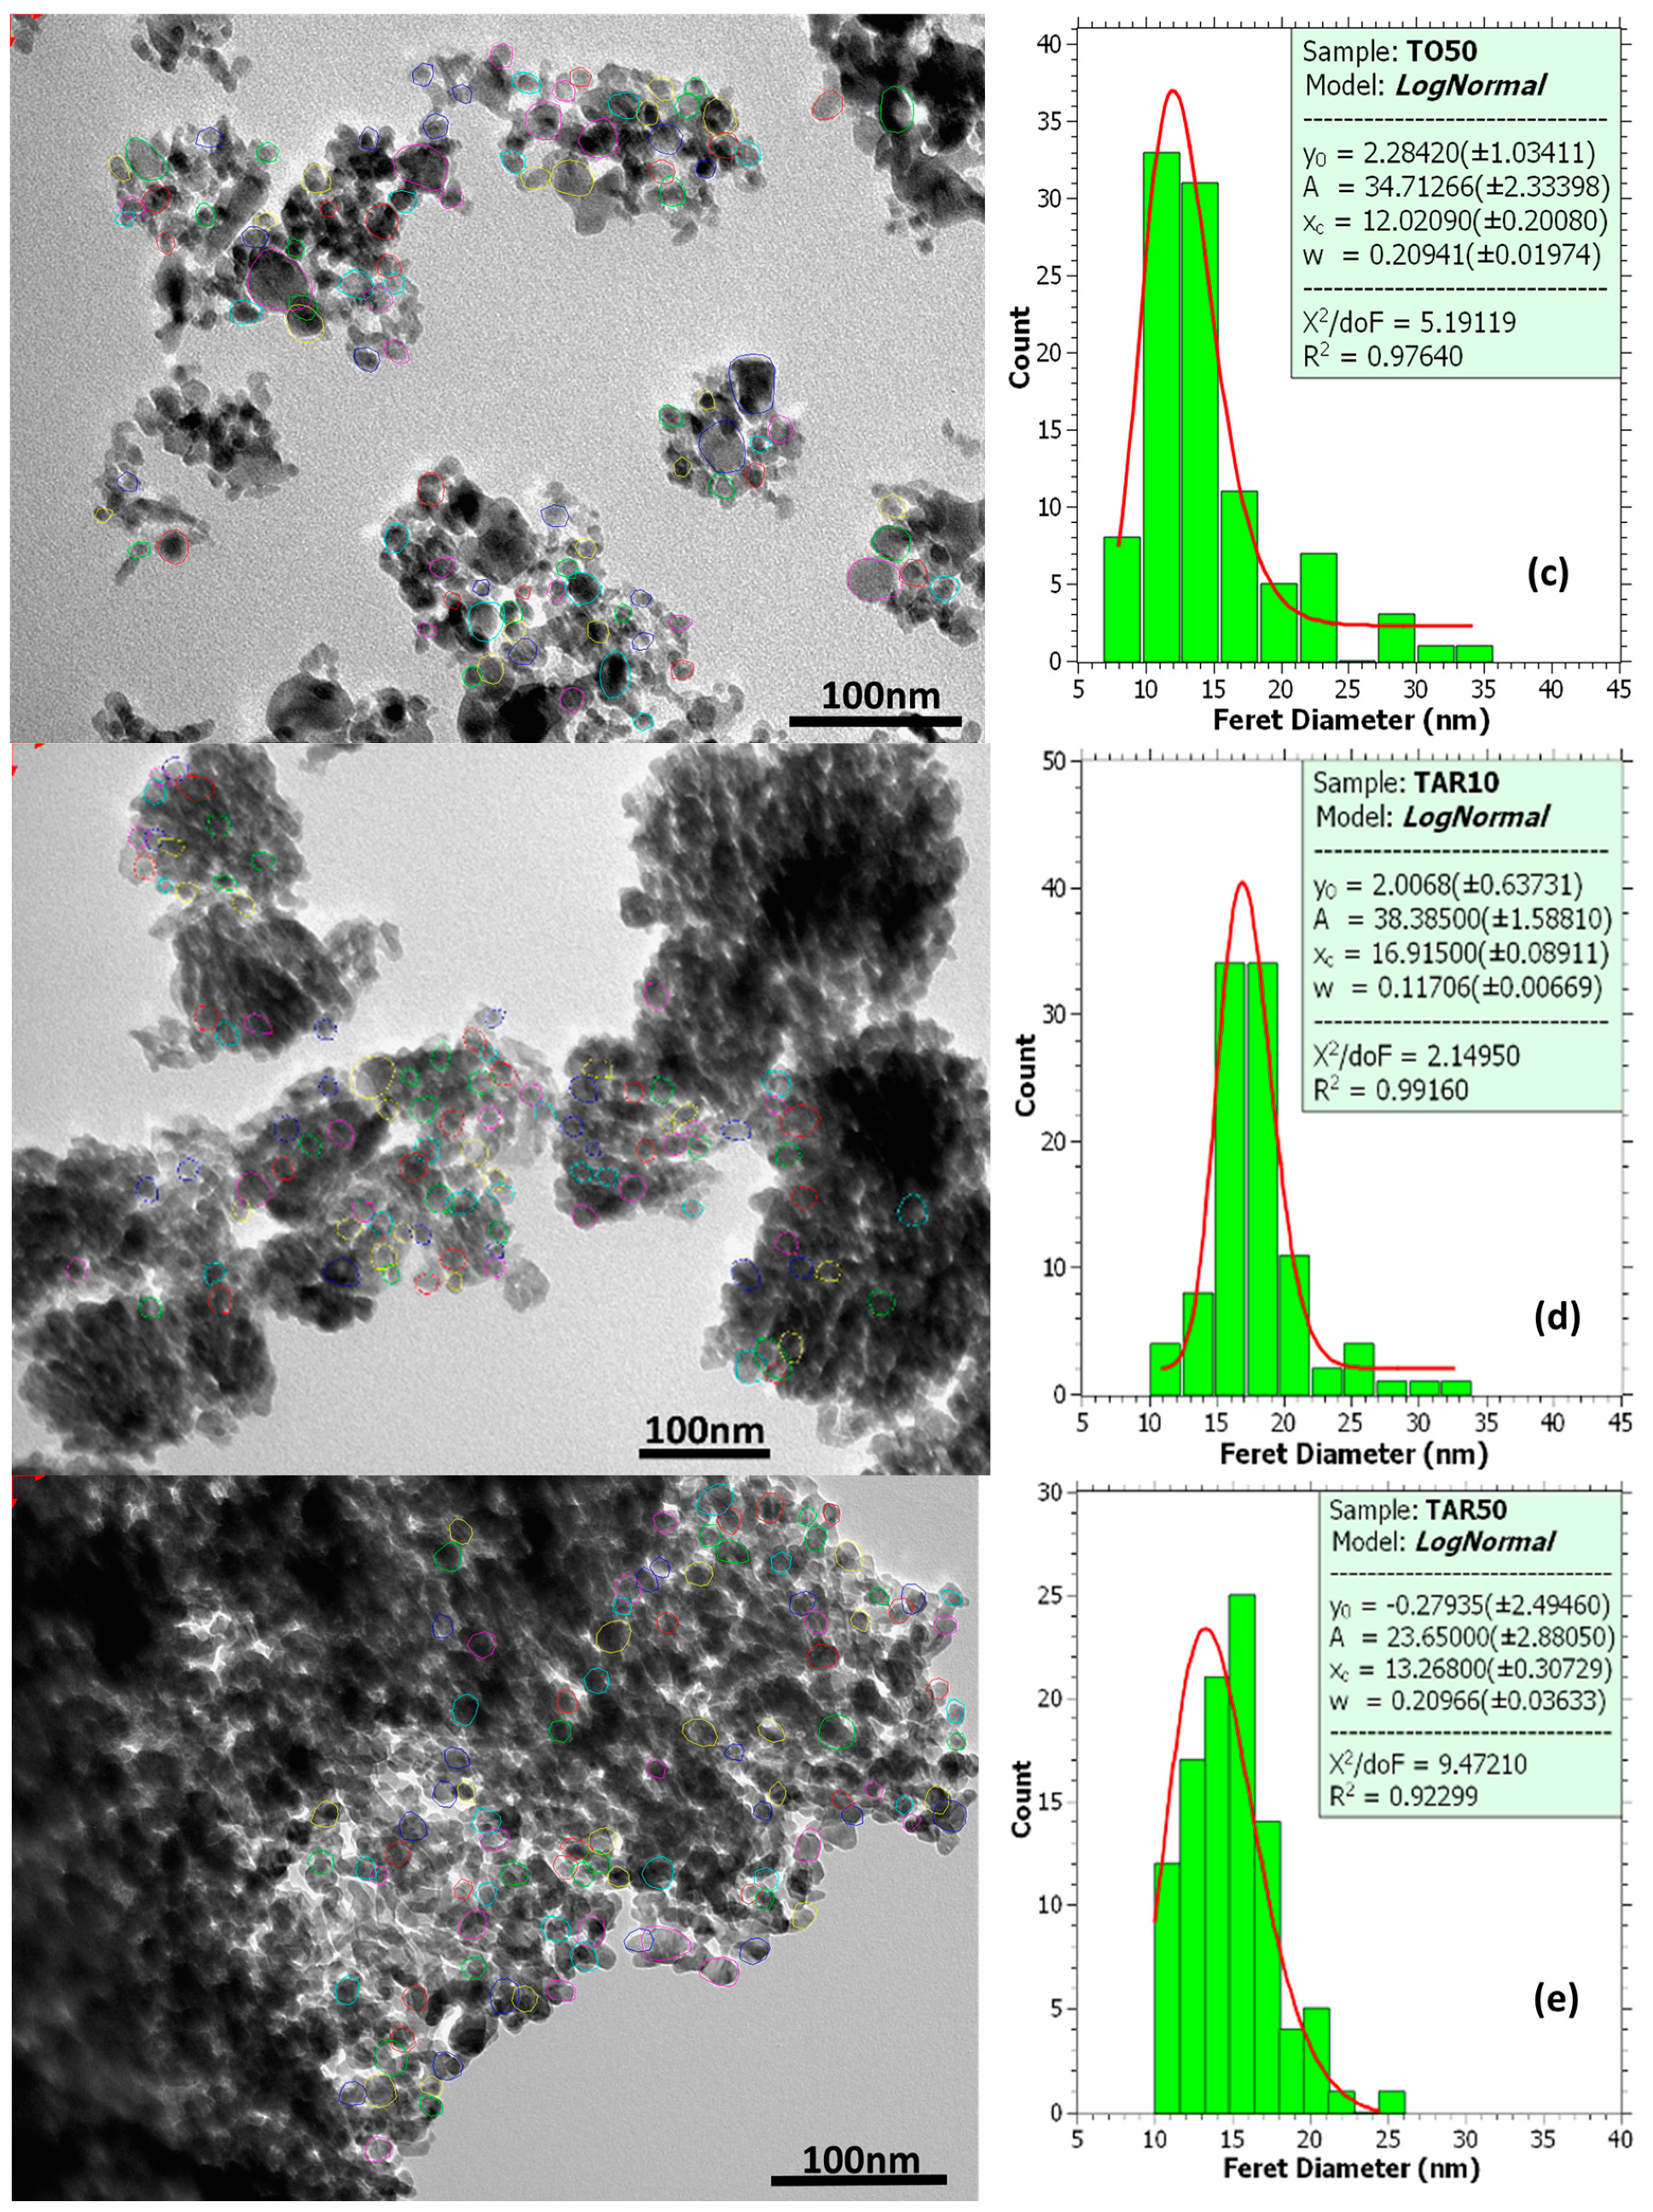
TEM images, along with grain size histograms (lognormal fitted), for mesoporous TiO2 films and PLD TiO2 buffer layers are shown in Figure 4. The TEM specimens were prepared by detaching fragments from the film onto the grid [31]. The grains were identified manually with the Olympus Soft Imaging Solutions GmbH, Münster, Germany iTEM TEM imaging platform. The grain sizes were distributed between 10 nm and 30 nm, with the average grain size, reported in Table 2, in the range of 12–17 nm. Although these values are smaller than those inferred by XRD studies, the different results obtained by the two methods are not incompatible. In the case of the XRD estimations the use of a single well-defined peak is a limitation, whereas in the case of the TEM assessments, the use of a particular sample area and of a finite number of grains influence the accuracy of the grain size distribution function. Within the limits of validity of the approximations used and the corresponding error bars of the two independent estimations, we suggest that, overall, the results were consistent.
Figure 5 presents the selected area electron diffraction (SAED) profiles extracted from the SAED patterns (see Supplementary Materials). For the mesoporous TiO2 film, Figure 5 reveals strong signature peaks of the anatase phase, particularly for the (101) plane. Other noticeable peaks were indicative of the (004) and (200) planes. In contrast, the TO10 and TAR10 samples showed much lower intensity peaks, which could still be associated with the anatase phase of TiO2, although the presence of the rutile phase cannot be excluded. Intermediate intensity peaks were present in the spectrum of TO50, pointing to the existence of wide crystallinity regions, with only small amorphous phase contributions. A clear mixture of anatase and rutile phases was noticeable in the TAR50 spectrum, particularly for the (110) plane of the rutile structure. For the TAR50 samples, the SAED and RDF data suggested the presence of crystalline regions along with the amorphous phase, in contrast to the XRD patterns. The differences may be caused by the irregularities of the samples, because TEM investigates a particular area of the sample whereas XRD provides a global perspective.
Figure 6 displays a typical high-resolution transmission electron microscopy (HRTEM) image of a TO10 sample with an inset showing the fast Fourier transform (FFT) power spectrum of a specific sample area. By indexing the FFT spectrum one obtains interplanar distances of 0.359 nm assigned to the (101) lattice plane reflections of the tetragonal anatase TiO2 phase. The anatase phase nanocrystallites could be also identified from the 0.359 nm lattice fringes visible in the HRTEM image.
The UV/Vis transmission spectra of the TiO2 buffer layers obtained by PLD on FTO glass substrate are presented in Figure 7. It can be seen that the average transmittance value, in the visible range, reached around 75–80%. The transmission of TO50 samples was slightly lower, likely due to their larger thickness.
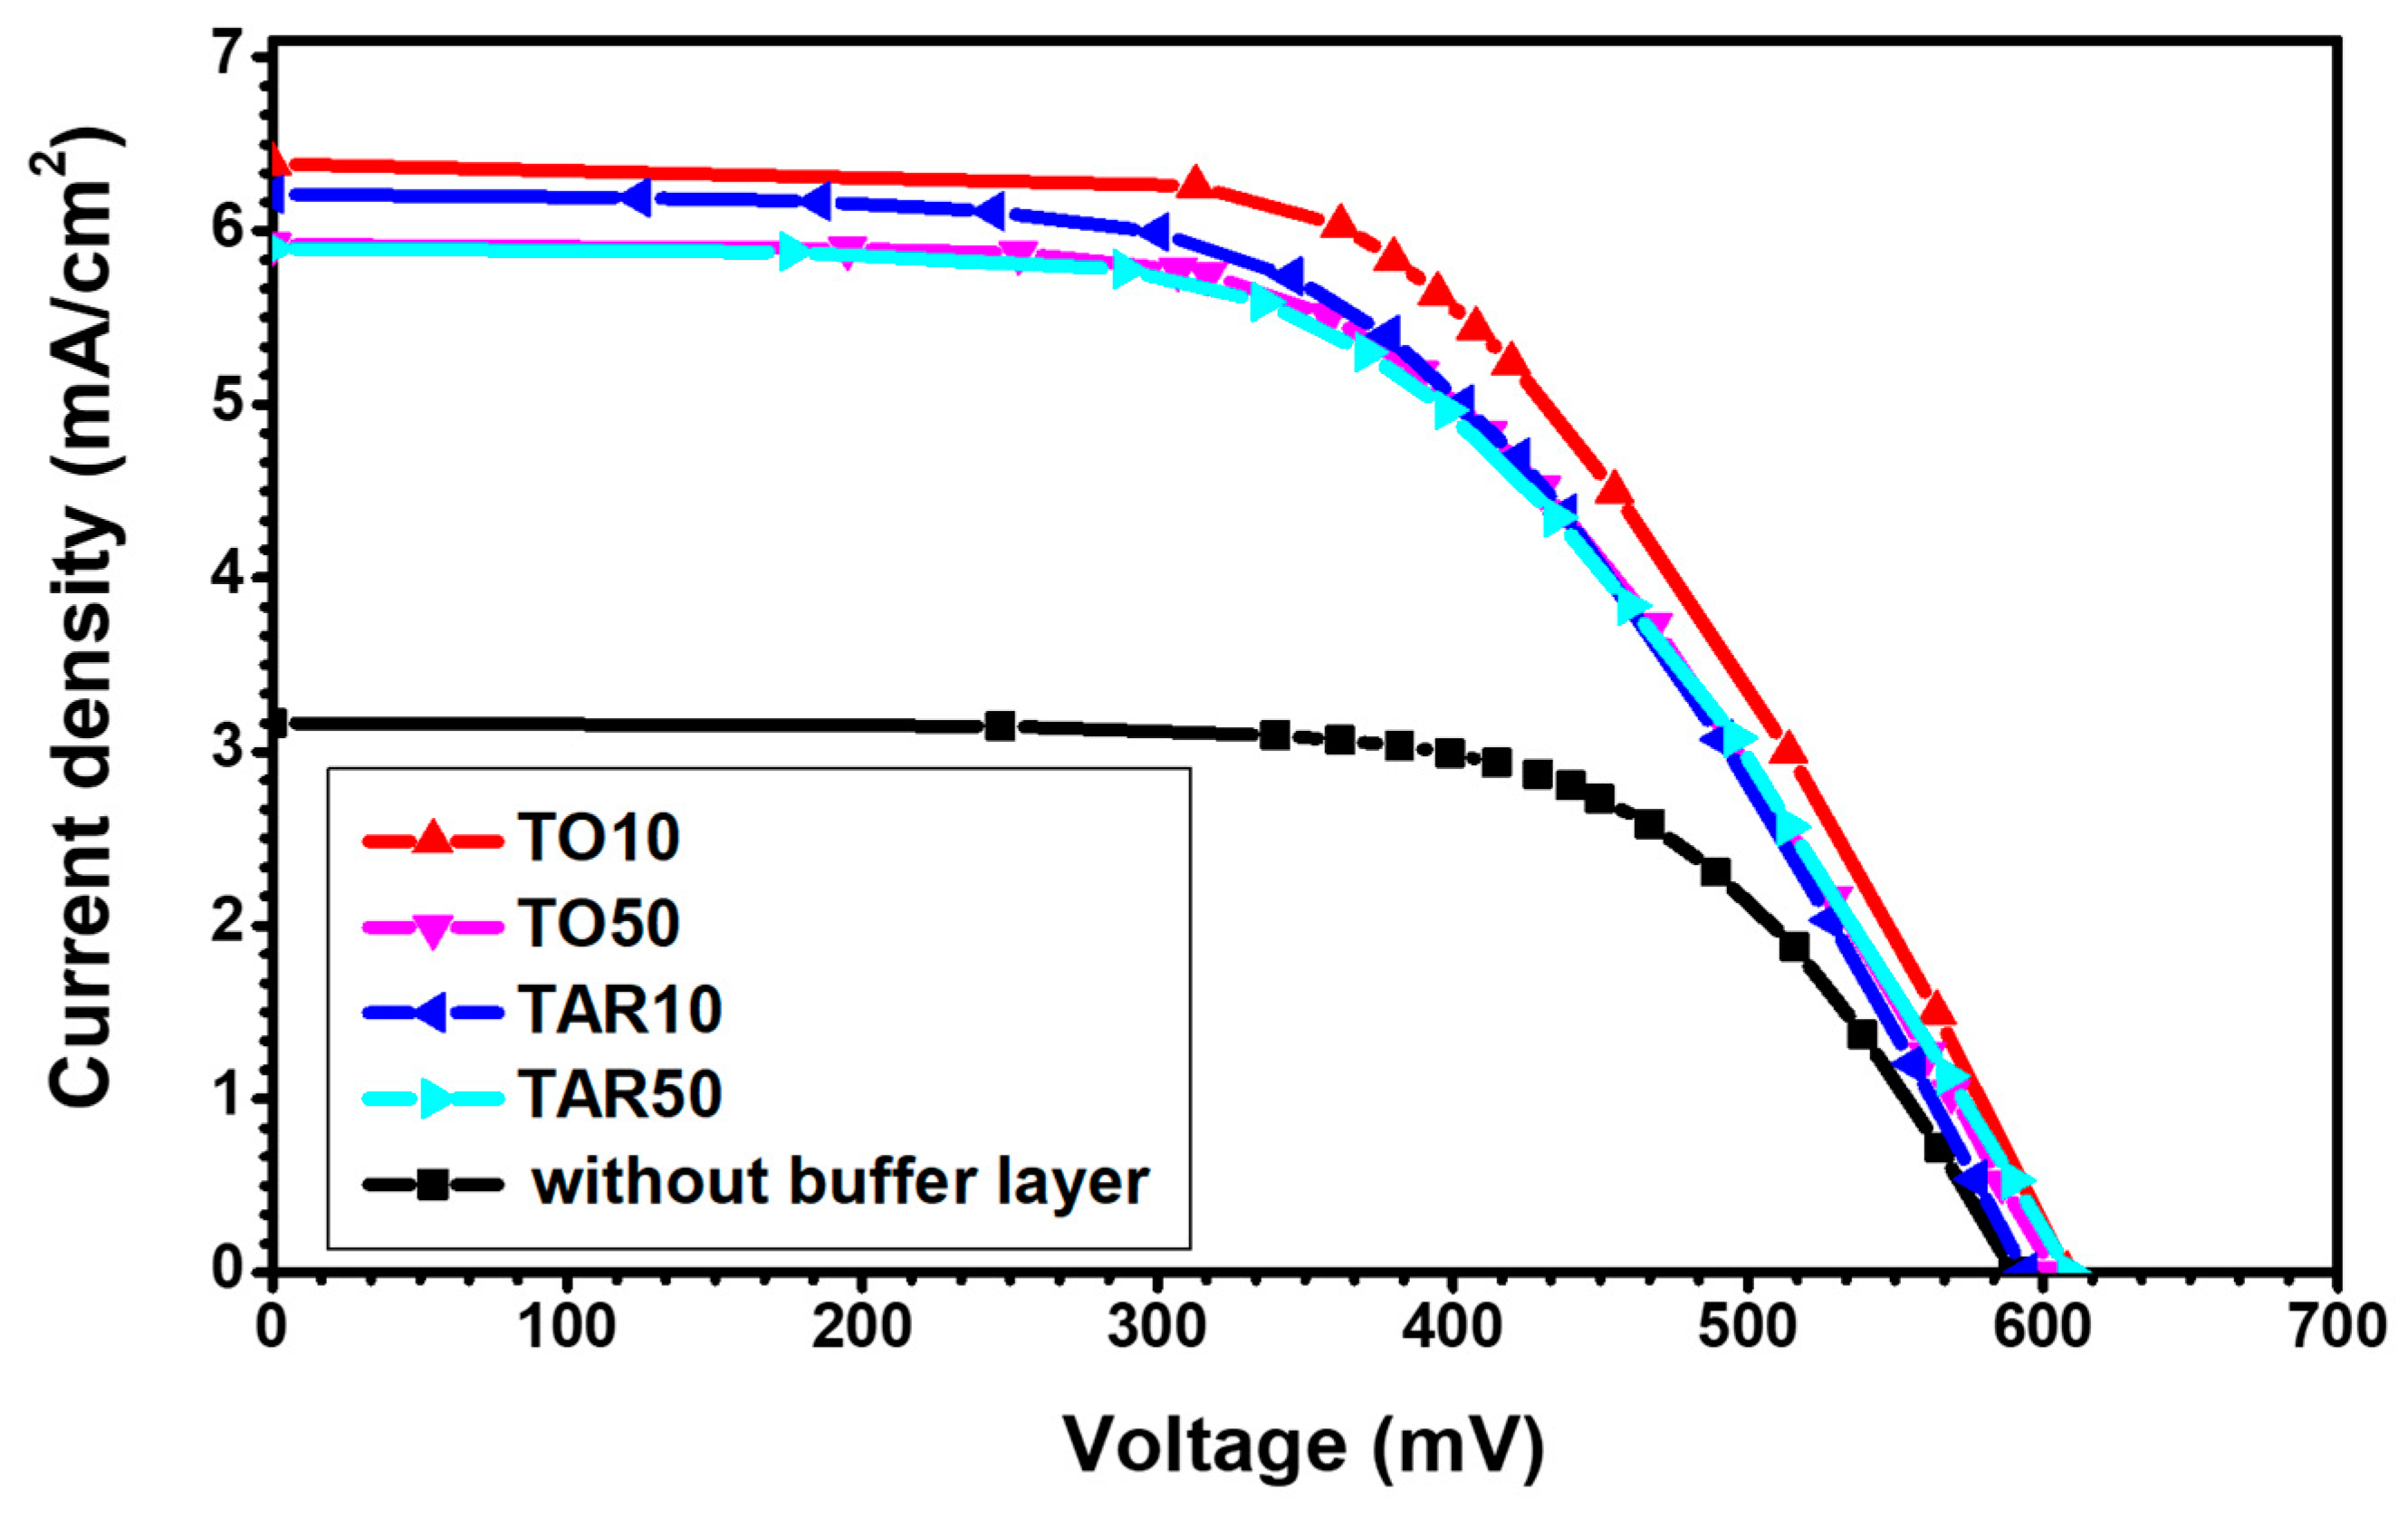
Table 3 displays the typical values of the key parameters of the DSSCs fabricated using photo-electrodes with various PLD buffer layers, determined by electro-optical measurements. The I-V curves for a few selected cases are illustrated in Figure 8. For comparison, we provided values for the case of a DSSC without a buffer layer.
One remark is that the photovoltaic conversion efficiency for solar cells fabricated with the buffer layer was more than twice larger than the efficiency of the devices with the mesoporous TiO2 film applied directly to the FTO. As the open-circuit voltage was about the same, crucial in determining the significantly higher efficiency was the much larger short-circuit current density. By introducing a buffer layer we obtained a substantial increase of the short circuit current density, Jsc, from 3.166 mA/cm2 for cells without buffer layer to 8.136 for TO10.
The fill factor was within the typical range of solar cells 0.5 to 0.8, although closer to the lower rather than the higher limit. As the highest value was reached for the device without a buffer layer, an analysis of the device losses is necessary.

4. Discussion

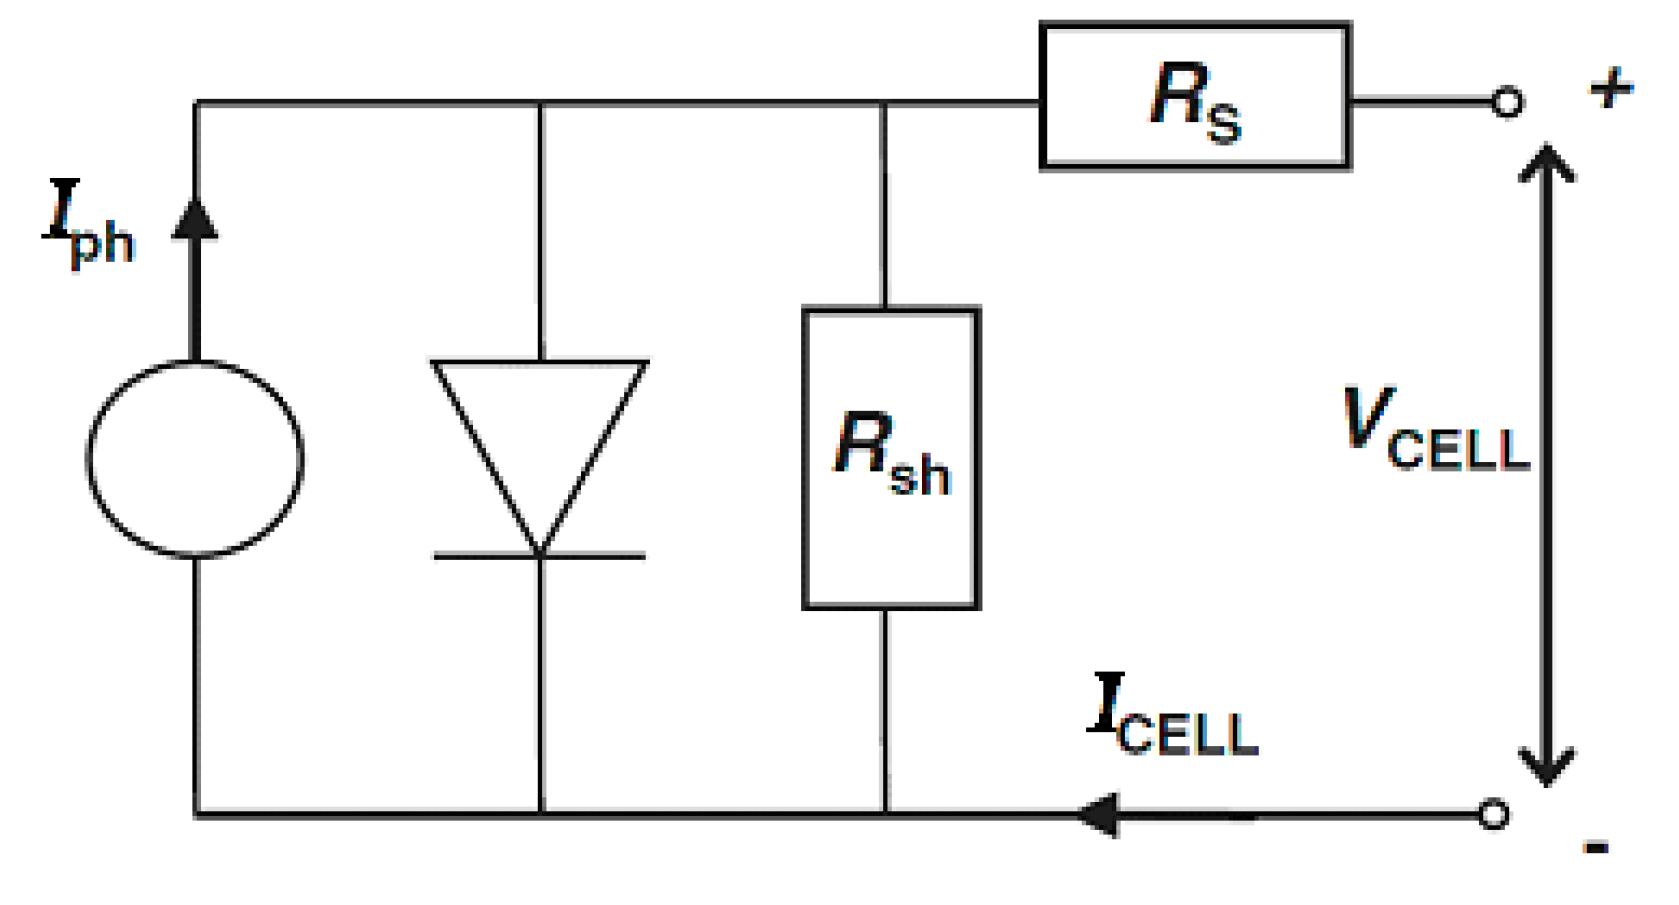
The efficiency of solar cells was affected by the losses due to parallel (shunt) resistance (Rsh) and series resistance (Rs), as shown in Figure 9. The equivalent circuit of a solar cell allows us to infer through Equation (1) a relation between the current and the voltage of the cell (ICELL, VCELL), as a function of Iph, the photocurrent density, I0, the dark current (reverse saturation current of the diode), Rs and Rsh, the series and shunt resistances of the cell [63]. In Equation (1) T is the absolute cell temperature, m the diode ideality factor, kB, the Boltzmann constant and qe the electron charge.
I CELL = I ph I 0 ( e q e ( V CELL + I CELL R S ) m k B T 1 ) + V CELL + I CELL R s R sh
For an ideal cell, Rsh is infinite, whereas Rs is zero. In the I-V plot of the ideal cell, near the short-circuit point, the curve was roughly horizontal, indicating that the shunt resistance was high. Near the other important point, the open-circuit limit, the I-V curve was close to vertical, meaning that the series resistance was low.
When the shunt resistance is very high but the series resistance cannot be neglected, the third term in Equation (1) becomes negligible. In this case, close to the short-circuit point the curve is roughly horizontal, but near the open-circuit point the I-V curve is not vertical, suggesting significant series resistive losses in the cell. Therefore, the shape of the I-V curves in Figure 8 points to significant series losses.
Examining Table 1 and Table 3 we note that, for the buffer layer deposited in oxygen, Jsc decreased from 8.136 mA/cm2 to 7.907 mA/cm2, while for the buffer layer deposited in argon Jsc decreased from 7.537 mA/cm2 to 7.512 mA/cm2. Increasing the buffer layer thickness led to a decrease of Jsc, as the wider films have a lower transmission (seen in Figure 7), such that less photons reach the active mesoporous film, and fewer photoelectrons are generated. Moreover, the diffusion of the photoelectrons towards the FTO was hindered by thicker buffer layers.
Finally, the highest value of efficiency (2.83%) was reached for TO10, suggesting that the lower the pressure for the deposition of the buffer layer, the higher the performance of the final device is.
To understand these results one needs to examine the basic processes that occur in the DSSCs [64]. Processes such as charge injection into TiO2, charge diffusion to FTO and dye regeneration are desirable. In contrast, the nonradiative decay, the back transfer to dye and the charge interception by electrolyte are detrimental processes [64].
Our results suggest that the higher Jsc for the devices with the buffer layer is likely due to an increased charge transfer from the TiO2 mesoporous layer to the FTO, through the buffer layer (possibly caused by the superior conductivity of the brush-like nanobar structures shown in Figure 1). Another reason may be the decrease in charge loss through charge interception by the electrolyte (which does not get in contact with the fluorine-doped transparent oxide).
The lower fill factor indicates that the introduction of a buffer layer increases the series resistance, Rs. The large Rs was reflected in the deviation from verticality of the current-voltage curve near the open-circuit point (Figure 8). We suggest that a larger buffer layer thickness, meaning an increased length over which the charges should diffuse, hinders the electron flow and facilitates the charge interception.
We conclude that although the photovoltaic conversion efficiencies obtained in our study were relatively low compared to the existing records, the fact that the buffer layer more than doubles the performance should be emphasized, as it shows promise. It strengthens the opinion that PLD has much to offer in photovoltaics [46,65,66], making it a relevant method for improving the fabrication of TiO2-based DSSCs with superior conversion efficiency.

5. Conclusions

Our study aimed to increase DSSC performance by interposing an intermediary TiO2 buffer layer deposited by PLD. The hint was that an improved contact between the FTO and the mesoporous TiO2 film would minimize the resistive losses and increase the short circuit current density by preventing the electrolyte from getting in contact with the FTO.
The buffer layer was deposited in either ambient oxygen or argon at different pressures. The PLD films were comparatively analyzed by transmittance measurements and SEM, TEM and XRD investigations.
Top-view and cross-section SEM micrographs of the TO and TAR films revealed round particulates with homogeneous shape and size dimension. The low-pressure samples displayed thinner PLD layers, whereas the high pressure ones had longer TiO2 nanobars. The XRD analyses of TAR10, TO10 and TO50 samples evidenced a monophasic structure, exhibiting maxima only of TiO2-anatase. In the case of TAR50 samples no TiO2 peaks were observed, thus suggesting an amorphous structure.
TEM images with SAED patterns of the films have confirmed the anatase phase of TiO2. Moreover, the anatase phase has also been identified from the 0.359 nm lattice fringes, visible in the HRTEM images. TEM studies of TAR50 samples clearly indicated the presence of the rutile phase but also suggested a mixture of crystalline and amorphous regions.
Electro-optical measurements carried out, under standard AM 1.5G conditions, have shown that the insertion of a buffer layer at the interface of FTO/TiO2 led to photovoltaic conversion efficiencies more than two times larger than those of the standard cells. The best performance was recorded for buffer layers deposited in 10 Pa O2, which are characterized by an open circuit voltage, Voc as high as 608 mV and a short circuit current, Isc of 6.39 mA.
The processes that take place inside the device were discussed and the role of the brush-like buffer layer in the performance increase was emphasized. The higher Isc for the devices with the buffer layer is likely associated to an increased charge transfer from the TiO2 mesoporous layer to the FTO, through the buffer layer as well as to a decrease in charge loss due to charge interception by the electrolyte. The lower FF indicates that the introduction of a buffer layer increases the series resistance, Rs, due to an increased length over which the charges have to diffuse, hindering the electron flow and facilitating the charge interception.
The goal of the present study was to find the PLD parameters that optimize the performance of the DSSCs. The fact that the buffer layer more than doubled the performance is to be emphasized, as it shows promise. Despite the relatively low efficiency obtained, which indicates that the fabrication technology was not yet optimized, the increase reported here was significant and exceeds the enhancements of 15–80% stated for other techniques as well as that of up to 42% for the same method. Our results strengthen the opinion that PLD has much to offer in photovoltaics, making it an interesting method for obtaining oxide semiconductor nanostructures for DSSCs.
Finally, it should be noted that the long-term device performance is critical for applications. It would clearly verify the role of the intermediate TiO2 buffer layer on the good mechanical contact, protection of the electrodes against the dye solution action, oxidation at operating temperatures, as well as the reduced recombination of electrons at the electrode/electrolyte interface. Such studies, which require a long time, are underway and will be subject of a subsequent report.

Supplementary Materials

The following are available online at https://www.mdpi.com/2079-4991/9/5/746/s1, Figure S1: Selected area electron diffraction (SAED) patterns for the mesoporous TiO2 film (a), and the buffer layers: TO10 (b), TO50 (c), TAR10 (d), and TAR50 (e).

Author Contributions

Conceptualization: G.S., M.A.G. and I.N.M.; methodology: J.L., G.S., N.S., G.P.-P. and G.P.; validation: A.G., G.P., M.A.G. and I.N.M.; formal analysis: J.L., G.S., G.E.S. and G.P.; investigation: J.L., G.E.S., N.Ş., C.L. and A.G.; data curation: G.E.S. and C.L.; writing—original draft preparation: J.L.; writing—review and editing: G.P.-P., M.A.G. and I.N.M.; visualization: G.E.S. and G.P.-P.; supervision, G.S., M.A.G. and I.N.M.

Funding

This research was funded by the Romanian Ministry of Research and Innovation through the Core Programme—Contract LAPLAS VI 16N/08.02.2019.

Acknowledgments

The authors acknowledge useful discussions with Victor Ciupina and Corneliu I. Oprea.

Conflicts of Interest

The authors declare no conflict of interest.

References

  1. Gong, J.; Sumathy, K.; Qiao, Q.; Zhou, Z. Review on dye-sensitized solar cells (DSSCs): Advanced techniques and research trends. Ren. Sust. En. Rev. 2017, 68, 234–246. [Google Scholar] [CrossRef]
  2. Freitag, M.; Teuscher, J.; Saygili, Y.; Zhang, X.; Giordano, F.; Liska, P.; Hua, J.; Zakeeruddin, S.M.; Moser, J.-E.; Grätzel, M.; Hagfeldt, A. Dye-sensitized solar cells for efficient power generation under ambient lighting. Nat. Photonics 2017, 11, 372–379. [Google Scholar] [CrossRef]
  3. O’Regan, B.; Grätzel, M. A low-cost, high-efficiency solar cell based on dye-sensitized colloidal TiO2 films. Nature 1991, 353, 737–740. [Google Scholar] [CrossRef]
  4. Gratzel, M. Photoelectrochemical Cells. Nature 2001, 414, 338–344. [Google Scholar] [CrossRef] [PubMed]
  5. Hagfeldt, A.; Boschloo, G.; Sun, L.; Kloo, L.; Pettersson, H. Dye-Sensitized Solar Cells. Chem. Rev. 2010, 110, 6595–6663. [Google Scholar] [CrossRef] [PubMed]
  6. Nazeeruddin, M.K.; Pechy, P.; Renouard, T.; Zakeeruddin, S.M.; Humphry-Baker, R.; Comte, P.; Liska, P.; Cevey, L.; Costa, E.; Shklover, V.; et al. Engineering of efficient panchromatic sensitizers for nanocrystalline TiO(2)-based solar cells. J. Am. Chem. Soc. 2001, 123, 1613–1624. [Google Scholar] [CrossRef]
  7. Nazeeruddin, M.K.; De Angelis, F.; Fantacci, S.; Selloni, A.; Viscardi, G.; Liska, P.; Ito, S.; Bessho, T.; Grätzel, M. Combined Experimental and DFT-TDDFT Computational Study of Photoelectrochemical Cell Ruthenium Sensitizers. J. Am. Chem. Soc. 2005, 127, 16835–16847. [Google Scholar] [CrossRef]
  8. Gratzel, M. Solar Energy Conversion by Dye-Sensitized Photovoltaic Cells. Inorg. Chem. 2005, 44, 6841–6851. [Google Scholar] [CrossRef]
  9. Robertson, N. Catching the rainbow: Light harvesting in dye-sensitized solar cells. Angew. Chem. Int. Ed. 2008, 47, 1012–1014. [Google Scholar] [CrossRef]
  10. Xie, Y.; Tang, Y.; Wu, W.; Wang, Y.; Liu, J.; Li, X.; Tian, H.; Zhu, W.-H. Porphyrin Cosensitization for a Photovoltaic Efficiency of 11.5%: A Record for Non-Ruthenium Solar Cells Based on Iodine Electrolyte. J. Am. Chem. Soc. 2015, 137, 14055–14058. [Google Scholar] [CrossRef]
  11. Yella, A.; Lee, H.W.; Tsao, H.N.; Yi, C.; Chandiran, A.K.; Nazeeruddin, M.K.; Diau, E.W.G.; Yeh, C.Y.; Zakeeruddin, S.M.; Gratzel, M. Porphyrin-Sensitized Solar Cells with Cobalt (II/III)—Based Redox Electrolyte Exceed 12 Percent Efficiency. Science 2011, 334, 629–634. [Google Scholar] [CrossRef] [PubMed]
  12. Kenji Kakiage, K.; Aoyama, Y.; Yano, T.; Oya, K.; Kyomen, T.; Hanaya, M. Fabrication of a high-performance dye-sensitized solar cell with 12.8% conversion efficiency using organic silyl-anchor dyes. Chem. Commun. 2015, 51, 6315–6317. [Google Scholar] [CrossRef] [PubMed]
  13. Liu, M.; Johnston, M.B.; Snaith, H.J. Efficient planar heterojunction perovskite solar cells by vapour deposition. Nature 2013, 501, 395–398. [Google Scholar] [CrossRef]
  14. Yang, W.S.; Park, B.-W.; Jung, E.H.; Jeon, N.J.; Kim, Y.C.; Lee, D.U.; Shin, S.S.; Seo, J.; Kim, E.K.; Noh, J.H.; et al. Iodide management informamidinium-lead-halide–basedperovskite layers for efficientsolar cells. Science 2017, 356, 1376–1379. [Google Scholar] [CrossRef]
  15. Yu, H.; Zhang, S.Q.; Zhao, H.J.; Will, G.; Liu, P.B. An Efficient and Low-Cost TiO2 Compact Layer for Performance Improvement of Dye-Sensitized Solar Cells. Electrochim. Acta 2009, 54, 1319–1324. [Google Scholar] [CrossRef]
  16. Patrocinio, A.O.T.; Paterno, L.G.; Iha, N.Y.M. Layer-by-layer TiO2 films as efficient blocking layers in dye-sensitized solar cells. J. Photochem. Photobiol. A 2009, 205, 23–27. [Google Scholar] [CrossRef]
  17. Ito, S.; Murakami, T.N.; Comte, P.; Liska, P.; Gratzel, C.; Nazeeruddin, M.K.; Grätzel, M. Fabrication of Thin Film Dye Sensitized Solar Cells with Solar to Electric Power Conversion Efficiency over 10%. Thin Solid Films 2008, 516, 4613–4619. [Google Scholar] [CrossRef]
  18. Wang, P.; Zakeeruddin, S.M.; Comte, P.; Charvet, R.; Humphry-Baker, R.; Grätzel, M. Enhance the Performance of Dye-Sensitized Solar Cells by Co-grafting Amphiphilic Sensitizer and Hexadecylmalonic Acid on TiO2 Nanocrystals. J. Phys. Chem. B 2003, 107, 4336–143341. [Google Scholar] [CrossRef]
  19. Kim, J.H.; Lee, K.J.; Roh, J.H.; Song, S.W.; Park, J.H.; Yer, I.H.; Moon, B.M. Ga-doped ZnO transparent electrodes with TiO2 blocking layer/nanoparticles for dye-sensitized solar cells. Nano. Res. Lett. 2012, 7, 1–12. [Google Scholar] [CrossRef]
  20. Yoo, B.; Kim, K.J.; Bang, S.Y.; Ko, M.J.; Kim, K.; Park, N.G. Chemically deposited blocking layers on FTO substrates: Effect of precursor concentration onphotovoltaic performance of dye-sensitized solar cells. J. Electroanal. Chem. 2010, 638, 161–166. [Google Scholar] [CrossRef]
  21. Lungu, J.; Ştefan, N.; Prodan, G.; Georgescu, A.; Mandeș, A.; Ciupina, V.; Mihăilescu, I.N.; Gîrțu, M.A. Characterization of spin-coated TiO2 buffer layers for dye-sensitized solar cells. Digest J. Nanomat. Biostruct. 2015, 10, 967–976. [Google Scholar]
  22. Kavan, L.; O’Regan, B.; Kay, A.; Grätzel, M. Preparation of TiO2 (anatase) films on electrodes by anodic oxidative hydrolysis of TiCl3. J. Electroanal. Chem. 1993, 346, 291–307. [Google Scholar] [CrossRef]
  23. Kavan, L.; Tetreault, N.; Moehl, T.; Grätzel, M. Electrochemical Characterization of TiO2 Blocking Layers for Dye-Sensitized Solar Cells. J. Phys. Chem. C 2014, 118, 16408–16418. [Google Scholar] [CrossRef]
  24. Kavan, L.; Grätzel, M. Highly efficient semiconductingTiO2 photoelectrodes prepared by aerosol pyrolysis. Electrochim. Acta 1995, 40, 643–652. [Google Scholar] [CrossRef]
  25. Cameron, P.J.; Peter, L.M. Characterization of Titanium Dioxide Blocking Layers in Dye-Sensitized Nanocrystalline Solar Cells. J. Phys. Chem. B 2003, 107, 14394–14400. [Google Scholar] [CrossRef]
  26. Peng, B.; Jungmanna, G.; Jäger, C.; Haarer, D.; Schmidt, H.-W.; Thelakkat, M. Systematic investigation of the role of compact TiO2 layer in solid state dye-sensitized TiO2 solar cells. Coord. Chem. Rev. 2004, 248, 1479–1489. [Google Scholar] [CrossRef]
  27. Ito, S.; Zakeeruddin, S.; Humphry-Baker, R.; Liska, P.; Charvet, R.; Comte, P.; Nazeeruddin, M.; Péchy, P.; Takata, M.; Miura, H.; et al. High-Efficiency Organic-Dye-Sensitized Solar Cells Controlled by Nanocrystalline-TiO2 Electrode Thickness. Adv. Mater. 2006, 18, 1202. [Google Scholar] [CrossRef]
  28. Burke, A.; Ito, S.; Snaith, H.; Bach, U.; Kwiatkowski, J.; Grätzel, M. The Function of a TiO2 Compact Layer in Dye-Sensitized Solar Cells Incorporating “Planar” Organic Dyes. Nano Lett. 2008, 8, 977–981. [Google Scholar] [CrossRef] [PubMed]
  29. Hart, J.N.; Menzies, D.; Cheng, Y.B.; Simon, G.P.; Spiccia, L. TiO2 sol-gel blocking layers for dye-sensitized solar cells. C. R. Chimie 2006, 9, 622–626. [Google Scholar] [CrossRef]
  30. Kavan, L.; Zukalova, M.; Vik, O.; Havlicek, D. Sol–Gel Titanium Dioxide Blocking Layers for Dye- Sensitized Solar Cells: Electrochemical Characterization. ChemPhysChem 2014, 15, 1056–1061. [Google Scholar] [CrossRef]
  31. Ito, S.; Liska, P.; Comte, P.; Charvet, R.; Pechy, P.; Bach, U.; Schmidt-Mende, L.; Zakeeruddin, S.M.; Kay, A.; Nazeeruddin, M.K.; et al. Control of dark current in photoelectrochemical (TiO2/I−–I3−) and dye-sensitized solar cells. Chem. Commun. 2005, 4351–4353. [Google Scholar] [CrossRef]
  32. Xia, J.; Masaki, N.; Jiang, K.; Yanagida, S. Deposition of a Thin Film of TiOx from a Titanium Metal Target as Novel Blocking Layers at Conducting Glass/TiO2 Interfaces in Ionic Liquid Mesoscopic TiO2 Dye-Sensitized Solar Cells. J. Phys. Chem. B 2006, 110, 25222–25228. [Google Scholar] [CrossRef]
  33. Hitosugi, T.; Yamada, N.; Nakao, S.; Hirose, Y.; Hasegawa, T. Properties of TiO2-based transparent conducting oxides. Phys. Status Solidi A 2010, 207, 1529–1537. [Google Scholar] [CrossRef]
  34. Braga, A.; Baratto, C.; Colombi, P.; Bontempi, E.; Salvinelli, G.; Drera, G.; Sangaletti, L. An ultrathin TiO2 blocking layer on Cd stannate as highly efficient front contact for dye-sensitized solar cells. Phys. Chem. Chem. Phys. 2013, 15, 16812–16818. [Google Scholar] [CrossRef] [PubMed]
  35. Thelakkat, M.; Schmitz, C.; Schmidt, H.-W. Fully vapor-deposited thin-layer titanium dioxide solar cells. Adv. Mater. 2002, 14, 577–581. [Google Scholar] [CrossRef]
  36. Hamann, T.W.; Martinson, A.B.F.; Elam, J.W.; Pellin, M.J.; Hupp, J.T. Atomic Layer Deposition of TiO2 on Aerogel Templates: New Photoanodes for Dye-Sensitized Solar Cells. J. Phys. Chem. C 2008, 112, 10303–10307. [Google Scholar] [CrossRef]
  37. Van Delft, J.A.; Garcia-Alonso, D.; Kessels, W.M.M. Atomic layer deposition for photovoltaics: Applications and prospects for solar cell manufacturing. Semicond. Sci. Technol. 2012, 27, 074002. [Google Scholar] [CrossRef]
  38. Chandiran, A.K.; Yella, A.; Stefik, M.; Heiniger, L.P.; Comte, P.; Nazeeruddin, M.K.; Grätzel, M. Low-Temperature Crystalline Titanium Dioxide by Atomic Layer Deposition for Dye-Sensitized Solar Cells. ACS Appl. Mater. Interfaces 2013, 5, 3487–3493. [Google Scholar] [CrossRef] [PubMed]
  39. Gan, W.Y.; Lam, S.W.; Chiang, K.; Amal, R.; Zhao, H.; Brungs, M.P. Novel TiO2 thin film with non-UV activated superwetting and antifogging behaviours. J. Mater. Chem. 2007, 17, 952–954. [Google Scholar] [CrossRef]
  40. Charbonneau, C.; Cameron, P.J.; Pockett, A.; Lewis, A.; Troughton, J.R.; Jewell, E.; Worsley, D.A.; Watson, T.M. Solution processing of TiO2 compact layers for 3rd generation photovoltaics. Ceram. Int. 2016, 42, 11989–11997. [Google Scholar] [CrossRef]
  41. Bai, Y.; Xing, Z.; Yu, H.; Li, Z.; Amal, R.; Wang, L. Porous Titania Nanosheet/Nanoparticle Hybrids as Photoanodes for Dye-Sensitized Solar Cells. ACS Appl. Mater. Interfaces 2013, 5, 12058–12065. [Google Scholar] [CrossRef] [Green Version]
  42. Lee, S.; Noh, J.H.; Han, H.S.; Yim, D.Y.; Kim, D.H.; Lee, J.-K.; Kim, J.Y.; Jung, H.S.; Hong, K.S. Nb-Doped TiO2: A New Compact Layer Material for TiO2 Dye-Sensitized Solar Cells. J. Phys. Chem. C 2009, 113, 6878–6882. [Google Scholar] [CrossRef]
  43. Zhou, W.-Q.; Lu, Y.-M.; Chen, C.-Z.; Liu, Z.-Y.; Cai, C.-B. Effect of Li-doped TiO2 Compact Layers for Dye Sensitized Solar Cells. J. Inorg. Mater. 2011, 26, 819–822. [Google Scholar] [CrossRef]
  44. Bäuerle, D. Laser Processing and Chemistry; Springer: Berlin, Germany, 1996. [Google Scholar]
  45. Gyorgy, E.; Socol, G.; Axente, E.; Mihailescu, I.N.; Ducu, C.; Ciuca, S. Anatase phase TiO2 thin films obtained by pulsed laser deposition for gas sensing applications. Appl. Surf. Sci. 2005, 247, 429–433. [Google Scholar] [CrossRef]
  46. Mihailescu, I.N.; Gyorgy, E. Pulsed laser deposition: An overview. In Proceedings of the Invited Contribution to the Fourth International Commission for Optics (ICO) Book Trends in Optics and Photonics; Asakura, T., Ed.; Springer: Berlin, Germany, 1999; 201p. [Google Scholar]
  47. Pechini, M. Method of preparing lead and alkaline earth titanates and niobates and coating method using the same to form a capacitor. US Patent 3 330 697, 1967. [Google Scholar]
  48. Hocevar, M.; Opara, U.; Krasovec, U.; Berginc, M.; Drazic, G.; Hauptman, N.; Topic, M. Development of TiO2 pastes modified with Pechini sol–gel method for high efficiency dye-sensitized solar cell. J. Sol. Gel Sci. Technol. 2008, 48, 156–162. [Google Scholar] [CrossRef]
  49. Opara, U.; Krasovec, U.; Berginc, M.; Hocevar, M.; Topic, M. Unique TiO2 paste for high efficiency dye-sensitized solar cells. Sol. Energy Mater. Sol. Cells 2009, 93, 379–381. [Google Scholar] [CrossRef]
  50. Nezeeruddin, M.K.; Kay, A.; Rodicio, I.; Humphry-Baker, R.; Muller, E.; Liska, P.; Vlachopoulos, N.; Grätzel, M. Conversion of Light to Electricity by cis-XzBis(2,2′-bipyridyl-4,4′-dicarboxylate)ruthenium(11) Charge-Transfer Sensitizers (X = C1-, Br-, I-, CN-, and SCN-) on Nanocrystalline TiO2 Electrodes. J. Am. Chem. Soc. 1993, 115, 6382–6390. [Google Scholar] [CrossRef]
  51. Millington, K.R.; Fincher, K.W.; King, A.L. Mordant dyes as sensitisers in dye-sensitised solar cells. Sol. Energy Mater. Sol. Cells 2007, 91, 1618–1630. [Google Scholar] [CrossRef]
  52. Smestad, G.P.; Grätzel, M. Demonstrating Electron Transfer and Nanotechnology: A Natural Dye–Sensitized Nanocrystalline Energy Converter. J. Chem. Educ. 1998, 75, 752–756. [Google Scholar] [CrossRef]
  53. Teodorescu, V.S.; Blanchin, M.G. Fast and Simple Specimen Preparation for TEM Studies of Oxide Films Deposited on Silicon Wafers. Microsc. Microanal. 2009, 15, 15–19. [Google Scholar] [CrossRef]
  54. Dimitriu, E.; Iuga, A.; Ciupina, V.; Prodan, G.; Ramer, R. PZT-type materials with improved radial piezoelectric properties. J. Eur. Ceram. Soc. 2005, 25, 2401–2404. [Google Scholar] [CrossRef]
  55. Georgescu, A.; Damache, G.; Gîrţu, M.A. Class A small area solar simulator for dye-sensitized solar cell testing. J. Optoelectron. Adv. Mater. 2008, 10, 3003–3007. [Google Scholar]
  56. Mihailescu, I.N.; Gyorgy, E.; Teodorescu, V.S.; Steinbrecker, G.; Neamtu, J.; Perrone, A.; Luches, A. Characteristic features of the laser radiation-target interactions during reactive pulsed laser ablation of Si targets in ammonia. J.Appl. Phys. 1999, 86, 7123–7128. [Google Scholar] [CrossRef]
  57. Mihailescu, I.N.; Teodorescu, V.S.; Gyorgy, E.; Luches, A.; Perrone, A.; Martino, M. About the nature of particulates covering the surface of thin films obtained by reactive pulsed laser deposition. J. Phys. D Appl. Phys. 1998, 31, 2236–2240. [Google Scholar] [CrossRef]
  58. Mihailescu, I.N.; Teodorescu, V.S.; Gyorgy, E.; Ristoscu, C.; Cristescu, R. Particulates in pulsed laser deposition: Formation mechanisms and possible approaches to their elimination. In Proceedings of the SPIE International Conference of ALT’01, Constanta, Romania, 11–14 September 2001; Volume 4762, pp. 64–74. [Google Scholar]
  59. Hovmöller, S. CRISP: Crystallographic image processing on a personal computer. Ultramicroscopy 1992, 41, 121–135. [Google Scholar]
  60. Zou, X.D.; Sukharev, Y.; Hovmöller, S. ELD — a computer program system for extracting intensities from electron diffraction patterns. Ultramicroscopy 1993, 49, 147–158. [Google Scholar] [CrossRef]
  61. Wyckoff, R.W.G. Crystal Structures; Interscience Publishers: New York, NY, USA, 1963; Volume 1, pp. 253–254. [Google Scholar]
  62. Meagher, E.P.; George, A.L. Polyhedral thermal expansion in the TiO2 polymorphs: Refinement of the crystal structures of rutile and brookite at high temperature. Can. Miner. 1979, 17, 77–85. [Google Scholar]
  63. Halme, J.; Vahermaa, P.; Miettunen, K.; Lund, P. Device physics of dye solar cells. Adv. Mater. 2010, 22, 210–234. [Google Scholar] [CrossRef]
  64. Hamann, T.W.; Jensen, R.A.; Martinson, A.B.F.; van Ryswykac, H.; Hupp, J.T. Advancing beyond current generation dye-sensitized solar cells. Energy Environ. Sci. 2008, 1, 66–78. [Google Scholar] [CrossRef]
  65. Chrisey, D.G.; Hubler, G.K. Pulsed Laser Deposition of Thin Films; Wiley: New York, NY, USA, 1994. [Google Scholar]
  66. Von Allmen, M.; Blatter, A. Laser–Beam Interactions with Materials, 2nd ed.; Springer: Berlin, Germany, 1995. [Google Scholar]
Figure 1. SEM micrographs of samples with the mesoporous TiO2 deposited directly on fluorine-doped tin oxide (FTO) (a) and structures with TiO2 buffer layers deposited by pulsed laser deposition (PLD) on FTO in oxygen at 10 Pa (TO10) (b), and 50 Pa (TO50) (c), in argon at 10 Pa (TAR10) (d), and at 50 Pa (TAR50) (e).
Nanomaterials 09 00746 g001
Figure 2. SEM micrographs, top-view (a) and cross-section showing a thickness of 29.89 μm (b), and energy dispersive spectroscopy (EDS) spectrum (c) of the TiO2 mesoporous layer.
Nanomaterials 09 00746 g002
Figure 3. XRD patterns of the TiO2 mesoporous film and of the TiO2 buffer layers deposited by PLD on FTO glass substrates: TiO2 mesoporous film vs. FTO substrate (a); PLD layers vs. FTO substrate (b) and detail of the XRD pattern characteristic to the anatase (101) peak (c).
Nanomaterials 09 00746 g003
Figure 4. TEM image, selected area electron diffraction (SAED) pattern and distribution of grain size for the mesoporous TiO2 film (a), and the buffer layers: TO10 (b), TO50 (c), TAR10 (d) and TAR50 (e).
Nanomaterials 09 00746 g004aNanomaterials 09 00746 g004b
Figure 5. SAED profile obtained using CRISP2 software [59] with the ELD module [60] for the mesoporous TiO2 film and the buffer layers: TO10, TO50, TAR10 and TAR50. The indexing of anatase and rutile phases, which was performed according to Refs. [61,62], is represented as: Anatase = diamonds and rutile = circles.
Nanomaterials 09 00746 g005
Figure 6. High resolution TEM image with inset of the corresponding fast Fourier transformer presentation of the selected area of the TiO2 buffer layer deposited at 10 Pa oxygen (TO10) (left) and a detail showing the interplanar distance corresponding to the anatase (101) plane (right).
Nanomaterials 09 00746 g006
Figure 7. Transmission spectra of mesoporous TiO2 film and of TiO2 buffer layers deposited by PLD on FTO glass substrates.
Nanomaterials 09 00746 g007
Figure 8. Current-voltage (I-V) curves for typical DSSCs fabricated using photo-electrodes with various buffer layers: TO10 (dashed line), TO50 (dotted line), TAR10 (dashed dotted line) or TAR50 (dashed dotted dashed line). The measurements were performed under standard air mass 1.5 global (AM 1.5G) illumination conditions.
Nanomaterials 09 00746 g008
Figure 9. Equivalent circuit model of a solar cell.
Nanomaterials 09 00746 g009
Table 1. Thickness of TiO2 mesoporous coatings and of TiO2 buffer layers deposited by PLD, on a SnO2:F conductive film of 0.41 µm.
Film TypeTiO2 Mesoporous FilmTO10
Buffer Layer
TO50
Buffer Layer
TAR10
Buffer Layer
TAR50
Buffer Layer
Thickness (µm)~29.89~0.65~2.95~0.33~1.24
Table 2. Buffer layers: Structural and morphological features.
TiO2 Layer TypeXRD (101) Crystalline Coherent Length (nm)TEM Mean Grain Size (nm)
TO10~21.512.6
TO50~28.112.0
TAR10~40.816.9
TAR50n/a13.3
Mesoporous film~19.016.4
Table 3. Electro-optical parameters: Short circuit current (Isc), open circuit voltage (Voc), short circuit current density (Jsc), maximum power (Pmax), fill factor (FF) and photovoltaic conversion efficiency (η) of typical dye-sensitized solar cells (DSSCs) measured under standard illumination conditions (Figure 9).
SampleIsc
(mA)
Voc
(mV)
Jsc
(mA/cm2)
Pmax
(μW)
FFη
(%)
TO106.396088.13622280.572.84
TO505.926047.53720150.562.57
TAR106.215947.90720410.552.60
TAR505.906097.51219780.552.52
No buffer2.485903.1669680.661.23