Article

Controllable Synthesis of Zn-Doped α-Fe2O3 Nanowires for H2S Sensing

1
Shen Kan Engineering and Technology Corporation, MCC., Shenyang 110169, China
2
School of Resources and Civil Engineering, Northeastern University, Shenyang 110819, China
*
Authors to whom correspondence should be addressed.
Nanomaterials 2019, 9(7), 994; https://doi.org/10.3390/nano9070994
Submission received: 28 June 2019 / Revised: 4 July 2019 / Accepted: 8 July 2019 / Published: 10 July 2019

Abstract

:
One-dimensional Zn-doped α-Fe2O3 nanowires have been controllably synthesized by using the pure pyrite as the source of Fe element through a two-step synthesis route, including the preparation of Fe source solution by a leaching process and the thermal conversion of the precursor solution into α-Fe2O3 nanowires by the hydrothermal and calcination process. The microstructure, morphology, and surface composition of the obtained products were characterized by X-ray diffraction, scanning electron microscopy, transmission electron microscopy, and X-ray photoelectron spectroscopy. It was found that the formation process of α-Fe2O3 is significantly influenced by the introduction of Zn2+. The gas sensing measurements indicated that the sensor based on 1% Zn-doped α-Fe2O3 nanowires showed excellent H2S sensing properties at the optimum operating temperature of 175 °C. Notably, the sensor showed a low H2S detection limit of 50 ppb with a sensor response of 1.5. Such high-performance sensing would be ascribed to the one-dimensional structure and high specific surface area of the prepared 1% Zn-doped α-Fe2O3 nanowires, which can not only provide a large number of surface active sites for the adsorption and reaction of the oxygen and H2S molecules, but also facilitate the diffusion of the gas molecules towards the entire sensing materials.

Graphical Abstract

1. Introduction

Hydrogen sulfide (H2S), as a typical colorless, inflammable, and malodorous gas, is extensively produced in various industrial processes, such as coal mines, water treatment, petroleum refining, and paper industry [1,2]. Specifically, H2S is also an extremely toxic gas that poses great threats to human health. For example, it can cause serious damage to human respiratory and nerve systems even at a very low concentration, and the death will occur if H2S concentration is higher than 700 ppm [3,4]. According to the criterion set by the American Conference of Government Industrial Hygienists, the threshold H2S concentration is only 10 ppm [5]. As well, the Scientific Advisory Board on Toxic Air Pollutants suggests that the acceptable concentration of H2S in the atmosphere is 20–100 ppb [6,7]. Therefore, in the perspective of human health protection and environmental monitoring, the selective and reliable H2S sensor with the detection limit of ppm and sub-ppm is in urgent demand.
For many years, metal oxide semiconductor (MOS) materials received considerable attention owing to their wide application in the fields of optic [8,9], energy [10,11], catalyst [12,13], and gas sensor [14,15,16]. Specifically in gas sensors, MOS has been considered as the most potential sensing materials in detecting various hazardous gases and has covered most of the monitoring of environmental pollutants [17,18]. With the rapid development of nanoscience and nanotechnology, a large number of nanostructured MOS materials such as ZnO [19], SnO2 [20], Fe2O3 [21], In2O3 [19], and CuO [22] have been investigated for the application of H2S sensing. Among them, Fe2O3, which is commonly used as the desulfurizer in the purification process of coal gas, is an excellent potential H2S sensing material with the outstanding advantages of low cost, good stability, environment friendly, and easy availability [3,23].
As we know, the sensing signal of MOS based gas sensors is generated mainly by the adsorption, desorption, and reaction of oxygen and target gases on the surface of the sensing materials [24]. Thus the sensing performance of these sensors is closely related to the microstructure, morphology, crystal size, chemical composition, and synthesis process of the sensing materials [25,26]. On this account, the controllable synthesis of novel types gas sensing materials with different architectures and morphologies have always been the research hotspot in this field.
Up to now, various α-Fe2O3 nanostructured materials have been synthesized and investigated for H2S sensing. Table 1 gives a comparison between the reported Fe2O3 based H2S sensors. Deng et al. synthesized α-Fe2O3 nanospheres by a microwave-assisted hydrothermal method. The sensor based on the obtained nanospheres exhibited a peak response of 6 to 10 ppm H2S at the operating temperature of 225 °C [27]. Li et al. reported a α-Fe2O3 nanoparticles based H2S sensor. At its optimum operating temperature of 300 °C, the sensor can detect trace H2S of 50 ppb with a response of 1.25 while a response of 5.5 to 10 ppm H2S is obtained [28]. Li et al. prepared α-Fe2O3 micro-ellipsoids through a surfactant-free hydrothermal process, and the sensor exhibited a response of 11.7 to 100 ppm H2S at 350 °C [29]. Furthermore, the effect noble metals, which are effective catalysts to improve the gas sensing properties of semiconductor gas sensing materials, on the H2S sensing performance of α-Fe2O3 based sensors were also extensively investigated. Wang et al., prepared Pt, Pd, and Ag doped α-Fe2O3 nanoparticles and systematically compared their H2S sensing characteristics with pure α-Fe2O3 nanoparticles. It had been found that the introduction of Pt, Ag, and Pd not only can increase the H2S response, but also can decrease the optimum operating temperature of the sensors [30,31,32]. Balourian et al. studied the H2S sensing properties of Au functionalized α-Fe2O3 thin films. The results demonstrated that the sensor based on 2.33% Au modified α-Fe2O3 thin films exhibited the highest H2S response. The optimum operating temperature of which was 250 °C with a response of 6.4 to 10 ppm H2S. It also found that the response time of this sensor was very long (27 min) [33]. Despite these progress have been made, as can be seen in Table 1, it can be found that there are still some limitations to meet the requirements of practical application, including relatively low sensitivity, high detection limit, and high operating temperature. In addition, the long recovery time is also a critical problem for H2S detection.
Owing to their high surface to volume ratio, good stability, and fast mass transport, one-dimensional nanostructures (e.g., nanorod, nanowire, nanofiber, and nanotube) are found to be an efficient architecture for the application of high-performance gas sensing [34,35]. Therefore, in this paper, Zn-doped α-Fe2O3 nanowires were controllably synthesized by using the pure pyrite as the source of Fe element, and it was found that Zn2+ took a vital part in the formation process of α-Fe2O3 one-dimensional structure. Furthermore, the microstructure, morphology, composition, and H2S sensing performance of the synthesized products were systematically studied.

2. Materials and Methods

2.1. Materials

The pure pyrite powders with a high grade of approximately 99% and the particle size of smaller than 74 μm were obtained from Gongchangling mineral company, Anshan, China. Zinc chloride (ZnCl2) and sodium hydroxide (NaOH) were analytical grade and purchased from Sinopharm Chemical Reagent Co., Ltd., Shenyang, China. Hydrochloric acid (HCl) was purchased from Kemiou Reagent Co., Ltd., Tianjin, China. All the reagents were directly used as received without further purification.

2.2. Preparation of Fe Source Solution

The Fe source solution that used to synthesis α-Fe2O3 nanowires was obtained from pure pyrite by a leaching process. In a typical procedure as shown in Figure 1a, 0.3 g pure pyrite powders were placed in an Al2O3 boat and then calcined in air at 800 °C for 4 h in a tubular furnace with the heating rate of 10 °C/min. The obtained samples were dissolved in 60 mL HCl (1.4 M) while being stirred at 80 °C for 4 h. Then, the insoluble impurities were removed by filtration, and the Fe source solution with the Fe concentration of 19.9 g/L was obtained.

2.3. Synthesis of Zn-Doped α-Fe2O3 Nanowires

A typical procedure for synthesizing Zn-doped α-Fe2O3 nanowires was schematically illustrated in Figure 1b and carried out as follows. A pre-defined amount of ZnCl2 solution (0.035 M) was added in 20 mL the as-prepared Fe source solution. The pH was adjusted to 13 by the dropwise addition of NaOH solution (3 M) under constant magnetic stirring for 30 min at room temperature. The solution was then transferred into a 200 mL Teflon-lined autoclave, hydrothermal reacted at 160 °C for 12 h, and cooled down to room temperature naturally. The resulted precipitates were washed by centrifuging-washing cycles with distilled water and ethanol followed by drying at 60 °C for 4 h. Finally, the dried samples were calcined at 500 °C in air for 5 h. The 1% and 3% Zn-doped α-Fe2O3 were estimated by calculating the molar ratio of Zn/Fe in the precursor solution.

2.4. Characterizations

The crystalline phase of the prepared products was analyzed by X-ray diffractometer (XRD, PANalytical X’Pert Pro, Cu Kα radiation, λ = 1.5406 Å, PANalytical B.V., Almelo, Overijssel, Netherlands). Data was collected in the 2θ range of 20–80°. Their morphology and microstructure were characterized by a S-4800 scanning electron microscope (SEM, HITACHI, Tokyo, Japan), which was operated at 2 kV. The transmission electron microscopy (TEM), high-resolution TEM transmission electron microscopy (HRTEM), and selective area electron diffraction (SEAD) images were conducted on JEM-2100F microscope (JEOL, Tokyo, Japan) with the operating voltage of 200 kV. The surface component and bonding state analysis were performed on an X-ray photoelectron spectroscope (XPS, Thermo Scientific Escalab 250Xi, Thermo Fisher Scientific, Waltham, MA, USA) with Al Kα radiation (1486.6 eV).

2.5. Fabrication and Measurement of Gas Sensor

The photo and schematic in Figure 2 illustrated the gas sensor structure. For the fabrication of the sensor, a proper amount of the as-prepared Zn-doped α-Fe2O3 nanowires were dispersed in ethanol with the assistance of ultrasonication to form the sensing paste. Then, the sensing paste was coated onto the outer surface of an Al2O3 tube (1.2 mm in external diameter, 0.8 mm in internal diameter, 4 mm in length) by using a brush. Electric contacts were achieved by a pair of gold electrodes, on each of which a pair of platinum wires were connected. The operating temperature of the sensor was controlled by a Ni-Cr coil that inserted through the coated alumina tube. In order to improve the thermal stability, the sensor was aged at 300 °C in air for two days before testing. The gas sensing performance of the sensor was measured on WS-30A commercial static test system (Winsen Electronics Science and Technology Co., Ltd., Henan, China). The sensor response (S) is defined here as the ratio of the sensor resistance in fresh air (Ra) to that in target gas (Rg) under static conditions; the values do not represent steady-state dynamical equilibrium conditions, as would be the case in a flow-through measuring setup. As well, the response and recovery times are defined as the time for the sensor resistance to achieve 90% variation after H2S is injected and removed, respectively.

3. Results and Discussion

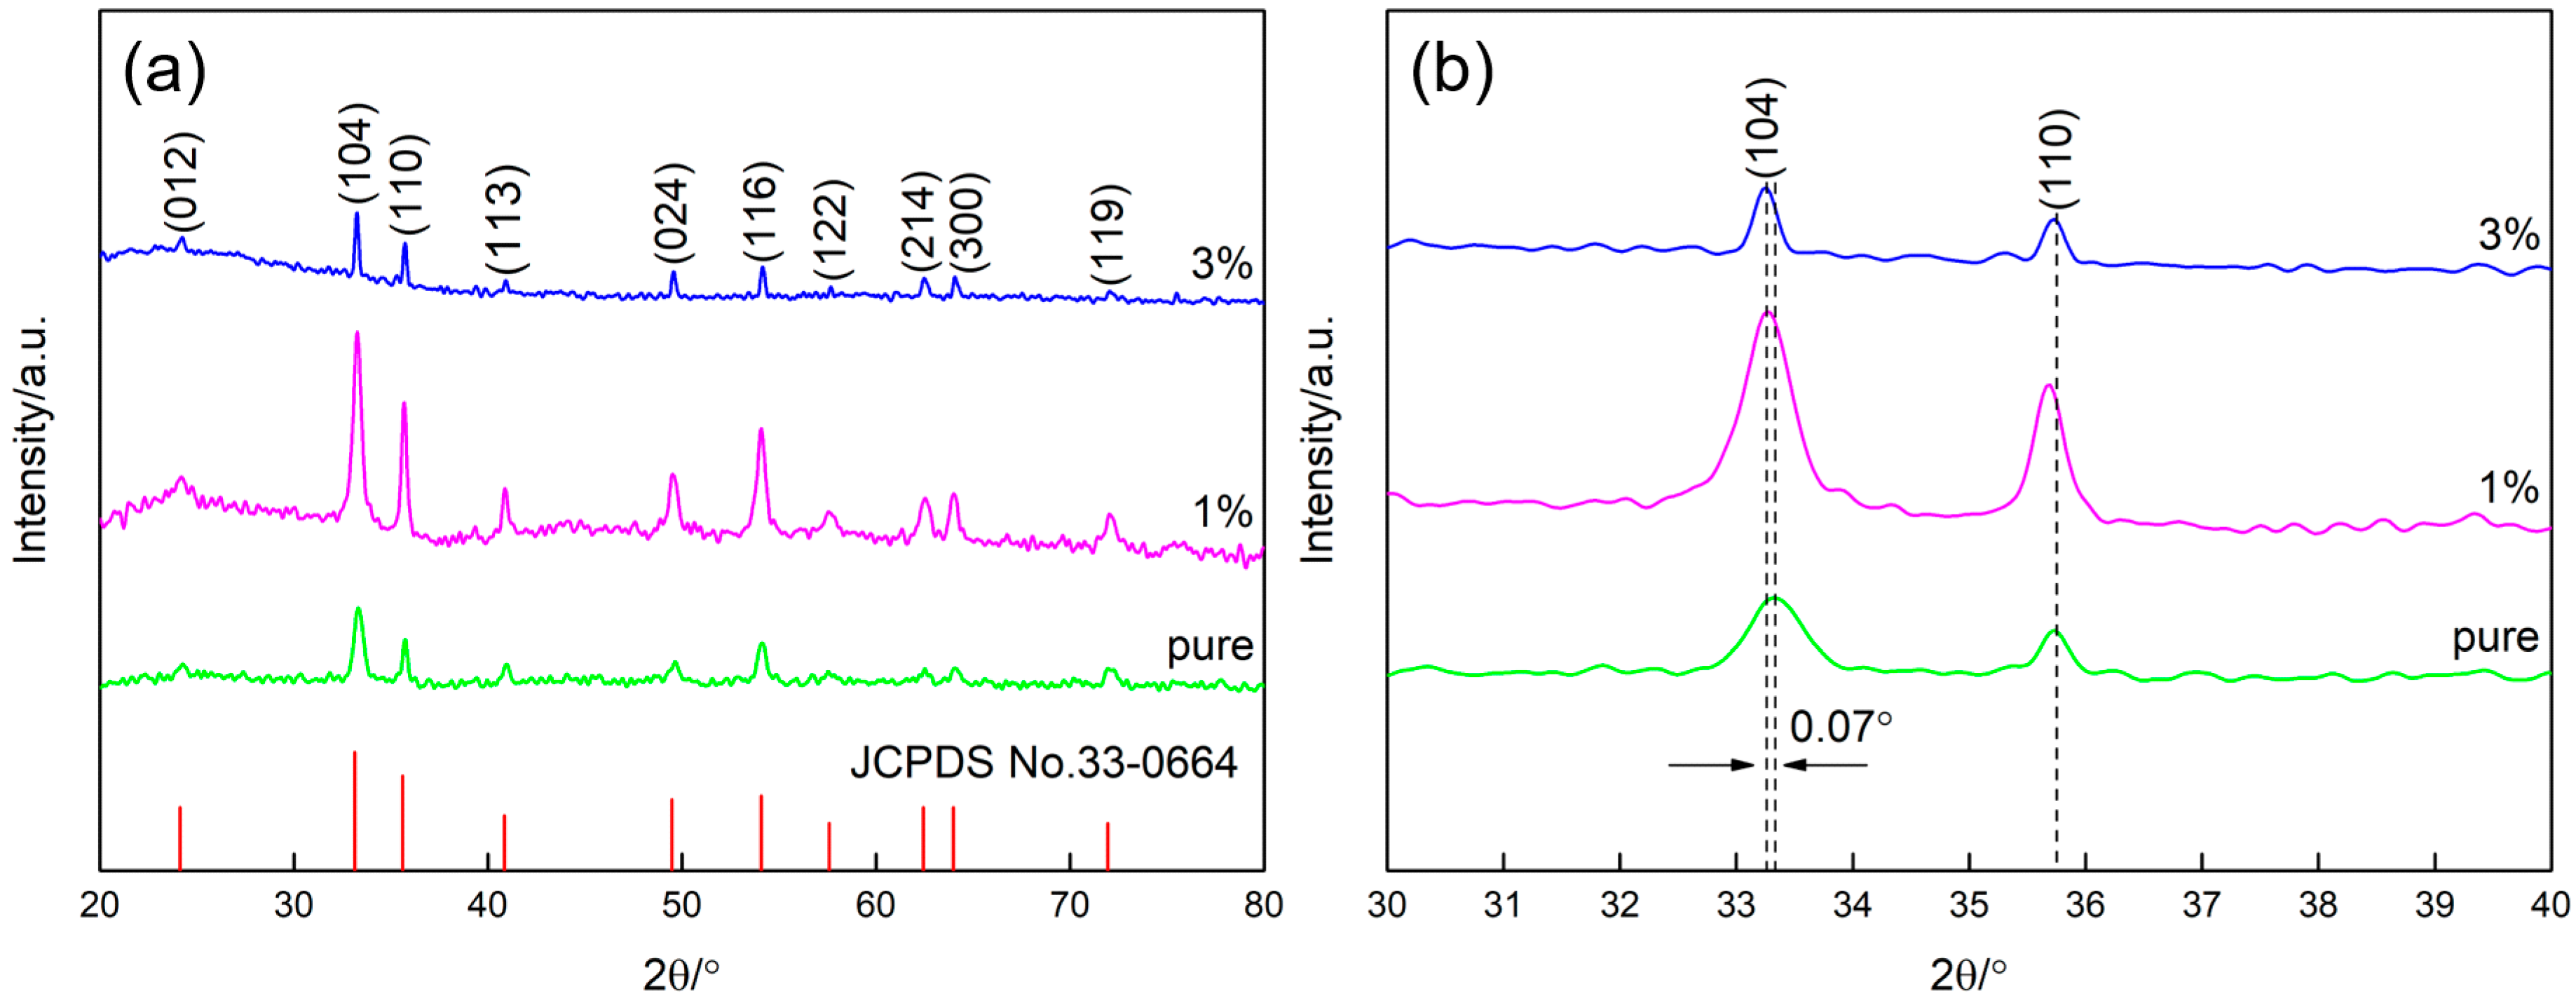
3.1. Structural and Morphology Characterization

Figure 3 displays the typical XRD patterns of the synthesized samples with different molar ratios of Zn/Fe. As can be seen in Figure 3a, the diffraction peaks of all the samples can be well indexed to the hexagonal α-Fe2O3 phase with unit cell parameters of a = b = 5.0356 Å and c = 13.7489 Å (JCPDS card No. 33-0664). The absence of the diffraction peaks corresponding to Zn in the patterns may be ascribed to the low content of Zn. Additionally, no characteristic peaks from other impurities are detected, indicating that all the products are of high phase purity. Furthermore, it can be observed in Figure 3b that the diffraction peaks of 1% and 3% Zn-doped α-Fe2O3 have a slight shift to lower value compared with pure α-Fe2O3. These shifts might be the result that Zn2+ is incorporated into the crystal lattice of α-Fe2O3 leading to the slight change of the crystal structure.
The SEM images of the obtained α-Fe2O3 with different Zn/Fe molar ratios is presented in Figure 4. It can be clearly observed that Zn2+ plays a vital role in controlling the microstructure of α-Fe2O3. As can be seen in Figure 4a, α-Fe2O3 that prepared without Zn is plate-like with a smooth surface, and its thickness is nearly 300 nm. For 1% Zn-doped α-Fe2O3 sample, highly dispersive nanowires with the diameter of ~50 nm and the length of 2–3 μm are obtained, indicating that Zn2+ can significantly promote α-Fe2O3 to form one-dimensional structure. In addition, it can be found that 1% Zn-doped α-Fe2O3 nanowires exhibit a coarser surface than pure α-Fe2O3 and some pores on their surface can be clearly observed. However, the structure of α-Fe2O3 becomes plate-like again as the doping percentage of Zn increases to 3%. Moreover, the surface of these plates is coarser while the dispersity is apparently deteriorated compared with pure α-Fe2O3. In summary, the formation process and the morphology of α-Fe2O3 are closely related to the molar ratio of Zn/Fe in the precursor solution, and the homogeneous α-Fe2O3 nanowires can be controllably synthesized by introducing a proper amount of Zn2+. It is worthy to mention that the effect of some other inorganic salt ions such as In3+, Ni2+, Cu2+, and Mg2+ on the morphology of the final α-Fe2O3 have also been investigated, and it is interestingly found that α-Fe2O3 nanowires can only be obtained in the presence of Zn2+.
TEM measurements were used for further characterizations of the prepared 1% Zn-doped α-Fe2O3 nanowires. As shown in Figure 5a, the obtained products are wire-like with a diameter of about 50 nm, which is associated with the results of SEM characterization. Also, the irregular pores as observed in SEM measurement can be apparently found in Figure 5b. However, it can be assumed from Figure 5c that the pores seemly only exist on the surface of the α-Fe2O3 nanowires with a certain depth, and they don’t penetrate through the whole nanowires. The measured lattice spacing between two adjacent fringes is 0.25 nm, which corresponds to the (110) plane of hexagonal structured α-Fe2O3. The corresponding SAED pattern in Figure 5d, which is indexed to [001] zone-axis, reveals that as-prepared 1% Zn-doped α-Fe2O3 nanowires are of single crystal.
For further illustration of the surface composition and chemical states of 1% Zn-doped α-Fe2O3 nanowires, the XPS spectra were studied. Figure 6a shows the narrow scan spectrum of Fe 2p. The two dominant peaks located at 710.3 and 724.6 eV are indexed to Fe 2p3/2 and Fe 2p1/2 peaks of α-Fe2O3, respectively. In addition, on the respective higher binding energy sides of Fe 2p3/2 and Fe 2p1/2 peaks at about 8 eV (718.2 and 732.8 eV), the broad satellite peaks can be clearly observed, which further confirms that Fe species in the as-prepared samples exist in the form of α-Fe2O3 phase [35,36]. The high-resolution spectrum of Zn 2p is displayed in Figure 6b, in which the two distinct peaks at 1021.4 and 1044.5 eV with the binding energy separation value of 23.1 eV are in good accordance with Zn 2p3/2 and Zn 2p1/2, respectively, demonstrating the normal chemical state of Zn2+ in the obtained products [37,38]. Furthermore, from the report of the XPS analysis results, it can be found that the molar ratio of Zn/Fe is 10%, which is much higher than that in the precursor solution, indicating that the doped Zn element is mainly distributed in the surface region of the finally prepared Zn-doped α-Fe2O3. The high-resolution spectrum of O 1s core-level with an obvious shoulder in Figure 6c is resolved to two Gaussian function peaks with binding energies centered at 529.5 and 531.8 eV, corresponding to the lattice oxygen species (OL) and the chemisorbed oxygen species (OC), respectively [39,40].

3.2. Growth Mechanism

There are two steps for the growth of the Zn-doped α-Fe2O3 nanowires including the nucleation and their anisotropic growth (Figure 7). Figures S1 and S2 give the calculated distribution diagram of iron ion and zinc ion solutions as a function of pH, respectively. As can be seen in these figures, the Fe3+ will react with OH prior to Zn2+ to form the flocculent precipitation of amorphous Fe(OH)3 when increasing the pH of the precursor solution by dropwise addition of NaOH solution. During this process, a part of Zn2+ is co-precipitated with Fe3+ and incorporated in amorphous Fe(OH)3, while the others is precipitated from the precursor solution in the form of Zn(OH)2 with the further increase of pH. For the hydrothermal process, because of the high temperature, pressure, and alkaline condition, the colloidal Fe(OH)3 is dehydronated and dissolved gradually followed by a nucleation and crystallization process to form α-(Fe, Zn)OOH. As reported previously [41], the existence of Zn2+ can improve the stability of the Fe(OH)3, thus the dehydration process can be carried out steadily without too fast partial reaction. On the other hand, it can be concluded that a proper amount of Zn2+ can effectively induce the formation of one-dimensional structured α-FeOOH. This phenomenon is similar to the observation of Stjepko Krehula and needs further investigation [42]. Finally, the Zn-doped α-Fe2O3 nanowires can be obtained by the calcination treatment.

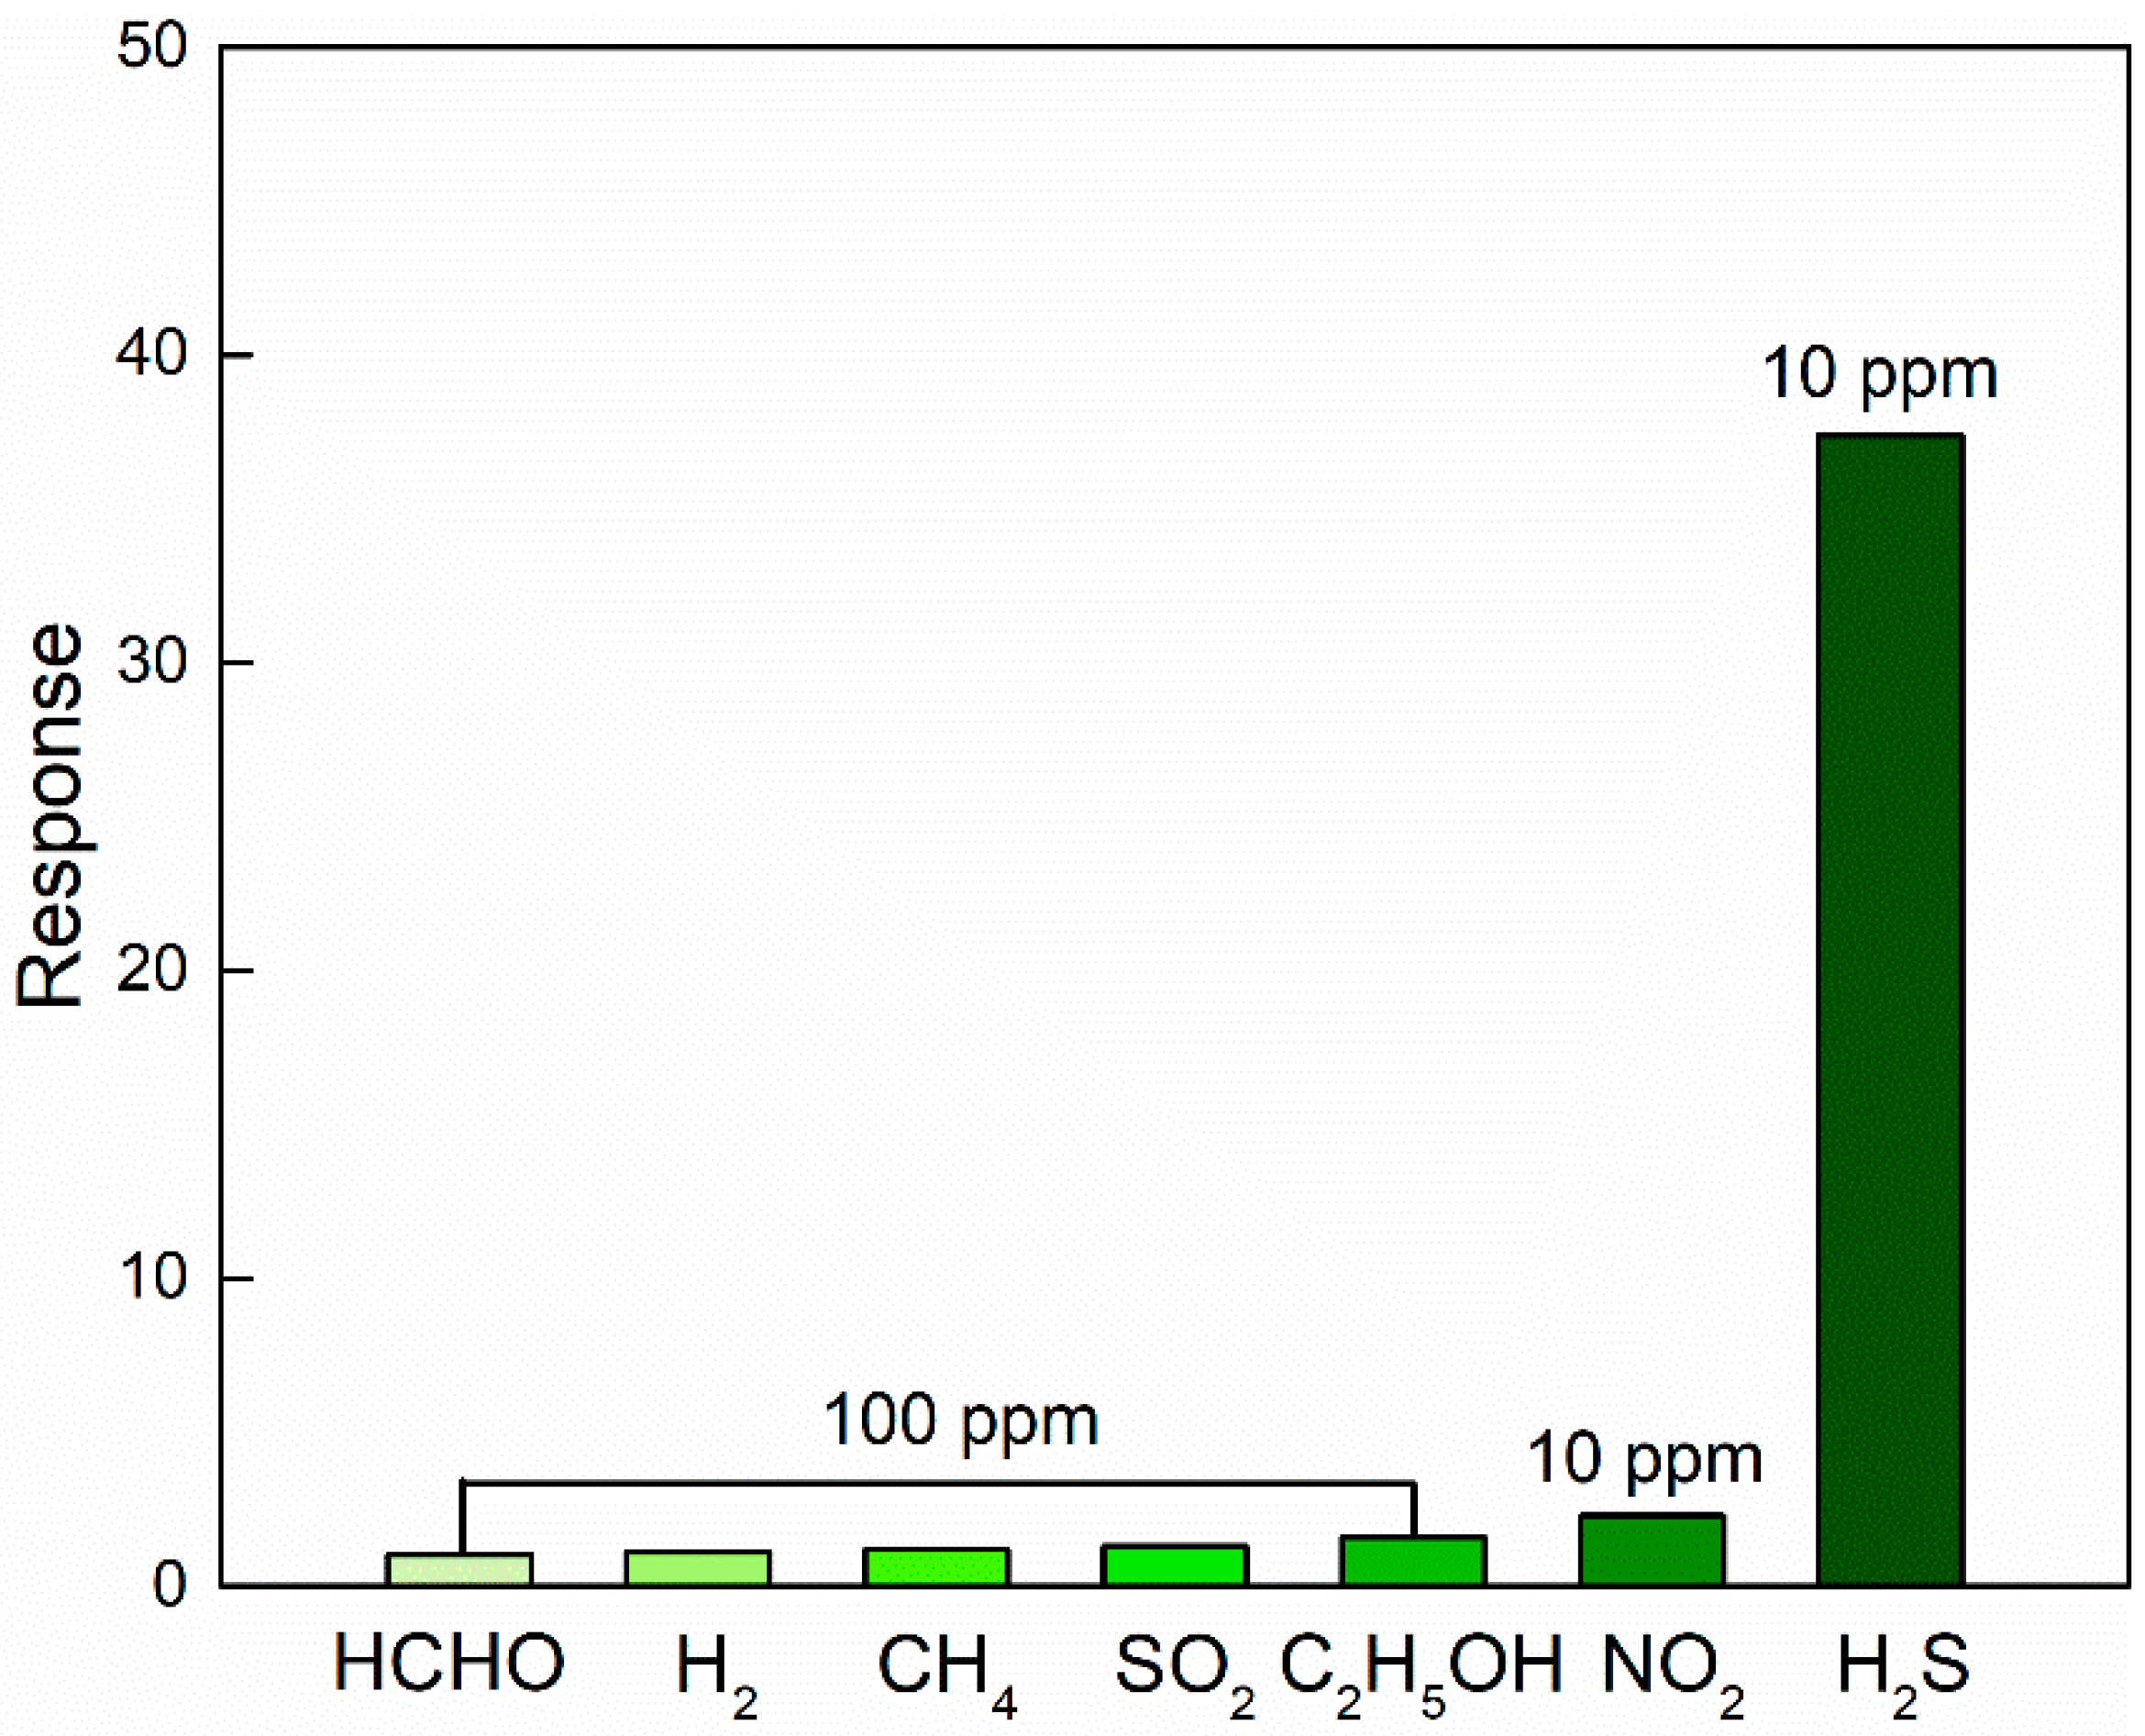
3.3. Gas Sensing Properties

Considering that the operating temperature of the MOS based gas sensors has a significant influence on their gas sensing performance. The response and response/recovery times of the sensor based on 1% Zn-doped α-Fe2O3 nanowires towards 5 ppm H2S were firstly examined at different operating temperatures. As can be seen in Figure 8a, the sensor response is significantly improved while the operating temperature increases from 150 to 175 °C. The maximum sensor response of 23.5 is obtained at the operating temperature of 175 °C. And the apparent downward trend can be observed with further increasing the operating temperature. At low operating temperatures, there is no sufficient active energy for H2S molecules to react with the oxygen species that chemisorbed on the surface of 1% Zn-doped α-Fe2O3 nanowires, resulting in low response. While the sensor response tends to decrease at the temperature higher than the optimum is mainly caused by the increased desorption rate of H2S and oxygen molecules [43]. As presented in Figure 8b, both the response and recovery times are reduced dramatically with the increase of the operating temperature, which is mainly caused by the faster adsorption and desorption kinetics of the gases at high operating temperature. At the optimum operating temperature of 175 °C, the fast response time of 16 s and recovery time of 174 s for 1% Zn-doped α-Fe2O3 nanowires to 5 ppm H2S are obtained.
Figure 9 displays the response of the sensor based on 1% Zn-doped α-Fe2O3 nanowires as a function of H2S concentration at 175 °C. It is very clear that the sensor response shows an obvious H2S concentration-dependent feature and increases monotonically with the increase of H2S concentration in the range of 50 ppb–10 ppm, and then changes slightly as further increasing H2S concentration. Such phenomena can be explained as follows. At relatively low H2S concentrations, the surface reaction is enhanced with the increase of H2S concentration, leading to a remarkable and linear increase of the sensor response. However, for MOS gas sensing materials, the number of the surface active site of the sensing materials is almost constant at a certain operating temperature. Therefore, the sensor response would gradually become saturated with the further increase of H2S concentration for the reason that there are no more active sites available for the adsorption and reaction of H2S molecules [44,45]. Specifically, it is worth mentioning that the sensor still exhibits a notable response of 1.5 at a relatively low H2S concentration of 50 ppb, indicating a promising application potential in the monitoring of trace amount of H2S.
The reproducibility and stability are of great importance parameters to evaluate the performance of gas sensors. Figure 10a presents the dynamic response characteristics of 1% Zn-doped α-Fe2O3 nanowires upon exposure to 5 ppm H2S for five cycles at 175 °C. Apparently, the resistance of the sensor decreases abruptly upon the injection of H2S, following which it increases rapidly and recovers to its initial value once H2S is removed. This sensing behavior reveals the n-type semiconductor conduction characteristic of the prepared 1% Zn-doped α-Fe2O3 nanowires. Furthermore, the dynamic response and recovery processes are almost the same without a clear change upon five successive sensing measurement cycles to the same H2S concentration of 5 ppm, demonstrating the excellent reversibility and reproducibility of the 1% Zn-doped α-Fe2O3 nanowires based sensor when alternately exposed to air and H2S. Figure 10b gives the long-time stability of the sensor at the optimal operating temperature of 175 °C, as can be seen in this figure, the sensor response to 5 ppm H2S only showed a small fluctuation in 15 days, which indicates the excellent stability of the sensor.
In order to recognize the specific target gas in a multicomponent gas environment, an excellent selectivity is required for high-performance gas sensors. The response of the sensor upon exposure to seven typical gases at 175 °C were examined to determine the sensor selectivity, including formaldehyde (HCHO), hydrogen (H2), methane (CH4), sulfide dioxide (SO2), ethanol (C2H5OH), nitrogen dioxide (NO2) and hydrogen sulfide (H2S), and the results are presented in Figure 11. In detail, the sensor responses are 1.0, 1.1, 1.2, 1.3, 1.6, 2.3, and 37.4 to 100 ppm HCHO, 100 ppm H2, 100 ppm CH4, 100 ppm SO2, 100 ppm C2H5OH, 10 ppm NO2, and 10 ppm H2S, respectively. Such observations reveal the excellent H2S selectivity of the present sensor over other gases at 175 °C.
As for MOS based gas sensors, it is well known that the detection of target gas depends on the conductivity changes of the sensing materials that mainly caused by the adsorption and desorption of oxygen species on their surface [46,47]. Therefore, the sensing mechanism of α-Fe2O3 nanowires can be explained by the reaction between chemisorbed oxygen species and H2S molecules. When the sensor based on 1% Zn-doped α-Fe2O3 nanowires is in ambient air, the oxygen molecules are diffused and adsorbed on its surface, followed by transferring into O, O2−, or O2 by capturing electrons from the conduction band, which results in the decrease of the electron concentration and the formation of the depletion layer in the surface region of α-Fe2O3 nanowires. As a consequence, the sensor is in high-resistance state. When the sensor is exposed to H2S, H2S molecules react with the chemisorbed oxygen species on the surface of α-Fe2O3 nanowires and as a result the captured electrons are released back to the conduction band, which narrows the depletion layer and eventually results in a remarkable decrease of the sensor resistance. It can be representatively expressed by:
H2S + 3O2− → H2O + SO2 + 6e
In addition, the H2S gas molecules can also react with α-Fe2O3 as follows:
3H2S + Fe2O3 → Fe2S3 + 3H2O
Fe2S3 → FeS + FeS2
Thus, the iron sulphides will be formed on the surface of the α-Fe2O3 nanowires, which will also increase the conductivity of the sensor because of the low band gap intrinsic characteristic of such iron sulphides. However, as reported by Singh [33], the reaction (1) plays a more predominant role in the sensing process.
Once the sensor breaks away from the H2S atmosphere, α-Fe2O3 nanowires would be covered by oxygen species again, and as a result the sensor recovers to its initial state. The excellent sensing properties of α-Fe2O3 nanowires could be mainly ascribed to the unique one-dimensional structure. On the one hand, it can provide a large accessible surface area and thus a large number of available surface active sites for the sensing reaction between H2S molecules and chemisorbed oxygen species. On the other hand, it can facilitate the diffusion of the gas molecules towards the entire sensing materials.

4. Conclusions

An efficient route was developed for the preparation of Zn-doped α-Fe2O3 nanowires with a large specific surface area. The pure pyrite was employed as the source of Fe, and Zn2+ was introduced to induce the formation of one-dimensional structure of α-Fe2O3. Interestingly, α-Fe2O3 nanowires can only be obtained when the molar ratio of Zn/Fe is 1% in the precursor solution. The synthesized Zn-doped α-Fe2O3 nanowires are single crystal hexagonal structure with the diameter and length of ~50 nm and 2–3 μm, respectively. The H2S sensor was fabricated by using 1% Zn-doped α-Fe2O3 nanowires as the sensing material. At the optimum operating temperature of 175 °C, the sensor exhibited a high response of 23.5 to 5 ppm H2S with fast response time of 16 s and recovery time of 171 s. Dramatically, the detection limit of 1% Zn-doped α-Fe2O3 nanowires based sensor was found to be as low as 50 ppb with a remarkable response of 1.5. Furthermore, the sensor also showed excellent reversibility, reproducibility, selectivity, and stability, indicating that the as-prepared Zn-doped α-Fe2O3 nanowires can be a promising H2S sensing material.

Supplementary Materials

The following are available online at https://www.mdpi.com/2079-4991/9/7/994/s1, Figure S1: Concentration logarithmic diagram of Fe3+ hydrolysis components (Fe3+: 0.14 mol/L), Figure S2: Concentration logarithmic diagram of Zn2+ hydrolysis components (Zn2+: 1.4 × 10⁻³ mol/L).

Author Contributions

Conceptualization, Y.S. and D.W.; methodology, K.W. and W.Z.; formal analysis, S.Z.; investigation, W.Z., T.L. and X.Z.; writing—original draft preparation, S.Z.; writing—review and editing, B.C. and S.G.; project administration, Y.S.

Funding

This research was funded by the National Natural Science Foundation of China (51674067, 51422402), Fundamental Research Funds for the Central Universities (N180102032, N180106002, N180408018, N170106005), Liaoning Revitalization Talents Program (XLYC1807160), Liaoning BaiQianWan Talents Program (201892127), and Open Foundation of State Key Laboratory of Mineral Processing (BGRIMM-KJSKL-2019-12).

Conflicts of Interest

The authors declare no conflict of interest.

References

  1. Xu, Z.; Luo, Y.; Duan, G. Self-assembly of Cu2O monolayer colloidal particle film allows the fabrication of CuO sensor with superselectivity for hydrogen sulfide. ACS Appl. Mater. Interfaces 2019, 11, 8164–8174. [Google Scholar] [CrossRef]
  2. Zhang, S.; Zhang, P.; Wang, Y.; Ma, Y.; Zhong, J.; Sun, X. Facile fabrication of a well-ordered porous Cu-doped SnO2 thin film for H2S sensing. ACS Appl. Mater. Interfaces 2014, 6, 14975–14980. [Google Scholar] [CrossRef]
  3. Tian, K.; Wang, X.; Yu, Z.; Li, H.; Guo, X. Hierarchical and hollow Fe2O3 nanoboxes derived from metal–organic frameworks with excellent sensitivity to H2S. ACS Appl. Mater. Interfaces 2017, 9, 29669–29676. [Google Scholar] [CrossRef]
  4. Yang, M.; Zhang, X.; Cheng, X.; Xu, Y.; Gao, S.; Zhao, H.; Huo, L.H. Hierarchical NiO cube/nitrogen-doped reduced graphene oxide composite with enhanced H2S sensing properties at low temperature. ACS Appl. Mater. Interfaces 2017, 9, 26293–26303. [Google Scholar] [CrossRef]
  5. Chen, Y.J.; Gao, X.M.; Di, X.P.; Ouyang, Q.Y.; Gao, P.; Qi, L.H.; Li, C.Y.; Zhu, C.L. Porous iron molybdate nanorods: In situ diffusion synthesis and low-temperature H2S gas sensing. ACS Appl. Mater. Interfaces 2013, 5, 3267–3274. [Google Scholar] [CrossRef]
  6. Kaur, M.; Jain, N.; Sharma, K.; Bhattacharya, S.; Roy, M.; Tyagi, A.K.; Gupta, S.K.; Yakhmi, J.V. Room-temperature H2S gas sensing at ppb level by single crystal In2O3 whiskers. Sens. Actuators B Chem. 2008, 133, 456–461. [Google Scholar] [CrossRef]
  7. Li, Z.; Wang, N.; Lin, Z.; Wang, J.; Liu, W.; Sun, K.; Fu, Y.Q.; Wang, Z. Room-temperature high-performance H2S sensor based on porous CuO nanosheets prepared by hydrothermal method. ACS Appl. Mater. Interfaces 2016, 8, 20962–20968. [Google Scholar] [CrossRef]
  8. Zhang, J.H.; Cai, G.F.; Zhou, D.; Tang, H.; Wang, X.L.; Gu, C.D.; Tu, J.P. Co-doped NiO nanoflake array films with enhanced electrochromic properties. J. Mater. Chem. C 2014, 2, 7013–7021. [Google Scholar] [CrossRef]
  9. Saito, N.; Haneda, H.; Sekiguchi, T.; Ohashi, N.; Sakaguchi, I.; Koumoto, K. Low-temperature fabrication of light-emitting zinc oxide micropatterns using self-assembled monolayers. Adv. Mater. 2002, 14, 418–421. [Google Scholar] [CrossRef]
  10. Yan, J.; Wei, T.; Qiao, W.M.; Shao, B.; Zhao, Q.K.; Zhang, L.J.; Fan, Z.J. Rapid microwave-assisted synthesis of graphene nanosheet/Co3O4 composite for supercapacitors. Electrochim. Acta 2010, 55, 6973–6978. [Google Scholar] [CrossRef]
  11. Ko, S.H.; Lee, D.; Kang, H.W.; Nam, K.H.; Yeo, J.Y.; Hong, S.J.; Grigoropoulos, C.P.; Sung, H.J. Nanoforest of hydrothermally grown hierarchical ZnO nanowires for a high efficiency dye-sensitized solar cell. Nano. Lett. 2011, 11, 666–671. [Google Scholar] [CrossRef]
  12. Magdalane, C.M.; Kaviyarasu, K.; Vijaya, J.J.; Jayakumar, C.; Maaza, M.; Jeyaraj, B. Photocatalytic degradation effect of malachite green and catalytic hydrogenation by UV–illuminated CeO2/CdO multilayered nanoplatelet arrays: Investigation of antifungal and antimicrobial activities. J. Photochem. Photobiol. B Biol. 2017, 169, 110–123. [Google Scholar] [CrossRef]
  13. Hunge, Y.M.; Yadav, A.A.; Kulkarni, S.B.; Mathe, V.L. A multifunctional ZnO thin film based devices for photoelectrocatalytic degradation of terephthalic acid and CO2 gas sensing applications. Sens. Actuators B Chem. 2018, 274, 1–9. [Google Scholar] [CrossRef]
  14. Shen, Y.B.; Wang, W.; Chen, X.X.; Zhang, B.Q.; Wei, D.Z.; Gao, S.L.; Cui, B.Y. Nitrogen dioxide sensing using tungsten oxide microspheres with hierarchical nanorod-assembled architectures by a complexing surfactant-mediated hydrothermal route. J. Mater. Chem. A 2016, 4, 1345–1352. [Google Scholar] [CrossRef]
  15. Chen, X.X.; Shen, Y.B.; Zhou, P.F.; Zhao, S.K.; Zhong, X.X.; Li, T.T.; Han, C.; Wei, D.Z.; Meng, D. NO2 sensing properties of one-pot-synthesized ZnO nanowires with Pd functionalization. Sens. Actuators B Chem. 2019, 280, 151–161. [Google Scholar] [CrossRef]
  16. Zhao, S.; Shen, Y.; Zhou, P.; Zhong, X.; Han, C.; Zhao, Q.; Wei, D. Design of Au@WO3 core–shell structured nanospheres for ppb-level NO2 sensing. Sens. Actuators B Chem. 2019, 282, 917–926. [Google Scholar] [CrossRef]
  17. Wang, L.; Lou, Z.; Deng, J.; Zhang, R.; Zhang, T. Ethanol gas detection using a yolk-shell (core-shell) α-Fe2O3 nanospheres as sensing material. ACS Appl. Mater. Interfaces 2015, 7, 13098–13104. [Google Scholar] [CrossRef] [PubMed]
  18. Zhao, S.; Shen, Y.; Yan, X.; Zhou, P.; Yin, Y.; Lu, R.; Han, C.; Cui, B.; Wei, D. Complex-surfactant-assisted hydrothermal synthesis of one-dimensional ZnO nanorods for high-performance ethanol gas sensor. Sens. Actuators B Chem. 2019, 273, 1278–1290. [Google Scholar] [CrossRef]
  19. Modaberi, M.R.; Rooydell, R.; Brahma, S.; Akande, A.A.; Mwakikunga, B.W.; Liu, C.P. Enhanced response and selectivity of H2S sensing through controlled Ni doping into ZnO nanorods by using single metal organic precursors. Sens. Actuators B Chem. 2018, 273, 1278–1290. [Google Scholar] [CrossRef]
  20. Wang, C.X.; Zeng, W.; Luo, L.J.; Zhang, P.G.; Wang, Z.C. Gas-sensing properties and mechanisms of Cu-doped SnO2 spheres towards H2S. Ceram. Int. 2016, 42, 10006–10013. [Google Scholar] [CrossRef]
  21. Zhang, H.J.; Meng, F.N.; Liu, L.Z.; Chen, Y.J. Convenient route for synthesis of alpha-Fe2O3 and sensors for H2S gas. J. Alloy. Compd. 2019, 774, 1181–1188. [Google Scholar] [CrossRef]
  22. Kim, J.H.; Mirzaei, A.; Zheng, Y.F.; Lee, J.H.; Kim, J.Y.; Kim, H.W.; Kim, S.S. Enhancement of H2S sensing performance of p-CuO nanofibers by loading p-reduced graphene oxide nanosheets. Sens. Actuators B Chem. 2019, 281, 453–461. [Google Scholar] [CrossRef]
  23. Shan, H.; Liu, C.; Liu, L.; Zhang, J.; Li, H.; Liu, Z.; Zhang, X.; Bo, X.; Chi, X. Excellent toluene sensing properties of SnO2–Fe2O3 interconnected nanotubes. ACS Appl. Mater. Interfaces 2013, 5, 6376–6380. [Google Scholar] [CrossRef] [PubMed]
  24. Shen, Y.B.; Bi, H.S.; Li, T.T.; Zhong, X.X.; Chen, X.X.; Fan, A.F.; Wei, D.Z. Low-temperature and highly enhanced NO2 sensing performance of Au-functionalized WO3 microspheres with a hierarchical nanostructure. Appl. Surf. Sci. 2018, 434, 922–931. [Google Scholar] [CrossRef]
  25. Shen, Y.B.; Chen, X.X.; Wang, W.; Gong, Y.; Chen, S.H.; Liu, J.T.; Wei, D.Z.; Meng, D.; San, X.G. Complexing surfactants-mediated hydrothermal synthesis of WO3 microspheres for gas sensing applications. Mater. Lett. 2016, 163, 150–153. [Google Scholar] [CrossRef]
  26. Shen, Y.B.; Wang, W.; Fan, A.F.; Wei, D.Z.; Liu, W.G.; Han, C.; Shen, Y.S.; Meng, D.; San, X.G. Highly sensitive hydrogen sensors based on SnO2 nanomaterials with different morphologies. Int. J. Hydrog. Energy 2015, 40, 15773–15779. [Google Scholar] [CrossRef]
  27. Deng, J.; Ma, J.; Mei, L.; Tang, Y.; Chen, Y.; Lv, T.; Xu, Z.; Wang, T. Porous α-Fe2O3 nanosphere-based H2S sensor with fast response, high selectivity and enhanced sensitivity. J. Mater. Chem. A 2013, 1, 12400–12403. [Google Scholar] [CrossRef]
  28. Li, Z.; Huang, Y.; Zhang, S.; Chen, W.; Kuang, Z.; Ao, D.; Liu, W.; Fu, Y. A fast response & recovery H2S gas sensor based on α-Fe2O3 nanoparticles with ppb level detection limit. J. Hazard. Mater. 2015, 300, 167–174. [Google Scholar] [PubMed]
  29. Li, Z.; Lin, Z.; Wang, N.; Huang, Y.; Kuang, Z.; Liu, W.; Fu, Y.; Zhang, Z. Facile synthesis of α-Fe2O3 micro-ellipsoids by surfactant-free hydrothermal method for sub-ppm level H2S detection. Mater. Des. 2016, 110, 532–539. [Google Scholar] [CrossRef]
  30. Liu, C.; Gao, H.; Wang, L.; Wang, T.; Yang, X.; Sun, P.; Gao, Y.; Liang, X.; Liu, F.; Song, H.; et al. Facile synthesis and the enhanced sensing properties of Pt-loaded α-Fe2O3 porous nanospheres. Sens. Actuators B Chem. 2017, 252, 1153–1162. [Google Scholar] [CrossRef]
  31. Wang, Y.; Kong, F.; Zhu, B.; Wang, S.; Wu, S.; Huang, W. Synthesis and characterization of Pd-doped α-Fe2O3 H2S sensor with low power consumption. Mater. Sci. Eng. B 2007, 140, 98–102. [Google Scholar] [CrossRef]
  32. Wang, Y.; Wang, Y.; Cao, J.; Kong, F.; Xia, H.; Zhang, J.; Zhu, B.; Wang, S.; Wu, S. Low-temperature H2S sensors based on Ag-doped α-Fe2O3 nanoparticles. Sens. Actuators B Chem. 2008, 131, 183–189. [Google Scholar] [CrossRef]
  33. Balouria, V.; Ramgir, N.S.; Singh, A.; Debnath, A.K.; Mahajan, A.; Bedi, R.K.; Aswal, D.K.; Gupta, S.K. Enhanced H2S sensing characteristics of Au modified Fe2O3 thin films. Sens. Actuators B Chem. 2015, 219, 125–132. [Google Scholar] [CrossRef]
  34. Giebelhaus, I.; Varechkina, E.; Fischer, T.; Rumyantseva, M.; Ivanov, V.; Gaskov, A.; Morante, J.R.; Arbiol, J.; Tyrra, W.; Mathur, S. One-dimensional CuO–SnO2 p–n heterojunctions for enhanced detection of H2S. J. Mater. Chem. 2013, 1, 11261–11268. [Google Scholar] [CrossRef]
  35. Chen, H.D.; Jin, K.L.; Wang, P.F.; Xu, J.C.; Han, Y.B.; Jin, H.X.; Jin, D.F.; Peng, X.L.; Hong, B.; Li, J.; et al. Highly enhanced gas-sensing properties of indium-doped mesoporous hematite nanowires. J. Phys. Chem. Solids 2018, 120, 271–278. [Google Scholar] [CrossRef]
  36. Zhang, B.; Liu, G.; Cheng, M.; Gao, Y.; Zhao, L.; Li, S.; Liu, F.; Yan, X.; Zhang, T.; Sun, P.; et al. The preparation of reduced graphene oxide-encapsulated α-Fe2O3 hybrid and its outstanding NO2 gas sensing properties at room temperature. Sens. Actuators B Chem. 2018, 261, 252–263. [Google Scholar] [CrossRef]
  37. Chen, X.X.; Shen, Y.B.; Zhang, W.; Zhang, J.; Wei, D.Z.; Lu, R.; Zhu, L.J.; Li, H.S.; Shen, Y.S. In-situ growth of ZnO nanowire arrays on the sensing electrode via a facile hydrothermal route for high-performance NO2 sensor. Appl. Surf. Sci. 2018, 435, 1096–1104. [Google Scholar] [CrossRef]
  38. Yang, X.L.; Zhang, S.F.; Yu, Q.; Zhao, L.P.; Sun, P.; Wang, T.S.; Liu, F.M.; Yan, X.; Gao, Y.; Liang, X.S.; et al. One step synthesis of branched SnO2/ZnO heterostructures and their enhanced gas-sensing properties. Sens. Actuators B Chem. 2019, 281, 415–423. [Google Scholar] [CrossRef]
  39. Ding, J.; Zhong, Q.; Zhang, S. Simultaneous removal of NOX and SO2 with H2O2 over Fe based catalysts at low temperature. RSC Adv. 2014, 4, 5394–5398. [Google Scholar] [CrossRef]
  40. Li, Z.; Yi, J.X. Synthesis and enhanced NO2-sensing properties of ZnO-decorated SnO2 microspheres. Mater. Lett. 2019, 236, 570–573. [Google Scholar] [CrossRef]
  41. Musić, S.; Ristić, M. Adsorption of Zinc (II) on hydrous iron oxides. J. Radioanal. Nucl. Chem. 1992, 162, 351–362. [Google Scholar] [CrossRef]
  42. Krehula, S.; Musić, S.; Skoko, Ž.; Popović, S. The influence of Zn-dopant on the precipitation of α-FeOOH in highly alkaline media. J. Alloy Comp. 2006, 420, 260–268. [Google Scholar] [CrossRef]
  43. Wang, Z.; Fan, X.; Han, D.; Gu, F. Structural and electronic engineering of 3DOM WO3 by alkali metal doping for improved NO2 sensing performance. Nanoscale 2016, 8, 10622–10631. [Google Scholar] [CrossRef] [PubMed]
  44. Shen, J.; Guo, S.; Chen, C.; Sun, L.; Wen, S.; Chen, Y.; Ruan, S. Synthesis of Ni-doped α-MoO3 nanolamella and their improved gas sensing properties. Sens. Actuators B Chem. 2017, 252, 757–763. [Google Scholar] [CrossRef]
  45. Zhou, Q.; Xu, L.N.; Umar, A.; Chen, W.G.; Kumar, R. Pt nanoparticles decorated SnO2 nanoneedles for efficient CO gas sensing applications. Sens. Actuators B Chem. 2018, 256, 656–664. [Google Scholar] [CrossRef]
  46. Zhao, S.; Shen, Y.; Zhou, P.; Li, G.; Han, C.; Wei, D.; Zhong, X.; Zhang, Y.; Ao, Y. Influence of synthesis conditions on microstructure and NO2 sensing properties of WO3 porous films synthesized by non-hydrolytic sol–gel method. Nanomaterials 2019, 9, 8. [Google Scholar] [CrossRef] [PubMed]
  47. Zhao, S.; Shen, Y.; Zhou, P.; Zhang, J.; Zhang, W.; Chen, X.; Wei, D.; Fang, P.; Shen, Y. Highly selective NO2 sensor based on p-type nanocrystalline NiO thin films prepared by sol–gel dip coating. Ceram. Int. 2018, 44, 753–759. [Google Scholar] [CrossRef]
Figure 1. Schematic diagram of (a) the preparation process of Fe source solution and (b) preparation process of Zn-doped α-Fe2O3 nanowires.
Nanomaterials 09 00994 g001
Figure 2. Structure schematic of a typical gas sensor.
Nanomaterials 09 00994 g002
Figure 3. XRD patterns of pure α-Fe2O3, 1% Zn-doped α-Fe2O3, and 3% Zn-doped α-Fe2O3 in the 2θ range of (a) 20–80° and (b) 30–40°.
Nanomaterials 09 00994 g003
Figure 4. SEM images of α-Fe2O3 prepared with different Zn/Fe molar ratios. (a,b) are pure α-Fe2O3. (c,d) are 1% Zn-doped α-Fe2O3. (e,f) are 3% Zn-doped α-Fe2O3.
Nanomaterials 09 00994 g004
Figure 5. (a) High-magnification and (b) low-magnification TEM images of 1% Zn-doped α-Fe2O3 nanowires. (c) HRTEM image of 1% Zn-doped α-Fe2O3 nanowires. (d) SAED pattern of 1% Zn-doped α-Fe2O3 nanowires.
Nanomaterials 09 00994 g005
Figure 6. XPS spectra of 1% Zn-doped α-Fe2O3 nanowires. (a) Fe 2p spectrum. (b) Zn 2p spectrum. (c) O 1s spectrum.
Nanomaterials 09 00994 g006
Figure 7. Schematic diagram of the formation process of Zn-doped α-Fe2O3 nanowires.
Nanomaterials 09 00994 g007
Figure 8. (a) Response and (b) response and recovery times of 1% Zn-doped α-Fe2O3 nanowires upon exposure to 5 ppm H2S at different operating temperatures.
Nanomaterials 09 00994 g008
Figure 9. Responses of 1% Zn-doped α-Fe2O3 nanowires upon exposure to various H2S concentrations at the operating temperature of 175 °C.
Nanomaterials 09 00994 g009
Figure 10. (a) Dynamic response and recovery curves of 1% Zn-doped α-Fe2O3 nanowires upon exposure to 5 ppm H2S for five cycles at the operating temperature of 175 °C. (b) Long-term stability of the sensor based on 1% Zn-doped α-Fe2O3 nanowires upon exposure to 5 ppm H2S at the operating temperature of 175 °C.
Nanomaterials 09 00994 g010
Figure 11. Responses of 1% Zn-doped α-Fe2O3 nanowires upon exposure to different gases at the operating temperature of 175 °C.
Nanomaterials 09 00994 g011
Table 1. Comparison between different α-Fe2O3 based H2S sensors. (C(H2S): H2S concentration; Top: operating temperature of the sensor; Tres/Trec: response time/recovery time; DL: detection limit; Ref: references).
Sensing MaterialsC(H2S)TopRTres/TrecDL (ppm)Ref
α-Fe2O3 nanospheres10228652 s/-1 ppm[27]
α-Fe2O3 nanoparticles103005.530/5 s0.05[28]
α-Fe2O3 micro-ellipsoids10350380/7 s (0.5 ppm)0.5[29]
Pt:α-Fe2O310160147.5-/--/-[30]
Pd:α-Fe2O31016046.6-/-10[31]
Ag:α-Fe2O310016022042/26 s60[32]
Au:α-Fe2O3102506.41.65/27 min1[33]
α-Fe2O3 nanowires517523.516/174 s0.05This work

