Article

Understanding the Role of Rutile TiO2 Surface Orientation on Molecular Hydrogen Activation

1
Sorbonne Université, CNRS, Laboratoire de Chimie Théorique, LCT, F. 75005 Paris, France
2
General Chemistry (ALGC), Materials Modelling Group, Vrije Universiteit Brussel (Free University Brussels-VUB), Pleinlaan 2, 1050 Brussel, Belgium
*
Author to whom correspondence should be addressed.
Nanomaterials 2019, 9(9), 1199; https://doi.org/10.3390/nano9091199
Submission received: 23 June 2019 / Revised: 10 August 2019 / Accepted: 16 August 2019 / Published: 26 August 2019

Abstract

:
Titanium oxide (TiO2) has been widely used in many fields, such as photocatalysis, photovoltaics, catalysis, and sensors, where its interaction with molecular H2 with TiO2 surface plays an important role. However, the activation of hydrogen over rutile TiO2 surfaces has not been systematically studied regarding the surface termination dependence. In this work, we use density functional theory (PBE+U) to identify the pathways for two processes: the heterolytic dissociation of H2 as a hydride–proton pair, and the subsequent H transfer from Ti to near O accompanied by reduction of the Ti sites. Four stoichiometric surface orientations were considered: (001), (100), (110), and (101). The lowest activation barriers are found for hydrogen dissociation on (001) and (110), with energies of 0.56 eV and 0.50 eV, respectively. The highest activation barriers are found on (100) and (101), with energies of 1.08 eV and 0.79 eV, respectively. For hydrogen transfer from Ti to near O, the activation barriers are higher (from 1.40 to 1.86 eV). Our results indicate that the dissociation step is kinetically more favorable than the H transfer process, although the latter is thermodynamically more favorable. We discuss the implications in the stability of the hydride–proton pair, and provide structures, electronic structure, vibrational analysis, and temperature effects to characterize the reactivity of the four TiO2 orientations.

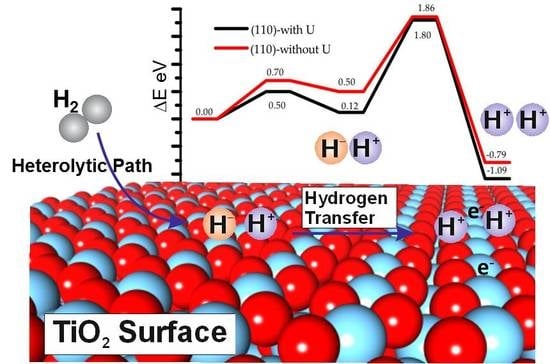
Graphical Abstract

1. Introduction

Titanium oxide (TiO2) has been widely used in numerous fields, from everyday applications (paint, inks, toothpaste, makeup) to technological devices, such as dye-sensitized solar cells (DSSCs) [1,2], photoelectrochemical cells [3], photocatalysts [4], catalysis [5,6], sensors [7,8], biomedical treatments [9], lithium ion batteries [10], or photovoltaics [11,12]. The interaction of hydrogen with TiO2 surfaces plays an important role in many reaction processes [13,14,15,16,17,18,19,20] and has been widely studied [21,22,23,24,25,26,27]. Despite the high interest generated by hydrogen-titania interfaces, the nature of the species involved is still poorly understood—protons are generally reported as being stable in hydrogenated rutile (110) [28], atomic surface hydrogen has been found to prevent electron-hole recombination on an Au-TiO2 photocatalyst [14], and very recently hydride species have been characterized as being stable on its surface [29,30]. In this work, we investigate the role of the surface termination in the H2 dissociation and migration on rutile surfaces. We focus on the characterization of the stability of surface Ti-H species formed by interaction with H2 and their subsequent transfer to neighboring oxygen sites in order to provide a comprehensive picture of the adsorption, desorption, and diffusion mechanisms occurring at H-TiO2 interfaces.
In recent years, H2 dissociation over metal oxides has attracted great interest [31,32,33,34,35,36,37,38]. Two main mechanisms are proposed: homolytic and heterolytic dissociation [39]. It is widely thought that non-reducible metal oxides follow the heterolytic pathway forming MH/OH pairs, while reducible metal oxides proceed homolytically forming OH/OH pairs together with the metal site reduction. However, in recent years deviations from this rule have been proposed to explain experimental observations. Thus, García-Melchor et al. and Fernandez-Torre et al. reported that H2 dissociation on CeO2 (111) follows a heterolytic path, with H being transferred from Ce to a neighboring O, generating the homolytic product [34,40]. Chen and Pacchioni reported that on nanostructured MgO (001), the dissociation pathway depends on the choice of the support—on MgO/Ag (001), the heterolytic pathway is preferred, while with Au support, it follows the homolytic dissociation [31]. Very recently, Liu et al. reported the surface characteristics of anatase TiO2 after reduction with H2. In their study, they proposed that H2 can dissociate on oxygen vacancies—one H atom binds with a Ti to form the Ti-H bond, whereas the other one bonds with O to form Ti–OH [41]. Moreover, Hu et al. reported H2 dissociation on three TiO2 polymorphs [35], which showed that homolytic activation barriers are all high (1.48–1.68 eV), with rutile showing the highest activity.
It is well known that the surface properties strongly vary with different crystallographic orientations, which can greatly affect their reactivity [42,43,44,45,46]. For rutile TiO2, the main exposed low energy surface is the (110) surface, which is also the most studied [23,28,47,48,49,50,51]. There are also other terminations of rutile TiO2 that are experimentally accessible, such as (100) facet [52,53,54,55], (001) facet [56,57,58,59,60,61,62], (101) facet [8,60,63,64], and (011) facet [65,66,67]. Herein, we systematically study the hydrogen dissociation over four rutile TiO2 facets (001), (100), (110), and (101) by using density functional theorywith PBE+U(Perdew–Burke–Erzenhof functional with the Hubbard U correction). We consider a two-step mechanism for H2 dissociation: first, heterolytic dissociation to form TiH/OH pairs, and second, H transfer from Ti to O to form OH, accompanied by a two-electron transfer of the hydride to the Ti sites. We provide the structures of the reaction intermediates, the energetic profile of the two steps, the electronic structure of the systems involved, and the temperature effects to evaluate the barriers at room temperature for stoichiometric slab models. Vibrational frequencies for TiH and OH are also reported as a guide to identify relevant species on the different terminations.

2. Materials and Methods

Density functional theory (DFT) calculations were performed using the Vienna ab initio simulation package (VASP) version 5.4.4 [68]. Projector-augmented wave (PAW) pseudopotential was used to describe the core electron representation with 1, 4, and 6 valence electrons for H, Ti, and O, respectively [69,70]. The generalized gradient approximation (GGA) approach was used for the exchange and correlation potential with the Perdew–Burke–Erzenhof (PBE) functional [71,72]. The GGA+U approach of Dudarev et al. was used to treat the 3d orbital electrons of Ti with the effective Hubbard on-site Coulomb interaction parameter (U’ = U − J) [73]. We chose U’ = 4 according to the proposed value from previous works [24,28,74], referred herein as U. A 400 eV cutoff energy for the plane-wave basis set was found to correctly treat the rutile surface [28]. The dissociation of hydrogen on rutile TiO2 surfaces was investigated in the 1 × 1 unit cell for (001), (100), and (101) and in the 2 × 2 unit cell for the (110) surface. The open shell systems were treated with spin polarized calculations. The energy convergence was set to 3.0 × 10⁻² eV for the ionic loop and 1.0 × 10⁻⁴ eV for the electronic loop. The slab models were cut from the optimized structure of bulk rutile (Figure 1). A vacuum layer of 20 Å was employed. The slab thickness used is given in Table 1. The lower-half layers of the slab were kept frozen and the upper-half layers were allowed to relax. We used the Monkhorst−Pack scheme to sample the Brillouin zone, and the distance between each k-point was 0.033 Å−1 [18,35]. The constrained minimization and climbing-image nudged elastic band (CI-NEB) methods were used to locate transition states (TS) [75,76]. In this work, the minimum energy pathway for each elementary reaction was discretized by a total of four images between the initial and final states. The imaginary frequency of every transition state was checked to connect initial and final states. The zero point energy (ZPE) vibration energy was calculated from vibrational frequencies as one-half of the sum of real-valued harmonic vibrational frequencies [77].
We also consider the effect of temperature by calculating the Gibbs free energy at room temperature (298 K); in the solid system, the pressure volume term pV can be ignored, thus:
G(T) = HTS = U + pVTSU(T) − TS(T)
It is reasonable to only consider the vibrational contributions, therefore:
U(T) = EDFT + EZPE + Uvib(T)
S(T) = Svib(T)
For vibrational spectra, the density-functional perturbation theory (DFPT) linear response approach was used [78,79]. The matrix of Born effective charges (BEC) is obtained and indicates the change of involved atom’s polarizabilities. The infrared intensity can be described as in the following formula containing Born effective charges and the eigenvectors e β ( s | υ ) :
f ( υ ) = α | s β Z α β ( s ) e β ( s | υ ) | 2
where α and β are Cartesian polarization, e β ( s | υ ) indicates the normalized vibrational eigenvector, and Z α β indicates the effective charge tensor. To assess how the frequencies obtained depend on the computational setting, the performance of four different density functionals (PBE, Local Density Approximation (LDA), Perdew-Wang (PW91), Perdew-Burke-Ernzerhof revised for solids (PBESOL)), cut-off (300, 400, 500, 600, and 700 eV), choice of U (3, 4, 5, 6, and 7 eV), and the inclusion of dipole corrections were tested (see Supplementary Tables S1–S4 and Figures S7–S10). Although the numerical values are affected by computational settings, the trends between the different orientations are maintained.
Dispersion effects were evaluated for the heterolytic path for the intermediates and TS1 (the latter as a single-point calculation) by means of dispersion corrections (Grimme D3) (zero) [80] and the results are displayed in Supplementary Table S7 and Figure S12. Dispersion corrections were found to slightly stabilize adsorbates with respect to the non-corrected calculation and significantly decrease the barriers. However, they did not significantly alter the trends of the terminations, nor the vibrational frequencies (Supplementary Table S7 and Figure S12).
No dipole correction was used to account for the asymmetry of the slabs in the perpendicular direction. As our work is mainly based on the comparison of terminations, and as all of them should be affected in a similar manner by the spurious dipole, we do not expect it to have a significant impact on the conclusions. As can be seen in Supplementary Table S6 and Figure S11, the inclusion of dipole corrections did not have a significant effect in the vibrational frequencies.

Slab Model

We optimized the bulk TiO2 rutile unit cell obtaining values of a = b = 4.661 Å and c = 2.961 Å, in agreement with experimental parameters of a = 4.593 Å and c = 2.958 Å [23]. The calculated lattice parameters for bulk rutile TiO2 were overestimated by 1.46% for a and only 0.10% for c with respect to the experimental value, and the optimized values were used to build the slab models.
The four rutile TiO2 surface (001), (100), (110), and (101) stoichiometric terminations are represented in Figure 1 and the main structural parameters are reported in Table 1. As we can see, the facets (001) and (110) are roughly flat, while (100) and (101) facets are uneven. On the surfaces, the coordination number of titanium sites vary from 4 to 6(001) has only Ti4C; (101) possesses Ti4C and Ti5C; (100) has only Ti5C; and (110) has Ti5C and Ti6C. Regarding oxygen, the surface coordination varies from two- to three-fold—(001) has only O2C, while the other three exhibit O2C and O3C. The surface energy Esurf, calculated as the difference in energy between the slab and the bulk divided by twice the area, follows the trend of coordination—the lower the surface atomic coordination, the higher the surface energy. Thus, (001), where Ti and O are poorly coordinated, shows Esurf 1.30 J nm−2, whereas (110), where the atoms are more coordinated, shows Esurf 0.55 J nm−2.

3. Results and Discussion

3.1. H2 Dissociation

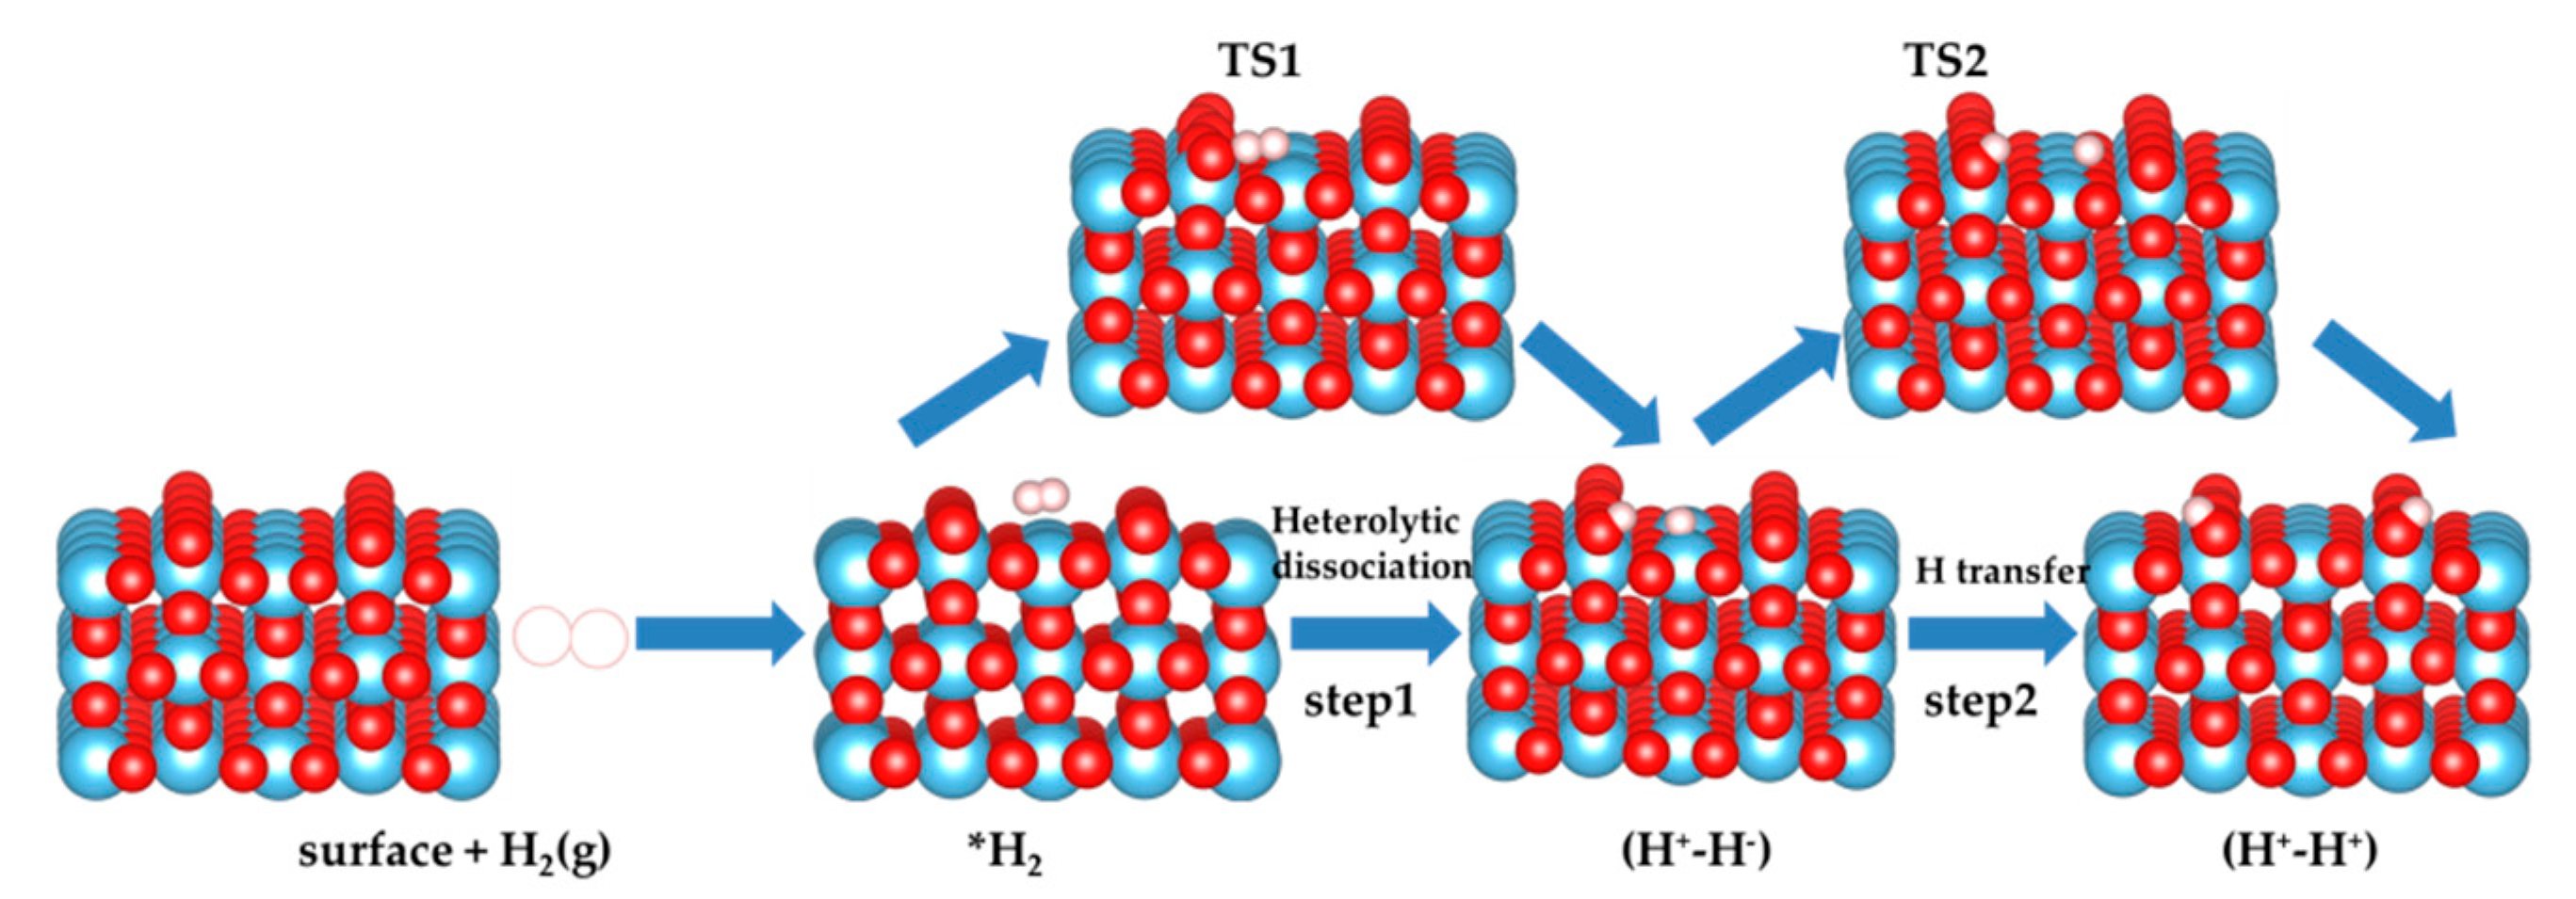
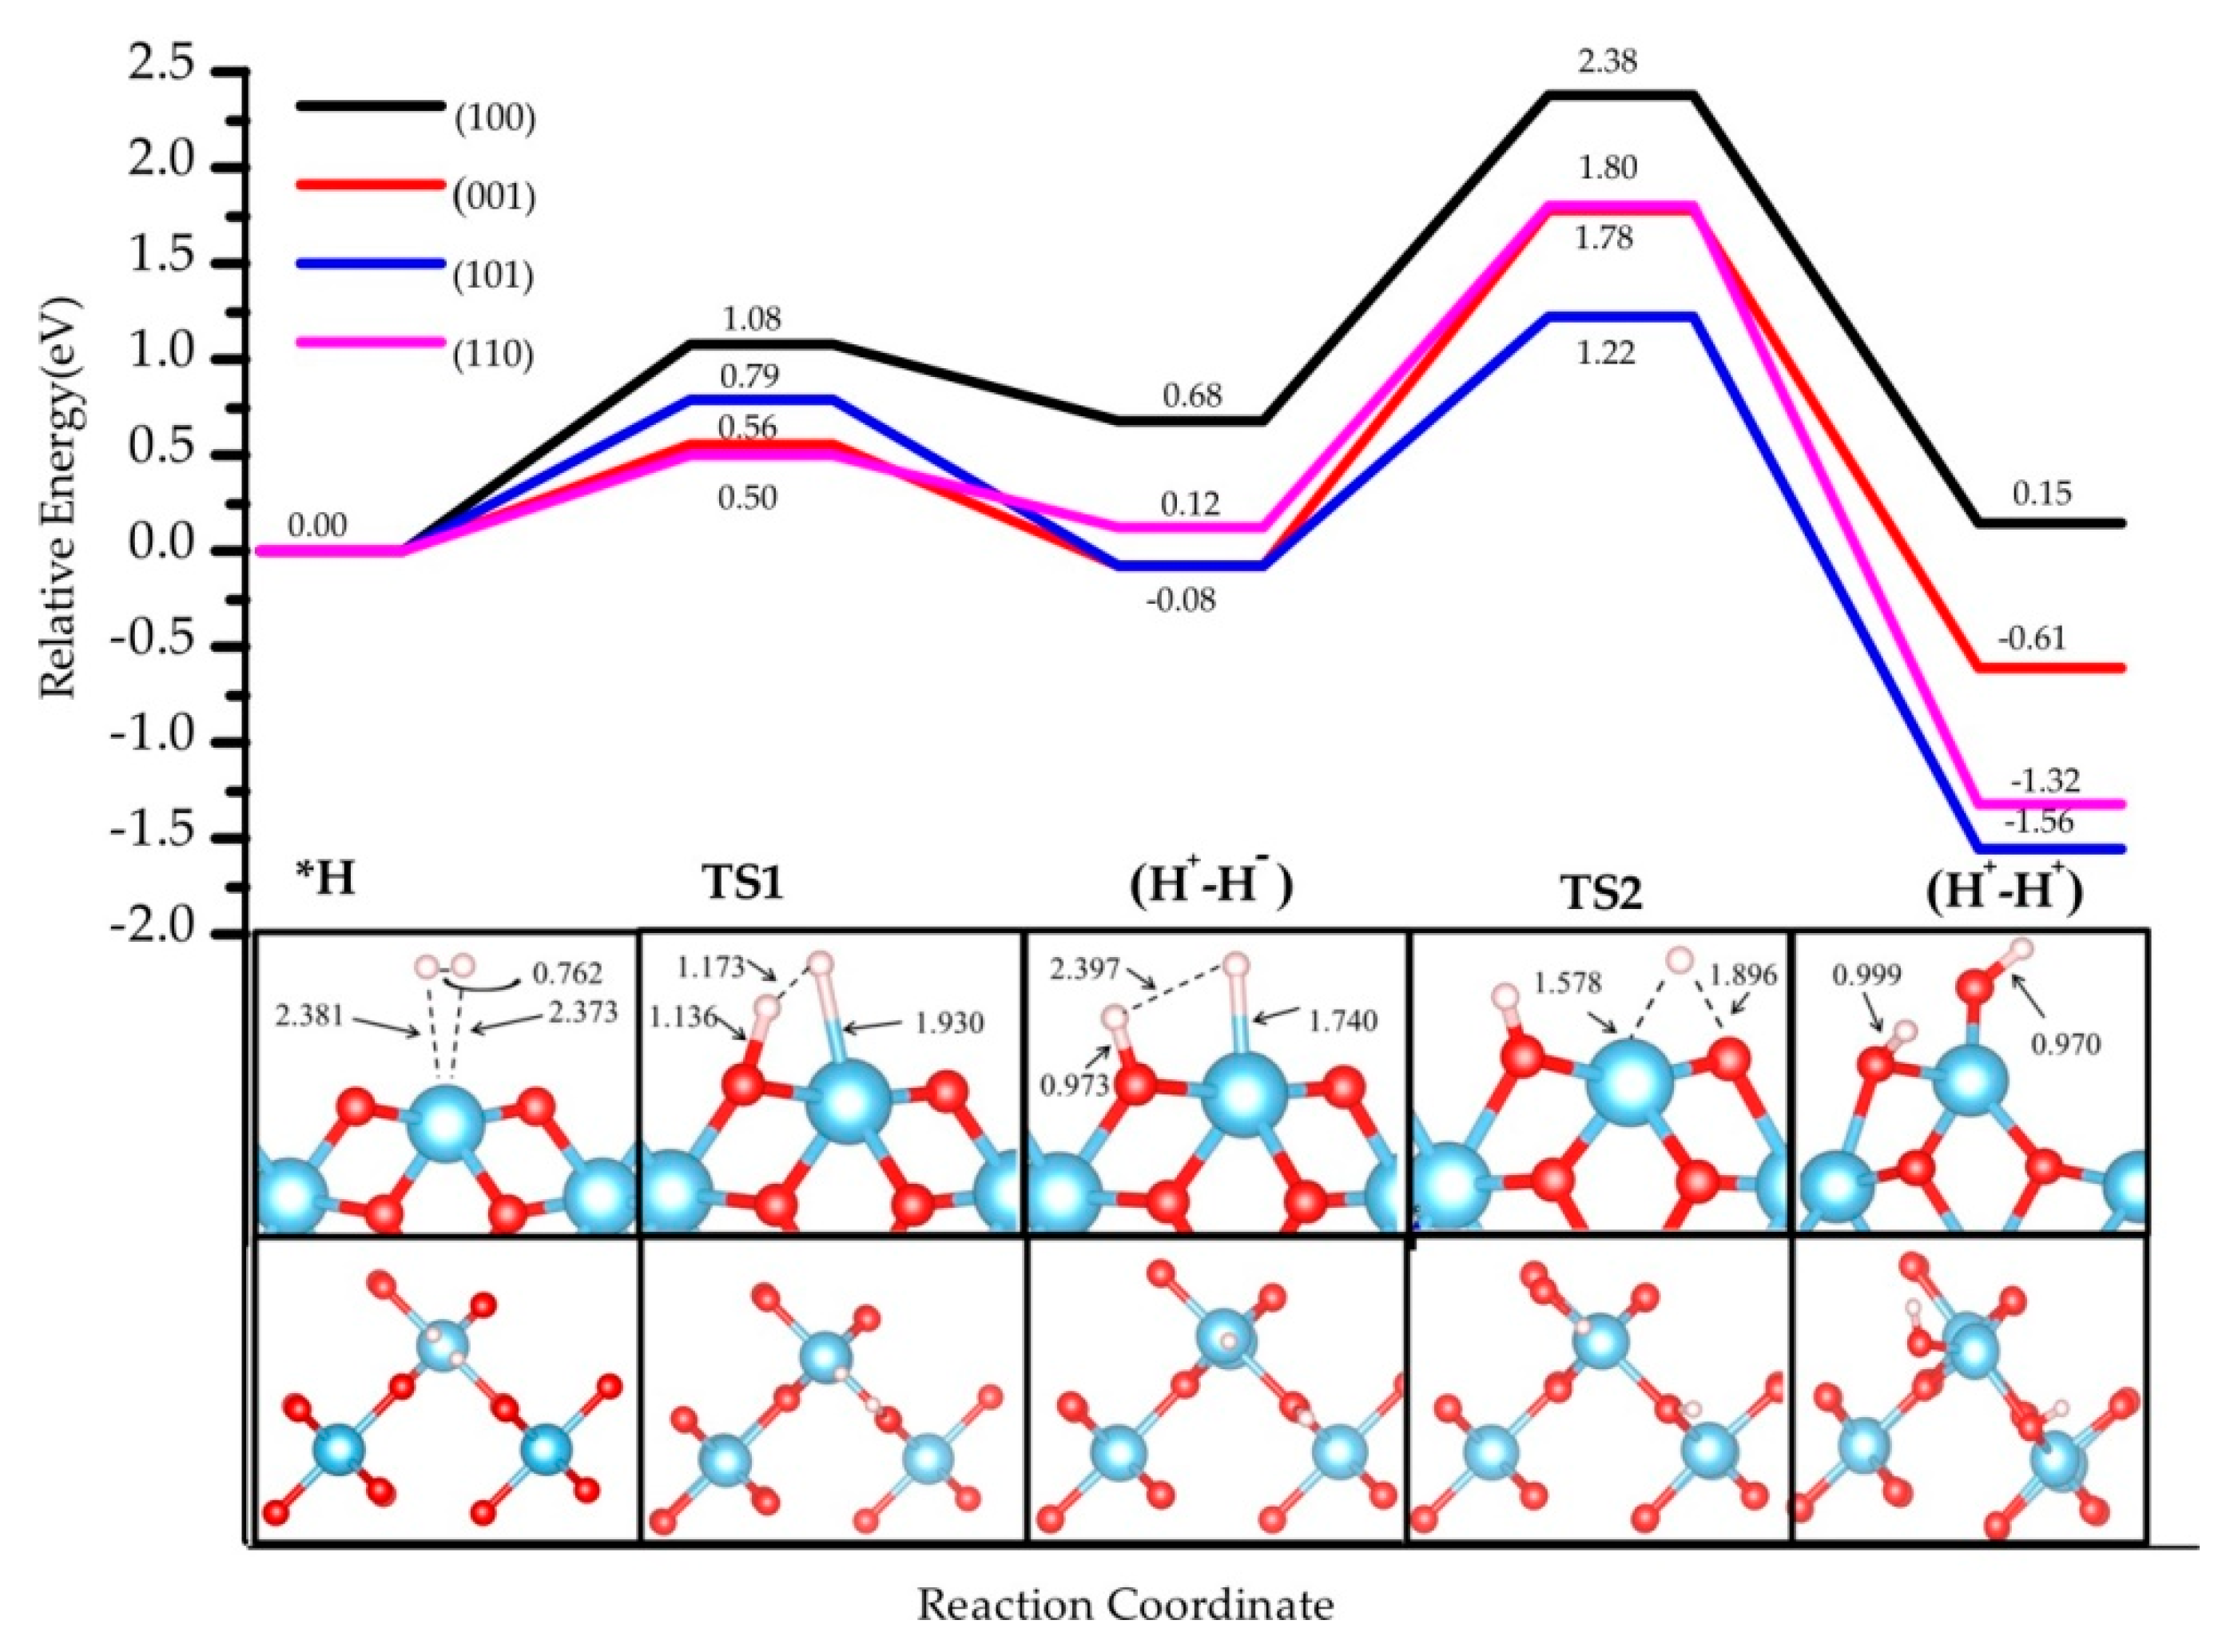
Firstly we investigated the heterolytic pathway for H2 dissociation on the four selected rutile TiO2 selected. In the first step, the H2 molecule physisorbs on the surface forming the adduct H2*. Then, the heterolytic H2 dissociation takes place between the Ti site and a neighboring O atom through a transition structure (TS1), generating a pair of O−H and Ti−H bonds (H+-H species). The second step involves the transfer of the hydride (H) on the Ti site to a nearby O, leading to 2 O-H hydroxyl groups (H+-H+) and a two-electron transfer to surface titanium sites that become reduced. The transition state associated with this step is labeled as TS2. The reaction pathway involving these two steps is schematized in Figure 2, and the calculated energies are reported in Table 2. The energy profile of H2 dissociation over the four surfaces is shown in Figure 3.
Here, all adsorption energies are referred to the energy of physisorbed TiO2-H2. The path for the TiO2 (001) surface is illustrated, and those corresponding to the other three terminations are provided in Supplementary Figures S1–S3. Several pathways were considered involving different surface sites. For the heterolytic step, on (001) there is a unique possible pathway with only one kind of O2c site and one Ti4c site on the surface. On (100), besides the pathway reported in Supplementary Figure S1, there is also one additional combination of Ti5C and O2C sites (Supplementary Figure S6a), in which the direction of the OH bond is almost perpendicular to the direction of the TiH bond, which makes this combination less stable than the one selected. For (101), two other possible structures involving Ti5C and O2C (Supplementary Figure S6b) and Ti4C and O3C (Supplementary Figure S6c) resulted in less stable systems than the one retained. The model structures retained are stabilized as a consequence of the saturation of poorly coordinated sites of Ti4C, Ti5C, and O2C upon hydrogenation, and in some cases the formation of hydrogen bonds.
The stability of the (H+, H) intermediate is slightly exothermic for the (001) and (101) terminations (−0.08 eV), whereas it is slightly endothermic for the (110) by 0.12 eV, and for the (100) by 0.68 eV. Hydrogen bonds between TiH and OH species form in all the terminations except (101). Whereas the terminations showing the poorest coordination exhibit the most exothermic adsorption energy for the (H+, H) intermediate, the most highly coordinated slabs show less exothermic values. However, the most highly coordinated (110) slab exhibits a significantly lower adsorption energy than (100). The activation barriers of heterolytic H2 dissociation on the four TiO2 surfaces follow the trend (110) 0.50 eV < (001) 0.56 eV < (101) 0.79 eV < (100) 1.08 eV. As for the adsorption energy, a trend appears between coordination and kinetic barriers for (001), (101), and (100), whereas (110) presents lower values than expected (its higher coordination should lead to the most endothermic values). Our results are consistent with previous studies. For the (001) surface, our activation energy (0.56 eV) is consistent with the one reported previously (0.68 eV) [14]. The difference comes from the use of a different Hubbard parameter (U = 7 eV) and unit cell (2 × 1). Our activation energy for the (110) surface, 0.50 eV, is larger than the 0.37 eV reported for a much narrower slab (3-TiO2-layer thick slab model [34]), highlighting the important role of slab thickness in the construction of a model.
According to our results, the (H+, H) intermediate is more likely to be formed on (001) and (101) terminations, however the poor stability and the low barriers could induce the inverse reaction, i.e., the recombination and desorption as H2 (see below). These results suggest that the rutile TiO2 (001) exhibits the most likely H2 heterolytic dissociation path in the series, with the lowest activation energy and a slight stabilization of the product. This specific reactivity could be associated with the low coordination of the surface titanium site—the four-fold coordinated Ti site in the (001) termination stabilizes the hydride Ti-H species to increase the number of neighbors. In the transition structure 1 (TS1) displayed in Figure 3, the Ti-H distance is 1.93 Å (1.74 Å in the intermediate), and the species appears in interaction with the OH group (H-H distance of 1.17 Å) with an imaginary frequency of 992.39 cm−1. The charge density difference analysis shows that there exists a tight ion pair in TS1 where the H on Ti gains electronic density and the H on O is deprived, forming a H+-H pair (Figure 4). This is consistent with a moderate polarization of the H2 moiety, as shown in the Bader analysis discussed below. In this TS1 structure, the four atoms involved Ti-H…H-O are coplanar.
For the other three facets, similar structures are found for TS1 involving coplanar Ti-H…O-H geometries. For the (100) termination, the transition state of this dissociation process shows −1106.91 cm−1 Ti-H vibration mode, with 1.83 Å for Ti−H and 1.10 Å for the H-H distance. For the (110) and (101) facets, the Ti-H vibration modes are −704.20 cm−1 and −1289.80 cm−1, respectively. The Ti-H bond distances are both 1.95 Å, and the O-H distances are 1.22 Å and 1.33 Å, respectively.
The second step in the mechanism is the transfer of the H on the Ti site to the nearest two-fold-coordinated O site, finally yielding two hydroxyls on the surface and a reduction of the Ti sites. The final products (H+-H+) are thermodynamically the most stable ones in the path: (001) −0.61 eV, (110) −1.56 eV, (101) −1.09 eV, and (100) 0.15 eV. H-bonds are formed in some of the structures, which results in larger stabilization. In the cases of (001) and (100), the final products involve a rearrangement of the surface bonds—a Ti-O-Ti breaks to form a Ti-OH moiety. The activation barriers are significantly higher than for the first step, ranging from 1.30 to 1.80 eV. These results indicate an unfavorable evolution to the homolytic product from the heterolytic intermediate. Thus, the hydride TiH species could be kinetically stabilized on TiO2 surfaces with a possible recombination to regenerate and desorb H2 at low temperatures, whereas the reduction step would require much higher energies to occur. Nevertheless, the most thermodynamically stable product is found for step 2 and involves the presence of two hydroxyl groups and two Ti3+ sites; the latter originate from the electron transfer from the hydride to two titanium sites. This transfer results in open-shell systems that can be characterized by the presence of two unpaired electrons.
We have looked for correlations between adsorption energy, barrier heights, and geometry (TiH, HH, and OH distances), as well as Bader charges in TSs, and our results indicate no clear relationship. This is very interesting, as for CeO2 those correlations do appear [81]. This might point to an ionocovalent character of Ti-O bond compared to the more ionic Ce-O bond, which would facilitate the formation of the H+-H ionic pair, or to the important role of the local topology in stabilizing intermediates and transition structures. As a general trend, the activation barriers seem related to the coordination numbers of Ti and O on the surfaces, with the (110) termination behaving in a different way than is expected from its highly coordinated surface sites.

3.2. Electronic Structure

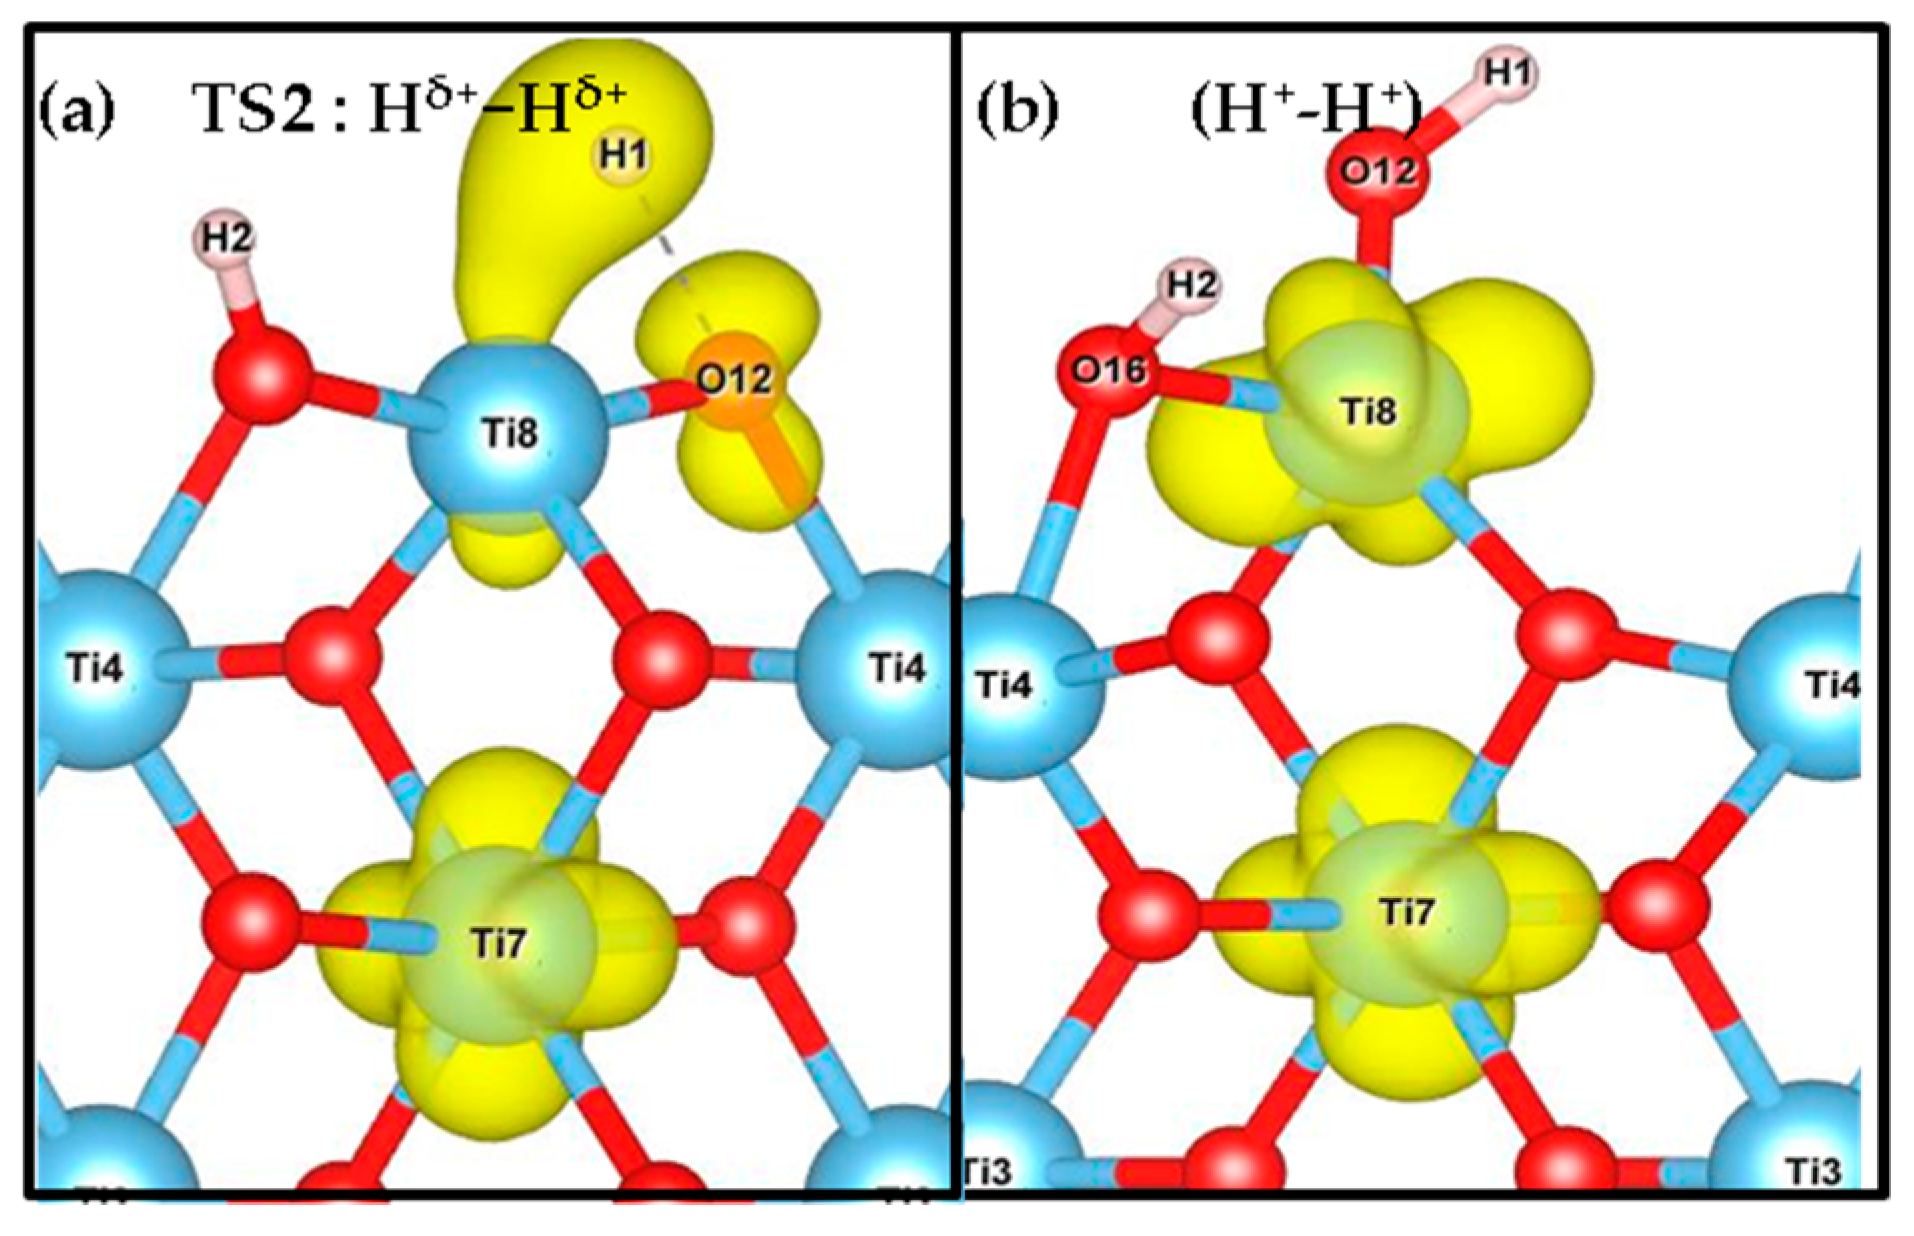
In order to characterize in more detail the electronic structure of the structures involved in the hydrogenation mechanisms, we have computed the density of states (DOS); Figure 5 and Supplementary Figure S4) for step 1 and step 2 of the four terminations considered. As unpaired electrons are involved, especially in H transfer process step 2, spin up and spin down are represented. The features of these four facets are similar and only the (001) and (100) facets are displayed in Figure 5. The other two facets are shown in Supplementary Figure S4. At the bottom of the plot a hydrogen molecular band appears as a sharp narrow peak in the valence region due to H2 physical adsorption. In TS1, we observe a splitting in two bands associated with H+ and H species that overlap with the slab levels. For the product of heterolytic dissociation (H+-H), the H band is the highest occupied energy level, with a sharp peak at the Fermi level. For the TS2 of subsequent H transfer from Ti to nearby O, there still exists one H+ band and one H band, but the intensity decreases. The existence of wide, weak peaks in the gap indicates an early reduction of the Ti site in TS2 on (100) and (110) facets, while no corresponding peak appears on (001) and (101). For the H transfer process product (H+-H+) species, we observe the H+ levels corresponding to OH groups in O-H bonds in the valence band, which appear as two distinct peaks if they correspond to inequivalent hydroxyl groups. Also, Ti states appear in the gap below the Fermi level, indicating the reduction of the Ti sites. This is consistent with the picture of the spin density plots (Figure 6 and Supplementary Figure S5), indicating that the unpaired electrons from the hydride transfer are trapped by two Ti ions that get reduced, confirming the nature of Ti3+ sites. Note that the approach used in the present work does not allow one to state unambiguously which Ti sites are reduced—it only confirms qualitatively that two distinct Ti sites are involved.
Bader charge analysis [82] was carried out to complement the characterization of the electronic structure of the systems studied. In Table 3, we can follow the electronic charges during the two processes, whereas Table 4 shows the Bader analysis for the spin density. In step 1, the adsorbed hydrogen species shows a slightly polarized H-H bond. In TS1, the H-H bond is more polarized, generating a tight ion pair with charges in the range 0.35-0.48 |e| for the H+ and −0.31 to −0.41 |e| for the H species. The intermediate (H+, H) species is characterized by charges in the range 0.65–0.70 |e| and −0.30 to −0.41 |e| for H+ and H, respectively. Moreover, the oxygen involved in this hydrogen transfer process shows electron gain of about +0.15–0.30|e| compared to the same O in the slab. The Bader charge of the products (H+-H+) show values from 1.78 to 1.87 |e| for the surface Ti sites carrying the electrons. Actually, based on our spin density results (see Figure 6, Supplementary Figure S5 and Table 4) two Ti are reduced for every facet. For the TS2, one of the Ti on the surface partially decreases its positive charge, indicating partial reduction. Finally, in the H+-H+ species the two H are characterized as protons, whereas two Ti sites decrease their positive charge, indicating that they host the reduction electrons, and the integrated spin density varies from 0.90 to 1.05 |e| (See Table 4). It is worth stating that the O site involved in the H transfer process also contains a small amount of unpaired electrons of 0.24 |e| for TS2 of both (001) and (101) facets, as can be seen in Figure 6 for the (001) case.

3.3. Effect of the Hubbard Correction U

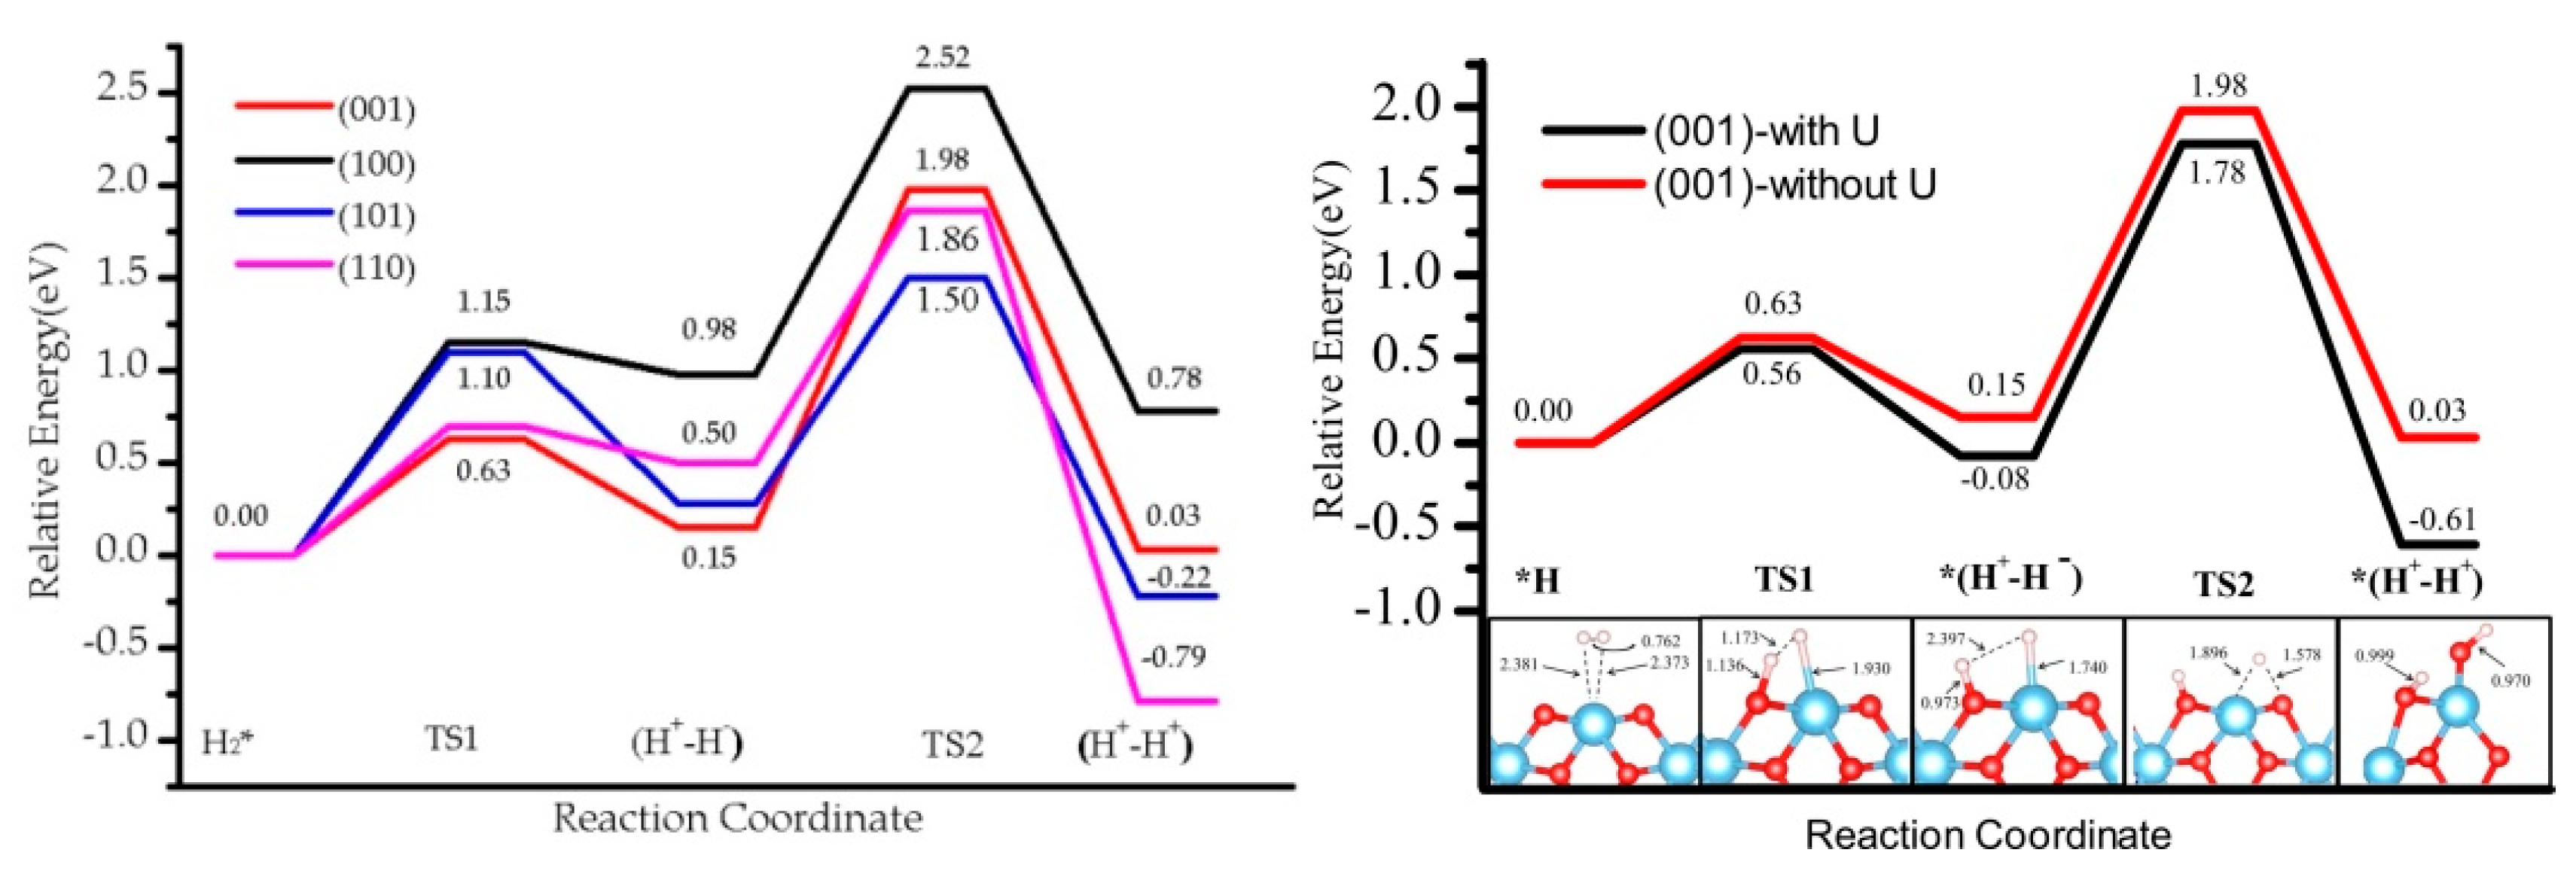
The values without U correction were considered to analyze the effect of U in the energetic profile, which is reported in Table 2. The profile is similar to the one obtained for U = 4 eV (see Figure 7 for the (001) case and Supplementary Materials for the others). In step 1, the heterolytic dissociation leads to (H+-H) products stable at 0.15 eV (001), 0.28 eV (101), 0.98 eV (101), and 0.50 eV (110), and barriers of 0.63 eV, 1.10 eV, and 1.15 eV, 0.70 eV, respectively, which is ~0.20 eV higher in energy than for the U = 4 eV case (Table 2, Figure 3). The increase in the values is significantly higher in step 2, where the (H+-H+) product is higher in energy by ~0.60 eV in the absence of U correction, and is associated with the stabilization of the localized solution favored by the U = 4 eV term with respect to the U = 0 eV case. In general, the activation barriers are not significantly affected by the U value, with the exception of (110) and (100) in step 1 (formation of H+-H), where the U = 0 eV leads to a TS1 very close in energy to the H+-H intermediate. The backward reaction i.e., recombination desorption of H2, would thus be barrierless and the intermediate would not be stable at all. The overall profile and the trend of the activity for H2 dissociation and subsequent H transfer for the four TiO2 surfaces is maintained.

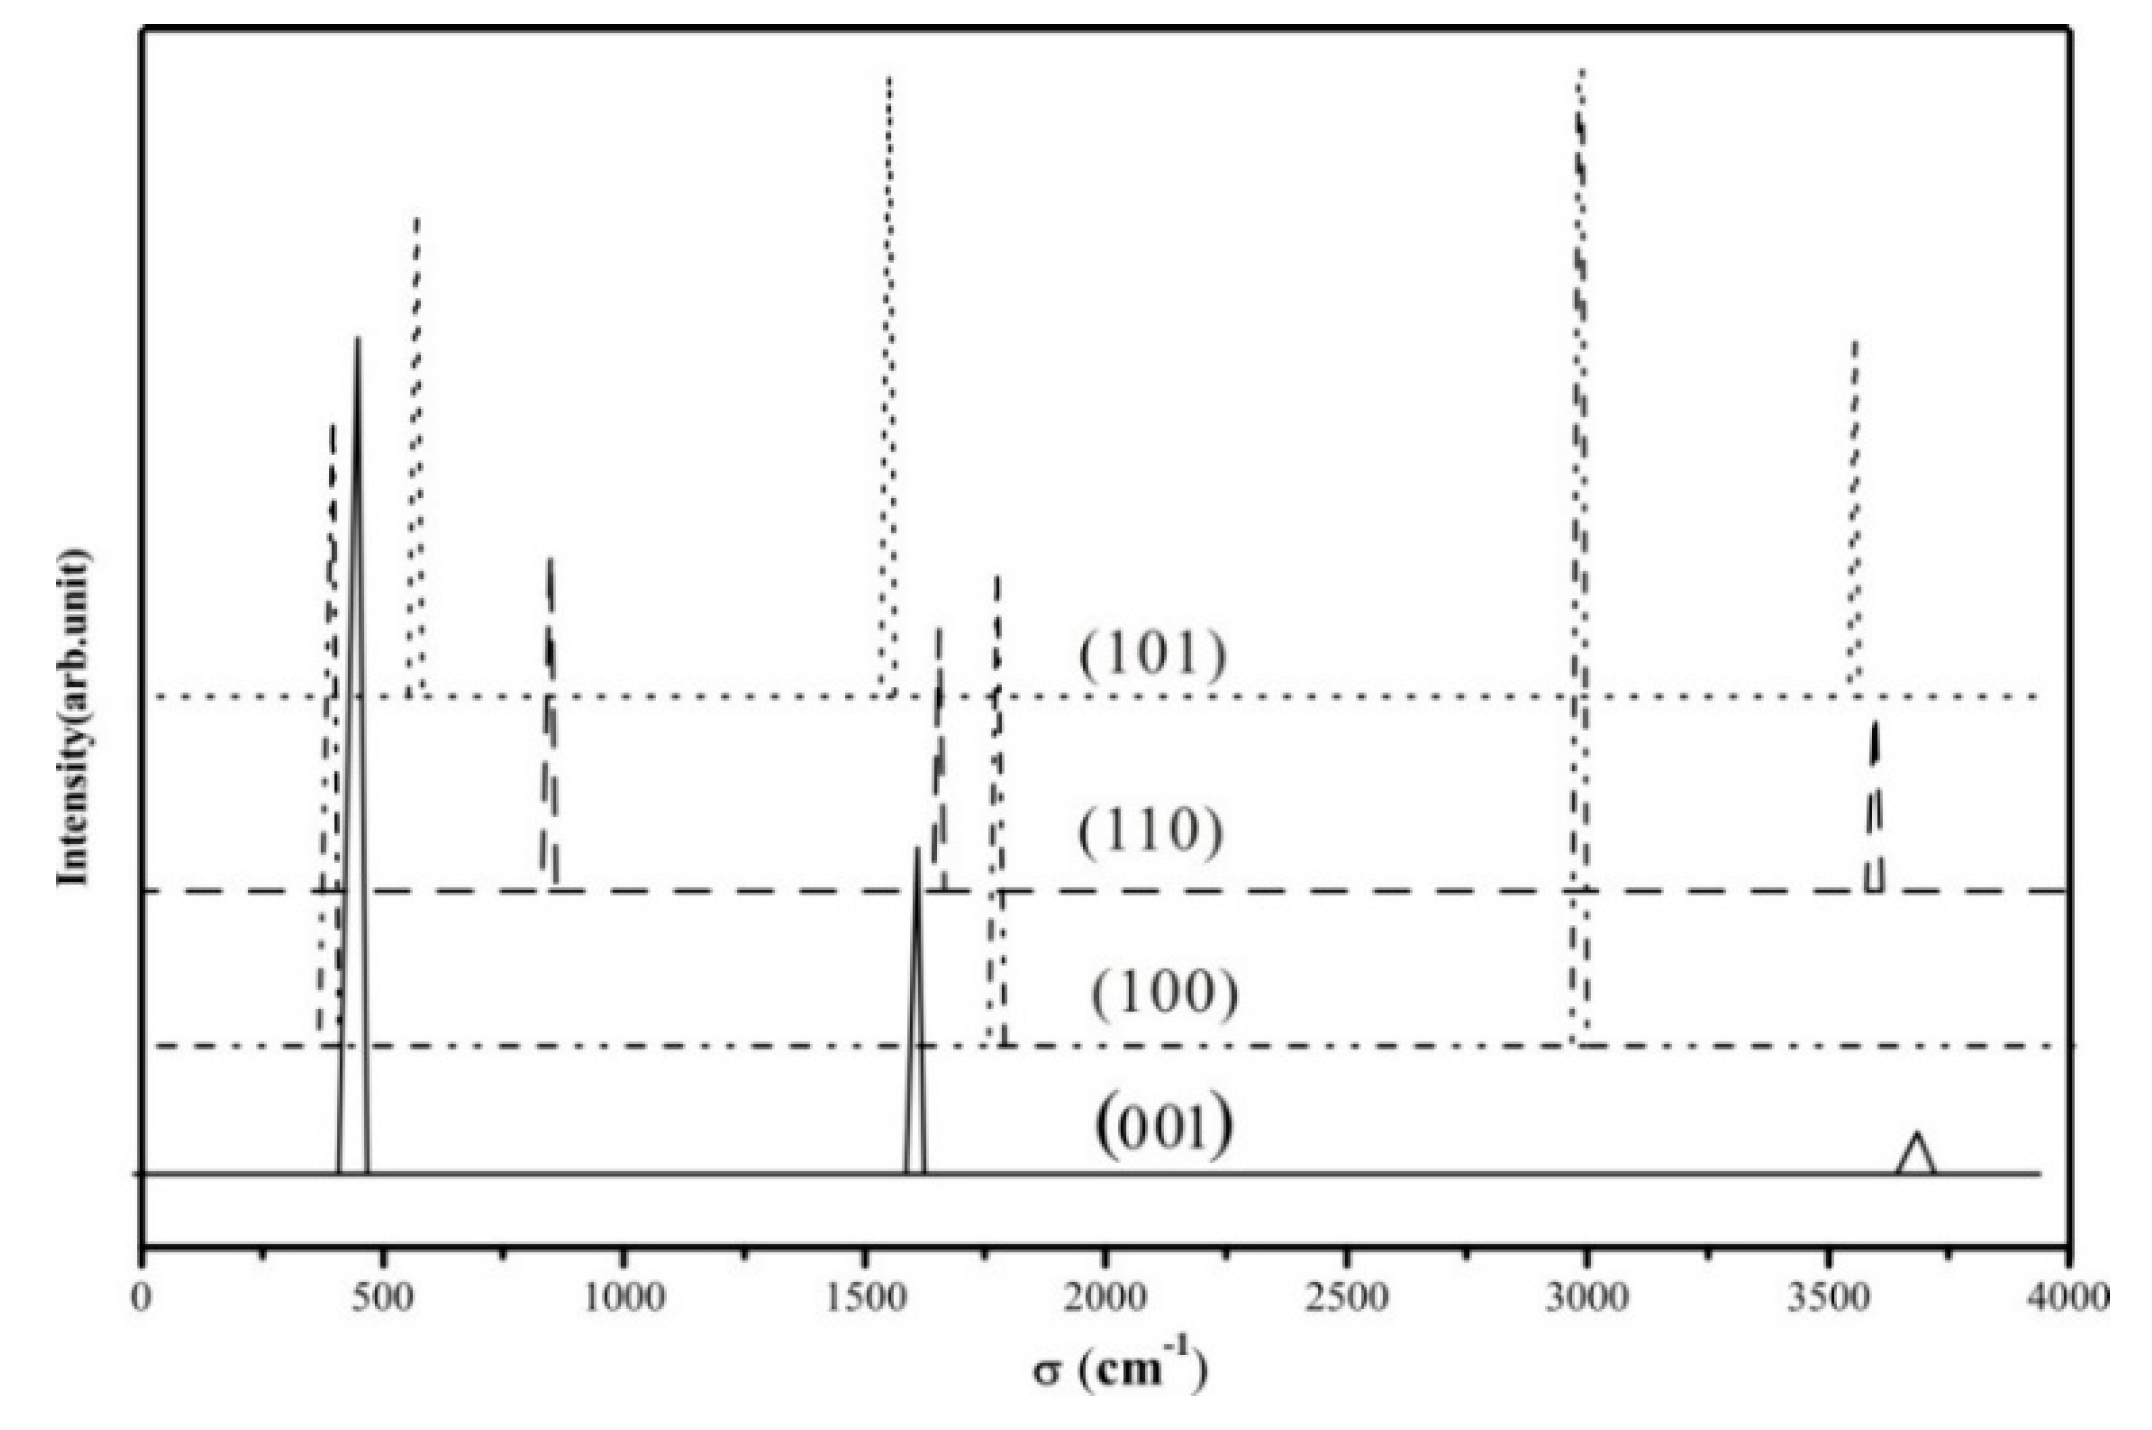
3.4. Vibrational Spectrum

We computed the vibration frequency and IR spectra of H2 heterolytic dissociation products (H+-H) for the four terminations. No scaling factor was applied. The vibration modes are shown in Table 5 and Figure 8, and present three main regions: Ti–H and O–H bending modes at low frequencies (below 1000 cm−1); the vibration frequencies of Ti–H lie in the range of 1500–1800 cm−1; the stretching OH modes are characterized by higher frequencies (between 2900 cm−1 and 3800 cm−1). Ti–H stretching modes of the four species are seen in the calculated spectrum at 1644 cm −1 (001), 1768 cm−1 (100), 1653 cm−1 (110), and 1577 cm−1 (101), corresponding to the expected Ti–H IR spectral region (around 1600 cm−1) [83].The hydrides of (001) and (101) facets are Ti4C-H, while they are Ti5c-H on (100) and (110) surfaces, as displayed in Figure 9. Previous studies using electron-stimulated desorption (ESD) [84] and low-energy ion scattering (LEIS) [85] reported that the annealed TiO2 surface is compensated by H, which is bonded in the Ti–H as well as O–H with bridging O or a subsurface, but no specific frequencies were provided. Recently, Yan et.al indicated the formation of Ti-H species on the P25 TiO2 surface [86].
For the (O-H) vibrations, there are many experimental reports by various authors (see selected ones in Supplementary Table S5), showing that the vibrations can be greatly influenced by the nature of the site, the surface topology, the presence of defects and coverage [87], as well as the polymorph [88]. In the present work, we perform an analysis of OH vibrations for the four terminations considered (see Table 5, Figure 9) as a guide for qualitative assignment. It is found that the OH stretching vibrations are different between these four facets. The calculated IR results of TiO2 (100) surface (2976.54 cm−1) correspond to a Ti5C-O3CH exhibiting an H bond with one O site nearby. An experimental value of 3550 cm−1 for OH on (100) [89] was reported for the adsorption of water on the surface, most likely assigned to terminal hydroxyl groups. Our value is consistent with a higher coordination of the hydroxyl group (three-fold in our case), as well as with the presence of a hydrogen bond, both blue-shifting the vibration with respect to the experimental value. For the TiO2 (101) surface (3622.37 cm−1) it corresponds to a Ti4C-O2CH. Experimentally, the OH stretching vibrations from water adsorption are observed at 3680 and 3610 cm−1 [89]. For the TiO2 (110) surface (3606.59 cm−1) the vibration corresponds to Ti6C-O2CH, which is lower than in a previous theoretical study by Wöll (3700 cm−1) [90]. Note that the model used in the work of Wöll et al. involves a hydroxyl perpendicular to the slab, whereas in our work the hydroxyl is tilted. Other experimental works report 3665 and 3690 cm−1 measured by High-Resolution Electron Energy Loss Spectroscopy (HREELS) [91,92], and 3711 cm−1 by IR [93] on systems obtained by H2O adsorption on a clean single-crystal TiO2 surface.
As a general remark, the lack of experimental data in well-controlled structures and conditions make an assessment of the vibrational spectra of surface hydroxyl and hydride species difficult, although several trends can be observed. First, the vibrations are dependent on the surface topology due to specific local chemical environments. Second, the coordination of oxygen and titanium sites seems to play a role, as well as hydrogen bonds formed between TiH/OH pairs and neighboring O sites. Overall, our results are consistent with previous experimental and theoretical data published in the literature and provide a set of spectra to stimulate the search of TiH/OH species on different rutile terminations.

3.5. The H2 Recombination-Desorption Reaction

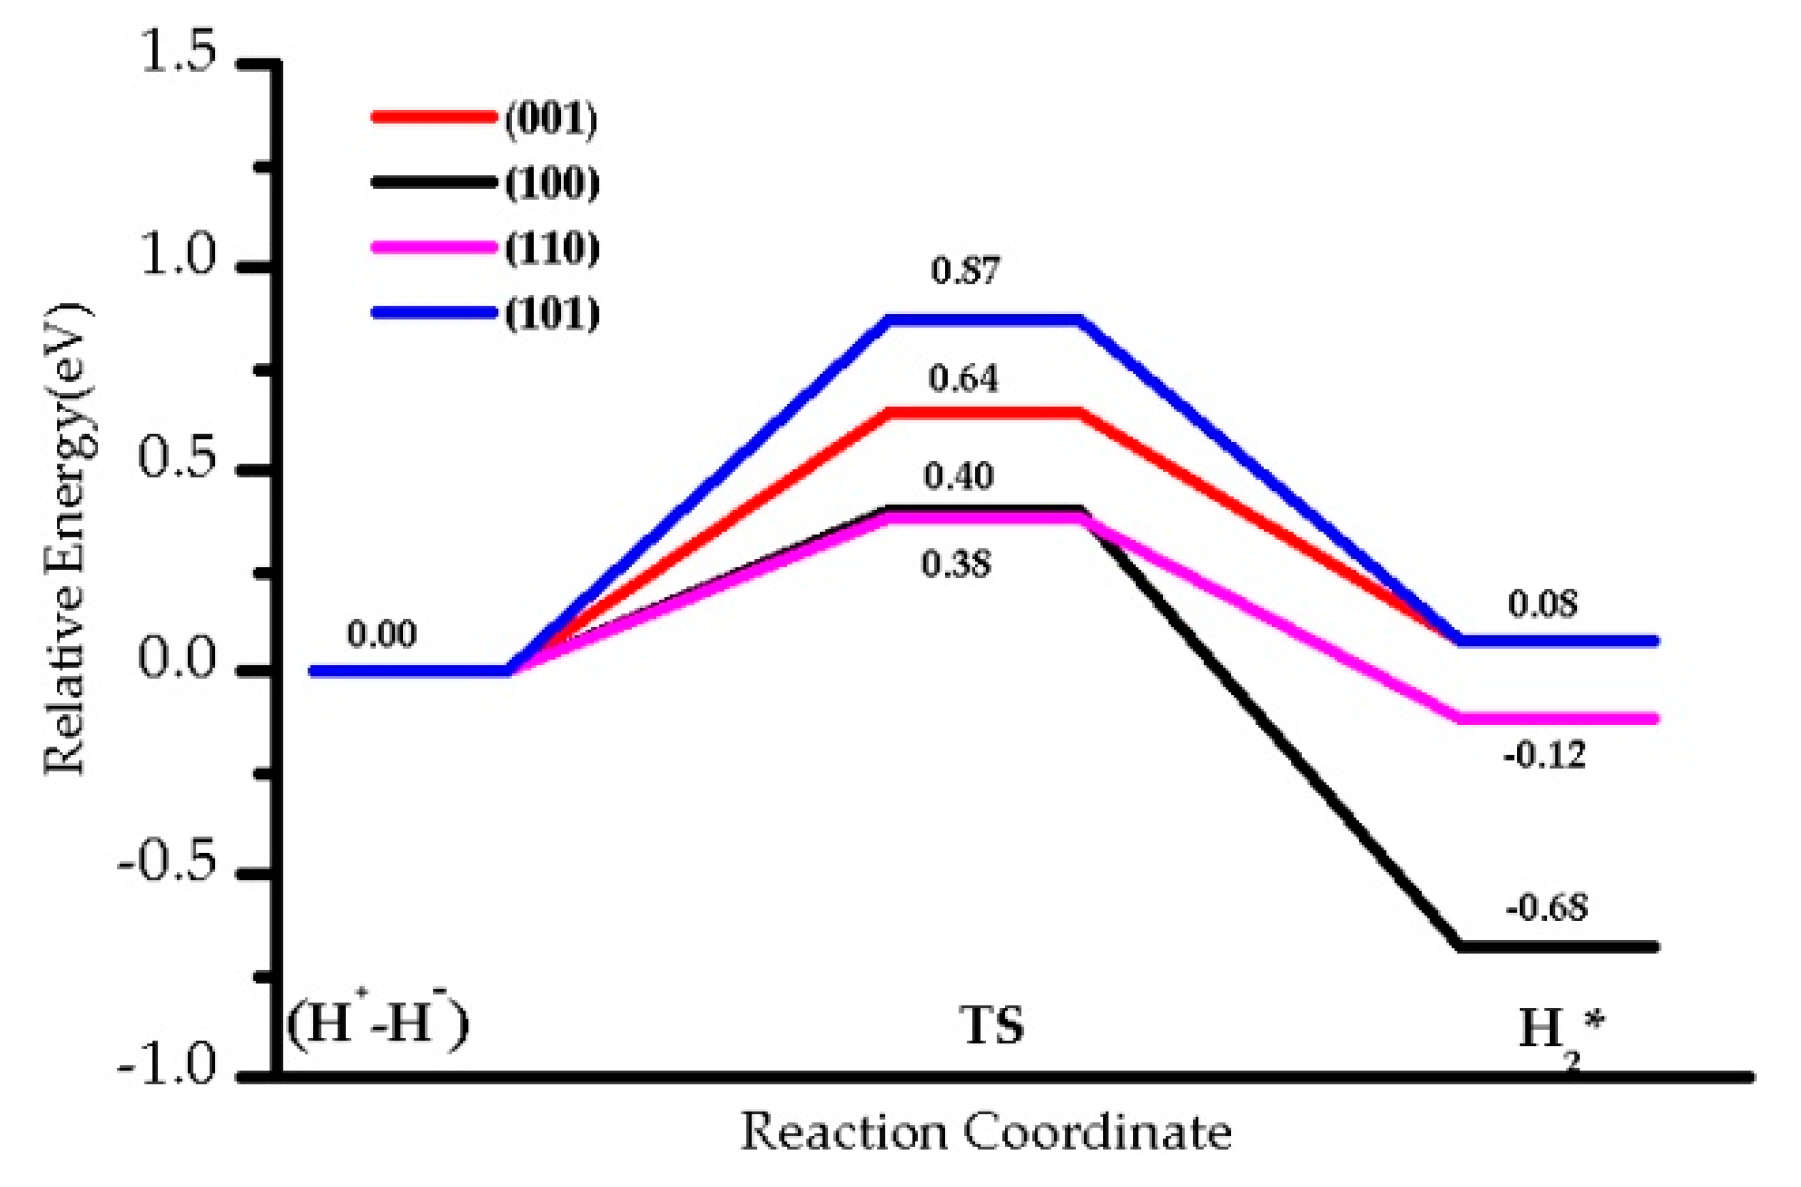
We studied the energy barriers for hydride TiH/OH species recombination to regenerate and desorb H2 on four facets (Figure 10, Table 2). The corresponding barrier for that process, E a c t b a c k , requires 0.64 eV for (001), 0.87 eV for (101), 0.38 eV for the (110), and 0.40 eV for the (100) slabs. The backward activation energies for the facets (001) and (101) are larger than those found for facets (110) and (100), probably due to the higher stability of the (H+-H) species. Contrary to the dissociation process, the desorption of H2 is slightly endothermic for the (001) and (101) terminations (0.08 eV), whereas it is exothermic for the (110) by −0.12 eV, and for the (100) by −0.68 eV. On (101) and (001) facets, hydrogen dissociation, and therefore (H+-H) formation, is slightly more favorable than H2 desorption: 0.79 eV vs. 0.56 eV for (101), 0.87 eV vs. 0.64 eV for (001). H2 dissociation and desorption occur with similar barriers on (110), with 0.50 eV and 0.40 eV, respectively. Thus, it is expected that the (H+-H) intermediate involving Ti-H species is more likely to be observed in (001), and to a lesser extent (101), where the (100) and (110) would lead to recombination and desorption.

3.6. Zero-Point Energy Correction and Effect of Temperature

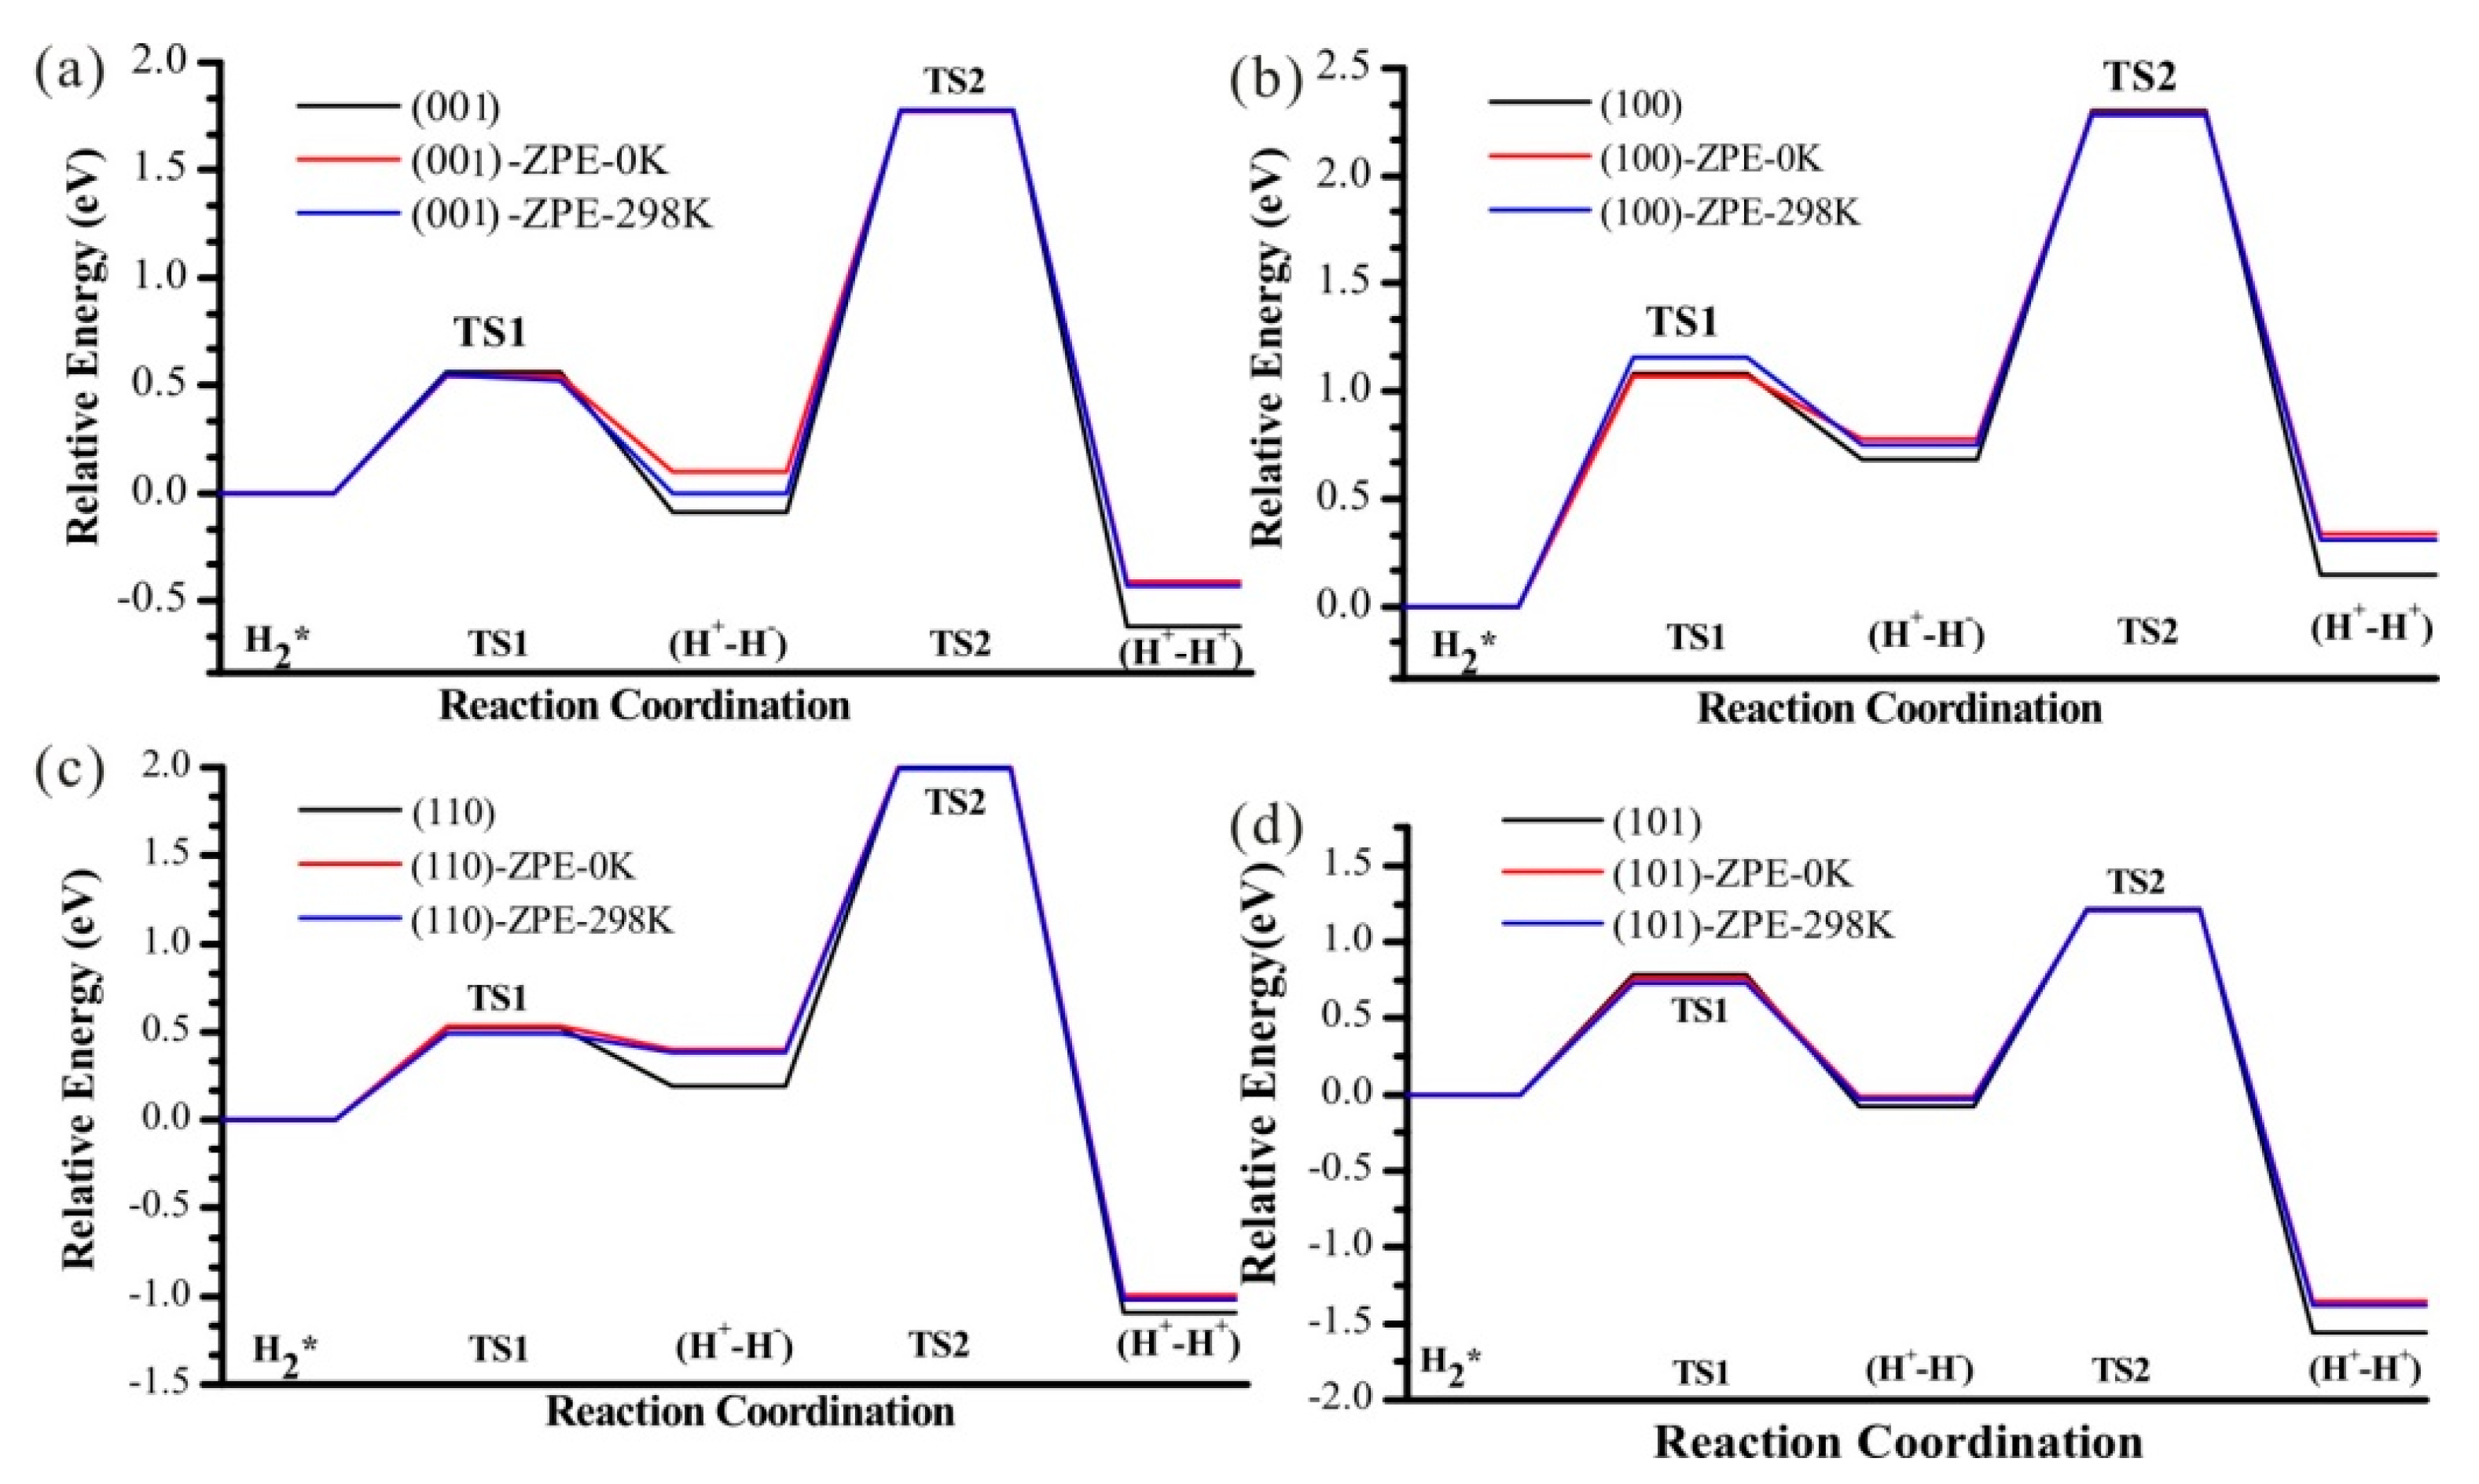
The energy profiles with Zero Point Energy (ZPE) correction are also studied together with the Gibbs free energies for T = 298 K (Figure 11). With ZPE correction, the energy for these two steps increases, while it does not affect the kinetic barriers. Temperature has almost no effect on this reaction profile.
As a final remark, many other factors may have a deep influence on the behavior of TiO2 regarding hydrogenation—the presence of surface and subsurface defects [94], the nature of the bulk phase [95], nanostructuring [96,97], interfacial water [98], or reduction [99]. More fundamental works to elucidate the structure of hydrogenated surfaces are needed to build a robust scenario for the complex behavior observed [100].

4. Conclusions

The mechanisms of H2 dissociation on four different rutile TiO2 facets by means of density functional theory (PBE+U) calculations have been investigated. The results showed that the topology of the surface has a moderate effect on H2 dissociation on TiO2 kinetically and also thermodynamically. We found that for all four surfaces, the heterolytic dissociation pathway towards hydride–hydroxyl surface pairs is kinetically more favorable than the H transfer process towards substrate reduction, although the reduction product, with only surface hydroxyl groups, is thermodynamically more favorable. On (110) and (100), the hydride–hydroxyl pair formed can recombine and desorb as molecular dihydrogen, whereas the (001), and to a lesser extent (101), stabilize the hydride–hydroxyl pair. The energetics of the reaction seems related to the coordination numbers of Ti and O on the surfaces, although (110) shows a specific behavior. No clear trend relating adsorption energies and barriers with local geometry or charges was found. The electronic structure analysis allows characterization of charge and electron transfers. The IR spectra of the (H+-H) pair species were also computed indicating the vibrational region of Ti-H species on TiO2 facets in the range of 1550–1750 cm−1. The frequencies are found to depend on the facet exposed and could be used as a qualitative guideline to identify them experimentally.

Supplementary Materials

The following are available online at https://www.mdpi.com/2079-4991/9/9/1199/s1. Figure S1: H2 dissociation on rutile TiO2 (100) facets with U = 4 eV and U = 0 eV. Figure S2: H2 dissociation on rutile TiO2 (110) facets with U = 4 eV and U = 0 eV. Figure S3: H2 dissociation on rutile TiO2 (101) facets with U = 4 eV and U = 0 eV. Figure S4: Projected Density of State (PDOS) of the TiO2 slab, H2*, TS, and (H+, H), (H+-H+) for the (110) (left) and (101) (right) surfaces. Figure S5: Spin Density of TS2 and (H+-H+). Figure S6: Structures of (H+-H) for the other adsorption modes considered. Tables S1–S6 and Figures S7–S11 IR frequencies. Tables S7 and S12: Grimme D3 corrections. Geometric structures for the intermediates and transition structures used in this work (POSCAR - VASP input files- format).

Author Contributions

Investigation, B.W. and M.C.; software, M.C.; supervision, M.C.; writing—original draft, B.W.; writing—review and editing, F.T. and M.C.

Funding

This research was funded by China Scholarship Council (CSC).

Acknowledgments

This study was supported by China Scholarship Council (CSC). Authors acknowledge Scienomics for the MAPS program used in the construction of the slab models for a courtesy license. B. Diawara is acknowledged for the Modelview program. O. Matz is warmly acknowledged for his technical support. This work was performed using HPC resources from GENCI- CINES/IDRIS (Grant numbers 2018-x2018082131 and 2019-x2019082131), and the PER-SU iDROGEN project.

Conflicts of Interest

The authors declare no conflict of interest. The funders had no role in the design of the study; in the collection, analyses, or interpretation of data; in the writing of the manuscript, or in the decision to publish the results.

References

  1. Bach, U.; Lupo, D.; Comte, P.; Moser, J.E.; Weissortel, F.; Salbeck, J.; Spreitzer, H.; Gratzel, M. Solid-state dye-sensitized mesoporous TiO2 solar cells with high photon-to-electron conversion efficiencies. Nature 1998, 395, 583–585. [Google Scholar] [CrossRef]
  2. Crossland, E.J.W.; Noel, N.; Sivaram, V.; Leijtens, T.; Alexander-Webber, J.A.; Snaith, H.J. Mesoporous TiO2 single crystals delivering enhanced mobility and optoelectronic device performance. Nature 2013, 495, 215–219. [Google Scholar] [CrossRef] [PubMed]
  3. Fujishima, A.; Honda, K. Electrochemical photolysis of eater at a semiconductor electrode. Nature 1972, 238, 37. [Google Scholar] [CrossRef] [PubMed]
  4. Tada, H.; Fujishima, M.; Kobayashi, H. Photodeposition of metal sulfide quantum dots on titanium (IV) dioxide and the applications to solar energy conversion. Chem. Soc. Rev. 2011, 40, 4232–4243. [Google Scholar] [CrossRef] [PubMed]
  5. Chen, M.S.; Goodman, D.W. The structure of catalytically active gold on titania. Science 2004, 306, 252–255. [Google Scholar] [CrossRef] [PubMed]
  6. Maeda, Y.; Iizuka, Y.; Kohyama, M. Generation of oxygen vacancies at a Au/TiO2 perimeter interface during CO oxidation detected by in situ electrical conductance measurement. J. Am. Chem. Soc. 2013, 135, 906–909. [Google Scholar] [CrossRef]
  7. Varghese, O.K.; Gong, D.W.; Paulose, M.; Ong, K.G.; Dickey, E.C.; Grimes, C.A. Extreme changes in the electrical resistance of titania nanotubes with hydrogen exposure. Adv. Mater. 2003, 15, 624–627. [Google Scholar] [CrossRef]
  8. Zhou, X.Y.; Wang, Z.; Xia, X.H.; Shao, G.S.; Homewood, K.; Gao, Y. Synergistic cooperation of rutile TiO2 {002}, {101}, and {110} facets for hydrogen sensing. ACS Appl. Mater. Interfaces 2018, 10, 28199–28209. [Google Scholar] [CrossRef]
  9. Sugita, Y.; Ishizaki, K.; Iwasa, F.; Ueno, T.; Minamikawa, H.; Yamada, M.; Suzuki, T.; Ogawa, T. Effects of pico-to-nanometer-thin TiO2 coating on the biological properties of microroughened titanium. Biomaterials 2011, 32, 8374–8384. [Google Scholar] [CrossRef]
  10. Bruce, P.G.; Scrosati, B.; Tarascon, J.M. Nanomaterials for rechargeable lithium batteries. Angew. Chem. Int. Ed. 2008, 47, 2930–2946. [Google Scholar] [CrossRef]
  11. Linsebigler, A.L.; Lu, G.Q.; Yates, J.T. Photocatalysis on TiO2 surface—Principles, mechanisma, and selected results. Chem. Rev. 1995, 95, 735–758. [Google Scholar] [CrossRef]
  12. Etgar, L.; Zhang, W.; Gabriel, S.; Hickey, S.G.; Nazeeruddin, M.K.; Eychmuller, A.; Liu, B.; Gratzel, M. High efficiency quantum dot heterojunction solar cell using anatase (001) TiO2 nanosheets. Adv. Mater. 2012, 24, 2202–2206. [Google Scholar] [CrossRef] [PubMed]
  13. Sun, C.H.; Jia, Y.; Yang, X.H.; Yang, H.G.; Yao, X.D.; Lu, G.Q.; Selloni, A.; Smith, S.C. Hydrogen incorporation and storage in well-defined nanocrystals of anatase titanium dioxide. J. Phys. Chem. C 2011, 115, 25590–25594. [Google Scholar] [CrossRef]
  14. Wang, Z.; Xia, X.H.; Guo, M.L.; Shao, G.S. Fundamental pathways for the adsorption and transport of hydrogen on TiO2 Surfaces: Origin for effective sensing at about room temperature. ACS Appl. Mater. Interfaces 2016, 8, 35298–35307. [Google Scholar] [CrossRef] [PubMed]
  15. Chen, X.B.; Liu, L.; Yu, P.Y.; Mao, S.S. Increasing solar absorption for photocatalysis with black hydrogenated titanium dioxide nanocrystals. Science 2011, 331, 746–750. [Google Scholar] [CrossRef] [PubMed]
  16. Kudo, A.; Miseki, Y. Heterogeneous photocatalyst materials for water splitting. Chem. Soc. Rev. 2009, 38, 253–278. [Google Scholar] [CrossRef] [PubMed]
  17. Wang, G.M.; Wang, H.Y.; Ling, Y.C.; Tang, Y.C.; Yang, X.Y.; Fitzmorris, R.C.; Wang, C.C.; Zhang, J.Z.; Li, Y. Hydrogen-treated TiO2 nanowire arrays for photoelectrochemical water splitting. Nano Lett. 2011, 11, 3026–3033. [Google Scholar] [CrossRef]
  18. Woll, C. Hydrogen adsorption on metal oxide surfaces: A reinvestigation using He-atom scattering. J. Phys. Condes. Matter 2004, 16, S2981–S2994. [Google Scholar] [CrossRef]
  19. Zheng, Z.K.; Huang, B.B.; Lu, J.B.; Wang, Z.Y.; Qin, X.Y.; Zhang, X.Y.; Dai, Y.; Whangbo, M.H. Hydrogenated titania: Synergy of surface modification and morphology improvement for enhanced photocatalytic activity. Chem. Commun. 2012, 48, 5733–5735. [Google Scholar] [CrossRef]
  20. Joo, J.B.; Dillon, R.; Lee, I.; Yin, Y.D.; Bardeen, C.J.; Zaera, F. Promotion of atomic hydrogen recombination as an alternative to electron trapping for the role of metals in the photocatalytic production of H2. Proc. Natl. Acad. Sci. USA 2014, 111, 7942–7947. [Google Scholar] [CrossRef]
  21. Aschauer, U.; Selloni, A. Hydrogen interaction with the anatase TiO2(101) surface. Phys. Chem. Chem. Phys. 2012, 14, 16595–16602. [Google Scholar] [CrossRef] [PubMed]
  22. Calatayud, M.; Minot, C. Effect of relaxation on structure and reactivity of anatase (100) and (001) surfaces. Surf. Sci. 2004, 552, 169–179. [Google Scholar] [CrossRef]
  23. Diebold, U. The surface science of titanium dioxide. Surf. Sci. Rep. 2003, 48, 53–229. [Google Scholar] [CrossRef]
  24. Islam, M.M.; Calatayud, M.; Pacchioni, G. Hydrogen adsorption and diffusion on the anatase TiO2(101) surface: A first-principles investigation. J. Phys. Chem. C 2011, 115, 6809–6814. [Google Scholar] [CrossRef]
  25. Liu, L.L.; Wang, Z.; Pan, C.X.; Xiao, W.; Cho, K. Effect of hydrogen on O2 adsorption and dissociation on a TiO2 anatase (001) surface. ChemPhysChem 2013, 14, 996–1002. [Google Scholar] [CrossRef]
  26. Nadeem, I.M.; Treacy, J.P.W.; Selcuk, S.; Torrelles, X.; Hussain, H.; Wilson, A.; Grinter, D.C.; Cabailh, G.; Bikondoa, O.; Nicklin, C.; et al. Water dissociates at the aqueous interface with reduced anatase TiO2 (101). J. Phys. Chem. Lett. 2018, 9, 3131–3136. [Google Scholar] [CrossRef] [PubMed]
  27. Vittadini, A.; Casarin, M.; Selloni, A. Hydroxylation of TiO2-B: Insights from density functional calculations. J. Mater. Chem. 2010, 20, 5871–5877. [Google Scholar] [CrossRef]
  28. Yin, X.L.; Calatayud, M.; Qiu, H.; Wang, Y.; Birkner, A.; Minot, C.; Woll, C. Diffusion versus desorption: Complex behavior of H atoms on an oxide surface. ChemPhysChem 2008, 9, 253–256. [Google Scholar] [CrossRef]
  29. Ma, S.C.; Huang, S.D.; Fang, Y.H.; Liu, Z.P. TiH hydride formed on amorphous black titania: Unprecedented active species for photocatalytic hydrogen evolution. ACS Catal. 2018, 8, 9711–9721. [Google Scholar] [CrossRef]
  30. Chen, H.Y.T.; Giordano, L.; Pacchioni, G. From heterolytic to homolytic H2 dissociation on nanostructured MgO(001) Films as a function of the metal support. J. Phys. Chem. C 2013, 117, 10623–10629. [Google Scholar] [CrossRef]
  31. Coluccia, S.; Boccuzzi, F.; Ghiotti, G.; Mirra, C. Evidence for heterolytic dissociation of H2 on the surface of thermally activated MgO powders. Z. Fur Phys. Chem. Wiesb. 1980, 121, 141–143. [Google Scholar] [CrossRef]
  32. Di Valentin, C.; Pacchioni, G.; Selloni, A. Electronic structure of defect states in hydroxylated and reduced rutile TiO2(110) surfaces. Phys. Rev. Lett. 2006, 97. [Google Scholar] [CrossRef] [PubMed]
  33. Garcia-Melchor, M.; Lopez, N. Homolytic products from heterolytic paths in H2 dissociation on metal oxides: The example of CeO2. J. Phys. Chem. C 2014, 118, 10921–10926. [Google Scholar] [CrossRef]
  34. Hu, G.X.; Wu, Z.L.; Jiang, D.E. First principles insight into H2 activation and hydride species on TiO2 Surfaces. J. Phys. Chem. C 2018, 122, 20323–20328. [Google Scholar] [CrossRef]
  35. Joubert, J.; Salameh, A.; Krakoviack, V.; Delbecq, F.; Sautet, P.; Coperet, C.; Basset, J.M. Heterolytic splitting of H2 and CH4 on gamma-alumina as a structural probe for defect sites. J. Phys. Chem. B 2006, 110, 23944–23950. [Google Scholar] [CrossRef] [PubMed]
  36. Menetrey, M.; Markovits, A.; Minot, C. Reactivity of a reduced metal oxide surface: Hydrogen, water and carbon monoxide adsorption on oxygen defective rutile TiO2(110). Surf. Sci. 2003, 524, 49–62. [Google Scholar] [CrossRef]
  37. Panayotov, D.A.; Yates, J.T. n-Type doping of TiO2 with atomic hydrogen-observation of the production of conduction band electrons by infrared spectroscopy. Chem. Phys. Lett. 2007, 436, 204–208. [Google Scholar] [CrossRef]
  38. Calatayud, M.; Markovits, A.; Menetrey, M.; Mguig, B.; Minot, C. Adsorption on perfect and reduced surfaces of metal oxides. Catal. Today 2003, 85, 125–143. [Google Scholar] [CrossRef]
  39. Fernandez-Torre, D.; Carrasco, J.; Ganduglia-Pirovano, M.V.; Perez, R. Hydrogen activation, diffusion, and clustering on CeO2(111): A DFT+U study. J. Chem. Phys. 2014, 141. [Google Scholar] [CrossRef]
  40. Liu, Y.P.; Li, Y.H.; Yang, S.Y.; Lin, Y.; Zuo, J.L.; Liang, H.; Peng, F. Revealing the relationship between photocatalytic properties and structure characteristics of TiO2 reduced by hydrogen and carbon monoxide treatment. ChemSusChem 2018, 11, 2766–2775. [Google Scholar] [CrossRef]
  41. Batzill, M. Fundamental aspects of surface engineering of transition metal oxide photocatalysts. Energy Environ. Sci. 2011, 4, 3275–3286. [Google Scholar] [CrossRef]
  42. Farneth, W.E.; Hotsenpiller, P.A.M.; Bolt, J.D.; Lowekamp, J.B.; Rohrer, G.S. Orientation dependence of photochemical reactions on TiO2 thin film surfaces. Abstr. Pap. Am. Chem. Soc. 1998, 216, U747. [Google Scholar]
  43. Han, X.G.; Kuang, Q.; Jin, M.S.; Xie, Z.X.; Zheng, L.S. Synthesis of titania nanosheets with a high percentage of exposed (001) facets and related photocatalytic properties. J. Am. Chem. Soc. 2009, 131, 3152–3153. [Google Scholar] [CrossRef]
  44. Kislov, N.; Lahiri, J.; Verma, H.; Goswami, D.Y.; Stefanakos, E.; Batzill, M. Photocatalytic degradation of methyl orange over single crystalline ZnO: Orientation dependence of photoactivity and photostability of ZnO. Langmuir 2009, 25, 3310–3315. [Google Scholar] [CrossRef]
  45. Ohno, T.; Sarukawa, K.; Matsumura, M. Crystal faces of rutile and anatase TiO2 particles and their roles in photocatalytic reactions. New J. Chem. 2002, 26, 1167–1170. [Google Scholar] [CrossRef]
  46. Calatayud, M.; Yin, X.L.; Qiu, H.; Wang, Y.; Birkner, A.; Minot, C.; Woll, C. Comment on “Imaging of the hydrogen subsurface site in rutile TiO2”. Phys. Rev. Lett. 2010, 104. [Google Scholar] [CrossRef]
  47. Kowalski, P.M.; Meyer, B.; Marx, D. Composition, structure, and stability of the rutile TiO2(110) surface: Oxygen depletion, hydroxylation, hydrogen migration, and water adsorption. Phys. Rev. B 2009, 79. [Google Scholar] [CrossRef]
  48. Sasahara, A.; Murakami, T.; Tomitori, M. XPS and STM study of TiO2(110)-(1 x 1) surfaces immersed in simulated body fluid. Surf. Sci. 2018, 668, 61–67. [Google Scholar] [CrossRef]
  49. Yu, X.J.; Zhang, Z.R.; Yang, C.W.; Bebensee, F.; Heissler, S.; Nefedov, A.; Tang, M.R.; Ge, Q.F.; Chen, L.; Kay, B.D.; et al. Interaction of formaldehyde with the Rutile TiO2(110) Surface: A combined experimental and theoretical study. J. Phys. Chem. C 2016, 120, 12626–12636. [Google Scholar] [CrossRef]
  50. Zhang, D.Y.; Yang, M.N.; Dong, S. Hydroxylation of the rutile TiO2(110) surface enhancing its reducing power for photocatalysis. J. Phys. Chem. C 2015, 119, 1451–1456. [Google Scholar] [CrossRef]
  51. Imanishi, A.; Tsuji, E.; Nakato, Y. Dependence of the work function of TiO2 (Rutile) on crystal faces, studied by a scanning auger microprobe. J. Phys. Chem. C 2007, 111, 2128–2132. [Google Scholar] [CrossRef]
  52. Lu, Y.; Jaeckel, B.; Parkinson, B.A. Preparation and characterization of terraced surfaces of low-index faces of anatase, rutile, and brookite. Langmuir 2006, 22, 4472–4475. [Google Scholar] [CrossRef]
  53. Raza, H.; Pang, C.L.; Haycock, S.A.; Thornton, G. Evidence of discrete bond breaking steps in the 1 x 1 to 1 x 3 phase transition of TiO2(100). Phys. Rev. Lett. 1999, 82, 5265–5268. [Google Scholar] [CrossRef]
  54. Warschkow, O.; Wang, Y.; Subramanian, A.; Asta, M.; Marks, L.D. Structure and local-equilibrium thermodynamics of the c(2 × 2) reconstruction of rutile TiO2 (100). Phys. Rev. Lett. 2008, 100. [Google Scholar] [CrossRef]
  55. Lindberg, F.; Heinrichs, J.; Ericson, F.; Thomsen, P.; Engqvist, H. Hydroxylapatite growth on single-crystal rutile substrates. Biomaterials 2008, 29, 3317–3323. [Google Scholar] [CrossRef]
  56. Muscat, J.; Harrison, N.M. The physical and electronic structure of the rutile (001) surface. Surf. Sci. 2000, 446, 119–127. [Google Scholar] [CrossRef]
  57. Norenberg, H.; Dinelli, F.; Briggs, G.A.D. Network-like (7 root 2 x root 2) R45 degrees surface reconstruction on rutile TiO2(001) by non-equilibrium self-organization. Surf. Sci. 1999, 436, L635–L640. [Google Scholar] [CrossRef]
  58. Poirier, G.E.; Hance, B.K.; White, J.M. Identification of the facet planes of phase I TiO2(001) rutile by scanning tunneling tunneling microscopy and low-energy electron-diffraction. J. Vac. Sci. Technol. B 1992, 10, 6–15. [Google Scholar] [CrossRef]
  59. Sosnowchik, B.D.; Chiamori, H.C.; Ding, Y.; Ha, J.Y.; Wang, Z.L.; Lin, L.W. Titanium dioxide nanoswords with highly reactive, photocatalytic facets. Nanotechnology 2010, 21. [Google Scholar] [CrossRef]
  60. Thibado, P.M.; Bonnell, D.A. Metal-oxide interactions on copper-segregated and copper-deposited TiO2 rutile (001) surfaces. J. Am. Ceram. Soc. 1997, 80, 1267–1273. [Google Scholar] [CrossRef]
  61. Yang, M.H.; Chen, T.T.; Wang, Y.S.; Chiu, H.T.; Lee, C.Y. Electrochromism of rutile nanowires, vertically aligned along the 001 direction, due to alkali metal ion intercalation. J. Mater. Chem. 2011, 21, 18738–18743. [Google Scholar] [CrossRef]
  62. Yamamoto, Y.; Matsumoto, Y.; Koinuma, H. Homo-epitaxial growth of rutile TiO2 film on step and terrace structured substrate. Appl. Surf. Sci. 2004, 238, 189–192. [Google Scholar] [CrossRef]
  63. Yang, X.F.; Jin, C.J.; Liang, C.L.; Chen, D.H.; Wu, M.M.; Yu, J.C. Nanoflower arrays of rutile TiO2. Chem. Commun. 2011, 47, 1184–1186. [Google Scholar] [CrossRef]
  64. Di Valentin, C.; Tilocca, A.; Selloni, A.; Beck, T.J.; Klust, A.; Batzill, M.; Losovyj, Y.; Diebold, U. Adsorption of water on reconstructed rutile TiO2(011)-(2x1): Ti=O double bonds and surface reactivity. J. Am. Chem. Soc. 2005, 127, 9895–9903. [Google Scholar] [CrossRef]
  65. Dulub, O.; Di Valentin, C.; Selloni, A.; Diebold, U. Structure, defects, and impurities at the rutile TiO2(011)-(2 x 1) surface: A scanning tunneling microscopy study. Surf. Sci. 2006, 600, 4407–4417. [Google Scholar] [CrossRef]
  66. Kubo, T.; Orita, H.; Nozoye, H. Surface structures of rutile TiO2 (011). J. Am. Chem. Soc. 2007, 129, 10474–10478. [Google Scholar] [CrossRef]
  67. Kresse, G.; Hafner, J. Ab initio molecular-dynamics for liquid-metals. Phys. Rev. B 1993, 47, 558–561. [Google Scholar] [CrossRef]
  68. Kresse, G.; Hafner, J. Ab initio molecular-dynamics simulation of the liquid-metal amorphous-semiconductor transition in germantion in germanium. Phys. Rev. B 1994, 49, 14251–14269. [Google Scholar] [CrossRef]
  69. Blochl, P.E. Projector augmented-wave method. Phys. Rev. B 1994, 50, 17953–17979. [Google Scholar] [CrossRef] [Green Version]
  70. Kresse, G.; Joubert, D. From ultrasoft pseudopotentials to the projector augmented-wave method. Phys. Rev. B 1999, 59, 1758–1775. [Google Scholar] [CrossRef]
  71. Perdew, J.P.; Burke, K.; Ernzerhof, M. Generalized gradient approximation made simple. Phys. Rev. Lett. 1996, 77, 3865–3868. [Google Scholar] [CrossRef]
  72. Perdew, J.P.; Chevary, J.A.; Vosko, S.H.; Jackson, K.A.; Pederson, M.R.; Singh, D.J.; Fiolhais, C. Atoms, moleculars, solids, and surfaces: Application of the generalized gradient approximation for exchange and correlation. Phys. Rev. B 1993, 48, 4978. [Google Scholar] [CrossRef]
  73. Dudarev, S.L.; Botton, G.A.; Savrasov, S.Y.; Humphreys, C.J.; Sutton, A.P. Electron-energy-loss spectra and the structural stability of nickel oxide: An LSDA+U study. Phys. Rev. B 1998, 57, 1505–1509. [Google Scholar] [CrossRef]
  74. Finazzi, E.; Di Valentin, C.; Pacchioni, G.; Selloni, A. Excess electron states in reduced bulk anatase TiO2: Comparison of standard GGA, GGA plus U, and hybrid DFT calculations. J. Chem. Phys. 2008, 129. [Google Scholar] [CrossRef]
  75. Henkelman, G.; Jonsson, H. Improved tangent estimate in the nudged elastic band method for finding minimum energy paths and saddle points. J. Chem. Phys. 2000, 113, 9978–9985. [Google Scholar] [CrossRef] [Green Version]
  76. Henkelman, G.; Uberuaga, B.P.; Jonsson, H. A climbing image nudged elastic band method for finding saddle points and minimum energy paths. J. Chem. Phys. 2000, 113, 9901–9904. [Google Scholar] [CrossRef] [Green Version]
  77. Kyriakou, G.; Davidson, E.R.M.; Peng, G.W.; Roling, L.T.; Singh, S.; Boucher, M.B.; Marcinkowski, M.D.; Mavrikakis, M.; Michaelides, A.; Sykes, E.C.H. Significant quantum effects in hydrogen activation. ACS Nano 2014, 8, 4827–4835. [Google Scholar] [CrossRef]
  78. Baroni, S.; de Gironcoli, S.; Dal Corso, A.; Giannozzi, P. Phonons and related crystal properties from density-functional perturbation theory. Rev. Mod. Phys. 2001, 73, 515–562. [Google Scholar] [CrossRef] [Green Version]
  79. Giannozzi, P.; Baroni, S. Vibrational and dielectric-properties of C60 from density-functional perturbation theory. J. Chem. Phys. 1994, 100, 8537–8539. [Google Scholar] [CrossRef]
  80. Grimme, S.; Antony, J.; Ehrlich, S.; Krieg, S. A consistent and accurate ab initio parametrization of density functional dispersion correction (DFT-D) for the 94 elements H-PuJ. Chem. Phys. 2010, 132, 154104. [Google Scholar] [CrossRef]
  81. Matz, O.; Calatayud, M. Breaking H2 with CeO2: Effect of Surface Termination. ACS Omega 2018, 11, 16063–16073. [Google Scholar] [CrossRef]
  82. Sanville, E.; Kenny, S.D.; Smith, R.; Henkelman, G. Improved grid-based algorithm for Bader charge allocation. J. Comput. Chem. 2007, 28, 899–908. [Google Scholar] [CrossRef]
  83. Coperet, C.; Estes, D.P.; Larmier, K.; Searles, K. Isolated surface hydrides: Formation, structure, and reactivity. Chem. Rev. 2016, 116, 8463–8505. [Google Scholar] [CrossRef]
  84. Knotek, M.L. Characterization of hydrogen species on TiO2 by electron-stimulated desorption. Surf. Sci. 1980, 91, L17–L22. [Google Scholar] [CrossRef]
  85. Pan, J.M.; Maschhoff, B.L.; Diebold, U.; Madey, T.E. Interaction of water, oxigen, and hydrogen with TiO2 surfaces having different defect densities. J. Vac. Sci. Technol. A Vac. Surf. Films 1992, 10, 2470–2476. [Google Scholar] [CrossRef]
  86. Yan, Y.; Shi, W.D.; Yuan, Z.; He, S.G.; Li, D.M.; Meng, Q.B.; Ji, H.W.; Chen, C.C.; Ma, W.H.; Zhao, J.C. The formation of Ti-H Species at interface is lethal to the efficiency of TiO2-based dye-sensitized devices. J. Am. Chem. Soc. 2017, 139, 2083–2089. [Google Scholar] [CrossRef]
  87. Tsyganenko, A.; Filimonov, V. Infrared spectra of surface hydroxyl groups and crystalline structure of oxides. Spectrosc. Lett. 1972, 5, 477–487. [Google Scholar] [CrossRef]
  88. Arrouvel, C.; Digne, M.; Breysse, M.; Toulhoat, H.; Raybaud, P. Effects of morphology on surface hydroxyl concentration: A DFT comparison of anatase–TiO2 and γ-alumina catalytic supports. J. Catal. 2004, 222, 152–166. [Google Scholar] [CrossRef]
  89. Jones, P.; Hockey, J. Infra-red studies of rutile surfaces. Part 2—Hydroxylation, hydration and structure of rutile surfaces. Trans. Faraday Soc. 1971, 67, 2679–2685. [Google Scholar] [CrossRef]
  90. Buchholz, M.; Wöll, C. Interaction of carboxylic acids with rutile TiO2(110): IR-investigations of terephthalic and benzoic acid adsorbed on a single crystal substrate. Surf. Sci. 2016, 643, 117–123. [Google Scholar] [CrossRef]
  91. Henderson, M.A. An HREELS and TPD study of water on TiO2(110): The extent of molecular versus dissociative adsorption. Surf. Sci. 1996, 355, 151–166. [Google Scholar] [CrossRef]
  92. Henderson, M.A.; Epling, W.S.; Peden, C.H.F.; Perkins, C.L. Insights into photoexcited electron scavenging processes on TiO2 obtained from studies of the reaction of O2 with OH groups adsorbed at electronic defects on TiO2(110). J. Phys. Chem. B. 2003, 107, 534–545. [Google Scholar] [CrossRef]
  93. Petrik, N.G.; Kimmel, G.A. Reaction kinetics of water molecules with oxygen vacancies on rutile TiO2(110). J. Phys. Chem. C 2015, 119, 23059–23067. [Google Scholar] [CrossRef]
  94. Hameeuw, K.; Cantele, G.; Ninno, D.; Trani, F.; Iadonisi, G. Influence of surface and subsurface defects on the behavior of the rutile TiO2(110) surface. Phys. Status Solidi A Appl. Mater. 2006, 203, 2219–2222. [Google Scholar] [CrossRef]
  95. Kim, W.J.; Han, M.H.; Lebegue, S.; Lee, E.K.; Kim, H. Electronic Structure and Band Alignments of Various Phases of Titania Using the Self-Consistent Hybrid Density Functional and DFT plus U Methods. Front. Chem. 2019, 7. [Google Scholar] [CrossRef]
  96. Iacomino, A.; Cantele, G.; Ninno, D.; Marri, I.; Ossicini, S. Structural, electronic, and surface properties of anatase TiO2 nanocrystals from first principles. Phys. Rev. B 2008, 78. [Google Scholar] [CrossRef]
  97. Iacomino, A.; Cantele, G.; Trani, F.; Ninno, D. DFT Study on Anatase TiO2 Nanowires: Structure and Electronic Properties as Functions of Size, Surface Termination, and Morphology. J. Phys. Chem. C 2010, 114, 12389–12400. [Google Scholar] [CrossRef]
  98. Han, F.S.; Zhou, Z.H.; Huang, Z.X.; Li, M.T.; Guo, L.J. Effect of Water Adsorption on the Interfacial Structure and Band Edge Alignment of Anatase TiO2(001)/Water by First-Principles Molecular Dynamics. J. Phys. Chem. C 2018, 122, 26965–26973. [Google Scholar] [CrossRef]
  99. Zhang, D.Y.; Yang, M.N.; Dong, S. Improving the photocatalytic activity of TiO2 through reduction. RSC Adv. 2015, 5, 35661–35666. [Google Scholar] [CrossRef]
  100. Kunat, M.; Burghaus, U.; Woll, C. The adsorption of hydrogen on the rutile TiO2(110) surface. Phys. Chem. Chem. Phys. 2004, 6, 4203–4207. [Google Scholar] [CrossRef]
Figure 1. Side views of rutile TiO2 (001), (100), (110), and (101) surfaces. Note: Ti, blue; O, red.
Nanomaterials 09 01199 g001
Figure 2. Schematic two-step mechanism considered in the present work. The heterolytic dissociation pathway of H2 over TiO2 surface (step 1) and sequential H transfer from Ti to near O (step 2). Ti, O, and H atoms are depicted by blue, red, and white spheres, respectively.
Nanomaterials 09 01199 g002
Figure 3. The energy profile of hydrogen dissociation and H transfer from Ti to near O on four rutile TiO2 surfaces, namely (001), (100), (101), and (110). Inset images show the pathway (side view and top view) on TiO2 (001); the three other pathways are depicted in Supplementary Figures S1–S3. The bond distance is in Å.
Nanomaterials 09 01199 g003
Figure 4. Charge density difference of transition state 1(TS1)illustrating the formation of the Hδ+-Hδ− tight ion pair on the (001) surface. Yellow and green iso-surfaces show an electronic density gain and depletion, respectively.
Nanomaterials 09 01199 g004
Figure 5. Total and projected densities of state (PDOS) of the TiO2 slab, *H2, TS, *(H+, H), and *(H+-H+) for the (001) (left) and (100) (right) surfaces. For the PDOS, only the Ti and O involved in the two processes are projected. Positive density of states (DOS) correspond to spin up and negative to spin down.
Nanomaterials 09 01199 g005
Figure 6. Spin density of TS2 (a) and (H+-H+) species (b) indicating the distribution of unpaired electrons on the (001) facet. The spin densities for TS2 and (H+-H+) species on the other three facets are shown in Supplementary Figure S5.
Nanomaterials 09 01199 g006
Figure 7. Comparison of energy profile on four facets without U correction (left). Comparison of energy profile on (001) when U is 4.0 eV and without U (right).
Nanomaterials 09 01199 g007
Figure 8. Computed IR spectra of the TiO2-(H+, H) species for the four selected terminations. Intensities are given in arbitrary units.
Nanomaterials 09 01199 g008
Figure 9. Structures of (H+-H) species on (001), (100), (110), and (101) surfaces (bond distance in Å).
Nanomaterials 09 01199 g009
Figure 10. The energy profile of hydrides TiH (H+-H) species recombination with OH to desorb H2 on four facets at 0 K, U = 4 eV.
Nanomaterials 09 01199 g010
Figure 11. The heterolytic pathway of H2 dissociation and subsequent H transfer from Ti to O nearby on four (ad) TiO2 facets, considering zero point energy (red lines). Blue lines indicate the profiles for T = 298 K.
Nanomaterials 09 01199 g011
Table 1. Size, composition, layers, and coordination numbers of atomic surface.
Surface(001)(100)(110)(101)
Supercell1 × 11 × 12 × 21 × 1
Composition (TiO2 units)8.008.0032.008.00
TiO2 layers (frozen/relaxed)8848
4/44/42/24/4
Coordination O(2) O(2,3) O(2,3) O(2,3)
Ti(4)Ti(5)Ti(5,6)Ti(4,5)
Parameter: a, b in Åa = 4.661a = 4.661a = 6.018a = 5.522
b = 4.661b = 2.962b = 13.096b = 4.661
Automatic k-point = 1/30 Å−1 5 × 5 × 15 × 8 × 14 × 2 × 15 × 5 × 1
Esurf (J nm−2)1.300.730.551.07
Table 2. Reaction energy (∆E), dissociation activation energy ( E a c t f o r w ), and backward activation energies ( E a c t b a c k eV) for step 1, and the H transfer barrier of step 2 (Eact2). Values in brackets are energies without U correction (see below and Supplementary Information). All energies are referred to the physisorbed TiO2-H2 system. * indicates adsorption state.
(001)(100)(110)(101)
H2 *0.00 (0.00)0.00 (0.00)0.00 (0.00)0.00 (0.00)
TS10.56 (0.63)1.08 (1.15)0.50 (0.70)0.79 (1.10)
(H+-H)−0.08 (0.15)0.68 (0.98)0.12 (0.50)−0.08 (0.28)
TS21.78 (1.98)2.38 (2.52)1.80 (1.86)1.22 (1.50)
(H+-H+)−0.61 (0.03)0.15 (0.78)−1.32 (−0.79)−1.56 (−0.22)
∆E1−0.08 (0.15)0.68 (0.98)0.12 (0.68)−0.08 (0.28)
E a c t f o r w 0.56 (0.63)1.08 (1.15)0.50 (0.70)0.79 (1.10)
E a c t b a c k 0.64 (0.48)0.40 (0.17)0.38 (0.20)0.87 (0.82)
∆E2−0.53 (−0.12)−0.53 (−0.20)−1.44 (−1.47)−1.48 (−0.50)
Eact21.86 (1.83)1.70 (1.54)1.68 (1.18)1.40 (1.22)
Table 3. Bader charges (|e|) of H and involved Ti and Oa in the H2 dissociation process, and involved H, Ti, and Ob in subsequent H transfer from Ti to O process for H2 *, TS and (H+-H), and (H+-H+). For step 1, the O involved was labeled Oa, and Ob in step 2.
qTi+
/qO
qH+/qH
qTi+/qOa
qH+/qH
qTi+/qOb
qH+/qH+
/qTi+/qOb
SlabH2 *TS1(H+-H)-Oa(H+-H)-ObTS2(H+-H+)
(001)1.98/−1.000.02/−0.01 /1.98/−1.000.48/−0.41 /1.97/−1.020.67/−0.42 /1.95/−1.220.67/−0.42 /1.95/−0.980.63/−0.10 /1.90/−0.970.65/0.61 /1.79/−1.26
(100)2.03/−1.070.04/−0.02 /2.01/−1.070.43/−0.32 /1.96/−1.120.65/−0.30 /1.90/−1.240.65/−0.30 /1.90/−0.980.64/−0.01 /1.77/−1.100.60/0.60 /1.78/−1.27
(110)2.01/−0.900.04/−0.02 /2.04/−0.920.35/−0.31 /2.01/−0.970.70/−0.34 /1.93/−1.22 0.70/−0.34 /1.93/−0.910.67/0.00 /1.95/−0.920.64/0.62 /1.87/−1.15
(101)1.99/−0.960.04/−0.03 /1.98/−0.960.38/−0.40 /1.97/−1.030.67/−0.40 /1.96/−1.200.67/−0.40 /1.96/−0.930.60/−0.10 /1.90/−1.250.60/0.66 /1.83/−1.30
Table 4. The number of unpaired electrons of TS2 and (H+-H+) species. Only involved atoms are shown.
Slab(001)(100)(110)(101)Slab(001)(100)(110)
SpeciesTS2(H+-H+)TS2(H+-H+)TS2(H+-H+)TS2(H+-H+)
Total1.702.001.902.001.922.001.702.00
Ti0.800.970.990.910.240.900.800.99
Ti0.161.000.111.050.240.900.160.99
O0.240.000.020.000.000.000.240.00
H10.440.000.870.000.970.000.440.00
H20.000.000.000.000.100.000.000.00
Table 5. Computed IR wavenumbers (cm−1) and intensities (in brackets) of Ti−H and O−H stretching modes of (H+, H) species for the four terminations studied.
Stretching Modes(001)(100)(110)(101)
(Ti-H)1644.78 (0.39)1768.74 (0.52)1653.87 (0.32)1577.45 (0.76)
(O-H)3742.87 (0.05)2976.54 (1.56)3606.59 (0.22)3622.37 (0.44)