
Damage Tolerance of a Stiffened Composite Panel with an Access Cutout under Fatigue Loading and Validation Using FEM Analysis and Digital Image Correlation
 , and
, and
Abstract
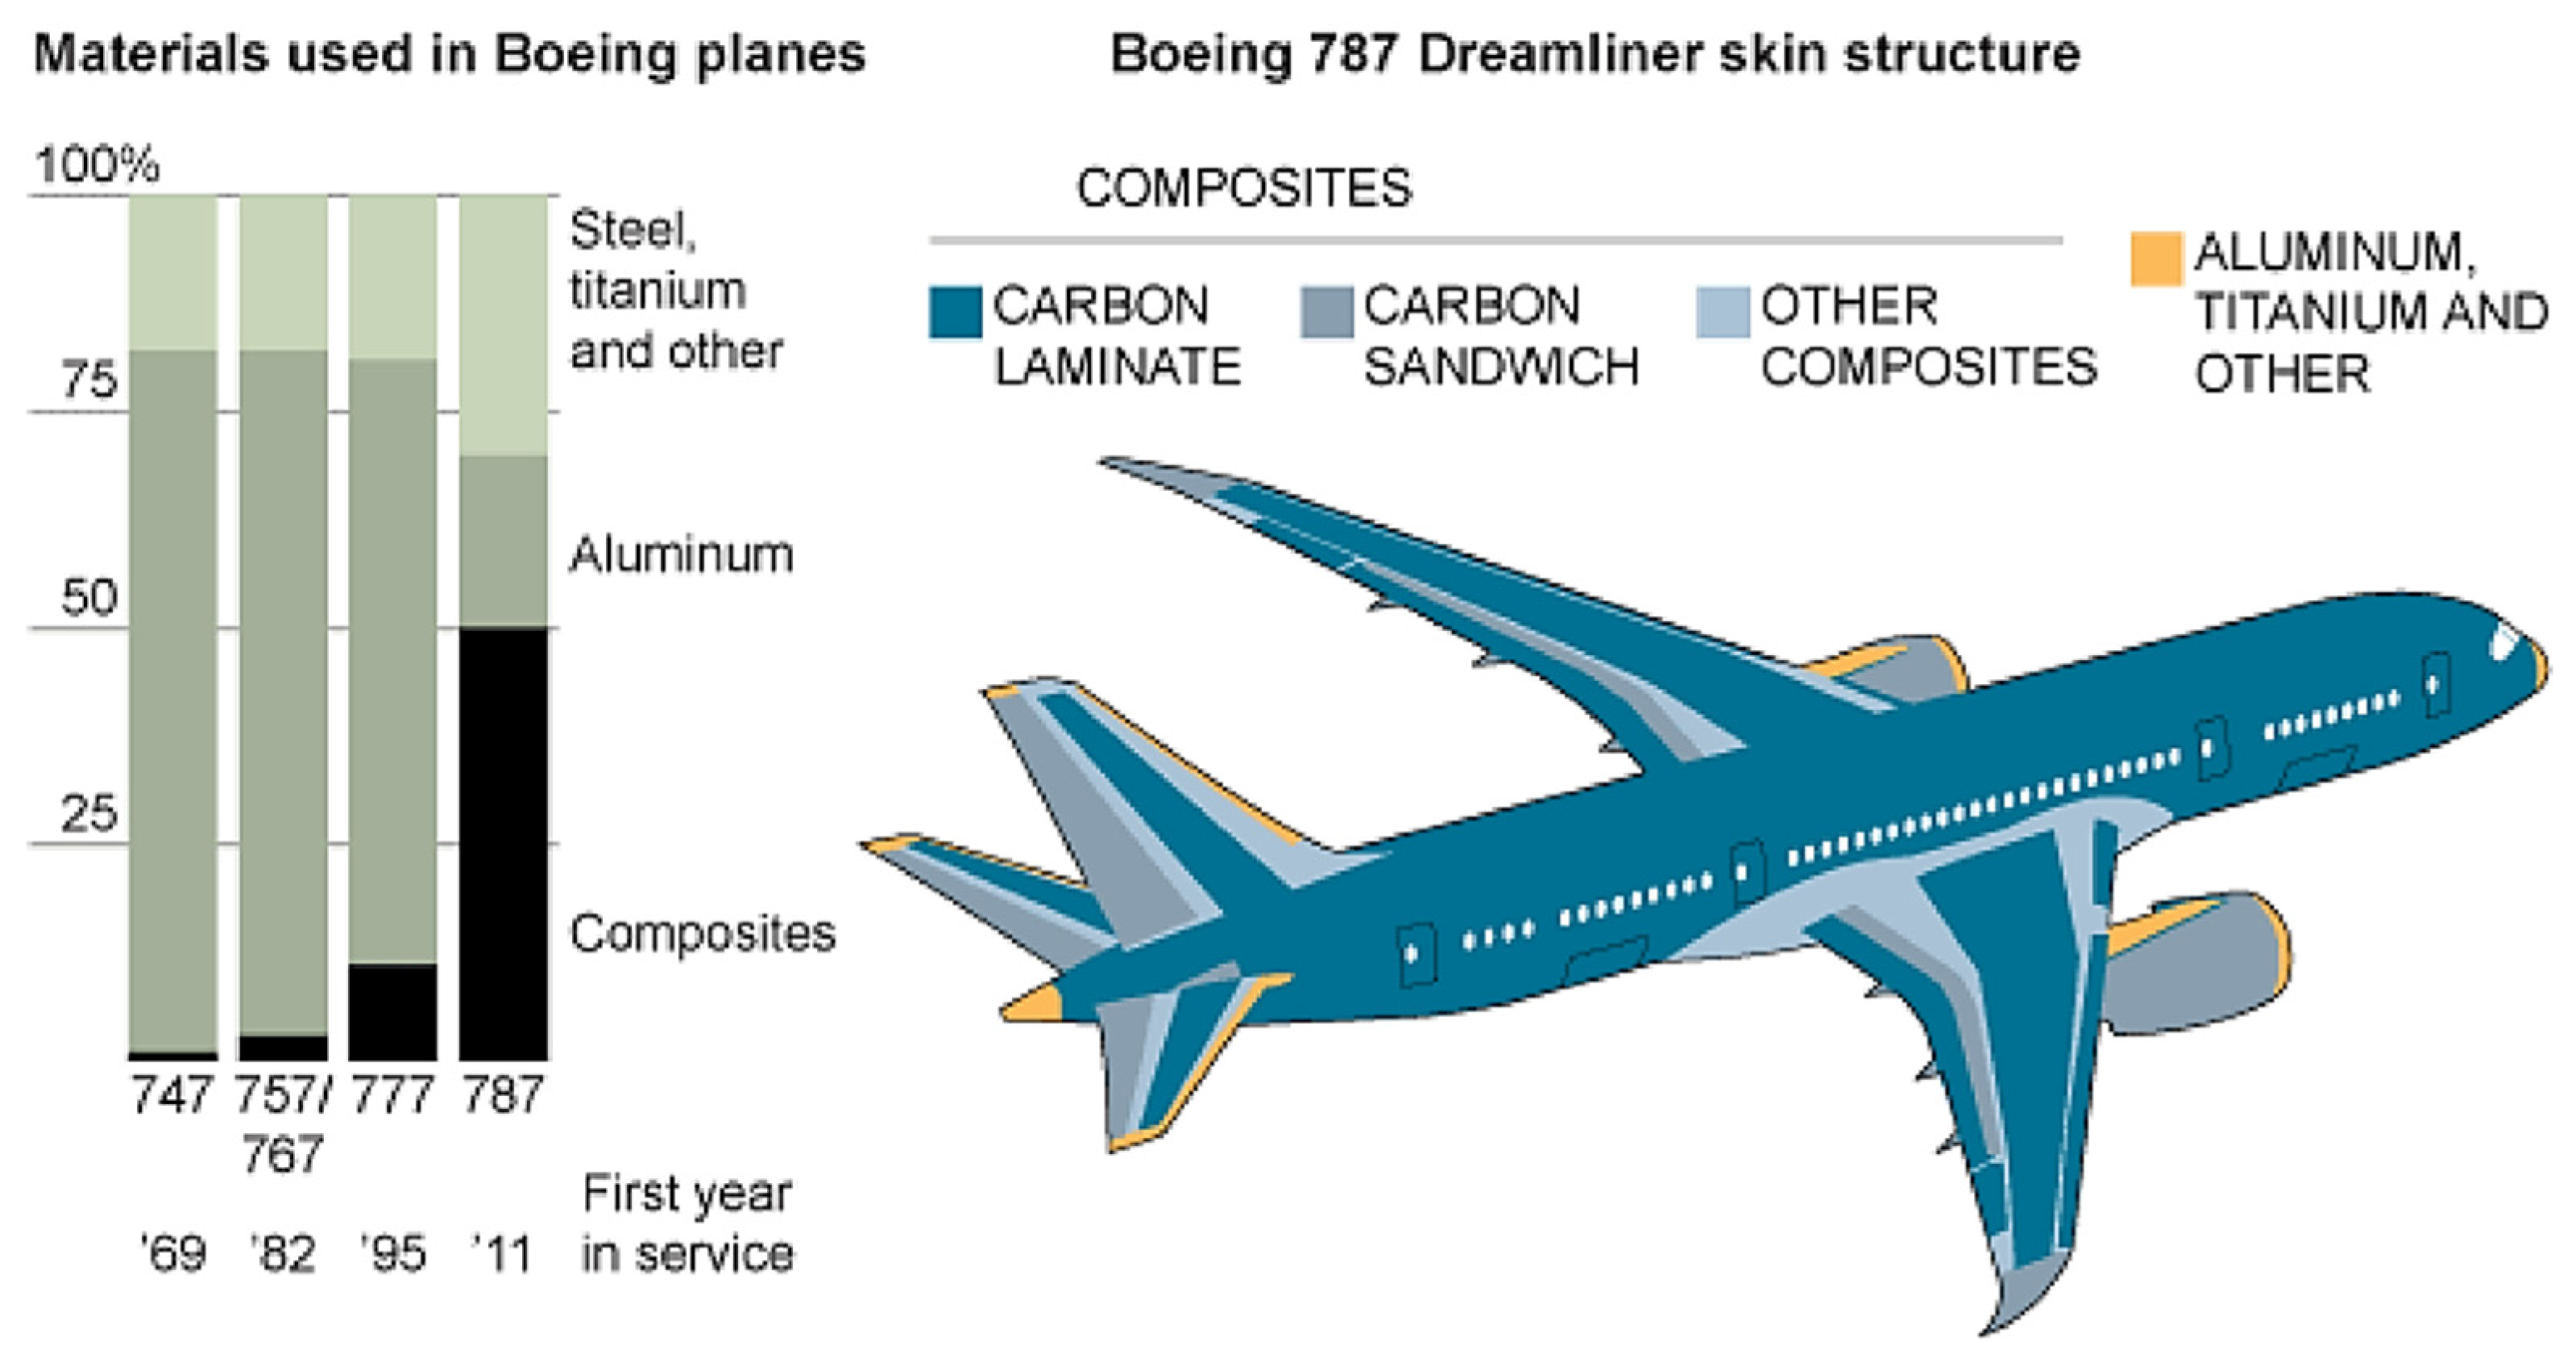
:1. Introduction
2. Materials and Methods
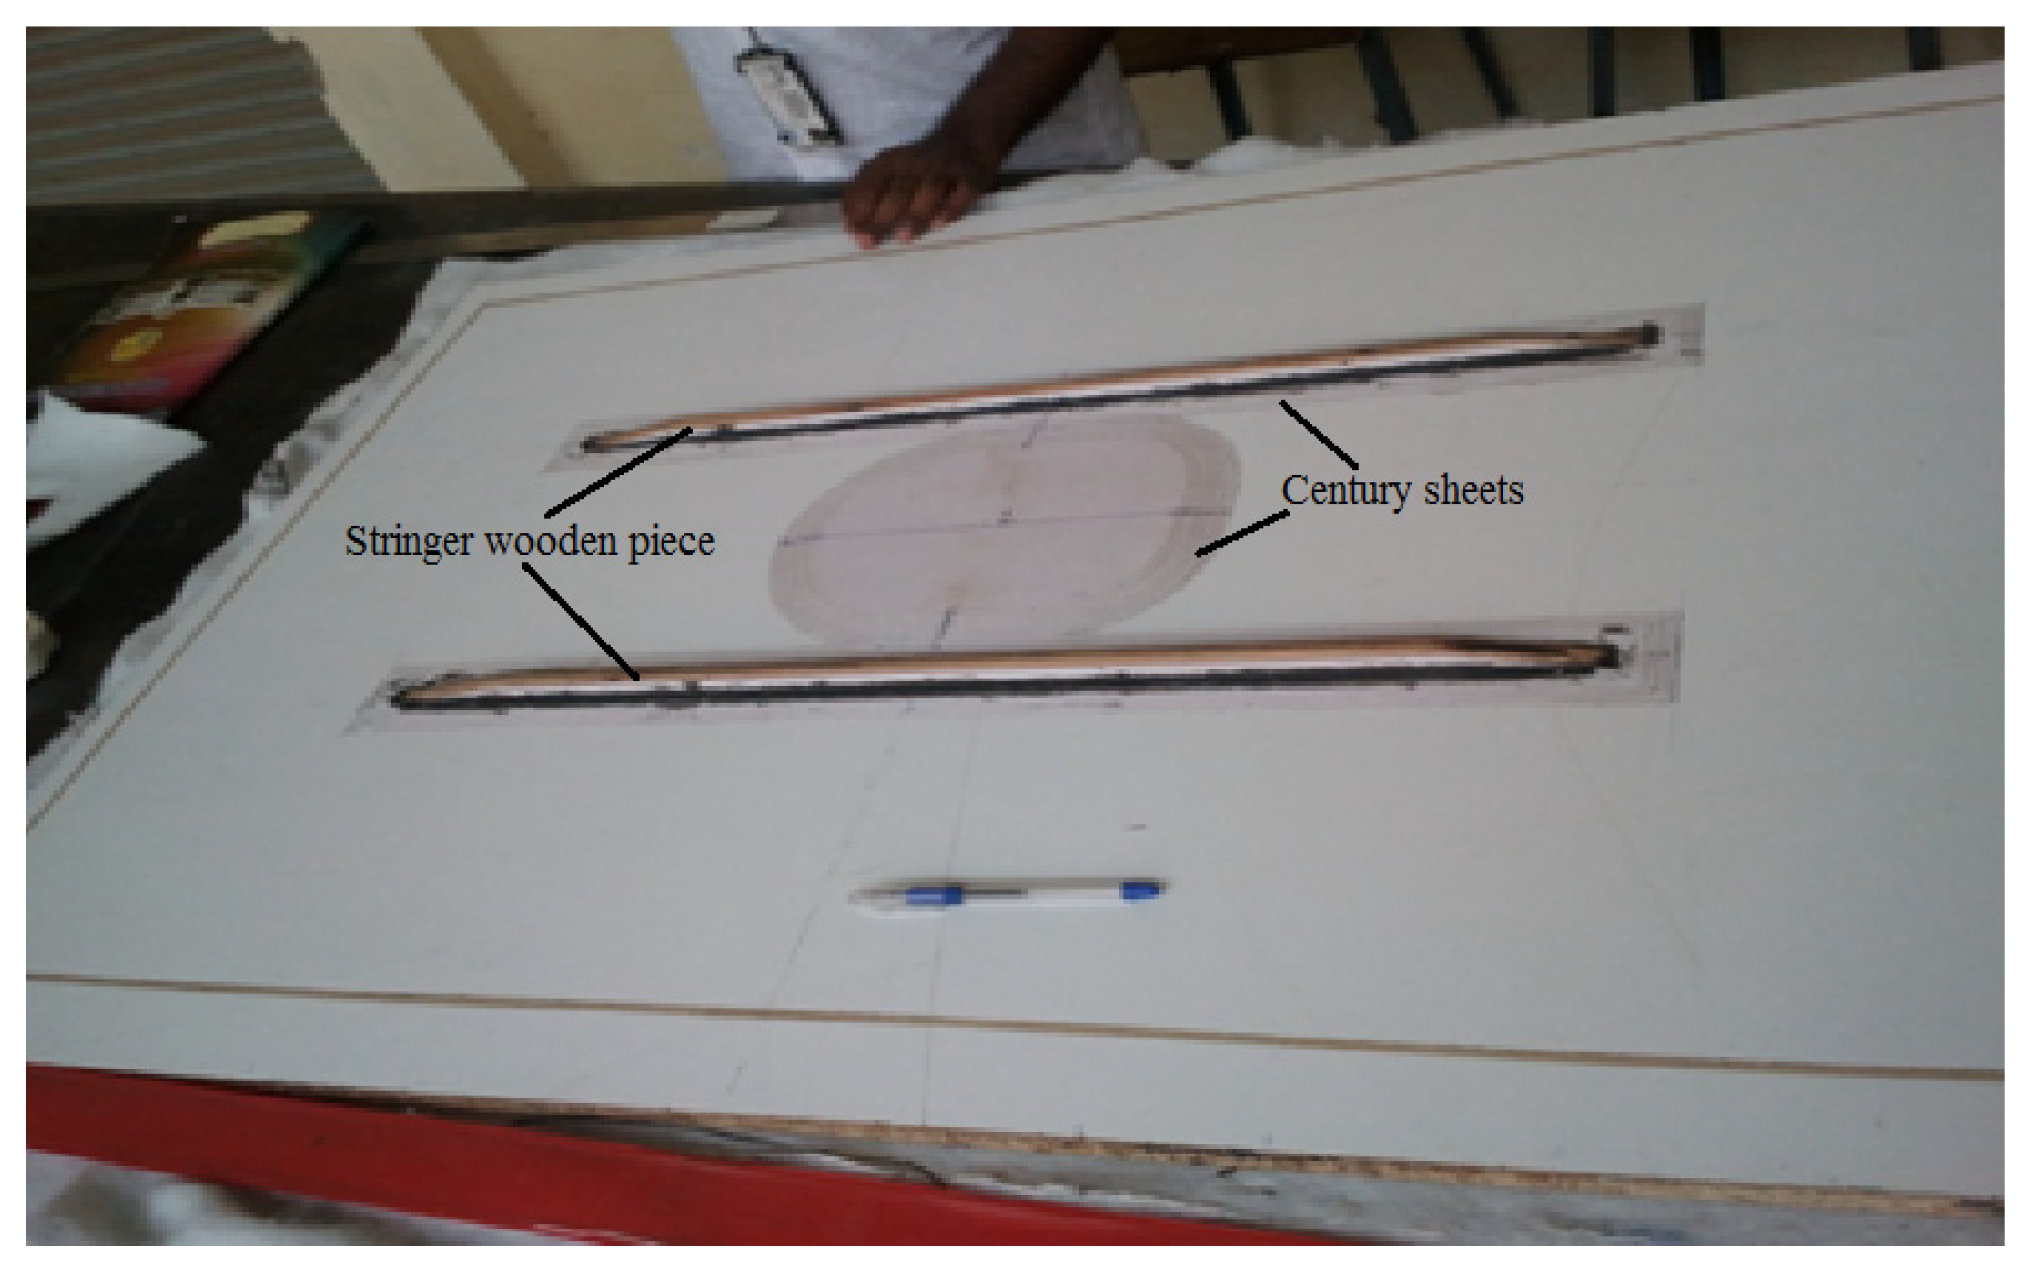
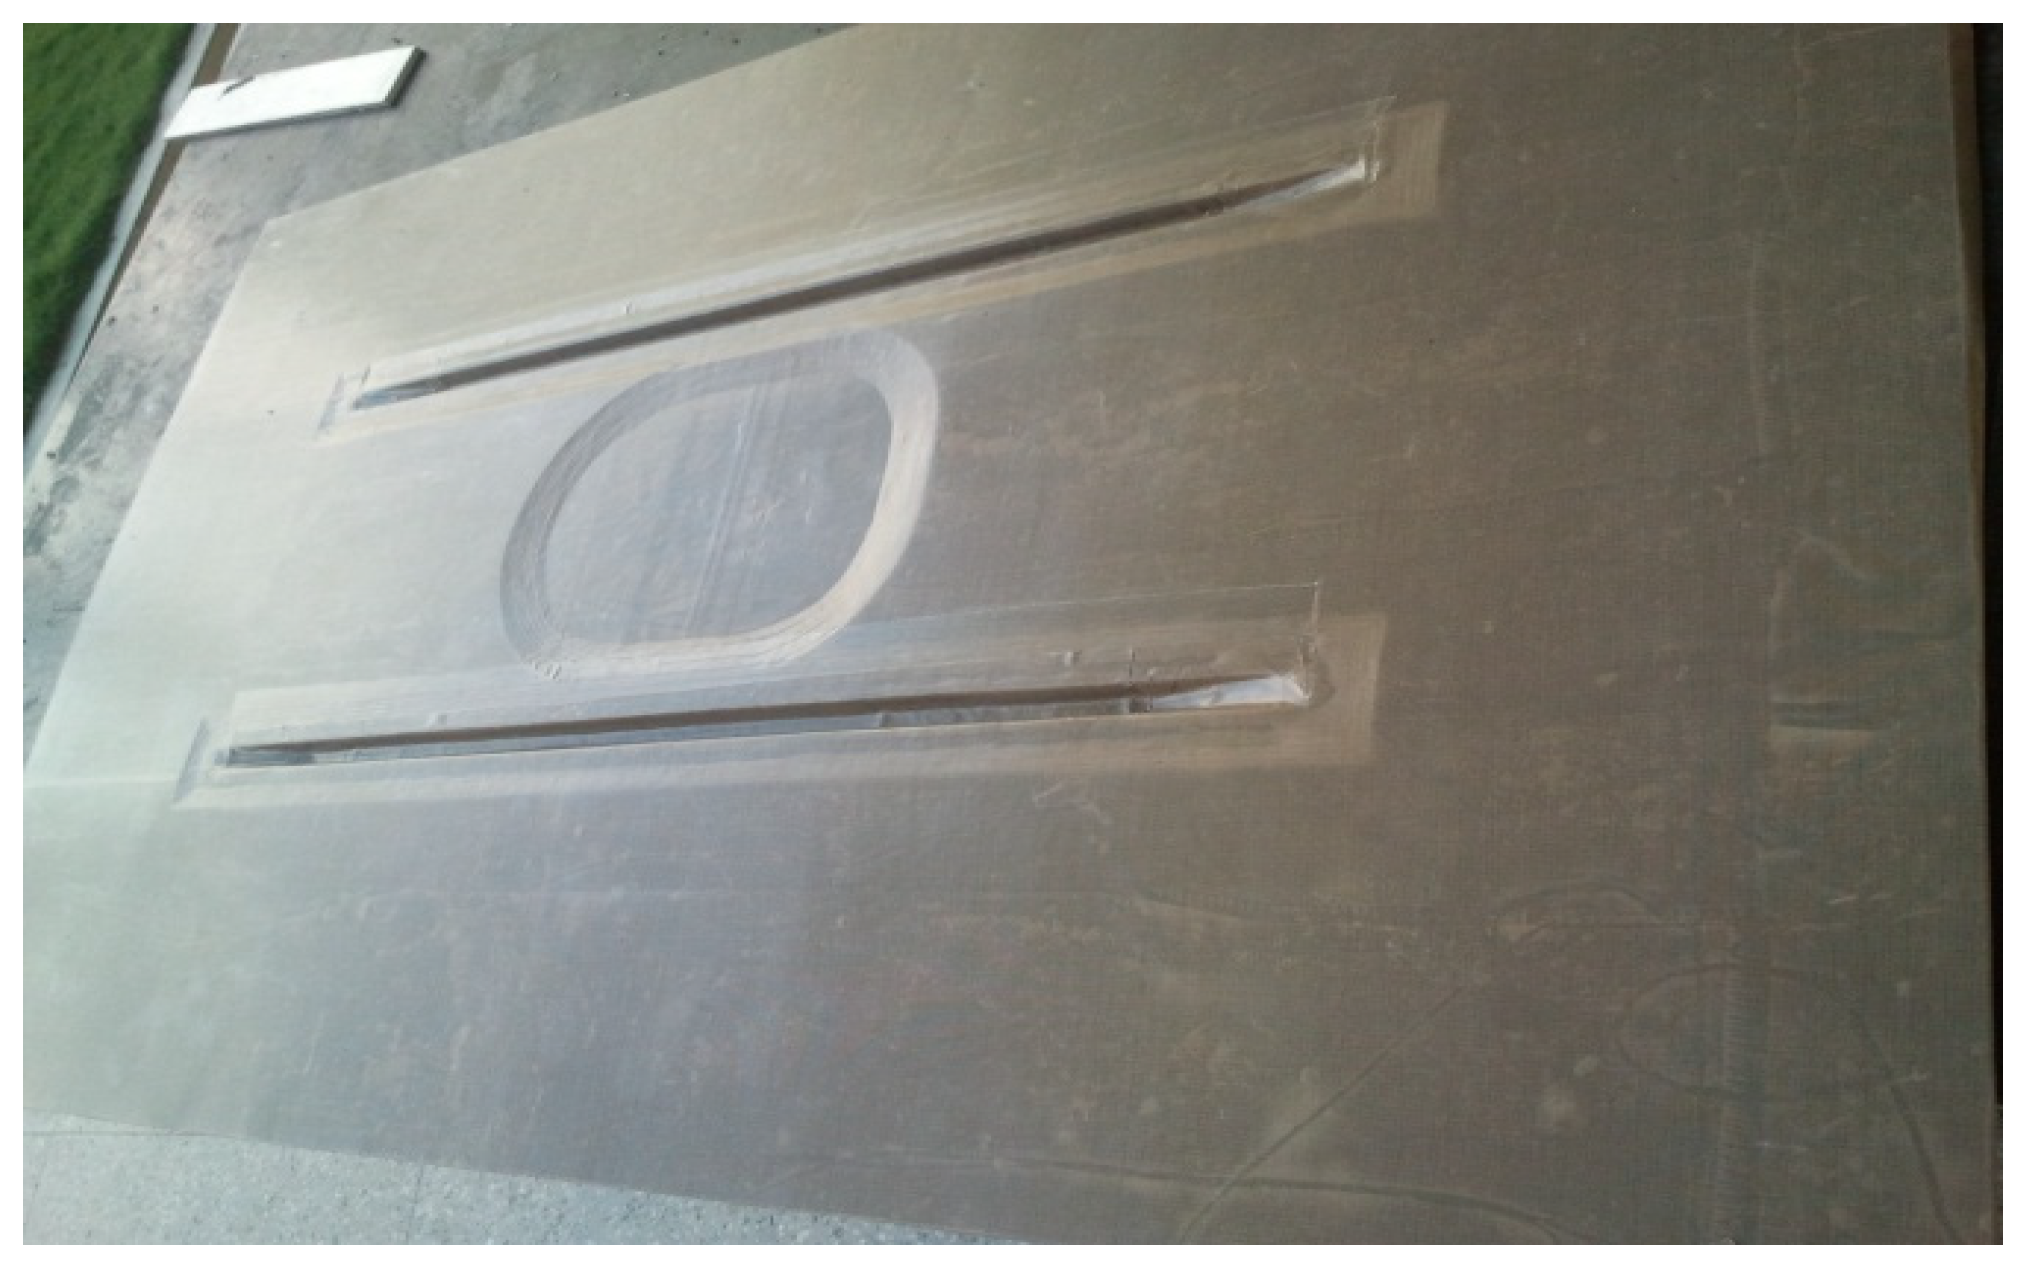
2.1. Tools and Caul Plate Fabrication
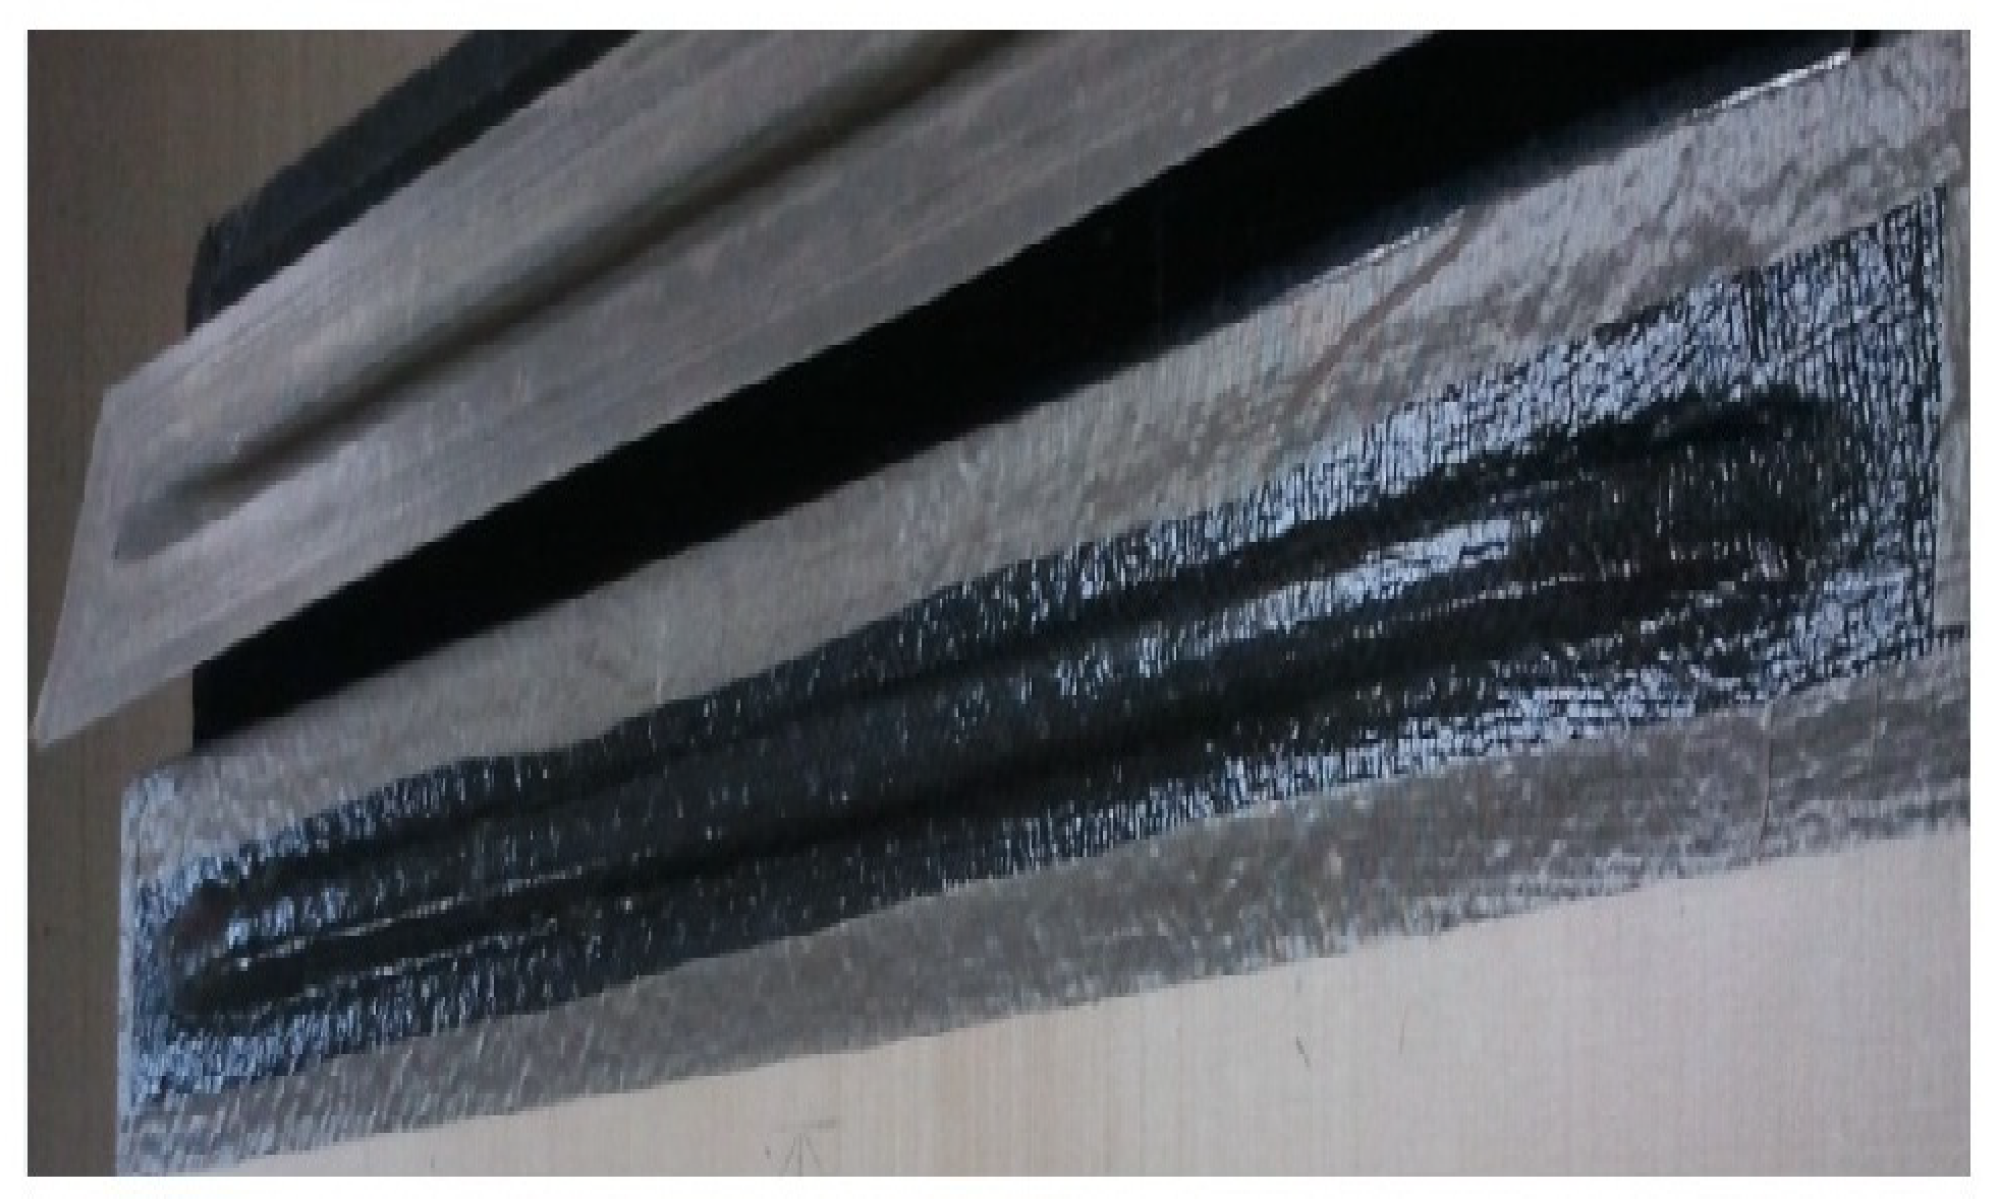
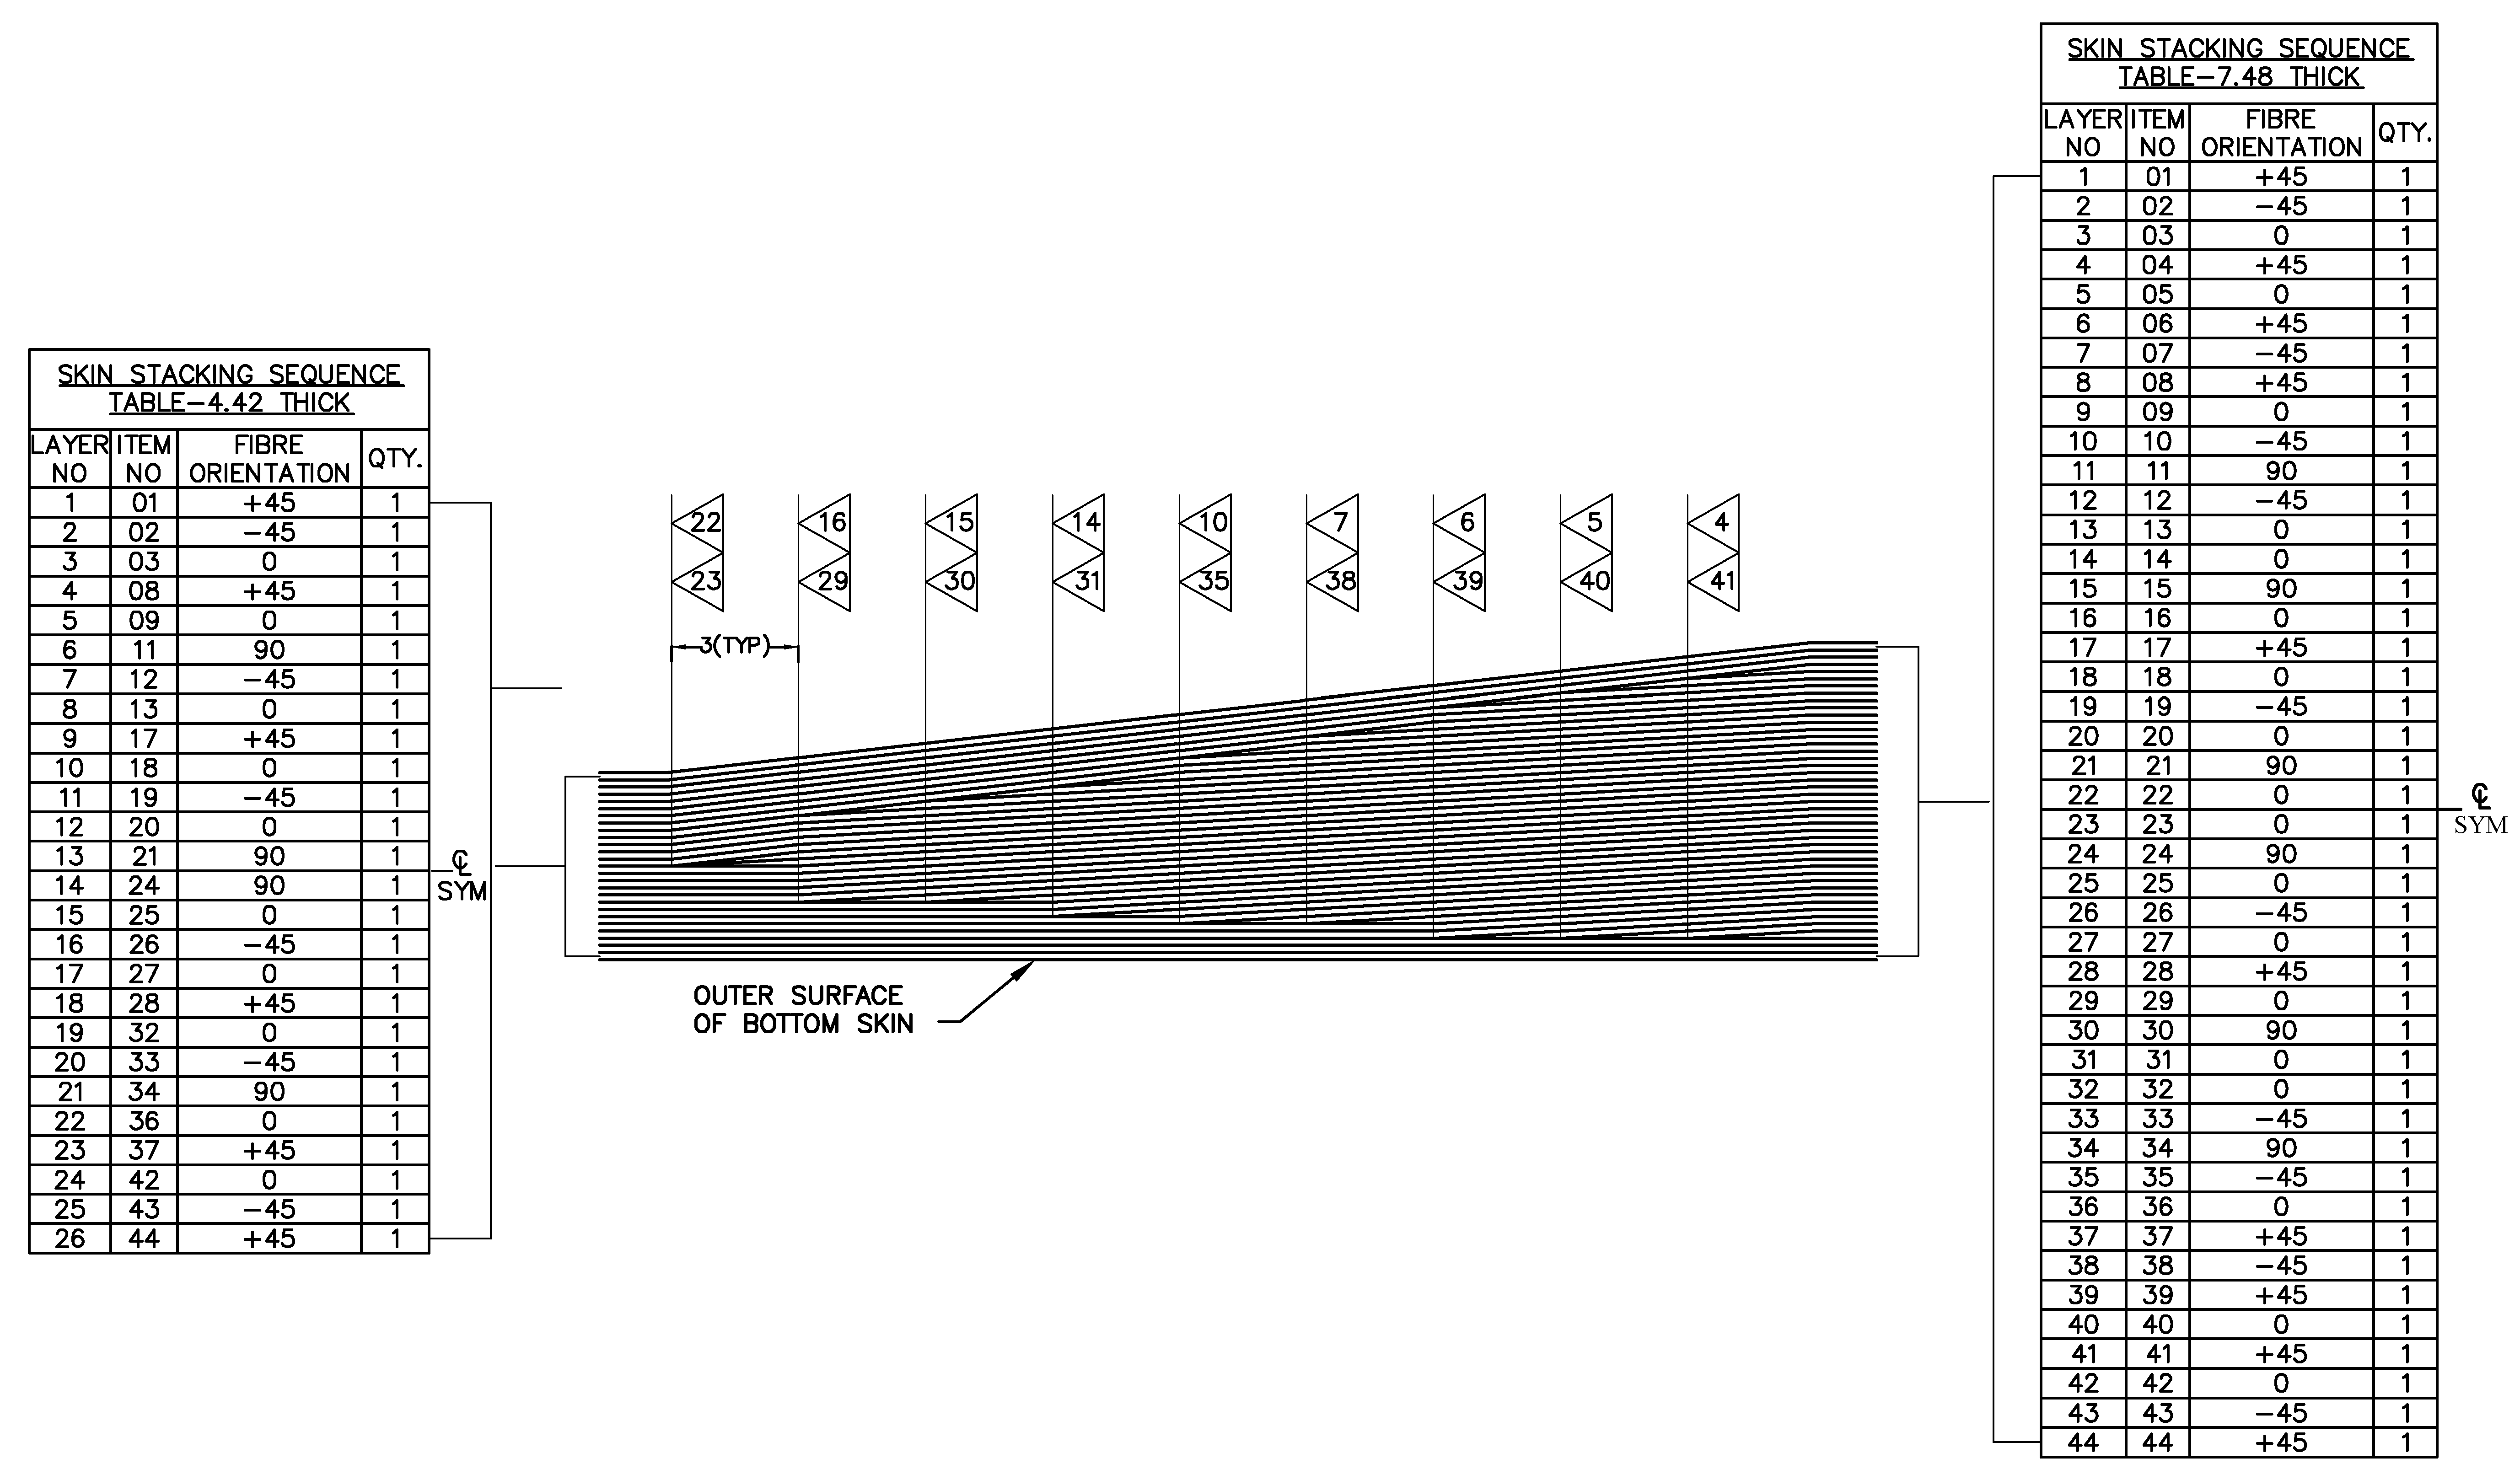
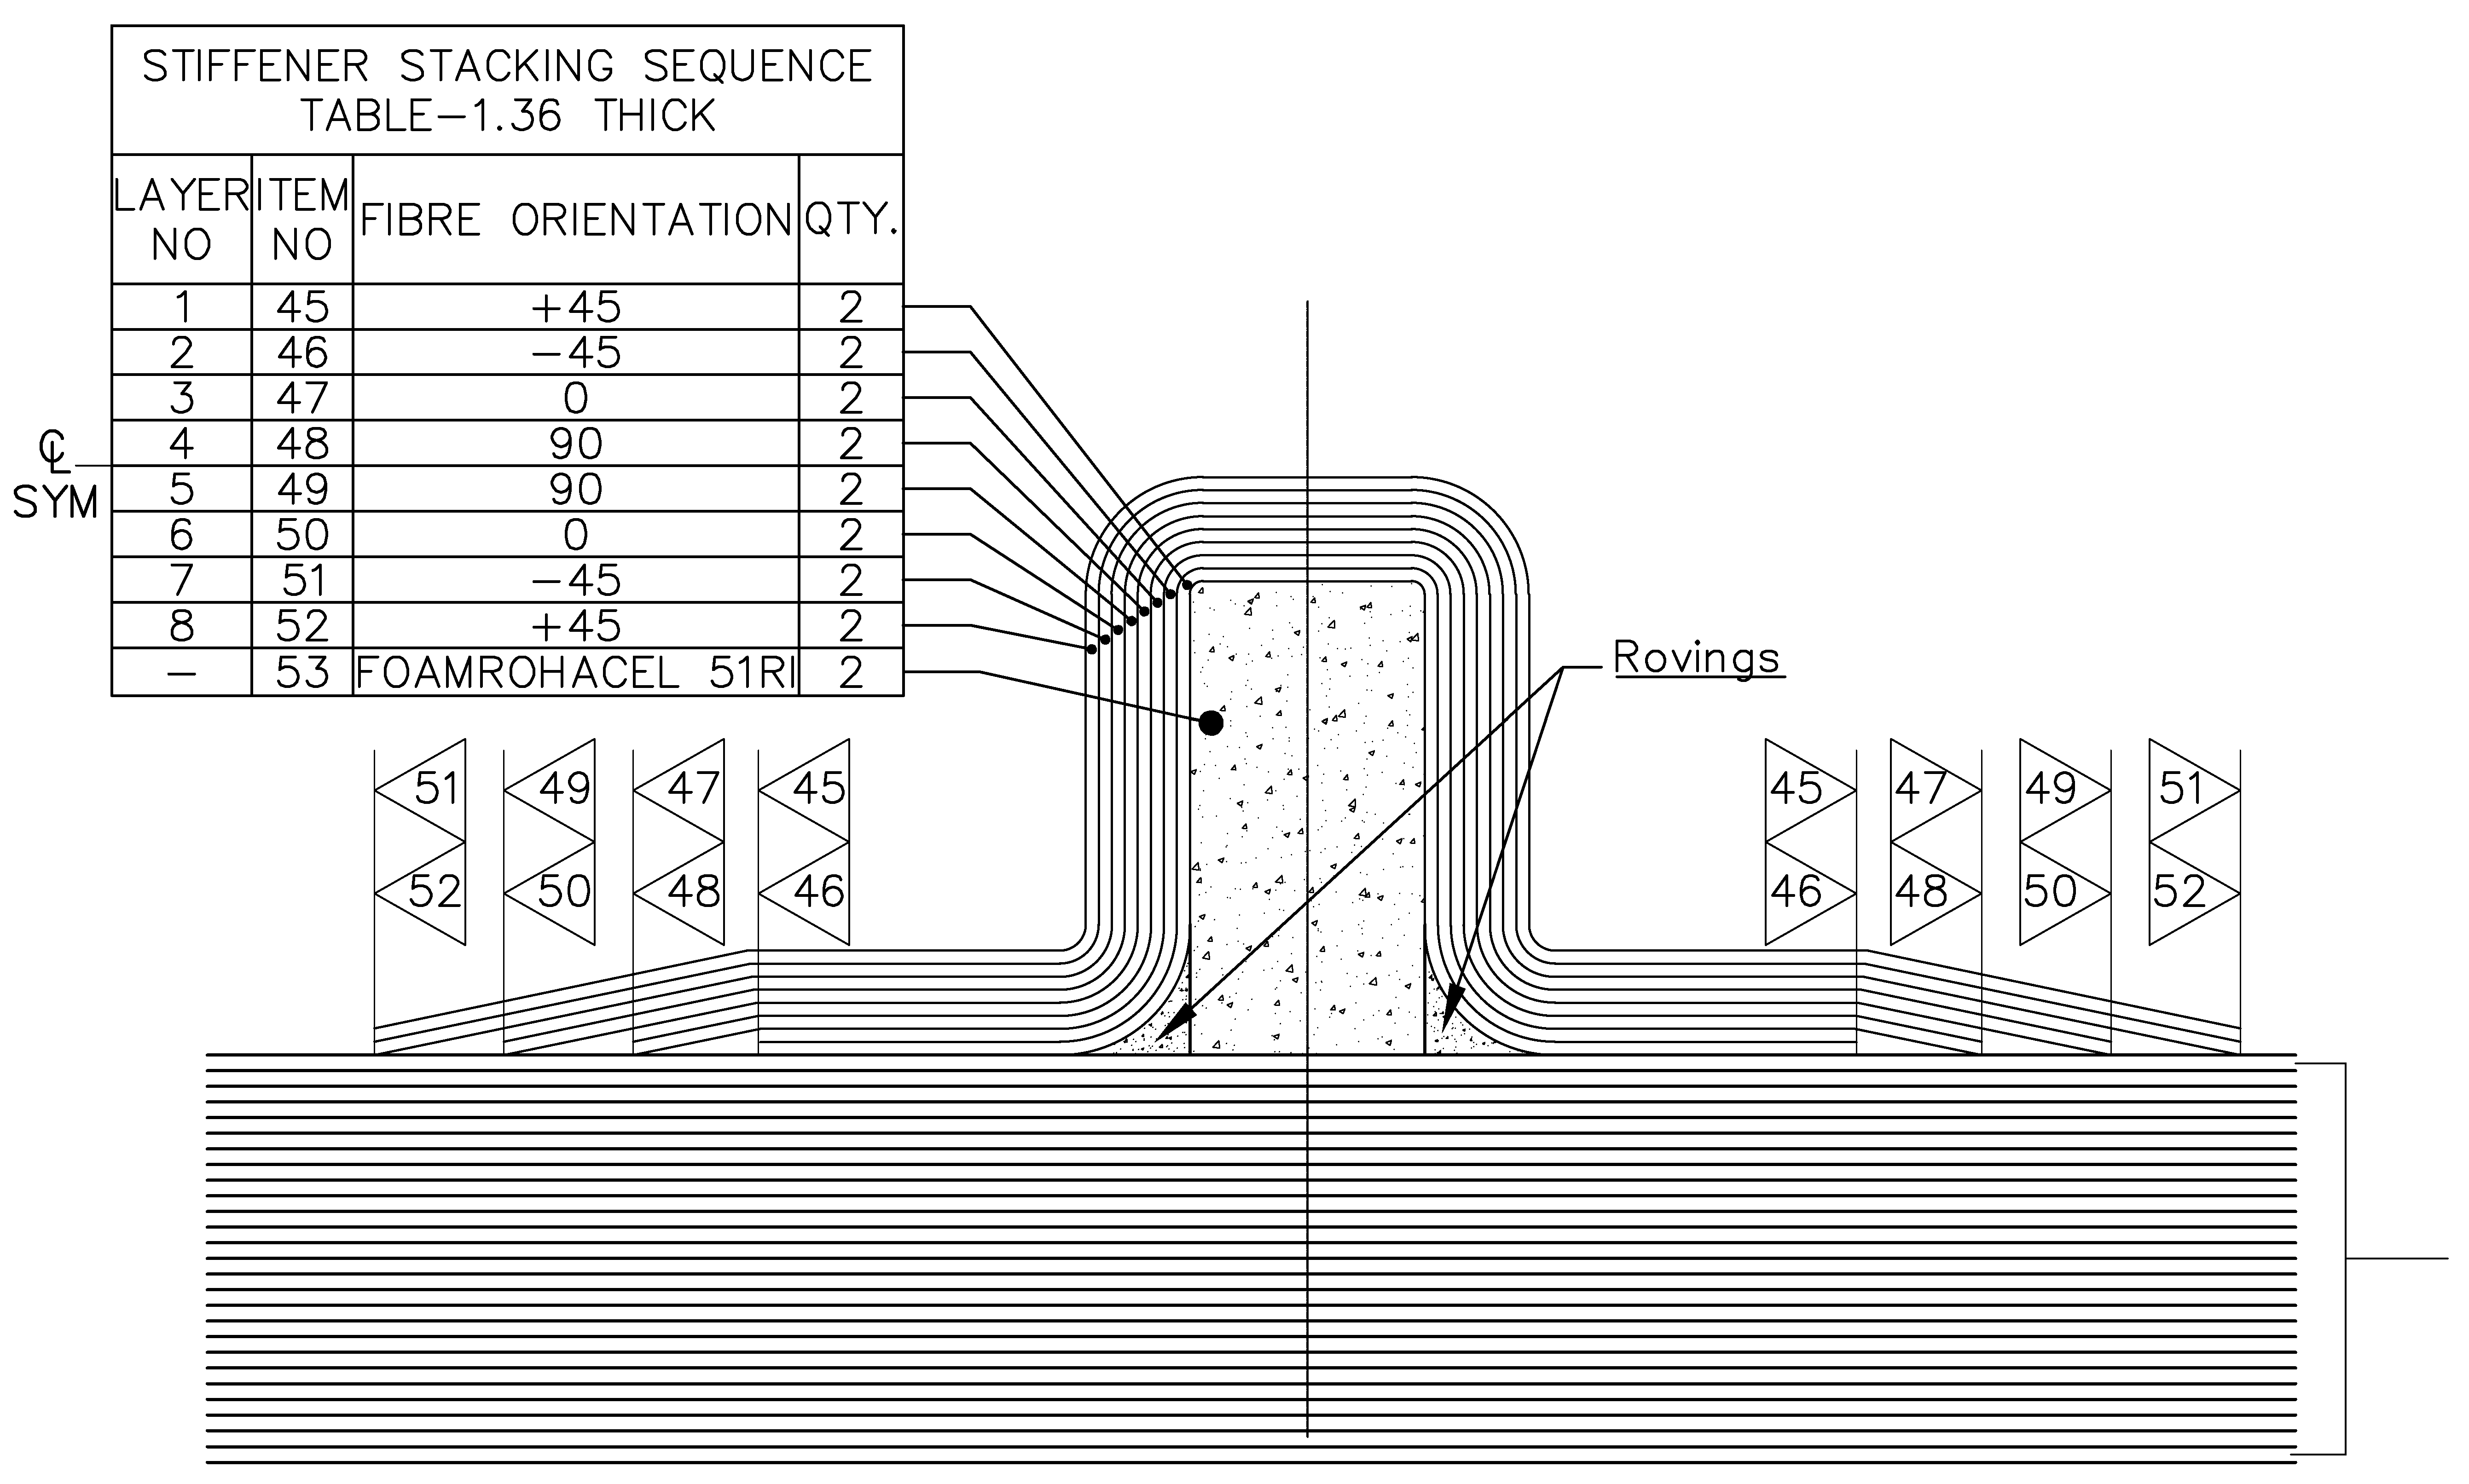
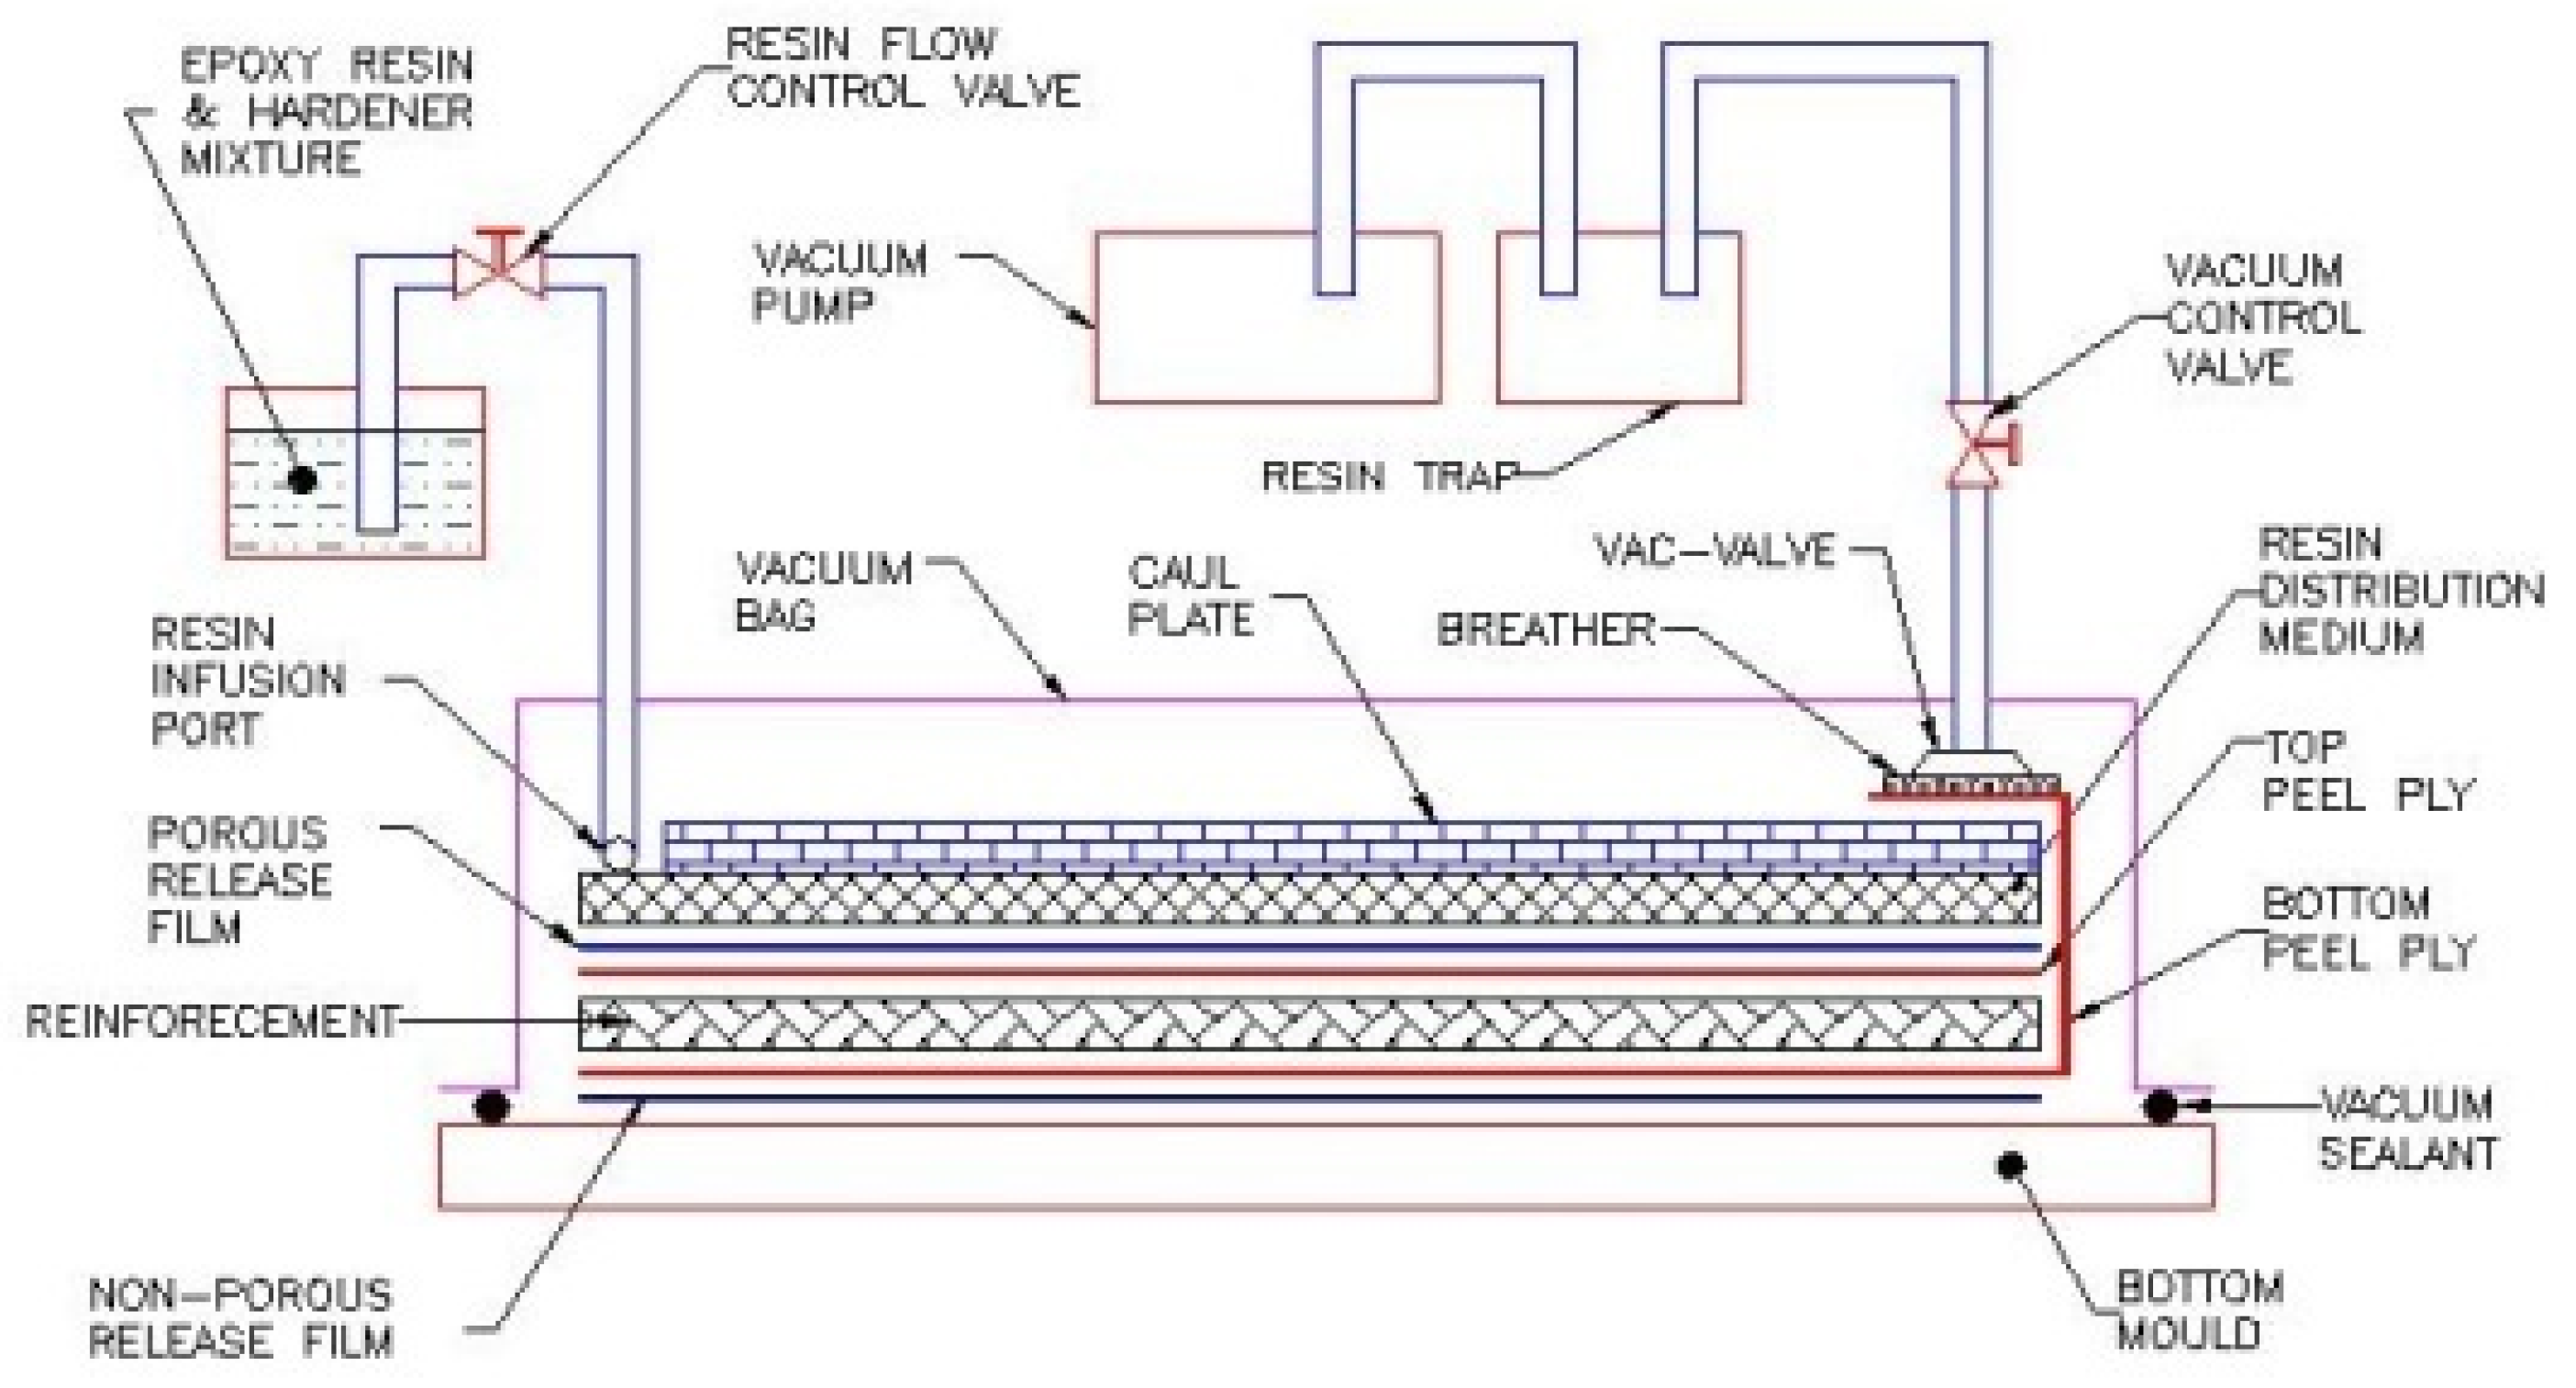
2.2. Fabrication of Composite Panel
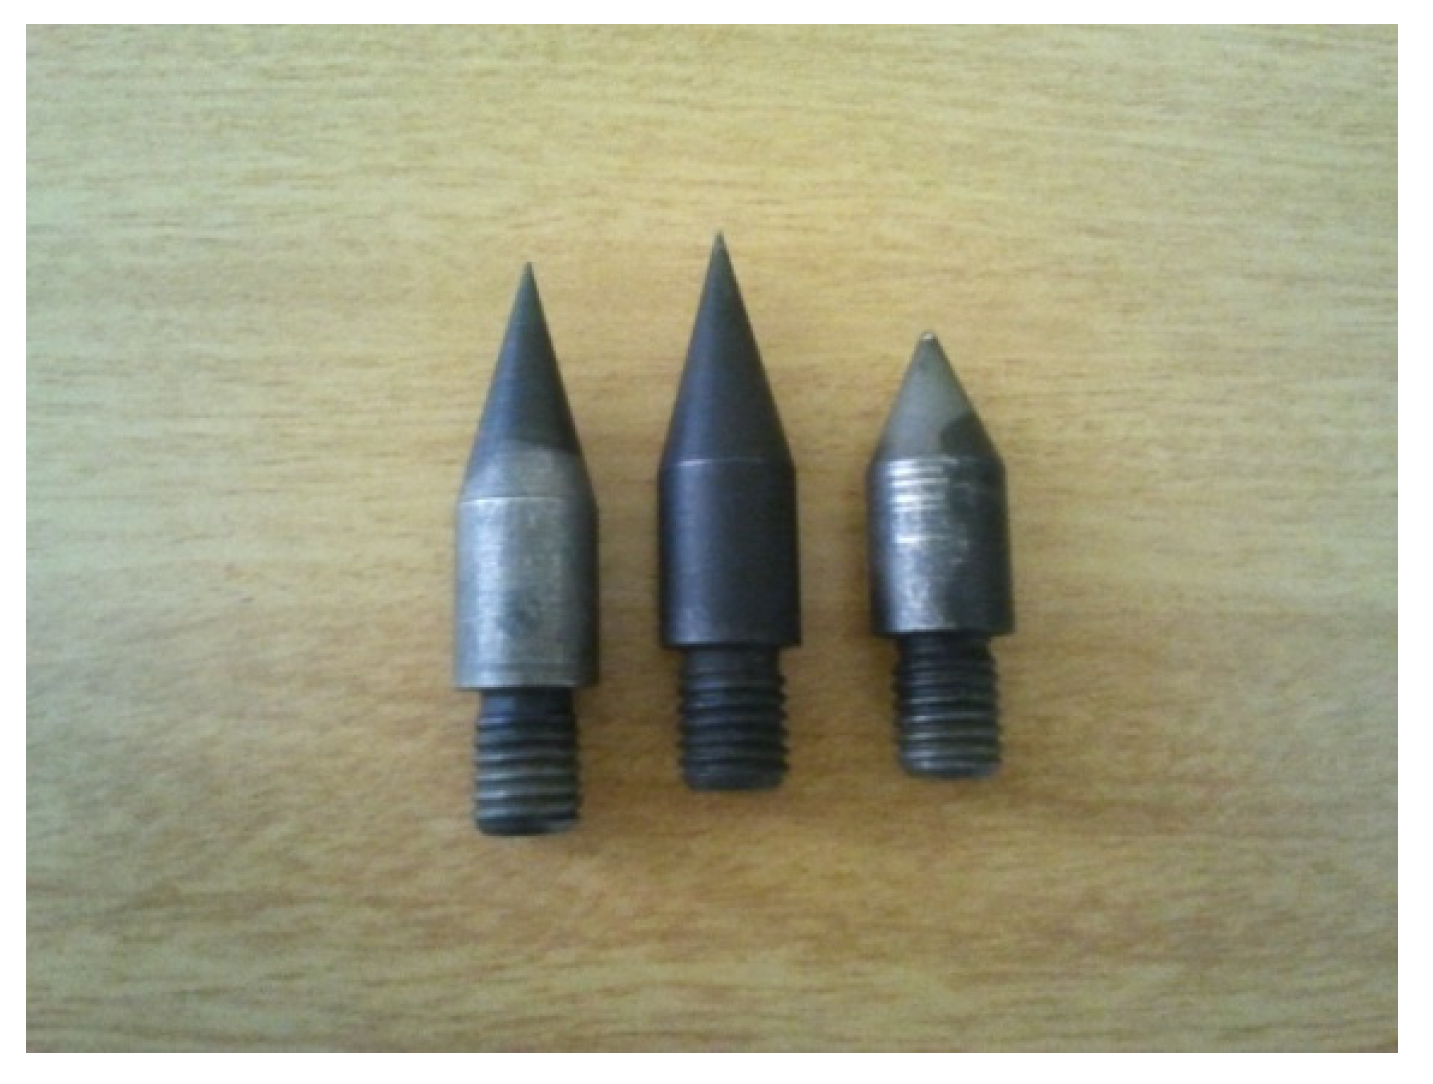
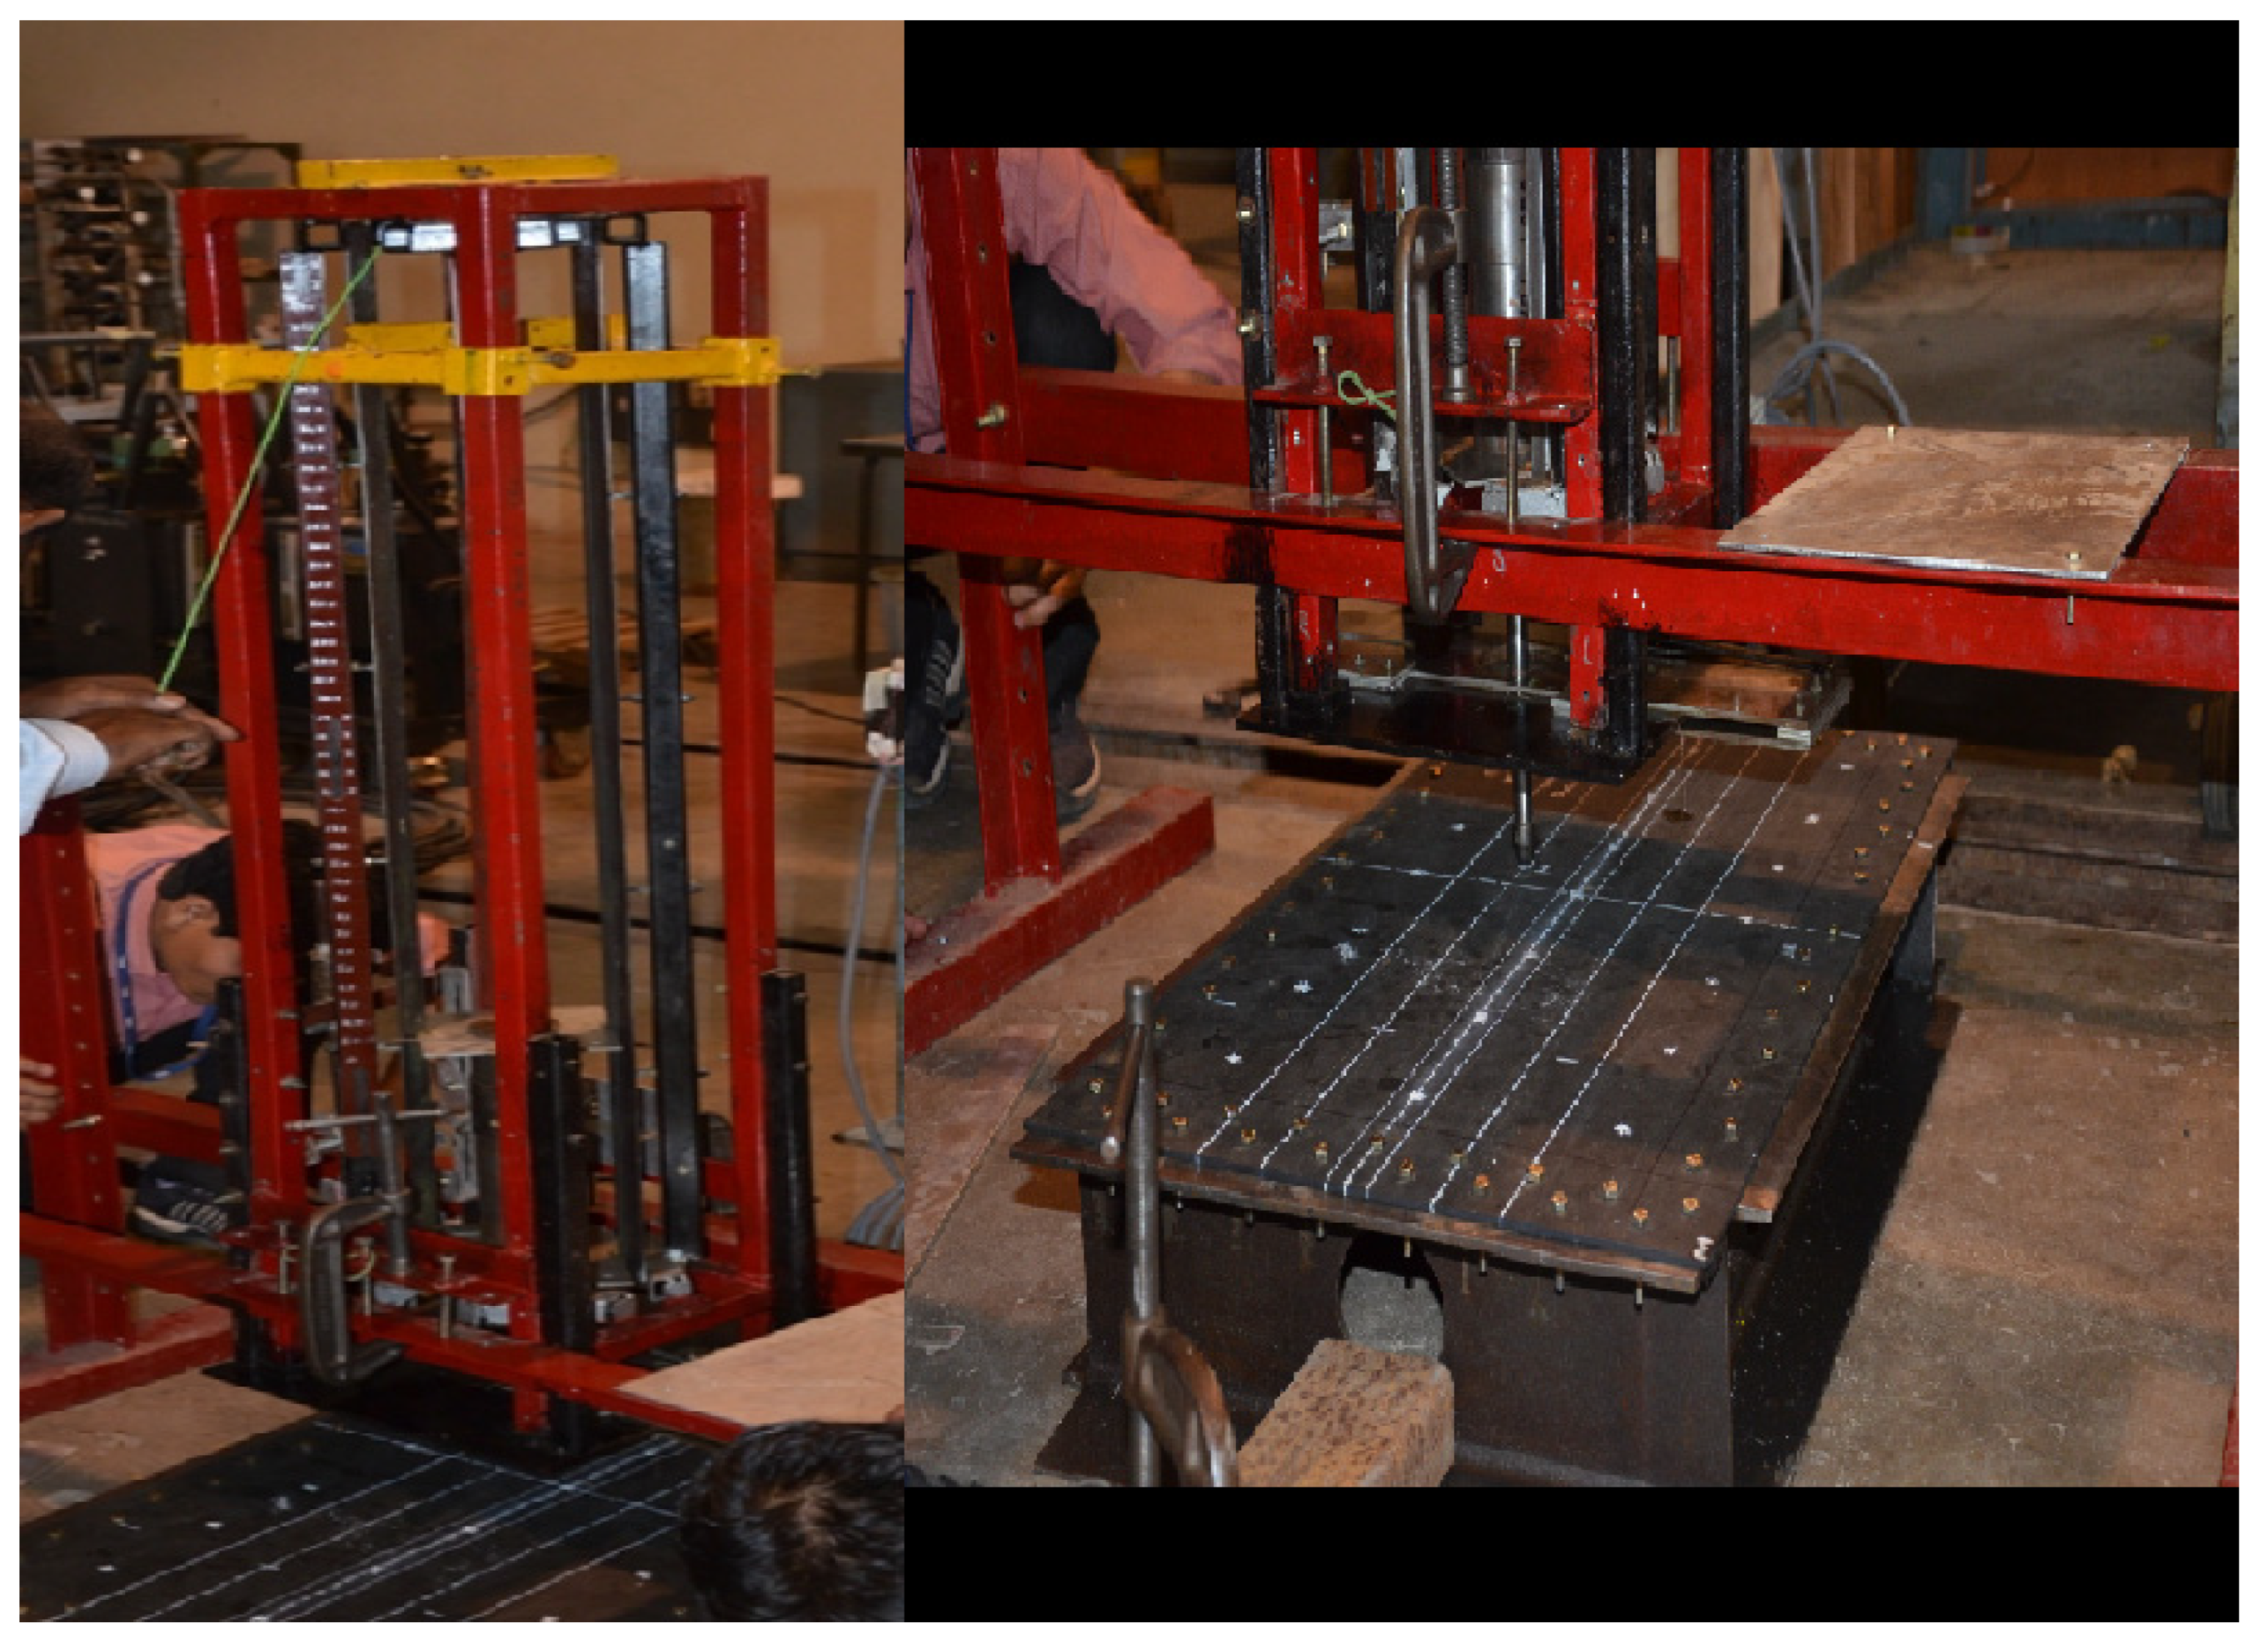
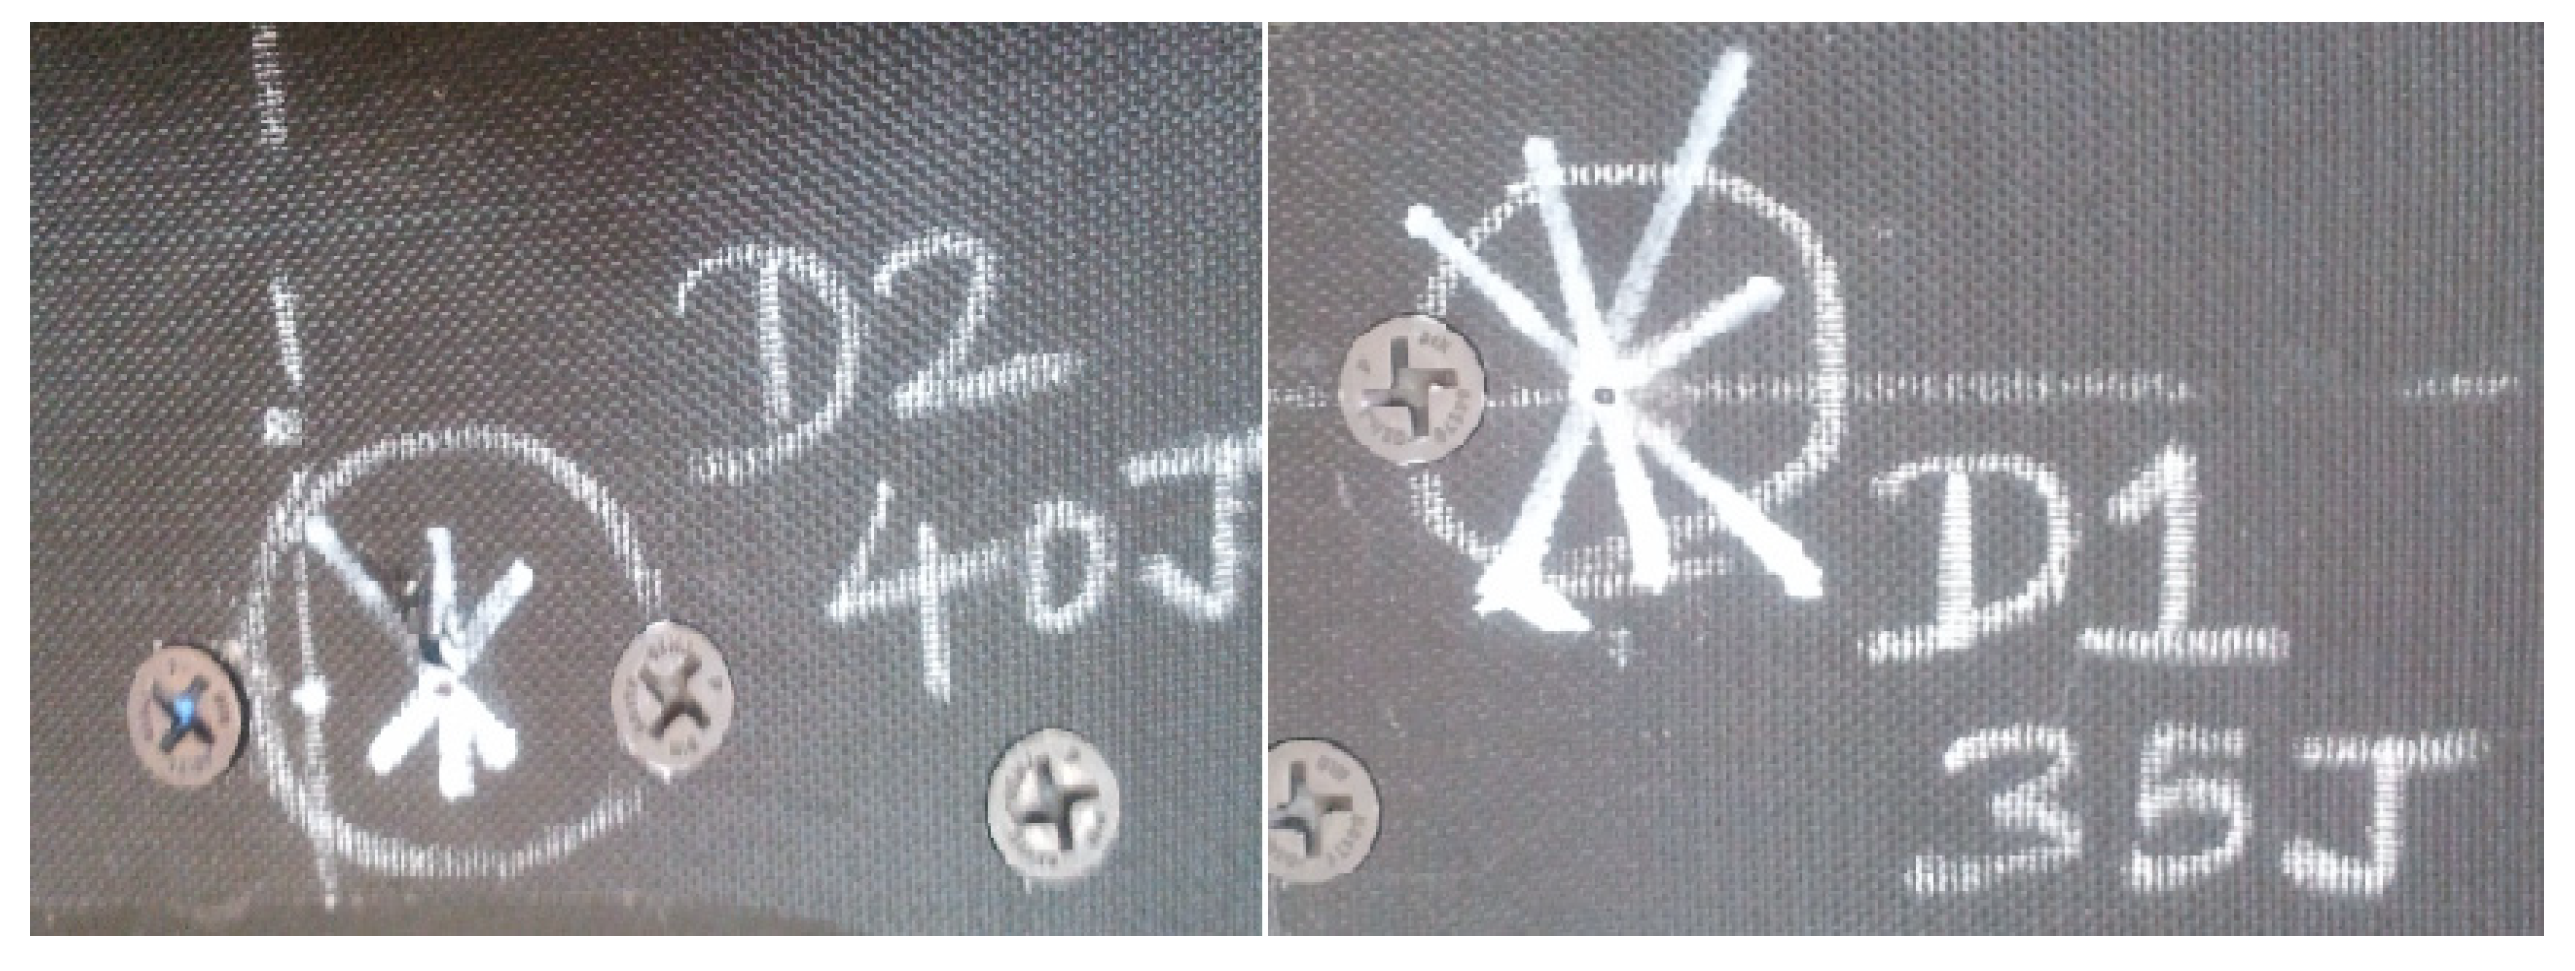
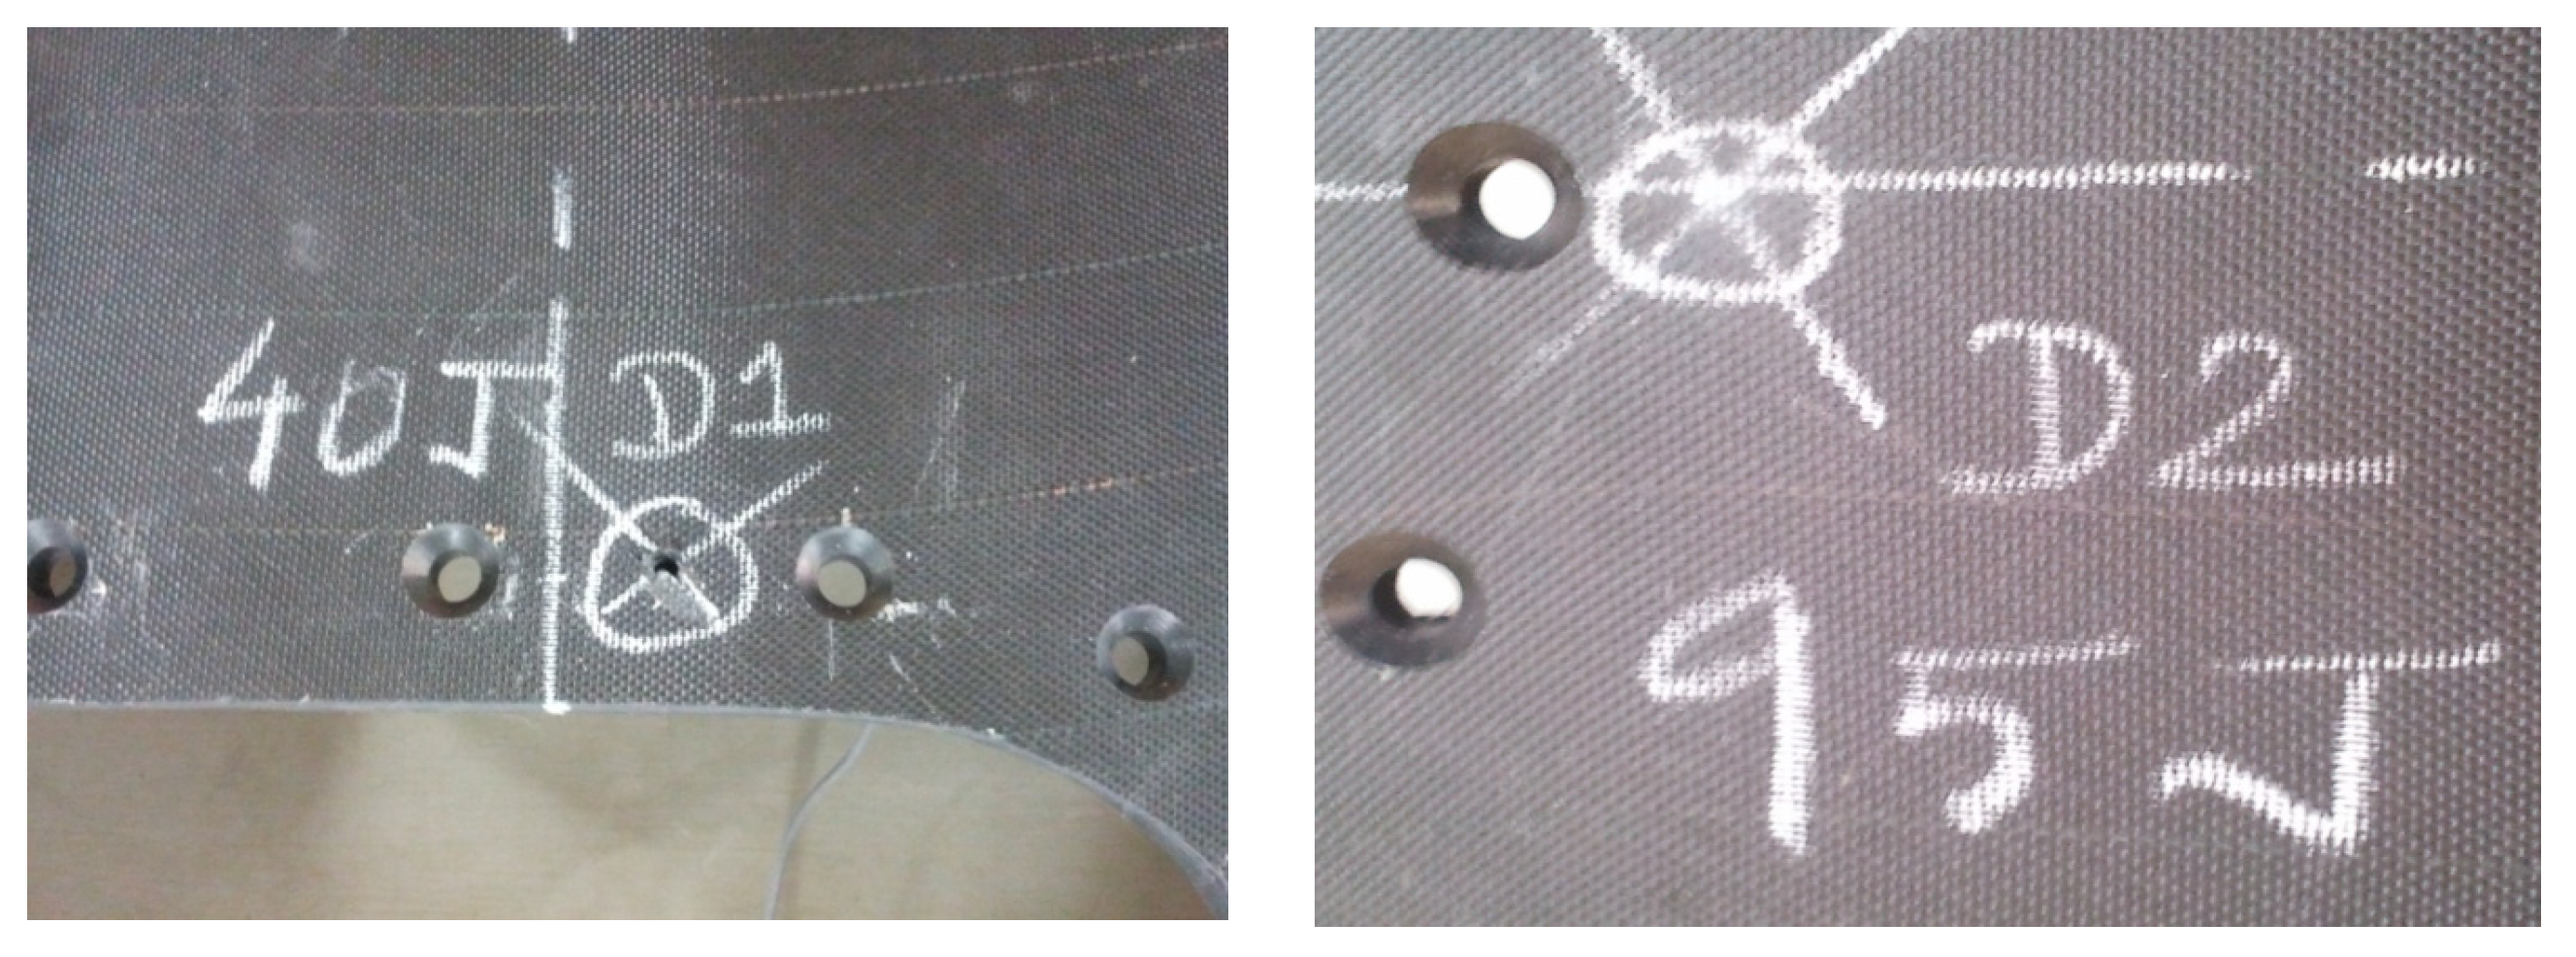
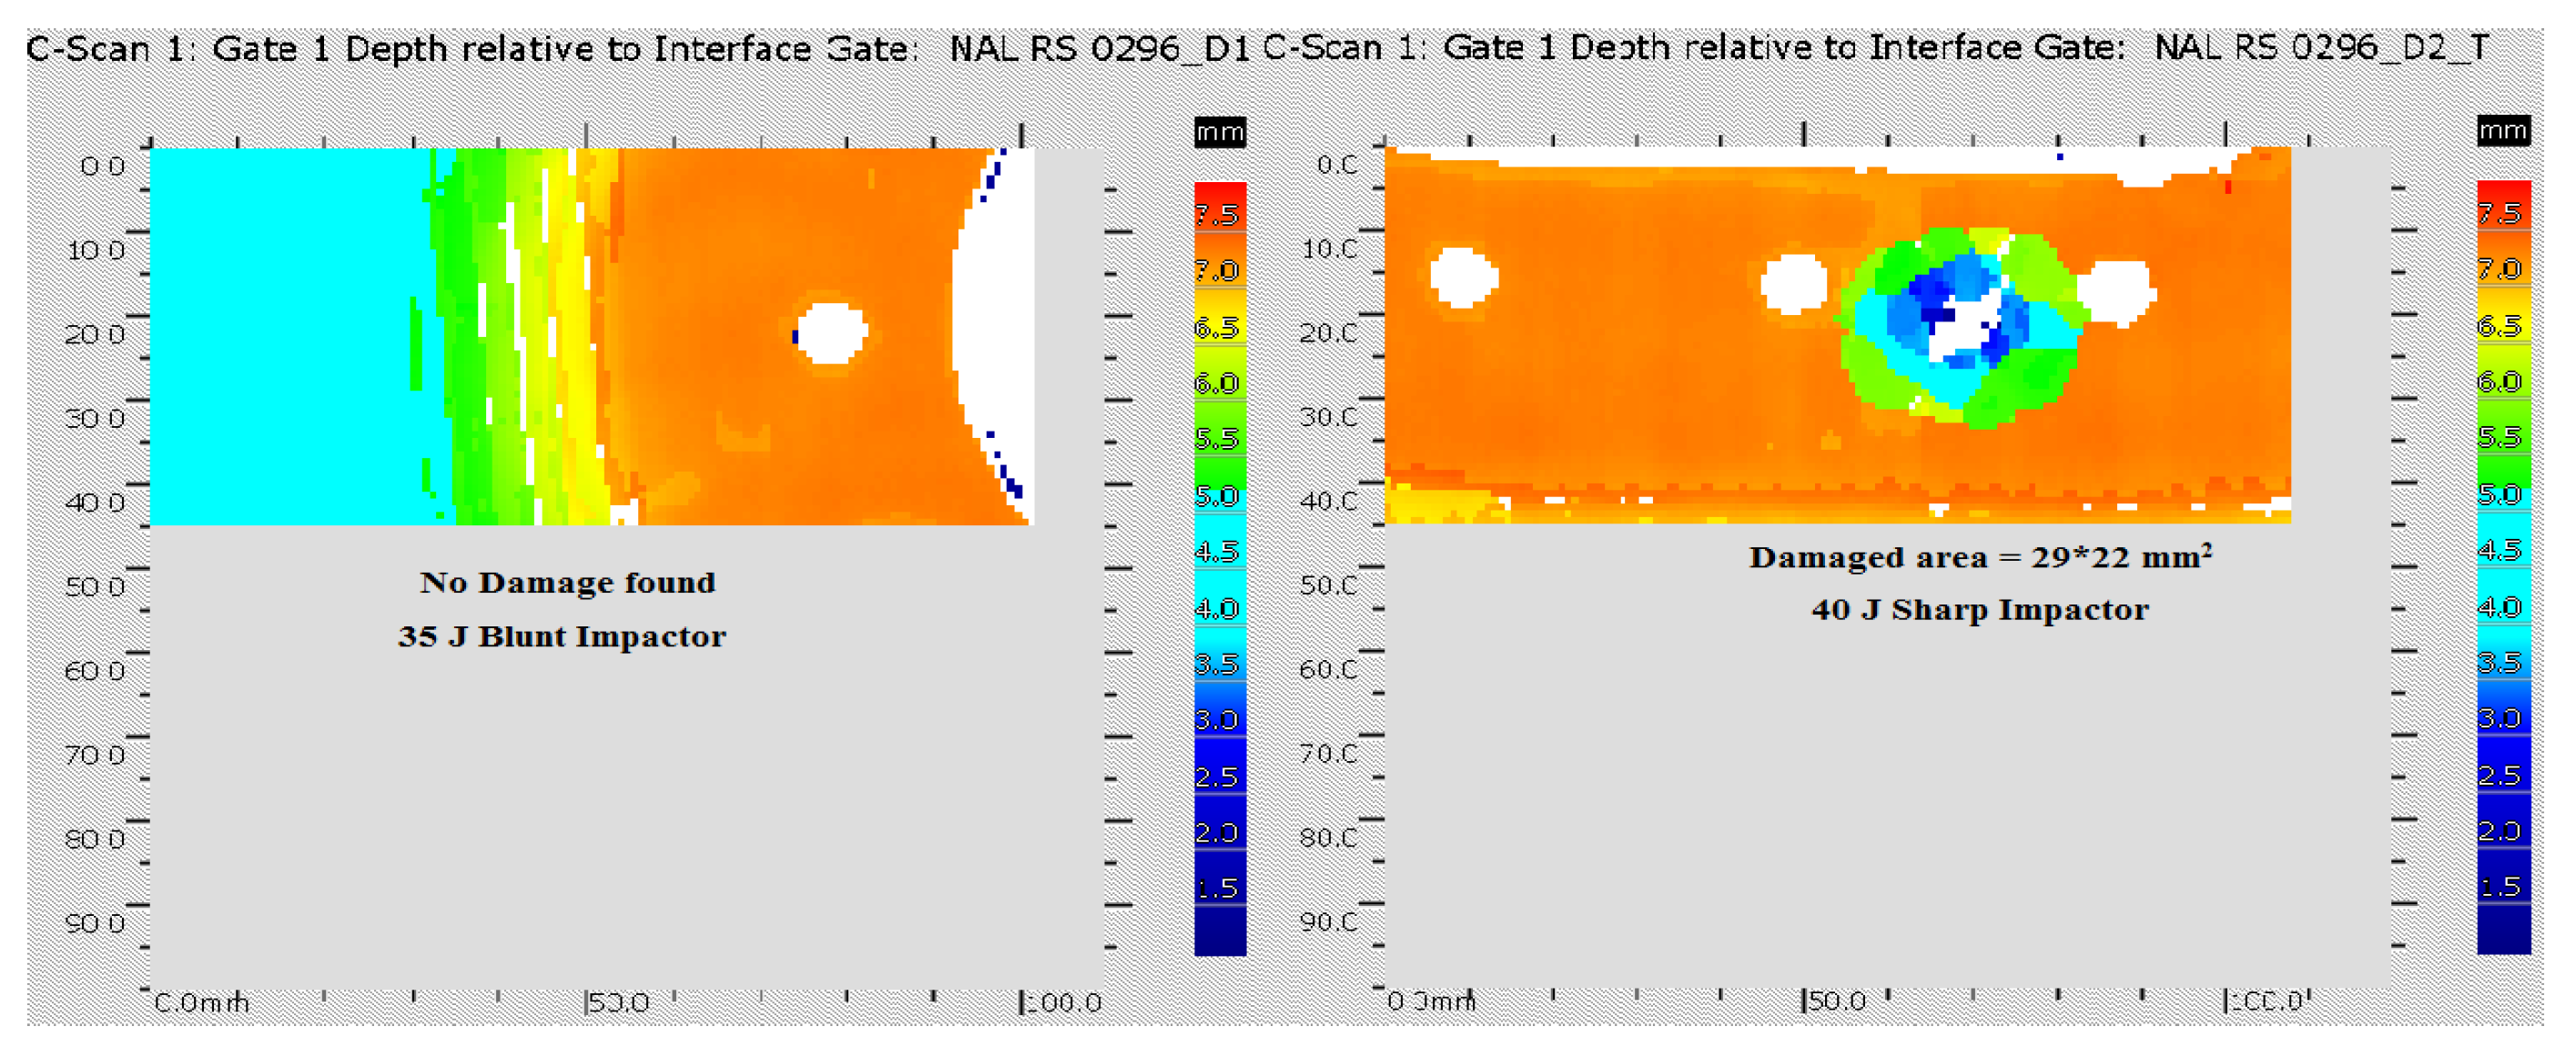
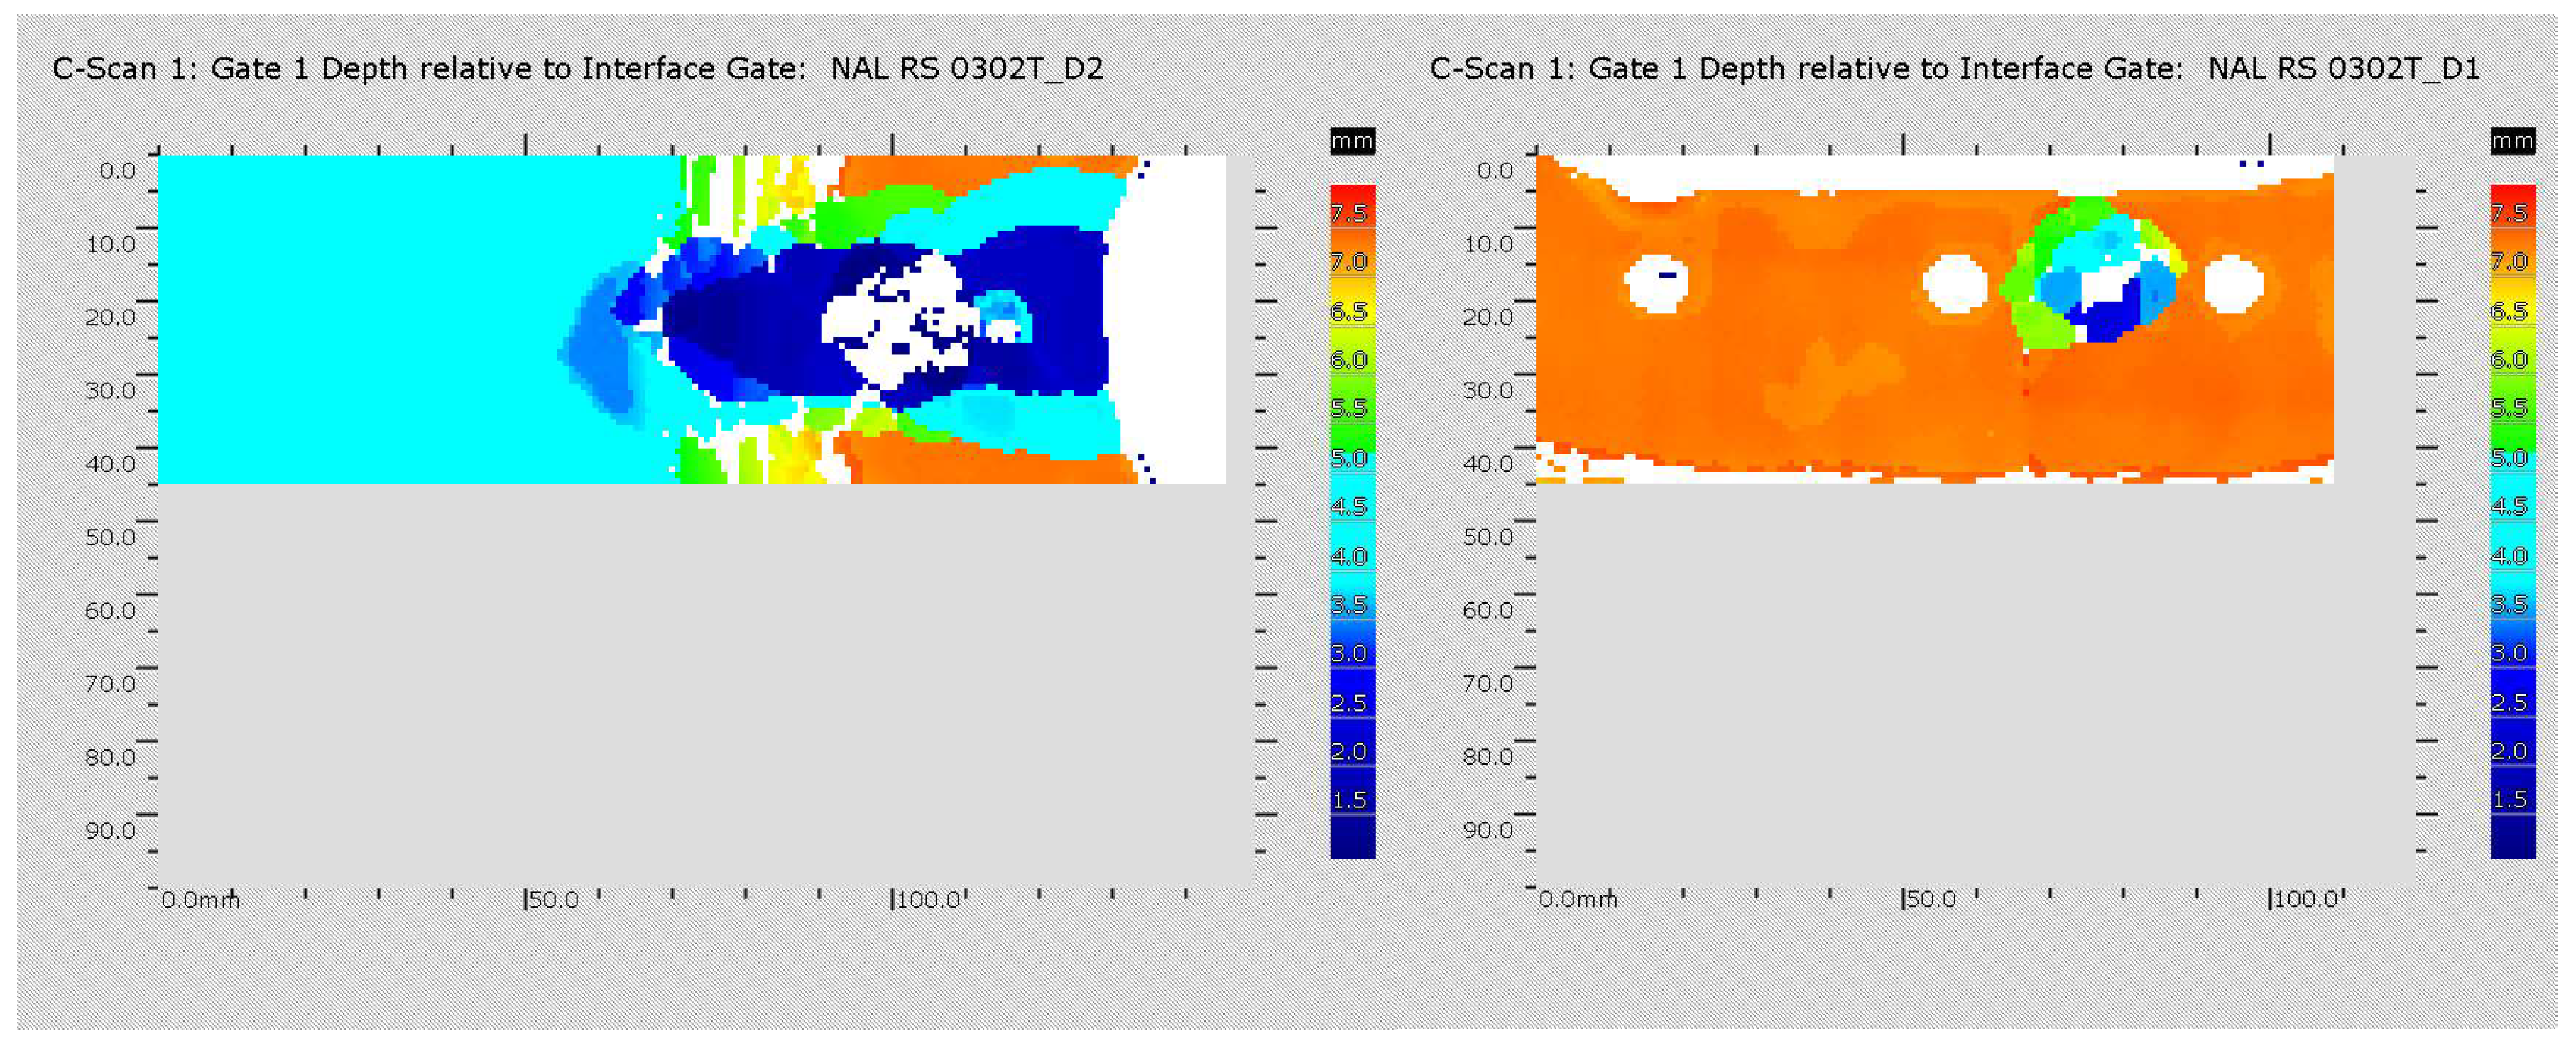
2.3. Impact Test
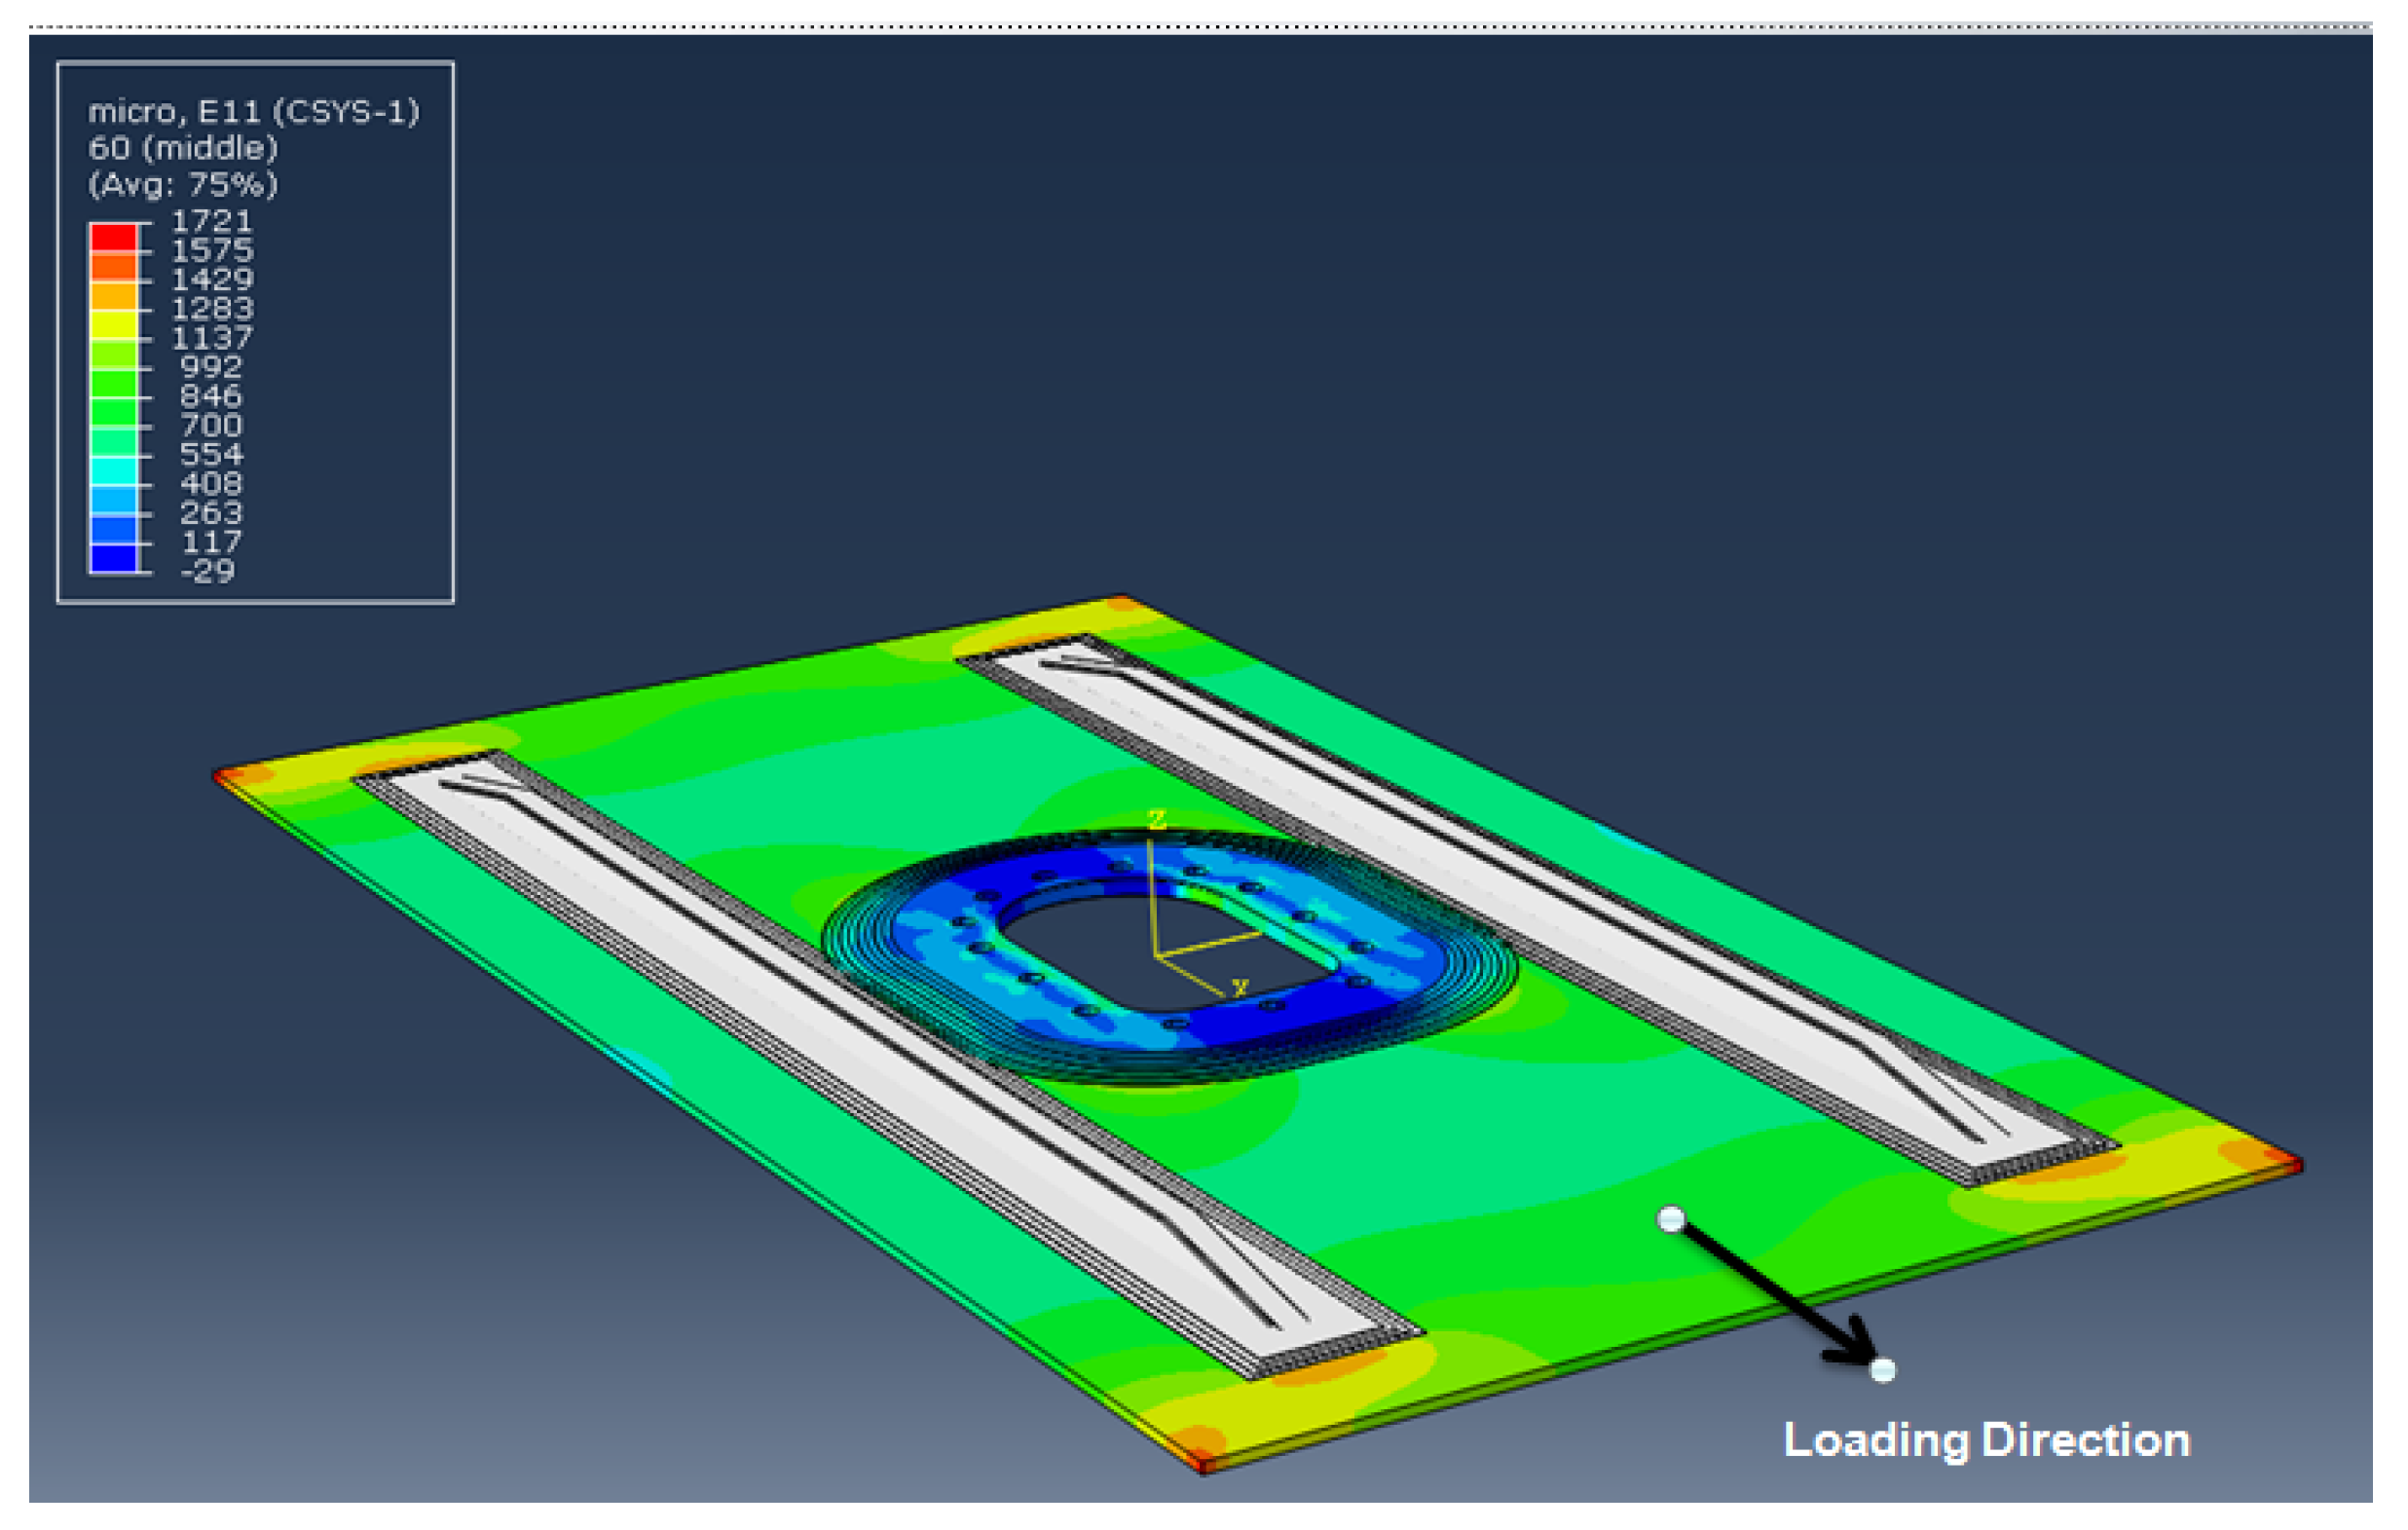
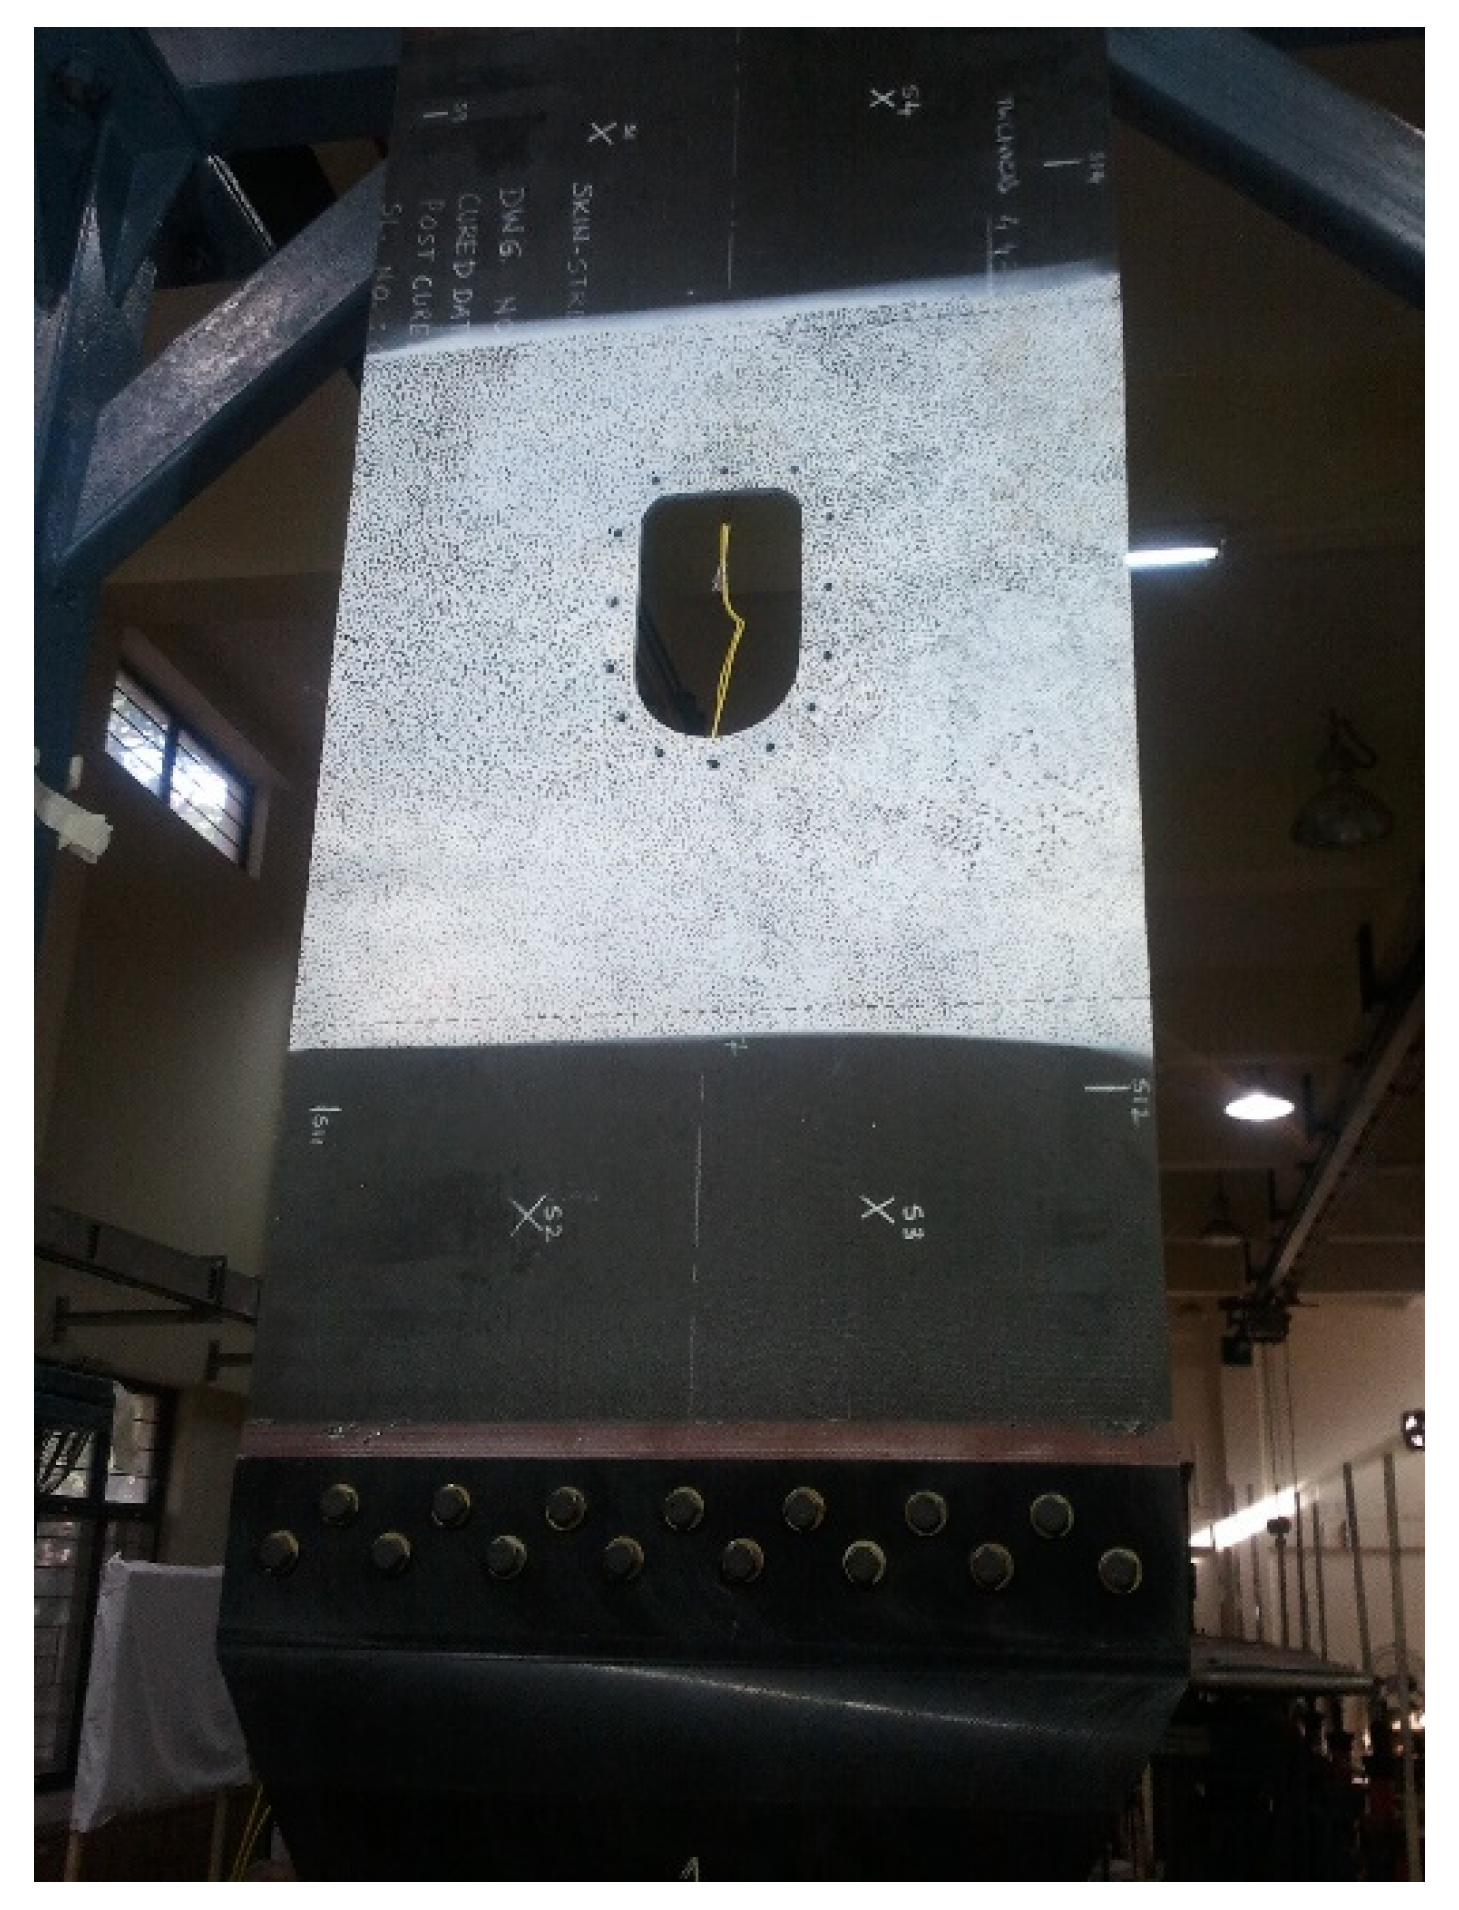
2.4. Panel Testing under Quasi-Static Load
2.5. Derivation of Fatigue Spectrum Loads
- Type A: severe flight condition, high gust loads. Load level 1 occurs once in every block;
- Type B: the nest most severe flight condition. Level 2 occurs once in every block;
- Type C: load level 3 occurs only once;
- Type D: load level 4 occurs only once;
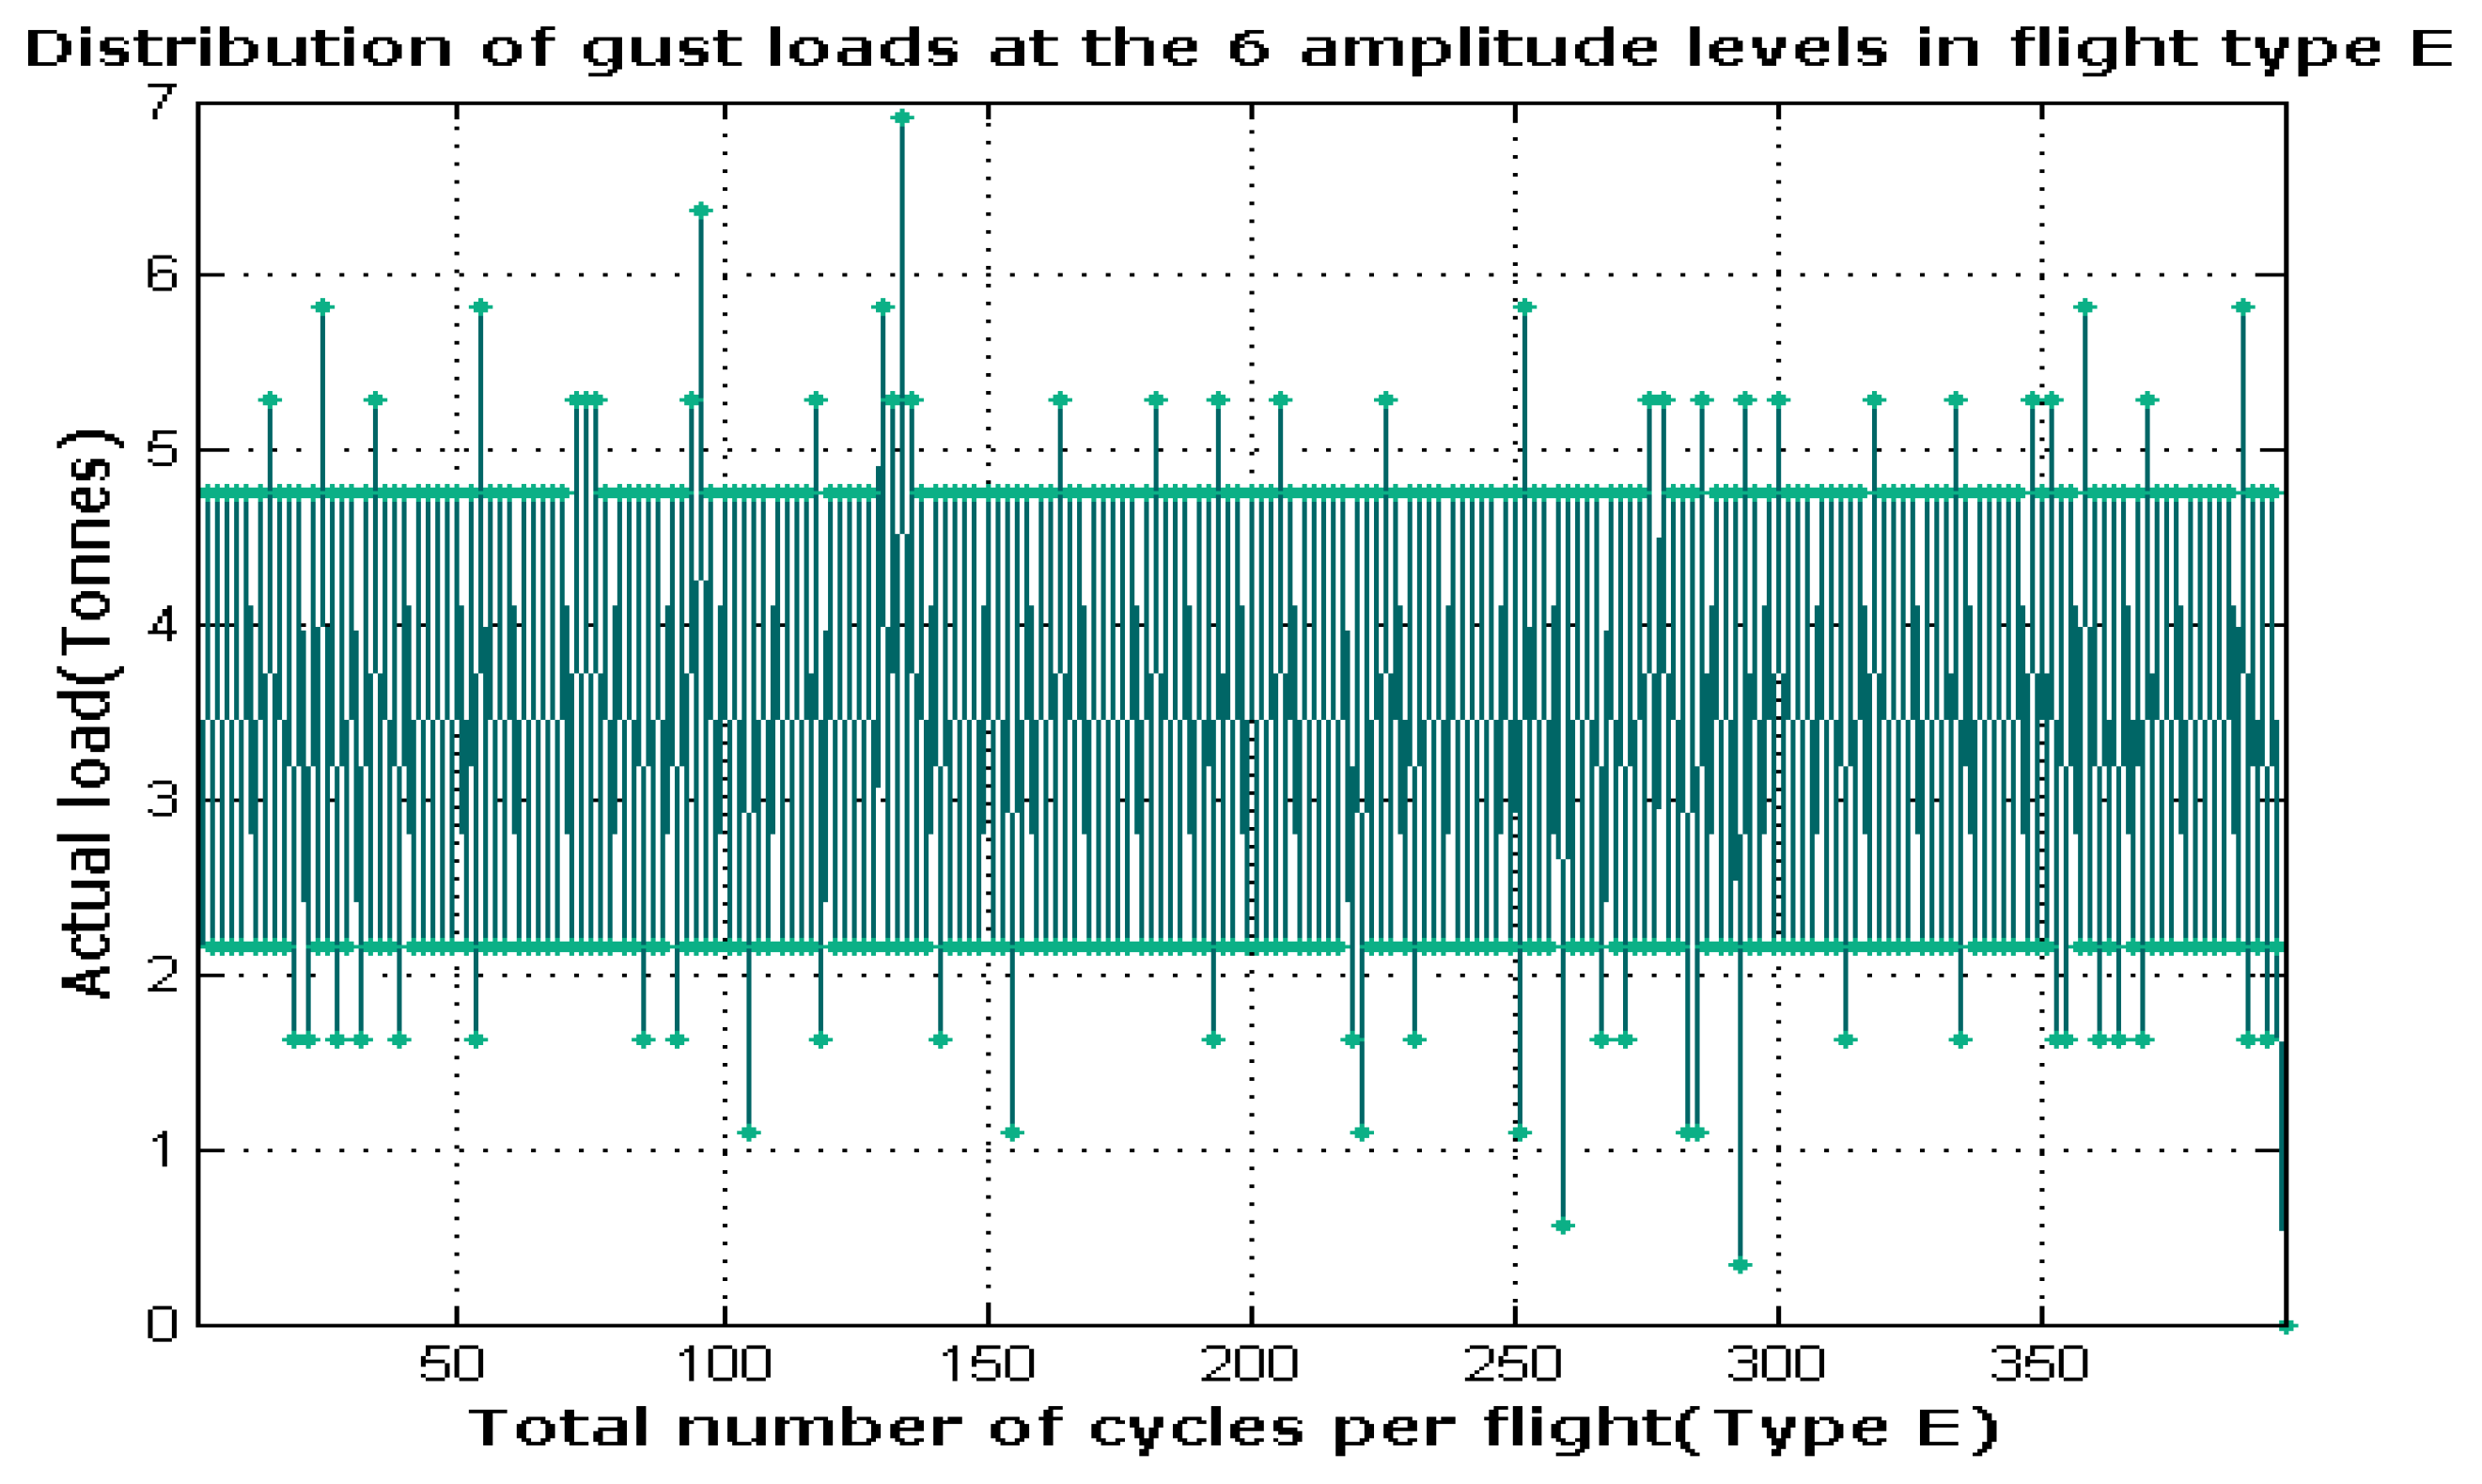
- Type E: load level 5 occurs only once;
- Type F: load level 6 occurs only once;
- Type G: load level 7 occurs only once;
- Type H: load level 8 occurs only once;
- Type I: load level 9 occurs only once;
- Type J: only gust loads with the smallest amplitude.
3. Results and Discussion
4. Conclusions
Author Contributions
Funding
Informed Consent Statement
Data Availability Statement
Acknowledgments
Conflicts of Interest
References
- Bouvet, C.; Rivallant, S. Damage tolerance of composite structures under low-velocity impact. In Dynamic Deformation, Damage and Fracture in Composite Materials and Structures; Elsevier: Amsterdam, The Netherlands, 2016; pp. 7–33. [Google Scholar] [CrossRef]
- Talreja, R.; Phan, N. Assessment of damage tolerance approaches for composite aircraft with focus on barely visible impact damage. Compos. Struct. 2019, 219, 1–7. [Google Scholar] [CrossRef]
- Fernandes, P.; Pinto, R.; Correia, N. Design and optimization of self-deployable damage tolerant composite structures: A review. Compos. Part B Eng. 2021, 221, 109029. [Google Scholar] [CrossRef]
- Dubary, N.; Bouvet, C.; Rivallant, S.; Ratsifandrihana, L. Damage tolerance of an impacted composite laminate. Compos. Struct. 2018, 206, 261–271. [Google Scholar] [CrossRef] [Green Version]
- Shah, S.Z.H.; Karuppanan, S.; Megat-Yusoff, P.S.M.; Sajid, Z. Impact resistance and damage tolerance of fiber reinforced composites: A review. Compos. Struct. 2019, 217, 100–121. [Google Scholar] [CrossRef]
- Persico, L.; Giacalone, G.; Cristalli, B.; Tufano, C.; Saccorotti, E.; Casalone, P.; Mattiazzo, G. Recycling Process of a Basalt Fiber-Epoxy Laminate by Solvolysis: Mechanical and Optical Tests. Fibers 2022, 10, 55. [Google Scholar] [CrossRef]
- Manos, G.; Katakalos, K.; Soulis, V.; Melidis, L.; Bardakis, V. Experimental Investigation of the Structural Performance of Existing and RC or CFRP Jacket-Strengthened Prestressed Cylindrical Concrete Pipes (PCCP)—Part A. Fibers 2022, 10, 71. [Google Scholar] [CrossRef]
- Bayandor, J.; Thomson, R.S.; Scott, M.L.; Nguyen, M.Q.; Elder, D.J. Investigation of impact and damage tolerance in advanced aerospace composite structures. Int. J. Crashworthiness 2003, 8, 297–306. [Google Scholar] [CrossRef]
- Sebaey, T.A.; González, E.V.; Lopes, C.S.; Blanco, N.; Maimí, P.; Costa, J. Damage resistance and damage tolerance of dispersed CFRP laminates: Effect of the mismatch angle between plies. Compos. Struct. 2013, 101, 255–264. [Google Scholar] [CrossRef]
- Dávila, C.G.; Bisagni, C. Fatigue life and damage tolerance of postbuckled composite stiffened structures with initial delamination. Compos. Struct. 2017, 161, 73–84. [Google Scholar] [CrossRef]
- Goh, J.Y.; Georgiadis, S.; Orifici, A.C.; Wang, C.H. Effects of bondline flaws on the damage tolerance of composite scarf joints. Compos. Part A Appl. Sci. Manuf. 2013, 55, 110–119. [Google Scholar] [CrossRef] [Green Version]
- Sebaey, T.A.; González, E.V.; Lopes, C.S.; Blanco, N.; Costa, J. Damage resistance and damage tolerance of dispersed CFRP laminates: Effect of ply clustering. Compos. Struct. 2013, 106, 96–103. [Google Scholar] [CrossRef]
- Bogenfeld, R.; Freund, S.; Schuster, A. An analytical damage tolerance method accounting for delamination in compression-loaded composites. Eng. Fail Anal. 2020, 118, 104875. [Google Scholar] [CrossRef]
- Nash, N.H.; Young, T.M.; Stanley, W.F. An investigation of the damage tolerance of carbon/Benzoxazine composites with a thermoplastic toughening interlayer. Compos. Struct. 2016, 147, 25–32. [Google Scholar] [CrossRef]
- Dubinskii, S.; Feygenbaum, Y.; Senik, V.; Metelkin, E. A study of accidental impact scenarios for composite wing damage tolerance evaluation. Aeronaut. J. 2019, 123, 1724–1739. [Google Scholar] [CrossRef] [Green Version]
- Park, H. Investigation on repairable damage tolerance for structural design of aircraft composite structure. J. Compos. Mater. 2016, 002199831664357. [Google Scholar] [CrossRef]
- Tan, Y.; Wu, G.; Suh, S.S.; Yang, J.M.; Hahn, H.T. Damage tolerance and durability of selectively stitched stiffened composite structures. Int. J. Fatigue 2008, 30, 483–492. [Google Scholar] [CrossRef]
- Krzyzak, A.; Kosicka, E.; Borowiec, M.; Szczepaniak, R. Selected Tribological Properties and Vibrations in the Base Resonance Zone of the Polymer Composite Used in the Aviation Industry. Materials 2020, 13, 1364. [Google Scholar] [CrossRef] [Green Version]
- Richardson, M.O.W.; Wisheart, M.J. Review of low-velocity impact properties of composite materials. Compos. Part A Appl. Sci. Manuf. 1996, 27, 1123–1131. [Google Scholar] [CrossRef]
- Feng, D.; Aymerich, F. Finite element modelling of damage induced by low-velocity impact on composite laminates. Compos. Struct. 2014, 108, 161–171. [Google Scholar] [CrossRef]
- Maio, L.; Monaco, E.; Ricci, F.; Lecce, L. Simulation of low velocity impact on composite laminates with progressive failure analysis. Compos. Struct. 2013, 103, 75–85. [Google Scholar] [CrossRef]
- Johnson, A.F.; Holzapfel, M. Modelling soft body impact on composite structures. Compos. Struct. 2003, 61, 103–113. [Google Scholar] [CrossRef]
- May, M.; Arnold-Keifer, S.; Haase, T. Damage resistance of composite structures with unsymmetrical stacking sequence subjected to high velocity bird impact. Compos. Part C Open Access 2020, 1, 100002. [Google Scholar] [CrossRef]
- Liu, L.; Luo, G.; Chen, W.; Zhao, Z.; Huang, X. Dynamic Behavior and Damage Mechanism of 3D Braided Composite Fan Blade under Bird Impact. Int. J. Aerosp. Eng. 2018, 2018, 5906078. [Google Scholar] [CrossRef]
- Johnson, A.; Pickett, A.; Rozycki, P. Computational methods for predicting impact damage in composite structures. Compos. Sci. Technol. 2001, 61, 2183–2192. [Google Scholar] [CrossRef] [Green Version]
- Polimeno, U.; Meo, M. Detecting barely visible impact damage detection on aircraft composites structures. Compos. Struct. 2009, 91, 398–402. [Google Scholar] [CrossRef]
- Buonsanti, M.; Ceravolo, F.; Leonardi, G. Runway Debris Impact on Aircraft Composite Parts. Key Eng. Mater. 2017, 754, 283–286. [Google Scholar] [CrossRef]
- Palazotto, A.N.; Herup, E.J.; Gummadi, L.N.B. Finite element analysis of low-velocity impact on composite sandwich plates. Compos. Struct. 2000, 49, 209–227. [Google Scholar] [CrossRef]
- Wagih, A.; Maimí, P.; Blanco, N.; Costa, J. A quasi-static indentation test to elucidate the sequence of damage events in low velocity impacts on composite laminates. Compos. Part A Appl. Sci. Manuf. 2016, 82, 180–189. [Google Scholar] [CrossRef]
- Flores, M.; Mollenhauer, D.; Runatunga, V.; Beberniss, T.; Rapking, D.; Pankow, M. High-speed 3D digital image correlation of low-velocity impacts on composite plates. Compos. Part B Eng. 2017, 131, 153–164. [Google Scholar] [CrossRef]
- Pokkalla, D.K.; Poh, L.H.; Quek, S.T. Isogeometric shape optimization of missing rib auxetics with prescribed negative Poisson’s ratio over large strains using genetic algorithm. Int. J. Mech. Sci. 2021, 193, 106169. [Google Scholar] [CrossRef]
- Healey, R.; Wang, J.; Chiu, W.K.; Chowdhury, N.M.; Baker, A.; Wallbrink, C. A review on aircraft spectra simplification techniques for composite structures. Compos. Part C Open Access 2021, 5, 100131. [Google Scholar] [CrossRef]
- Nyman, T.; Ansell, H.; Blom, A. Effects of truncation and elimination on composite fatigue life. Compos. Struct. 2000, 48, 275–286. [Google Scholar] [CrossRef]
- Wan, A.-S.; Xu, Y.-G.; Xue, L.-H.; Xu, M.-R.; Xiong, J.-J. Finite element modeling and fatigue life prediction of helicopter composite tail structure under multipoint coordinated loading spectrum. Compos. Struct. 2021, 255, 112900. [Google Scholar] [CrossRef]
- Pokkalla, D.K.; Biswas, R.; Poh, L.H.; Wahab, M.A. Fretting fatigue stress analysis in heterogeneous material using direct numerical simulations in solid mechanics. Tribol. Int. 2017, 109, 124–132. [Google Scholar] [CrossRef]


| Flight Type | No. of Flights in One Block | Number of Gust Loads at Ten Amplitude Levels | Total Number of Cycles per Flight | |||||||||
|---|---|---|---|---|---|---|---|---|---|---|---|---|
| 1 | 2 | 3 | 4 | 5 | 6 | 7 | 8 | 9 | 10 | |||
| A | 1 | 1 | 1 | 1 | 4 | 8 | 18 | 64 | 112 | 391 | 900 | 1500 |
| B | 1 | 1 | 1 | 2 | 5 | 11 | 39 | 76 | 366 | 899 | 1400 | |
| C | 3 | 1 | 1 | 2 | 7 | 22 | 61 | 277 | 879 | 1250 | ||
| D | 9 | 1 | 1 | 2 | 14 | 44 | 208 | 680 | 950 | |||
| E | 24 | 1 | 1 | 6 | 24 | 165 | 603 | 800 | ||||
| F | 60 | 1 | 3 | 19 | 115 | 512 | 650 | |||||
| G | 181 | 1 | 7 | 70 | 412 | 490 | ||||||
| H | 420 | 1 | 16 | 233 | 250 | |||||||
| I | 1090 | 1 | 69 | 70 | ||||||||
| J | 2211 | 25 | 25 | |||||||||
| Total number of cycles per block | 1 | 2 | 5 | 18 | 52 | 152 | 800 | 4170 | 34,800 | 358,665 | ||
| Cumulative number of cycles per block | 1 | 3 | 8 | 26 | 78 | 230 | 1030 | 5200 | 40,000 | 398,665 | ||
| Sl. No. | Strain Gauge Number | Element Id in FE Analysis | Far-Field Strain Data in Micro Strains | |
|---|---|---|---|---|
| FE Analysis | Reading from Strain Gauge at 9000 kgf | |||
| 1 | S17 | 1504 | 684 | 656 |
| 2 | S18 | 3120 | 679 | 757 |
| 3 | S8 | 11674 | 593 | 646 |
| 4 | S6 | 4537 | 597 | 699 |
| 5 | S16 | 2405 | 598 | 714 |
| 6 | S15 | 2037 | 613 | 738 |
| 7 | S20 | 6700 | 681 | 666 |
Publisher’s Note: MDPI stays neutral with regard to jurisdictional claims in published maps and institutional affiliations. |
© 2022 by the authors. Licensee MDPI, Basel, Switzerland. This article is an open access article distributed under the terms and conditions of the Creative Commons Attribution (CC BY) license (https://creativecommons.org/licenses/by/4.0/).
Share and Cite
Hiremath, P.; Viswamurthy, S.R.; Shettar, M.; Naik, N.; Kowshik, S. Damage Tolerance of a Stiffened Composite Panel with an Access Cutout under Fatigue Loading and Validation Using FEM Analysis and Digital Image Correlation. Fibers 2022, 10, 105. https://doi.org/10.3390/fib10120105
Hiremath P, Viswamurthy SR, Shettar M, Naik N, Kowshik S. Damage Tolerance of a Stiffened Composite Panel with an Access Cutout under Fatigue Loading and Validation Using FEM Analysis and Digital Image Correlation. Fibers. 2022; 10(12):105. https://doi.org/10.3390/fib10120105
Chicago/Turabian StyleHiremath, Pavan, Sathyamangalam Ramanarayanan Viswamurthy, Manjunath Shettar, Nithesh Naik, and Suhas Kowshik. 2022. "Damage Tolerance of a Stiffened Composite Panel with an Access Cutout under Fatigue Loading and Validation Using FEM Analysis and Digital Image Correlation" Fibers 10, no. 12: 105. https://doi.org/10.3390/fib10120105