Article

Improving Transverse Compressive Modulus of Carbon Fibers during Wet Spinning of Polyacrylonitrile

1
CSIRO Manufacturing, Clayton, VIC 3168, Australia
2
CSIRO Manufacturing, Waurn Ponds, VIC 3216, Australia
*
Author to whom correspondence should be addressed.
Fibers 2022, 10(6), 54; https://doi.org/10.3390/fib10060054
Submission received: 22 April 2022 / Revised: 7 June 2022 / Accepted: 10 June 2022 / Published: 14 June 2022

Abstract

:
The performance of carbon fibers depends on the properties of the precursor polyacrylonitrile (PAN) fibers. Stretching of PAN fibers results in improved tensile properties, while potentially reducing its compressive properties. To determine optimization trade-offs, the effect of coagulation conditions and the stretching process on the compressive modulus in the transverse direction (ET) was investigated. A method for accurately determining ET from polymer fibers with non-circular cross-sectional shapes is presented. X-ray diffraction was used to measure the crystallite size, crystallinity, and crystallite orientation of the fibers. ET was found to increase with decreasing crystallite orientation along the drawing direction, which decreases the tensile modulus in the longitudinal direction (EL) proportionally to crystallite orientation. Stretching resulted in greater crystallite orientation along the drawing direction for fibers formed under the same coagulation conditions. Increasing the solvent concentration in the coagulation bath resulted in a higher average orientation, but reduced the impact of stretching on the orientation. The relationship between ET and EL observed in the precursor PAN fiber is retained after carbonization, with a 20% increase in ET achieved for a 2% decrease in EL. This indicates that controlled stretching of PAN fiber allows for highly efficient trading off of EL for ET in carbon fiber.

Graphical Abstract

1. Introduction

Carbon fiber (CF) is an important modern construction material due to its light weight and high tensile properties. This has made CF-reinforced composites an ideal construction material for the aerospace and wind energy industries [1,2,3]. The properties of the composite are highly dependent on the properties of the individual [4,5]. Thus, there is considerable interest in measuring and modifying the mechanical properties of individual CFs. The most widely used method for producing CFs is by carbonization of a polyacrylonitrile (PAN) fiber precursor, commonly called a white fiber (WF). The WF spinning process is a crucial step in the production of CF, as the structural properties of the final CF will be determined by the structure of the WF [6,7,8,9]. Thus, the processing parameters of the WF have been the focus of much study [10,11,12].
A high-quality WF with strong tensile properties requires a strong orientation along the fiber axis, high crystallinity, minimal voids, and a circular cross-section [13,14]. Drawing the fiber during the coagulation process (i.e., jet stretch) and after coagulation (i.e., post-draw stretch) are important processing conditions for tailoring these properties. The total increase in length between the extruded fiber and the final WF is known as the total draw ratio (TDR). Increasing the TDR during the spinning process increases the orientation along the fiber axis [15], increases the crystallinity [16] and the homogeneity [17], and promotes the formation of a rounded cross-section [18]. Surface roughness also increases with drawing [19,20], which must be accounted for when considering its properties in the transverse direction. A well-drawn fiber results in superior tensile properties, such as increased tensile strength and tensile modulus [13,15,18,21,22].
However, there has been minimal reported consideration on the impact of TDR on the CF compressive properties, despite the fact that most carbon fiber reinforced materials are limited not by their tensile properties but by their compression properties in practical applications [4,23,24]. A potential reason for the relative paucity of compression studies compared to tension studies of CFs and their precursor WFs is the added complexity of measuring the compressive properties of a single fiber.
Different methods have been reported in the literature to address this. Firstly, traditional nanoindentation experiments have been supported with mathematical models, atomic force microscopy, and finite element analysis to ensure the unconstrained circular cross-section of the fiber does not impact the result [25,26]. Another method probes CFs embedded in a composite using nanoindentation to measure the reduced modulus in the transverse and longitudinal directions from which the five unique stiffness coefficients of a transversely isotropic fiber can then be calculated [27,28,29,30]. In the method used here, the free-standing fiber is compressed and a Hertzian contact mechanics model is used to account for the circular cross-sectional shape of the fiber. This technique has been applied both to CF [31,32,33] and to polymer fibers [34,35].
While some modifications due to increasing TDR are expected to also improve compressive properties (e.g., reduction of voids, high crystallinity), orientation of the graphitic crystallites along the fiber axis are expected to negatively impact the compressive properties. Most prominently, the orientation of graphitic sheets such that their planes are layered perpendicular to the compression direction will reduce the compressive modulus.
Here, WFs processed under different spinning conditions and TDRs were compressed along the transverse direction to measure transverse compressive modulus (ET), which was compared to its longitudinal tensile modulus (EL) and the orientation of the crystallites. Furthermore, several WFs were carbonized, and the moduli of the CF were also compared. While increasing ET resulted in a decreased EL, a significant increase in ET was observed for minimal decrease in EL. This promising result suggests that ET can be tailored to the required application by varying the TDR during WF spinning, maximizing the compressive properties without meaningfully impacting the highly desirable tensile properties of CF.

2. Materials and Methods

2.1. Spinning

Two sets of WFs were spun using a wet-spinning technique on a 500-filament pilot-scale spinning line. The polymer solution consisted of commercially available polymer purchased from Japan Exlan Co., Ltd. (Osaka, Japan), which contains acrylonitrile, methyl acrylate, and itaconic acid in a 96:3:1 ratio, in a DMSO solvent with a polymer concentration of 20 wt % and a viscosity average molecular weight of 176 kg mol−1. Using a discovery HR3 hybrid rheometer with parallel plates 40 mm apart, a flow sweep test at 70 °C and 1 s−1 shear rate was performed to measure the polymer solution shear viscosity as 103 Pa.s. All fibers were extruded at a velocity of 2.50 m/min from a spinneret with a hole diameter of 80 µm. For the first set, the polymer was extruded into a 30 °C DMSO/water coagulation bath with a 70/30 vol % ratio and a residence time of 30 s, followed by a 40 °C DMSO/water gradient bath with a 50/50 vol % ratio with a residence time of 14 s. For the second set, the polymer was extruded into a single higher temperature 60 °C DMSO/water coagulation bath with a 65/35 vol % ratio, with a residence time of 30 s.
Both coagulation conditions had a jet stretch ratio of 0.7×. Thermal post drawing was subsequently performed on the same line, which involved a washing bath stretch, a hot water stretch, and a steam stretch. For the WF extruded into a 30 °C coagulation bath (hereafter, “30C series”) a wash bath stretch of 1.25×, a hot water stretch of 2.50×, and a variable steam stretch for a total draw ratio of 7.2×, 8.0×, 9.2×, 10.0×, and 10.8× was applied. For the WF extruded into a 30 °C coagulation bath (hereafter, “60C series”) a wash bath stretch of 1.62×, a hot water stretch of 2.50×, and a variable steam stretch for a total draw ratio of 7.8×, 10.0×, and 12.6× was applied. These parameters were chosen as they were found to minimize pores and filament breakage. The processing parameters for each sample are listed in Table 1, with the assigned name based on their coagulation bath temperatures (i.e., 30 °C and 60 °C) and their TDR. For example, the 30C series WF that has a TDR of 9.2 is named 30C-9×.

2.2. Carbonization

Select WFs (60C-8×, 60C-10×, 60C-13×) were carbonized on the carbon fiber production line at Carbon Nexus, Deakin University (Australia). All three WFs were drawn through four oxidation zones with a tension of 100 cN across a single 500-filament tow, at temperatures of 230, 240, 250, and 260 °C for Zones 1 through 4, respectively. This was followed by drawing with a tension of 50 cN, through low temperature carbonization zones at temperatures of 450, 550, and 650 °C through Zones 1 to 3, respectively. Finally, the fiber was drawn with a tension of 100 cN through high temperature carbonization zones at a temperature of 1100 and 1400 °C for Zones 1 and 2, respectively. The line speed was 22 m/h, resulting in a dwell time within each zone of 16.4, 4.9, and 3.2 min in the oxidation zones, low temperature carbonization zones, and high temperature carbonization zones, respectively. Both low- and high-temperature carbonization zones were filled with nitrogen to create an inert atmosphere.

2.3. Compression

The compression was performed on the fiber compression instrument detailed in [36], using the analysis method included therein. In particular, the removal of the ‘initial section’ removes the impact of surface roughness that is introduced by increased drawing. ET was fitted to the Hertzian contact mechanics model developed by Morris et al. [37]
U = 4 F π 1 E T s i n h 1 R b
where F is the force per unit length, R is the radius of the fiber, and b is the contact segment width between the fiber and the tip. This model was chosen based on a comparative study of the available models by Hillbrick et al. [38].
All fibers (i.e., both WF and CF samples) were compressed at a rate of 1 µm/s using 0.1 µm steps up to the maximum load, held at maximum load for either 120 s (first compression of a fiber) or 5 s (subsequent compressions on the same fiber, at a different location), and then released at the same rate. The longer hold duration was used to analyze the non-elastic deformation (detailed in Figure 1 and the associated text) of the fiber, with the outcome of this analysis inferred for the subsequent 5 s hold duration compressions on the fiber. The presented ET values were fitted from the loading segments of both, 120 s and 5 s hold compressions, with no measurable difference between 120 s and 5 s observed. The WFs were compressed to a maximum load of ~50 mN over 10 s, while the CFs were compressed up to a maximum load of ~500 mN over 100 s. Several (5–10) compressions were performed at different positions along each individual fiber, and at least 4 individual fibers were tested for each sample type.
The compression displacement of the CFs remained constant during the hold duration; however, the compression displacement of the WFs increased during the hold duration due to polymer creep [39]. This creep was also present within the loading curve, and was dependent upon the loading rate and the amount of physical aging undergone by the polymer [40,41], which changes the fitted ET. Thus, the physical aging of the WF samples were standardized by heating them above their glass transition (Tg) followed by controlled cooling to reset the amount of aging experienced. Each sample was heated at 120 °C for 1 h, then cooled at a rate of no greater than 10 °C/h and compressed 20 days after cooling.

2.4. SEM

SEM images of the fiber cross-sections were obtained using a Hitachi TM4000 under an accelerating voltage of 5 kV. WFs were prepared for SEM imaging by securing a 500-filament tow using rubber tubing, freezing the sample in liquid nitrogen, and then cutting using a microtome to minimize the impact on the cross-sectional shape. The fibers were not coated. The SEM images were used to determine R for the WF samples.

2.5. Favimat

Tensile testing was performed using a Textechno H. Stein Favimat + Robot 2 single fiber tester equipped with single-fiber clamps to measure EL and breaking stress for all fibers. The testing was performed on fibers of gauge length 25 mm, with a pretension of 1 cN/tex and a testing speed of 10 mm/min. For the WF fibers, 25 fibers were tested; while 50 fibers were tested for the CF samples, and the average value was taken. Favimat testing was also used to determine the cross-sectional area for the CF samples, from which a value for R was calculated.

2.6. X-ray Diffraction (XRD)

XRD was performed using a Rigaku SmartLab diffractometer equipped with a Cu Kα source. To measure the crystallinity and crystal size, parallel beam scanning in transmission mode was performed across the range 2θ = 5°–60°. The profile was fitted using TOPAS-Academic, Version 6 (Coelho Software), with peaks fitted using a pseudo-Voigt function. The crystallinity was determined using
C r y s t a l l i n i t y = A C A A + A C
where AC is the summed area of the first and second order (001) crystalline peaks at ~17° and ~29° and AA is the area of the amorphous peak at ~26° [42,43]. The crystallite size was determined using Scherrer’s equation:
C r y s t a l l i t e   S i z e = K λ β c o s θ
where K is the Scherrer constant (0.89 in this case), λ is the wavelength (1.541 Å for Cu Kα), and β is the FWHM of the peak at ~17°. To measure orientation, a 2D image was taken and integrated azimuthally over the peak at ~17°. This integrated profile was fitted using a Lorentzian function, with the orientation defined as:
o r i e n t a t i o n = 180 ε 180
where ε is the FWHM of the integrated profile. Under this definition, a theoretical perfectly aligned sample would have an orientation of 1. Due to instrumental broadening, the practical maximum is most likely in the 0.95–1 region.

3. Results and Discussion

3.1. Subsection

A number of issues need to be considered when analyzing a transverse compression displacement curve on a (viscoelastic) polymeric fiber, such as physical ageing, creep, and plastic (permanent) deformation. Figure 1a presents two load–displacement curves from the same position on the same 30C-7× WF, one directly after the other. In both compressions, the sample was held under maximum load for 120 s, during which time the displacement increased (i.e., polymer creep). The decay of the creep rate is plotted in Figure 1b, showing the creep plateaus during the hold segment. The presence of creep impacts the determination of ET by fitting the elastic portion of the loading curve in two ways. Firstly, creep will be present throughout the loading curve, making it viscoelastic, hence the need to compare fibers with identical loading rates. This issue was addressed by keeping the strain rate the same between all WF compressions performed. Secondly, the presence of creep masks the presence of plasticity. That is, for an elastic material, the loading and unloading curves will overlap when the sample remains within its elastic regime. For a viscoelastic material, the loading and unloading curves never overlap; therefore, it is not readily apparent if the loading curve has entered the plastic regime and contains a section unsuitable for calculating ET.
To identify if permanent, plastic deformation has occurred, two loading and unloading experiments were performed sequentially in the same fiber position with a hold period at maximum load and the two unloading curves compared. The first loading curve (Figure 1a) shows the displacement with increasing load, with contributions due to creep. During the first hold duration at maximum load, the amount of creep plateaus. For the first unloading and second loading curves, much of the creep remains present, making these sections unsuitable for fitting. During the second hold duration, the sample returns quickly to the creep plateau. Finally, the second unloading overlaps with the first unloading curve as they share essentially identical starting positions. If the sample had responded plastically, or if the creep had not plateaued after the first hold duration, the two unloading curves would not overlap. Thus, we suggest that an overlapping pair of unloading curves is evidence that plasticity has not occurred and that the first loading curve can be fitted to provide an accurate ET value.
Figure 2a shows two loading curves from a single 30C-7× fiber at positions less than 2 mm apart, with the fitted curve and ET values indicated. The considerable difference between these two curves and their fitted ET was typical for 30C-7× WF, resulting in a mean ET = 1.96 (0.52) GPa (value in brackets are standard deviations) across 95 different compressions and a coefficient of variation (CoV) of 27%. A histogram plotting all measured ET values is shown in Figure 2b. The values appear to be from a bimodal distribution rather than a single distribution. The higher and lower distributions give a mean ET,higher = 2.29 (0.26) GPa and ET,lower = 1.37 (0.25) GPa resulting in a CoVhigher = 11% and CoVlower = 18%, respectively. This double distribution is observed even when comparing data taken from a single fiber, indicating it is not due to differences between individual fibers.
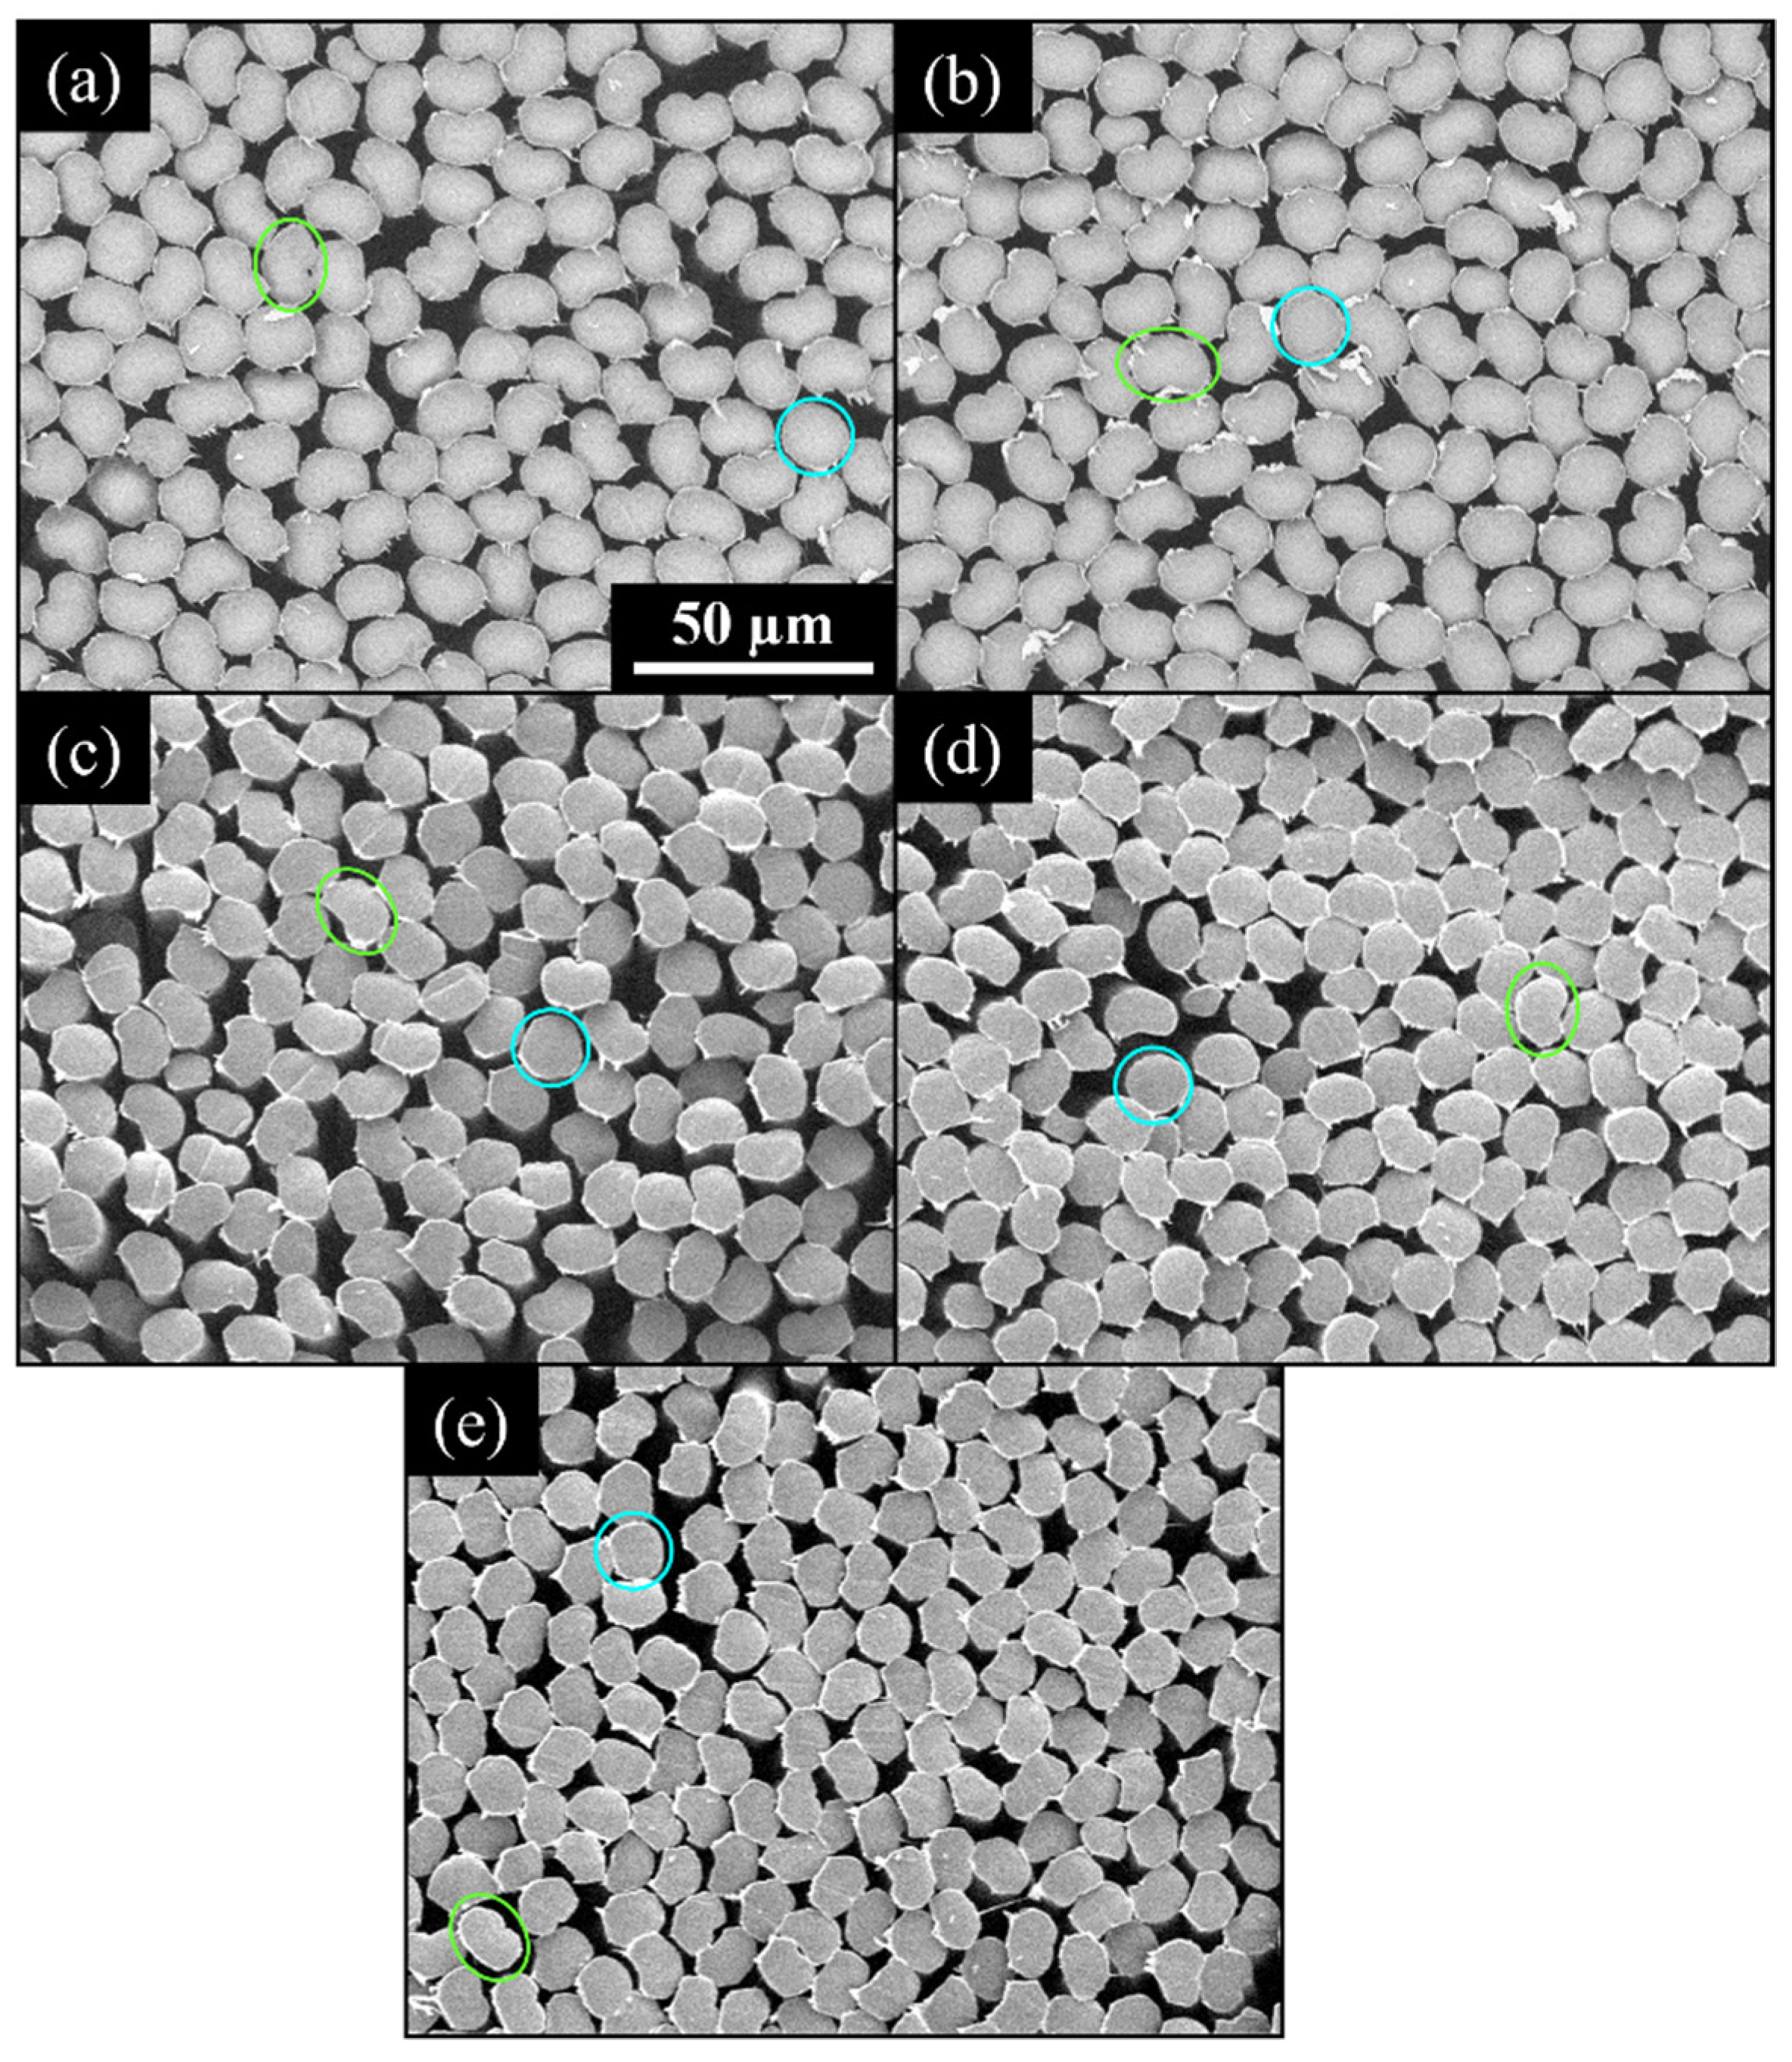
Figure 3a presents an SEM image of 30C-7× WF cross-sections, showing that some of the cross-sections are circular, while others are bean-shaped. As the analysis method used to fit ET depends on the cross-sections being (roughly) circular, we propose that the higher distribution is due to erroneously applying the method to bean-shaped cross-sections which are much closer to rectangular in shape. Indeed, refitting the curves that comprise the higher distribution using a standard E = stress/strain relationship results in ET = 1.36 (0.30) GPa, which is consistent with ET,lower = 1.32 (0.21) GPa. Figure 3b–e shows that circular and bean-shaped cross-sections were observed in all other WFs in the 30C series, and a similar double distribution was also observed in ET values fitted from the load–displacement curves. The remainder of this study discarded the ET,higher values and considered ET = ET,lower for these five WF types.
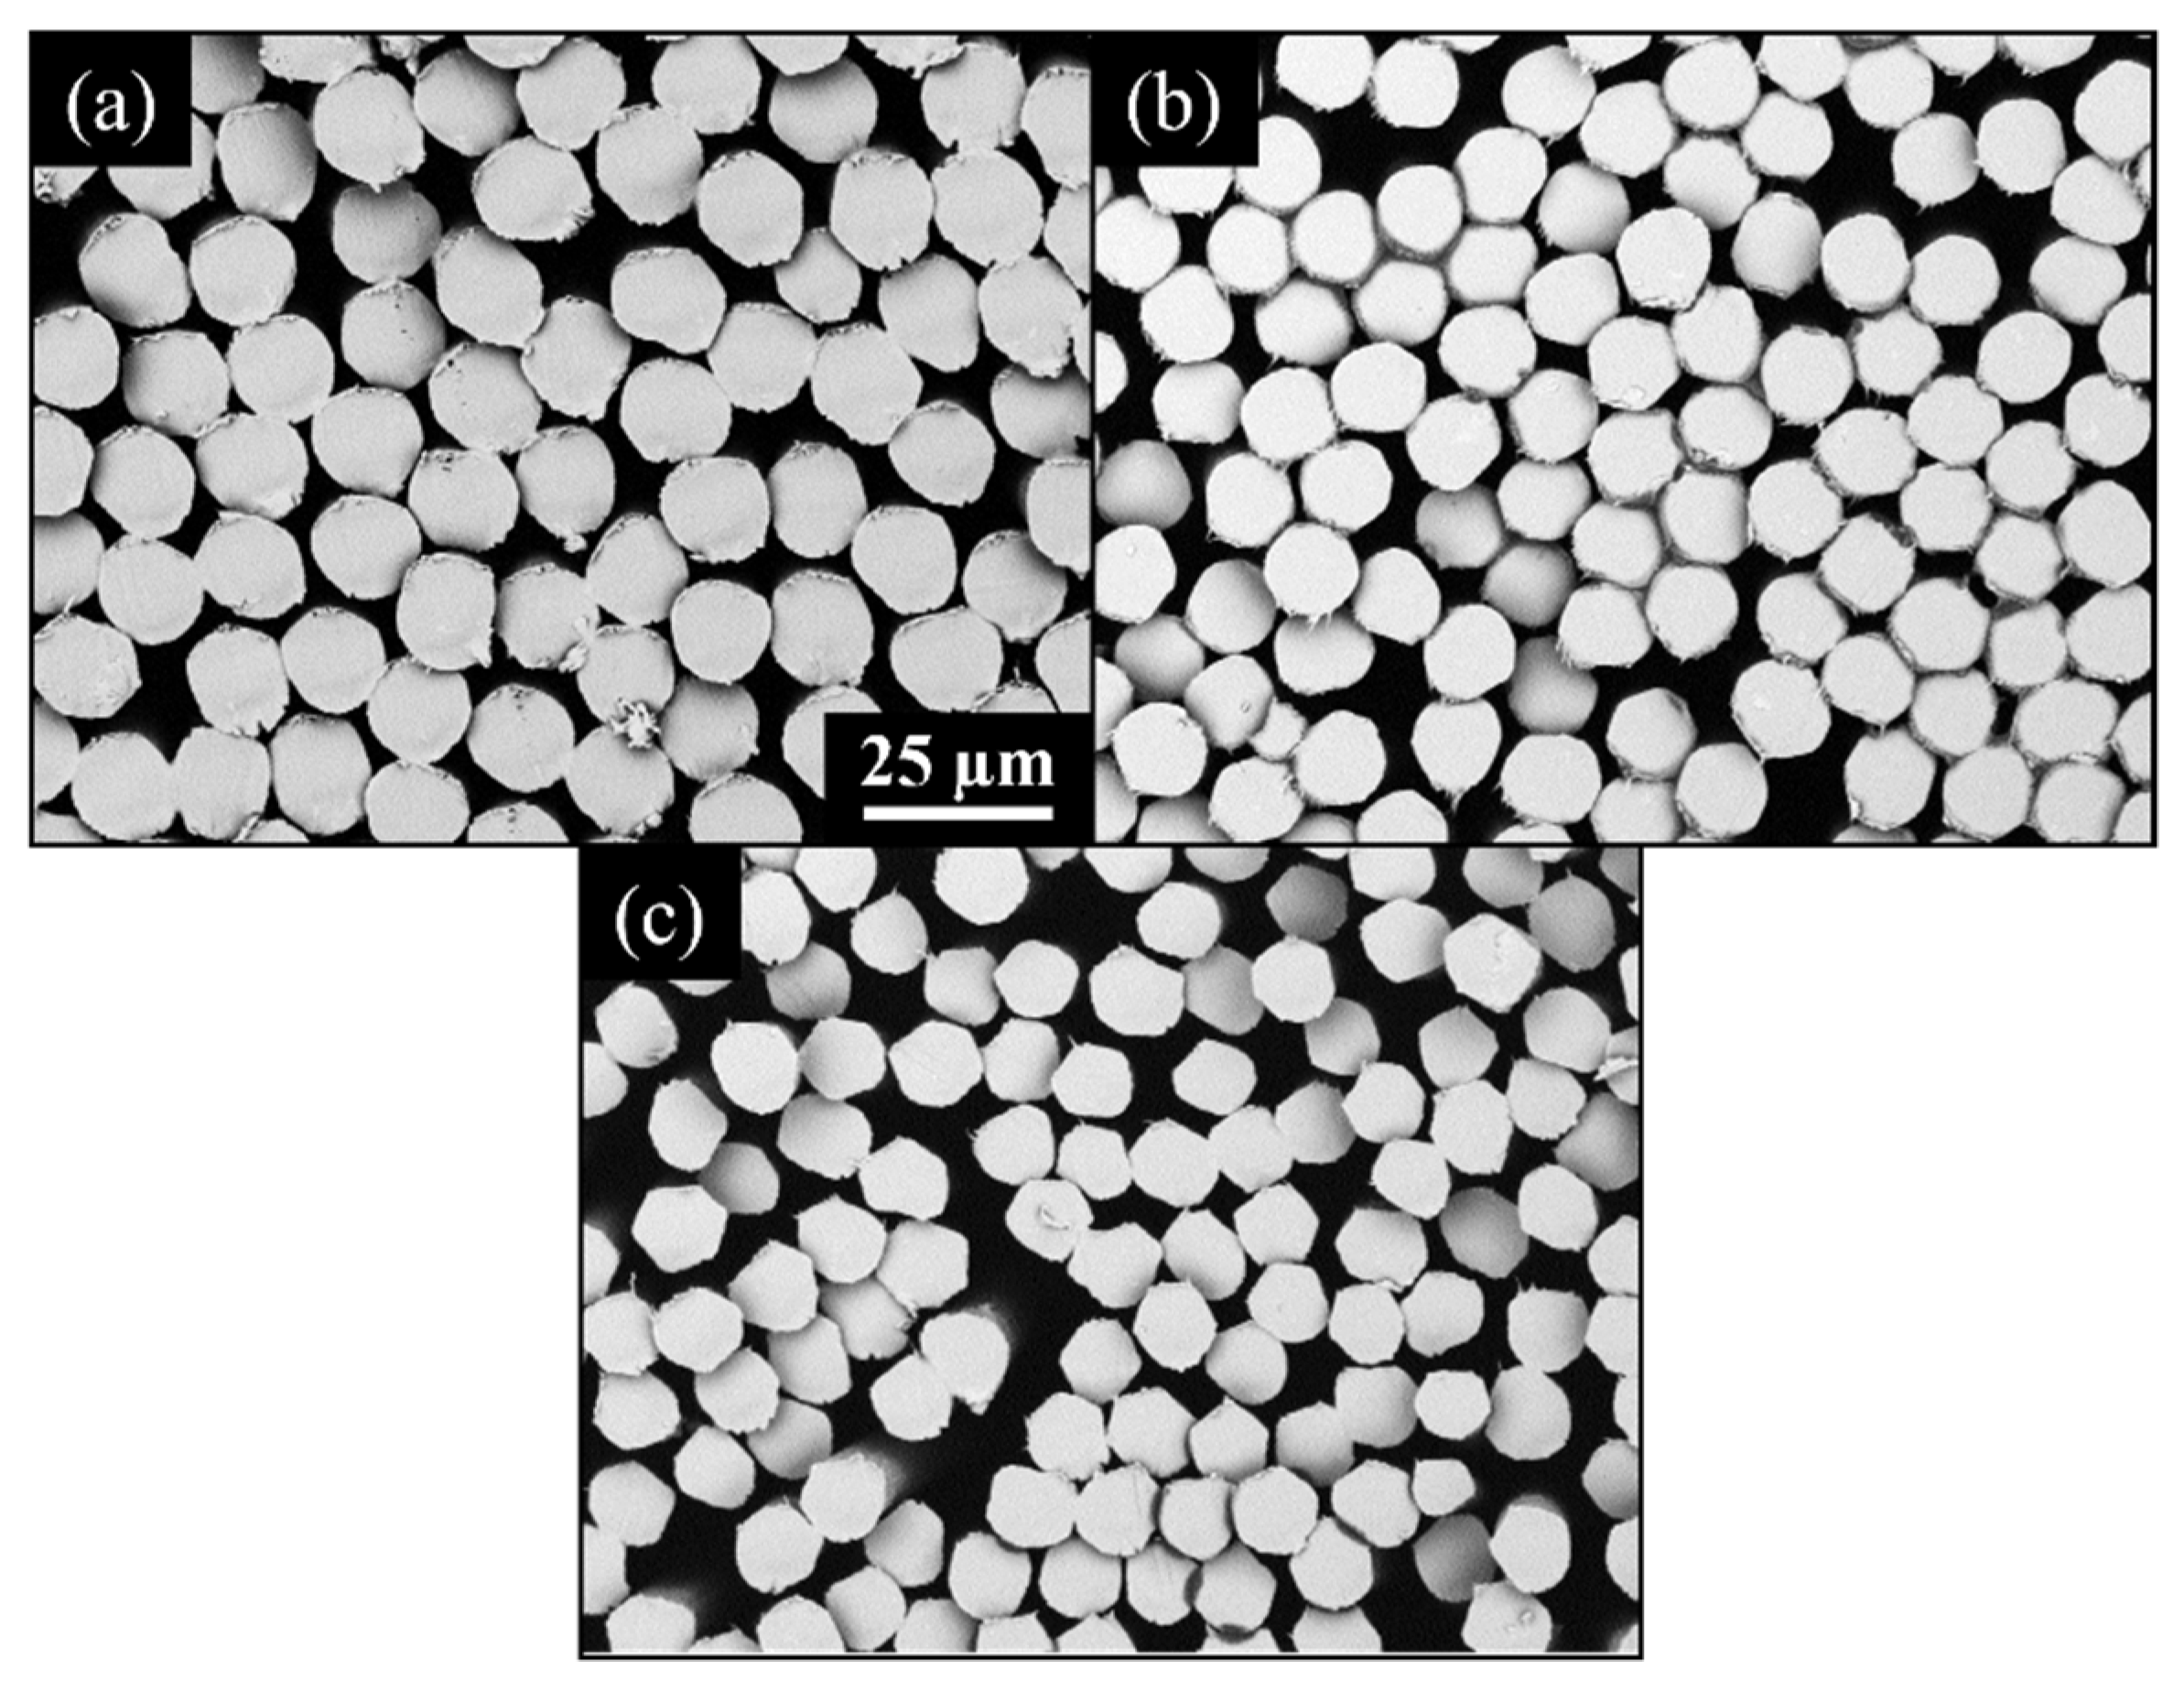
Increasing the coagulation bath temperature is reported to promote the formation of WFs with cross-sections that are circular [44,45]. SEM images of the 60C series are presented in Figure 4, where the cross-sections are almost all circular. Fitting the compression data for these WFs resulted in a single distribution, supporting the proposal that the double distribution is due to the mixture of bean-shaped and circular cross-sections found in the 30C series of WFs. The ET values for all WFs are compiled in Table 2 alongside the tensile properties measured using the Favimat, EL and breaking stress.
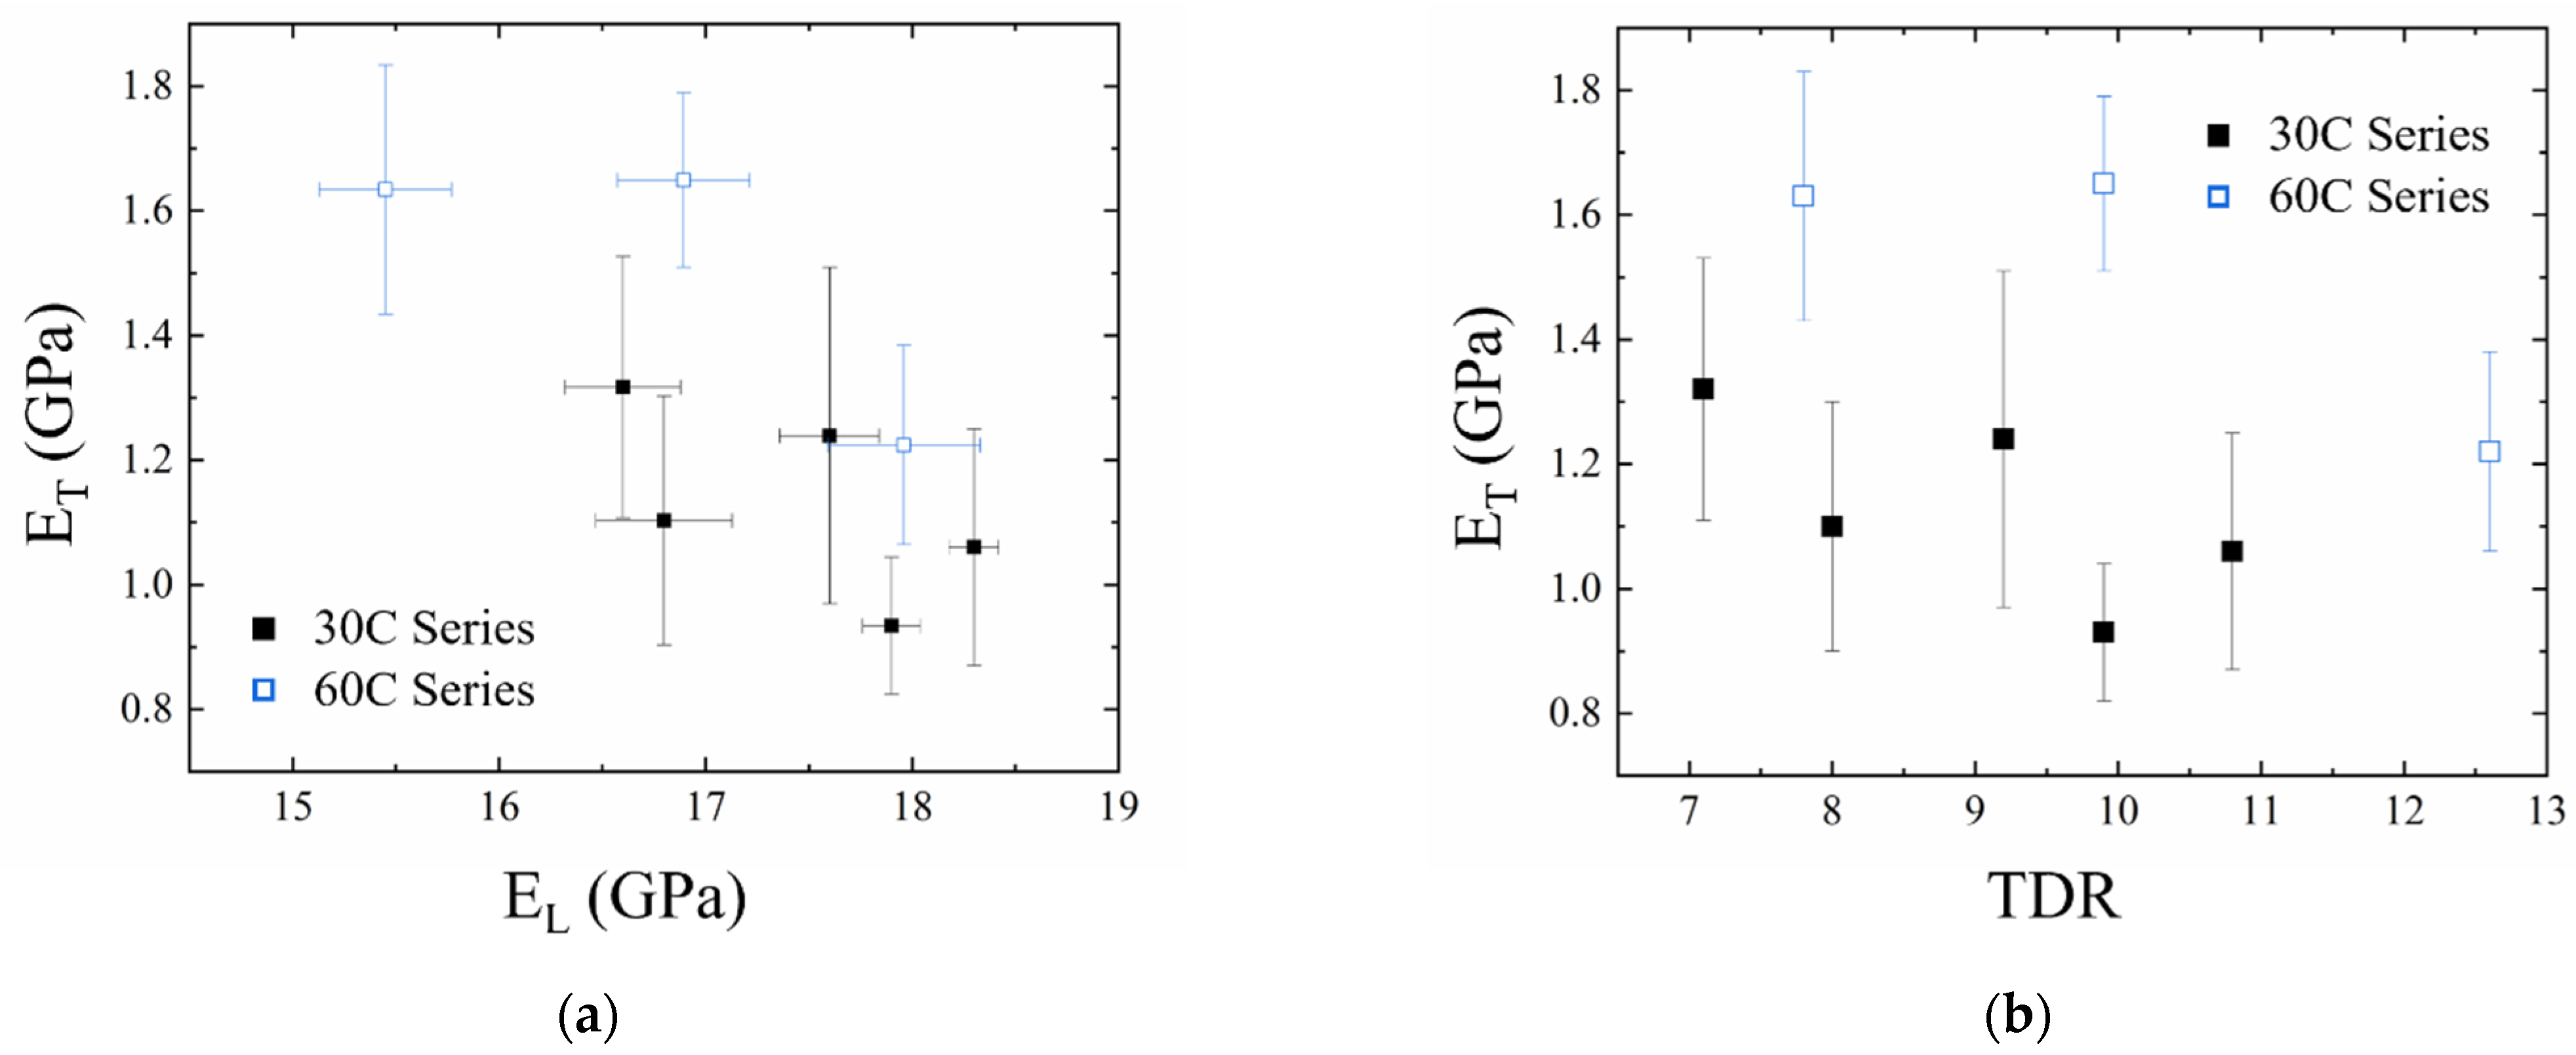
Figure 5a plots the relationship between ET and EL for the WFs investigated, with the error bars representing standard deviation. Overall, there appears to be a linearly decaying relationship between ET and EL. However, the relationship between TDR and ET is not straightforward, as shown in Figure 5b. While there is no general trend between the two series, there appears to be a trend within each series of WFs. This suggests that the coagulation conditions also have a significant impact on how the TDR can impact the ET.

3.2. XRD

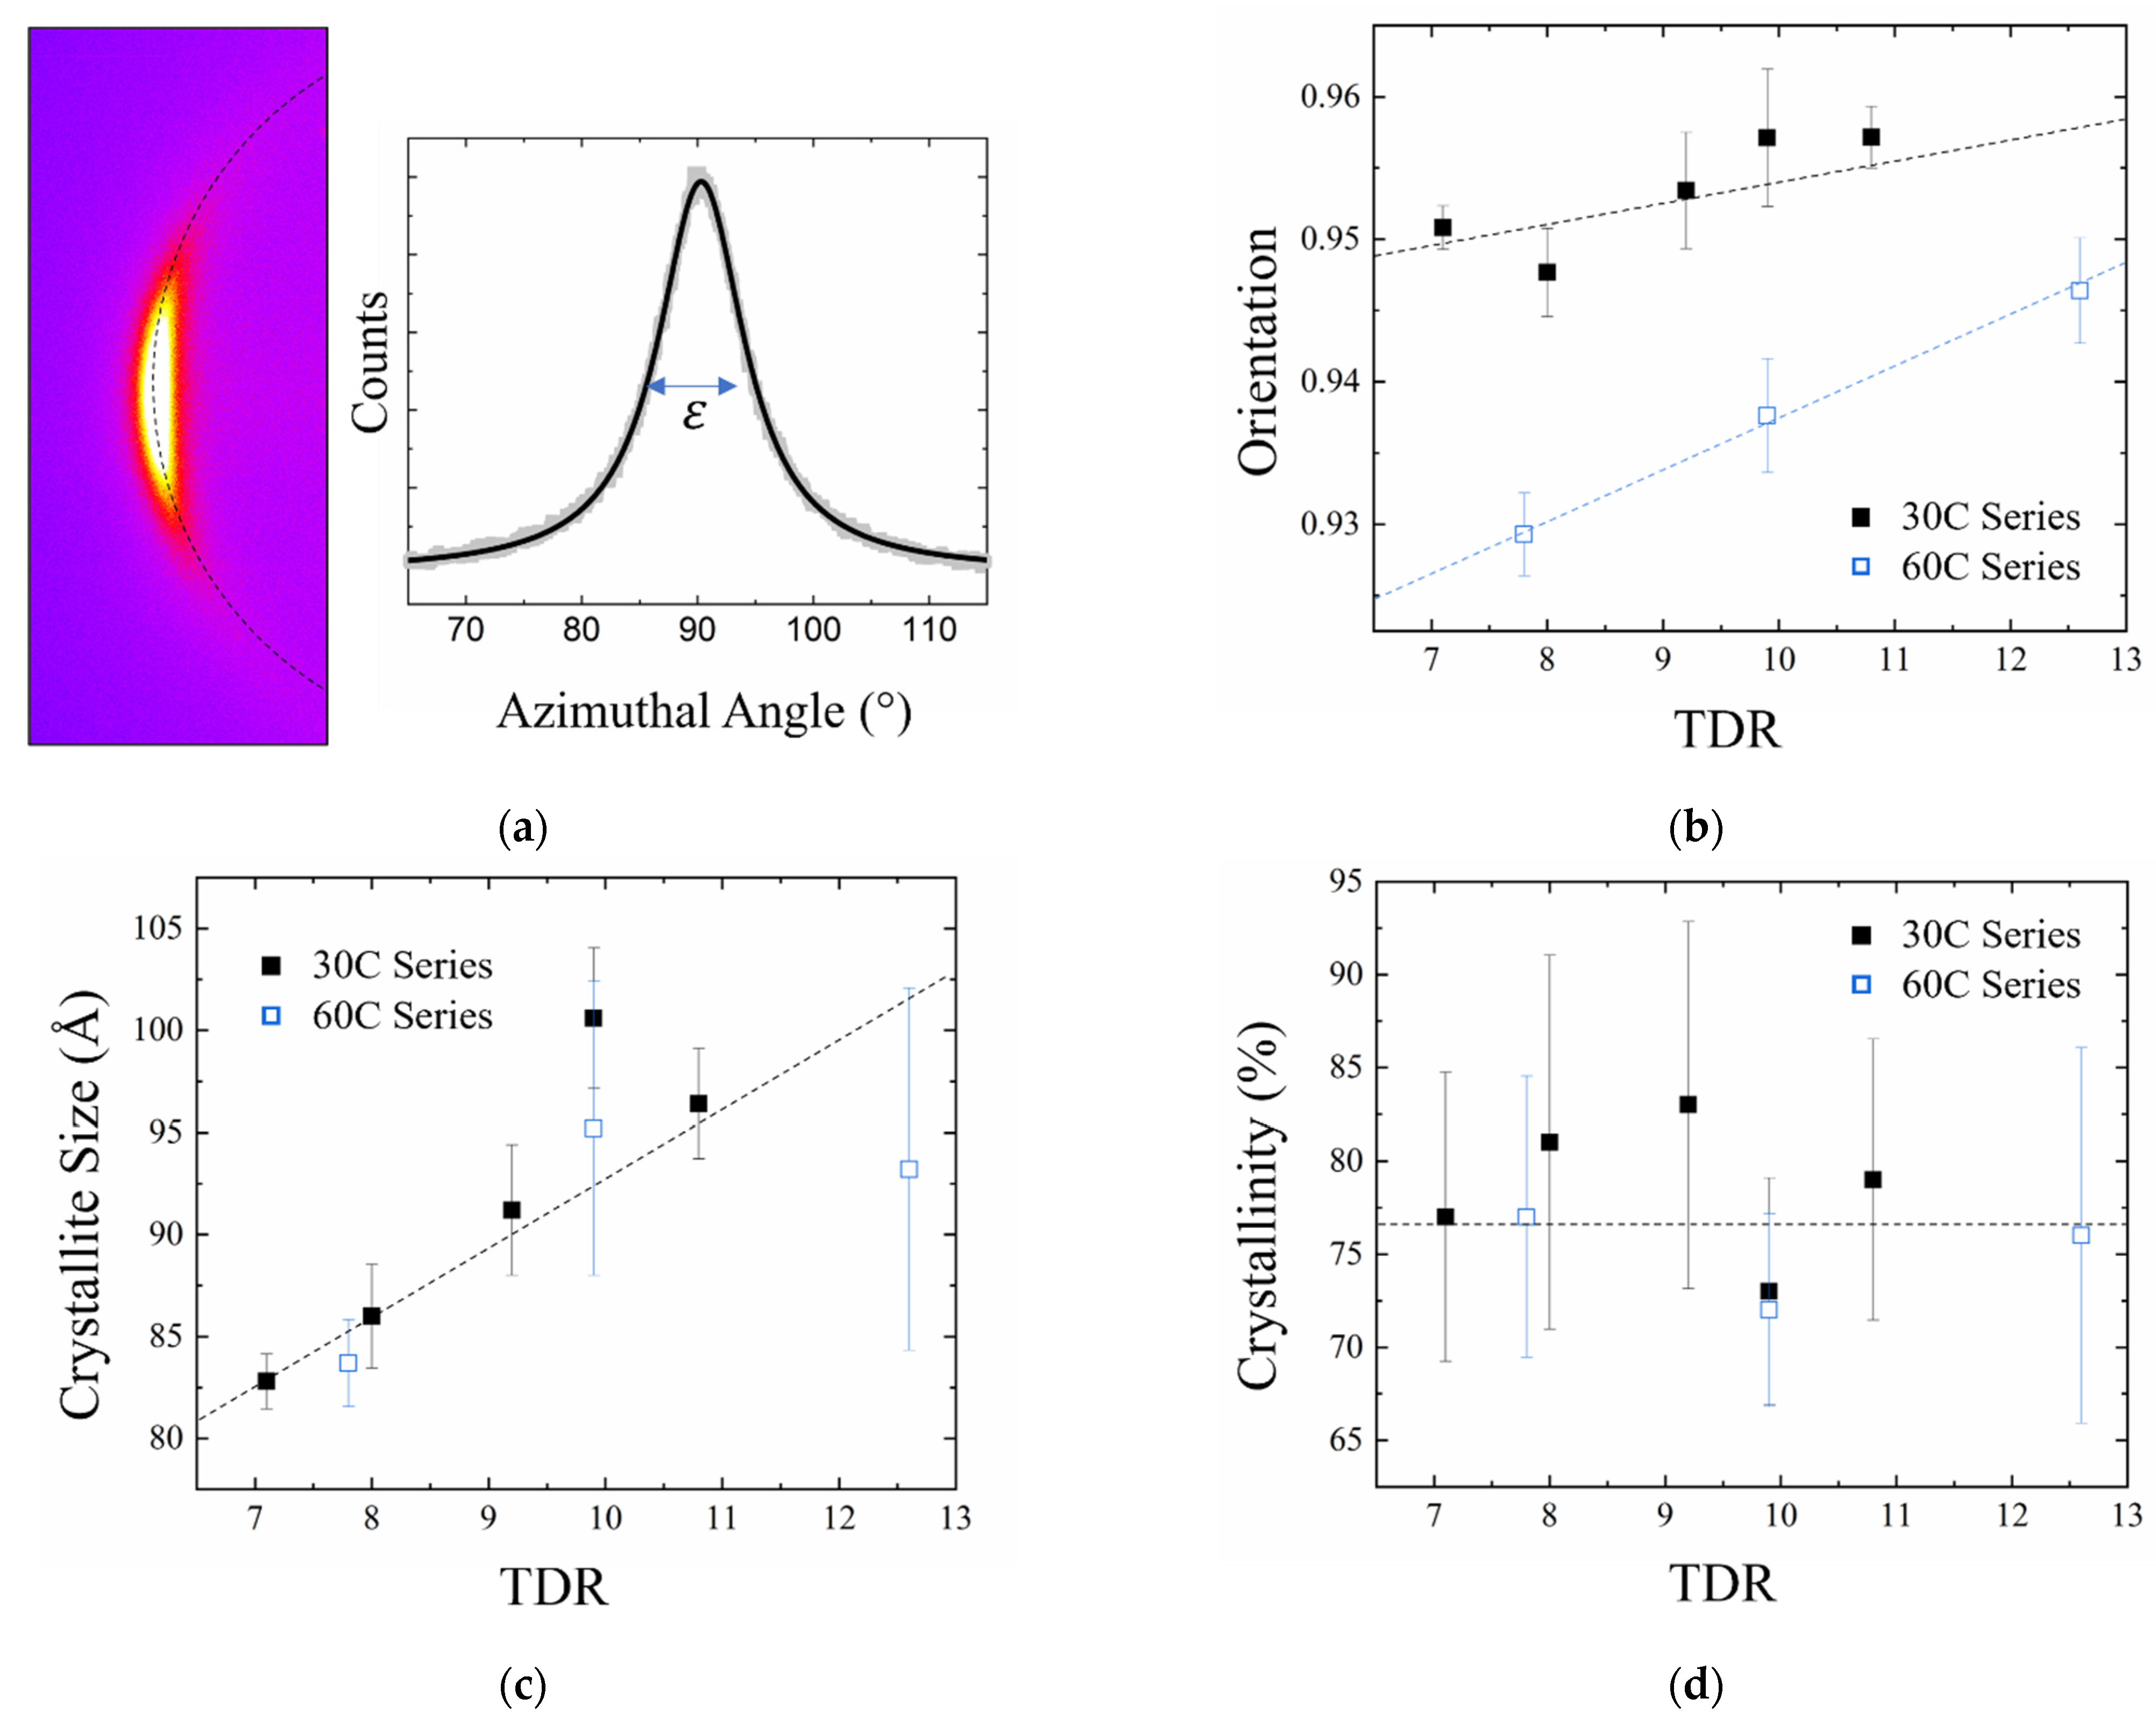
To explore this further, the orientation, crystallite size, and crystallinity of the WFs were measured using XRD, with the results presented in Table 3. Figure 6a shows a typical 2D diffraction image from the WF and the azimuthally integrated profile centered at 2θ = 17° as indicated by the dashed line. The FWHM (ε) of this peak is used to calculate the crystallite orientation of the WFs. Figure 6b shows that more stretching increased the orientation for both series, but in a different manner. A linear fit for both series is presented in Figure 6b. For the 30C series there is a slope of 1.8 × 10⁻³ which intercepts TDR = 10 at 0.955. For the 60C series, there is a slope of 3.3 × 10⁻³ which intercepts TDR = 10 at 0.935. That is, the 30C series has a higher average value but increases at a lower rate with respect to TDR. Figure 6c shows that more stretching increased the crystallite size in a linear manner, with both series following the same trend. Figure 6d shows that the crystallinity did not appear to be dependent on the TDR within the range investigated. It is important to note that while the crystallinity has generally been reported to increase with increased stretching in the literature [16,18,46], such studies are on a single WF as it is increasingly stretched during its spinning process. Here, multiple finished WFs experiencing different spinning conditions are being compared. Bajaj et al. compared finished WF with 4×, 5×, and 6× TDR and saw no increase in the crystallinity with respect to stretching [47]. However, they also observed no change in crystallinity throughout the entire spinning process. Shin et al. reported that the stage at which stretching is applied (i.e., jets stretch or post-draw stretch) has a significantly larger impact on crystallinity than the TDR [48]. Moskowitz et al. compared WFs with constant TDR distributed differently between the initial jet stretch and the final post-draw stretch [49]. They observed a decrease in crystallinity as the WF progressed along the spinning process despite the additional stretching, but the finished WF had the same crystallinity for all samples. They concluded that crystallinity is difficult to measure and interpret due to the convolution of the amorphous and second order peaks. That is to say, the crystallinity of WFs is impacted by many spinning parameters and does not necessarily share a linear relationship with any parameter, including post-draw stretching. The most probable proposal is that, within our coagulation conditions, there is a maximum crystallinity of ~75% which has been reached by all WFs studied.
The key difference between the crystal structures of the 30C and 60C series is the orientation, with the 30C series having a higher overall orientation, but the increase in orientation with increasing TDR is lower. The higher overall orientation can be attributed to the effect of spinning conditions excluding post-draw stretching on the orientation. WFs have been reported to have orientation at the point of coagulation, before any post-draw stretching has been applied, which affects the orientation of the finished WF [18,21]. Furthermore, some WFs are more readily aligned in the direction of drawing [50]. In particular, a higher solvent concentration in the coagulation bath results in higher orientation for WFs of similar TDR [8], consistent with the observation here that the 30C series with higher DMSO concentration has a higher orientation. Regarding the decreased impact of stretching for the 30C series, stretching to increase orientation has diminishing returns as the sample approaches the maximum practical orientation given instrumental limitations.
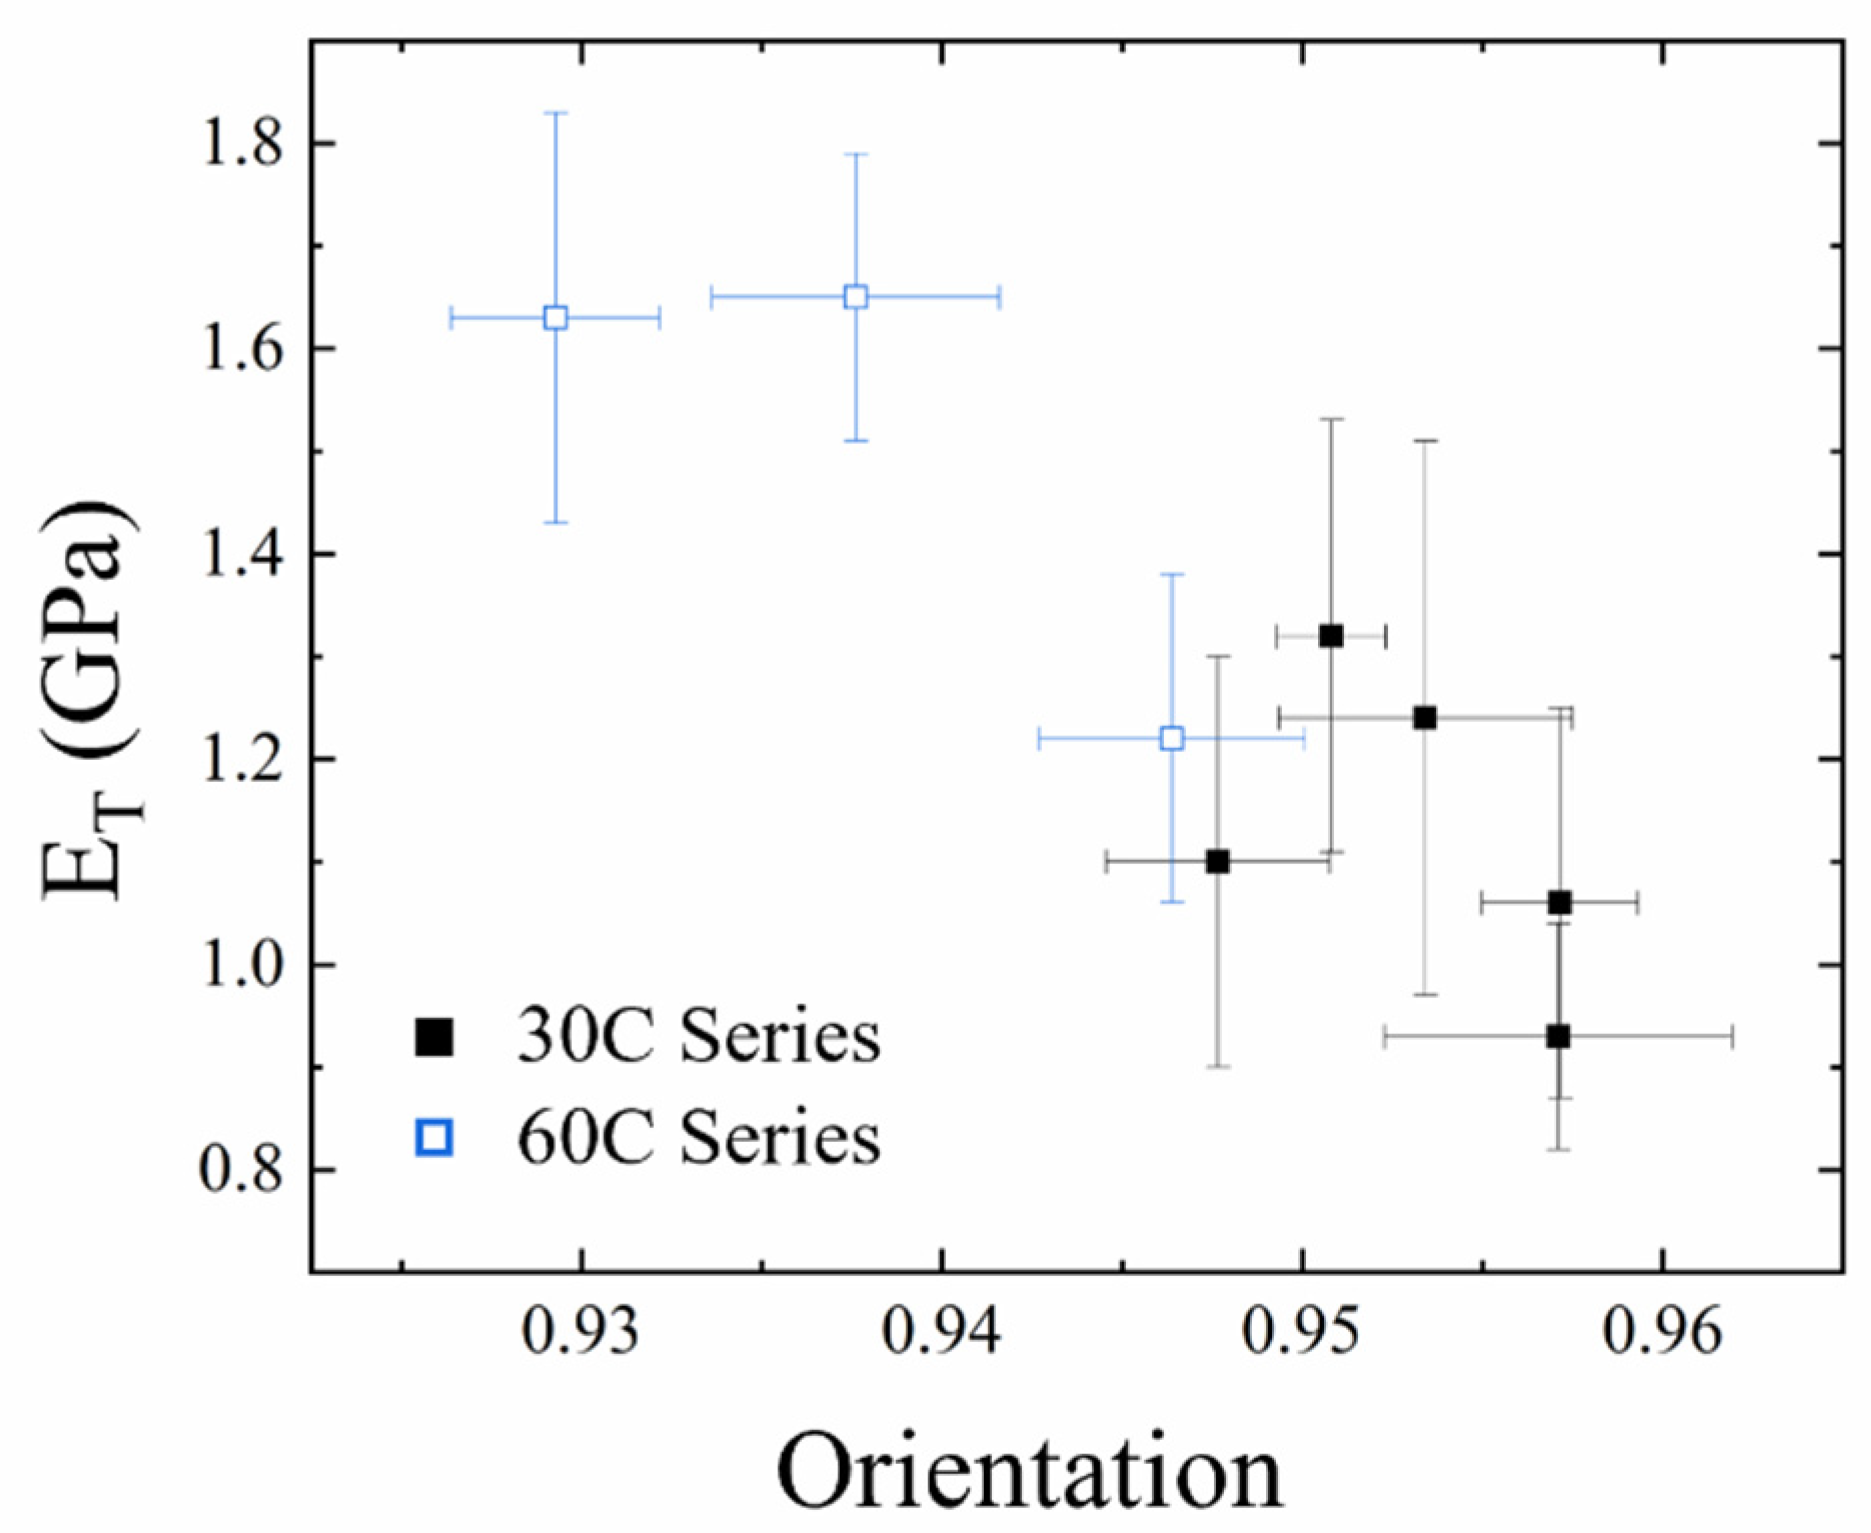
Therefore, the relationship between TDR and orientation is only applicable to WF produced under similar coagulation conditions. Rather, when ET is plotted against orientation—as shown in Figure 7—an inversely proportional relationship is observed, confirming that orientation is correlated to ET. These results highlight the importance of the coagulation conditions, which determines the impact of subsequent stretching on the crystal structure and mechanical properties of the WF. Therefore, the solvent concentration must also be considered when modifying the orientation to engineer more desirable mechanical properties.

3.3. Carbonization

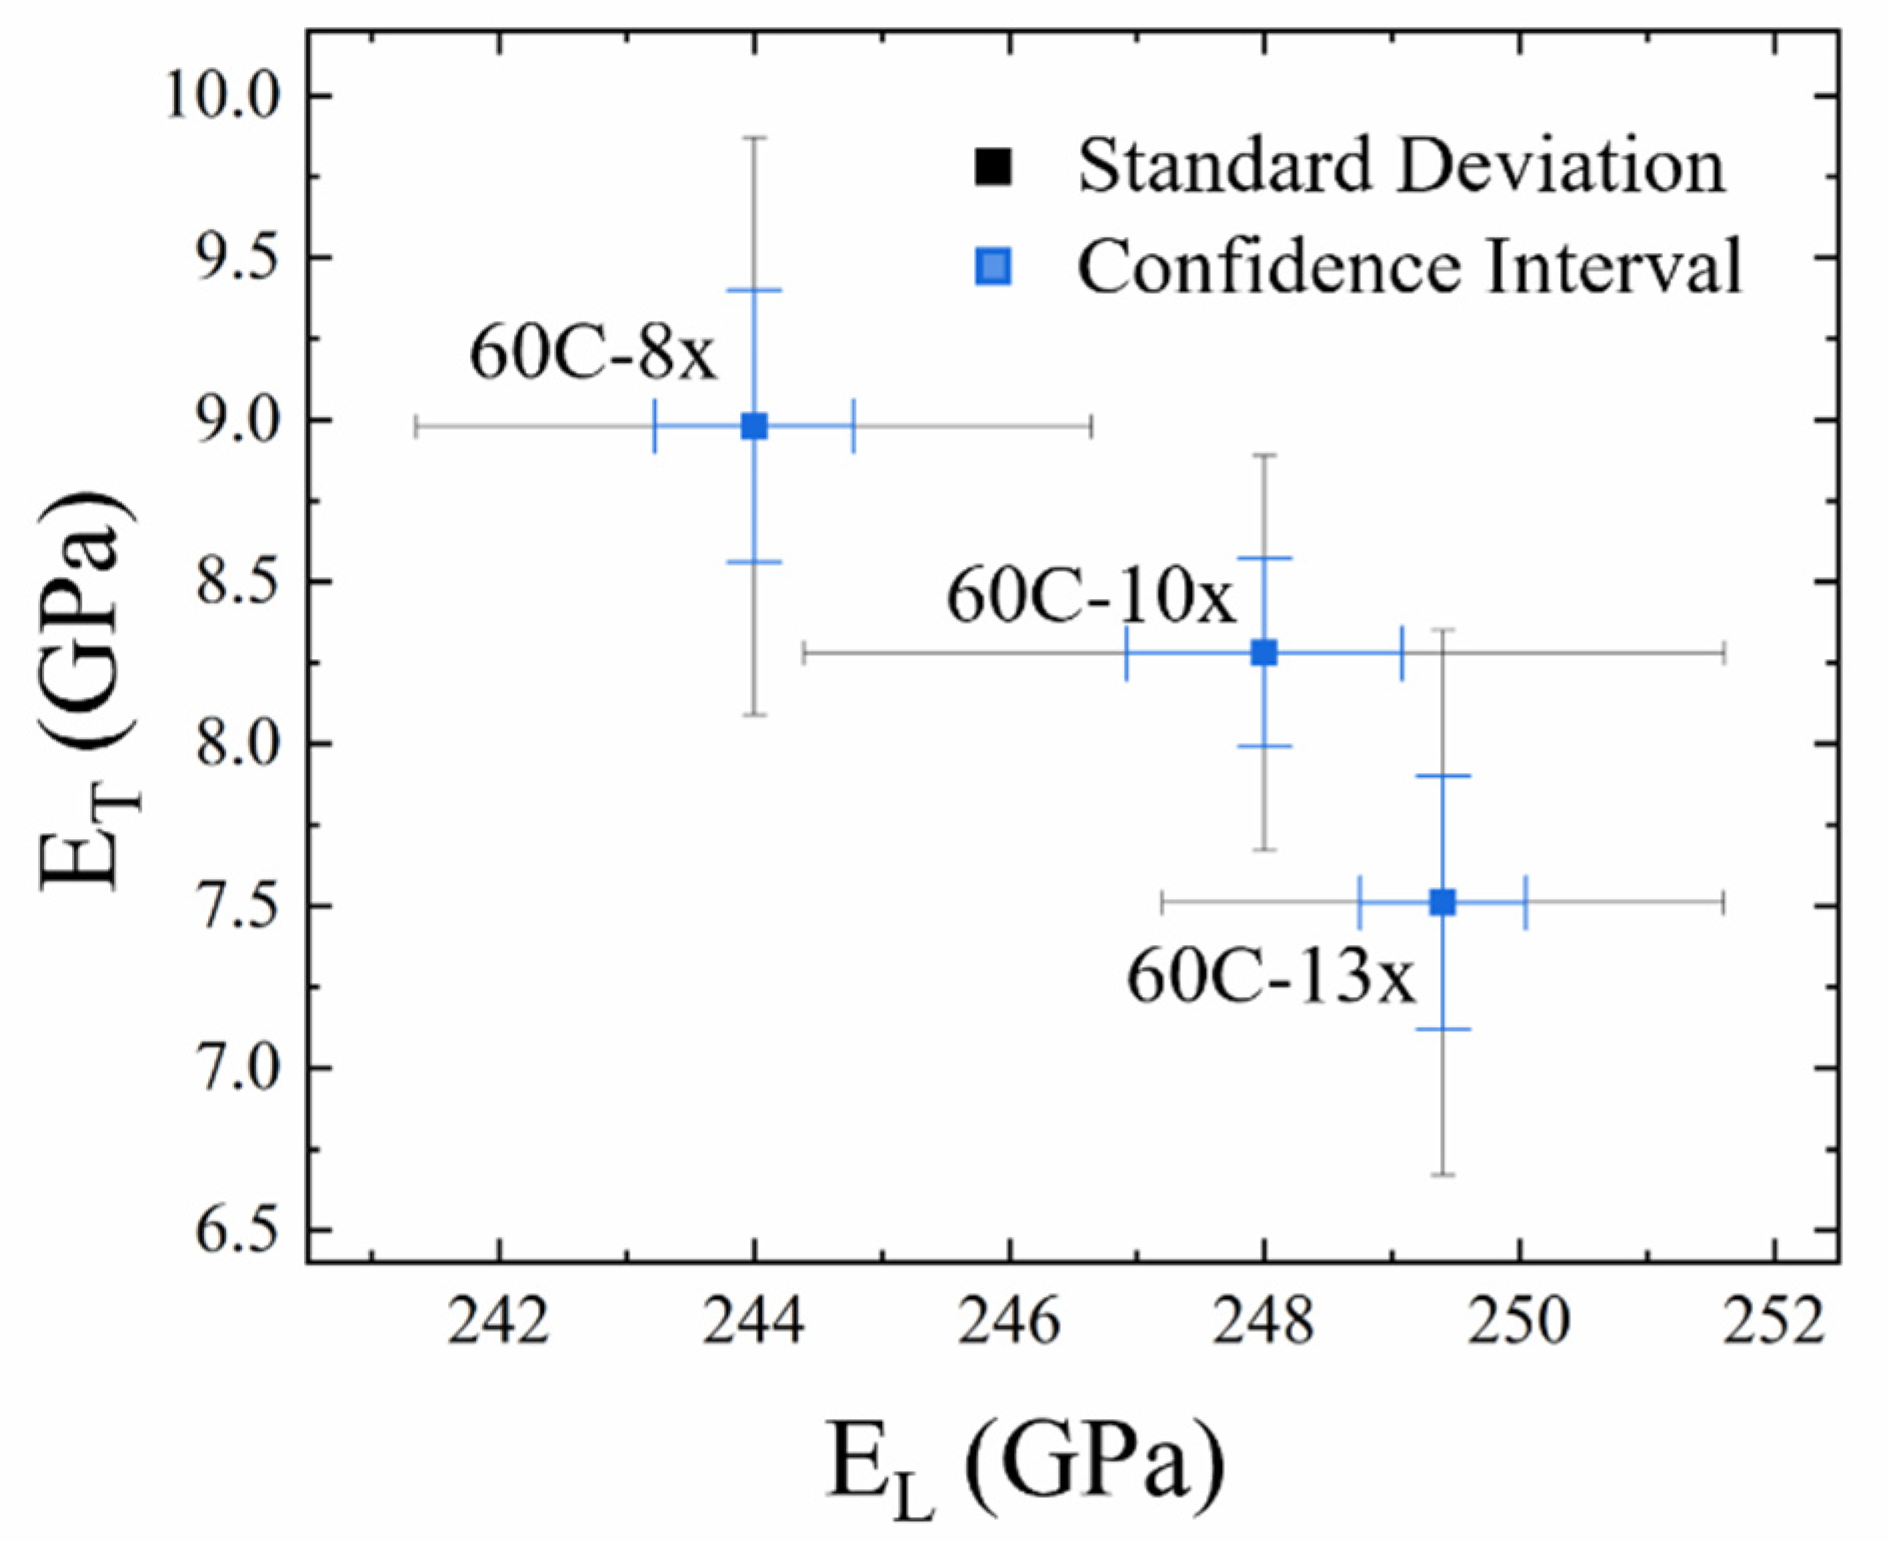
To confirm the inverse relationships between ET and EL are preserved in the final CF, the 60C series WFs were carbonized. Figure 8 plots ET to EL for the 60C series after carbonization, with the error bars representing (a) standard deviation and (b) confidence intervals with 95% confidence level. The standard deviation describes the distribution of ET measurements (including physical variance within the fiber structure) and does not reflect the uncertainty in the mean result, whereas the confidence interval clearly shows that the inverse relationship between ET and EL and its dependence on stretching has remained after carbonization. The difference between the ET gained to the EL lost is significant, with a 20% increase in ET to a 2% decrease in EL.

4. Conclusions

Compression was performed on WFs that were formed under two sets of coagulation conditions, with increasing amounts of post drawing applied to the WFs within each set, to investigate the relationship between the TDR and ET. To fit ET from a compression curve, a loading segment that did not exhibit plastic deformation behavior was fitted using the elastic contact mechanics model developed by Morris et al. Due to the presence of polymer creep, it was not readily apparent whether plasticity had occurred during compression. Instead, a method for determining if the offset is from polymer creep or plastic deformation is presented. In this method, the WF is allowed to creep until a plateau is reached, unloaded, and then immediately recompressed. The unloading curves of these two compressions will overlap if no plastic deformation has occurred.
SEM imaging suggested the cross-sectional shape of the WF had a significant impact on the fitted ET value, with bean-shaped cross-sections fitting a much higher ET. Thus, only WFs with a circular cross-section were considered. As expected, the ET increased when the orientation of the crystallites within the WF decreased, which also resulted in a slight decrease in EL. For WFs with similar TDR, a higher solvent concentration in the coagulation bath resulted in a higher orientation. However, it also resulted in less sensitivity to changes in the TDR. Thus, while reducing the amount of post drawing is a powerful method for increasing the ET of a WF, consideration of the coagulation conditions prior to post-draw stretching is required to fully utilize this method. Further studies could be done by lowering the coagulation bath solvent concentration and TDR to explore the amount ET can be improved before other desirable properties of the WF (and resultant CF) become significantly impacted.
For the WFs where reduced stretching resulted in reduced orientation, the increase in ET remained after carbonization. This resulted in a CF that had a 20% increase in ET with negligible loss of EL. This not only suggests that EL can be systematically traded for increased ET by controlled stretching, but it also suggests that this can be done in a highly efficient manner to maximize ET gained in the final CF.

Author Contributions

Conceptualization, S.W., A.J.S., L.K.H., J.K. and A.P.P.; Methodology, S.W., J.A.S. and J.K.; Validation, S.W., L.K.H. and J.K.; Formal analysis, S.W. and J.A.S.; Investigation, S.W. and J.A.S.; Resources, L.K.H., J.K., A.J.S., J.A.S. and A.P.P.; Data curation, S.W. and A.J.S.; Writing—original draft preparation, S.W., A.J.S. and A.P.P.; Writing—review and editing, All authors; Visualization, S.W. and A.P.P.; Supervision, A.P.P.; Project administration, S.W. and A.P.P. All authors have read and agreed to the published version of the manuscript.

Funding

This research received no external funding.

Institutional Review Board Statement

Not applicable.

Informed Consent Statement

Not applicable.

Data Availability Statement

The data presented in this study are openly available in FigShare at https://doi.org/10.6084/m9.figshare.19624311 (accessed on 21 April 2022).

Acknowledgments

The authors would like to acknowledge Nicole Phair-Sorenson and Debra Hamilton for performing the Favimat testing and SEM imaging, respectively.

Conflicts of Interest

The authors declare that they have no known competing financial interests or personal relationships that could have appeared to influence the work reported in this paper.

References

  1. Fitzer, E. Pan-based carbon fibers-present state and trend of the technology from the viewpoint of possibilities and limits to influence and to control the fiber properties by the process parameters. Carbon 1989, 27, 621–645. [Google Scholar] [CrossRef]
  2. Krenkel, W.; Berndt, F. C/C–SiC composites for space applications and advanced friction systems. Mater. Sci. Eng. A 2005, 412, 177–181. [Google Scholar] [CrossRef]
  3. Khayyam, H.; Fakhrhoseini, S.M.; Church, J.S.; Milani, A.S.; Bab-Hadiashar, A.; Jazar, R.N.; Naebe, M. Predictive modelling and optimization of carbon fiber mechanical properties through high temperature furnace. Appl. Therm. Eng. 2017, 125, 1539–1554. [Google Scholar] [CrossRef]
  4. Kumar, I.P.; Mohite, P.; Kamle, S. Axial compressive strength testing of single carbon fibres. Arch. Mech. 2013, 65, 27–43. [Google Scholar]
  5. Ji, X.; Wang, C.; Francis, B.A.; Chia, E.S.; Zheng, L.; Yang, J.; Joshi, S.C.; Chen, Z. Mechanical and interfacial properties characterisation of single carbon fibres for composite applications. Exp. Mech. 2015, 55, 1057–1065. [Google Scholar] [CrossRef]
  6. Barnet, F.R.; Norr, M.K. A three-dimensional structural model for a high modulus pan-based carbon fibre. Composites 1976, 7, 93–99. [Google Scholar] [CrossRef]
  7. Chari, S.S.; Bahl, O.P.; Mathur, R.B. Characterisation of acrylic fibres used for making carbon fibres. Fibre Sci. Technol. 1981, 15, 153–160. [Google Scholar] [CrossRef]
  8. Morris, E.A.; Weisenberger, M.C.; Rice, G.W. Properties of PAN Fibers Solution Spun into a Chilled Coagulation Bath at High Solvent Compositions. Fibers 2015, 3, 560–574. [Google Scholar] [CrossRef] [Green Version]
  9. Lee, J.-E.; Chae, Y.K.; Lee, D.J.; Choi, J.; Chae, H.G.; Kim, T.H.; Lee, S. Microstructural evolution of polyacrylonitrile fibers during industry-mimicking continuous stabilization. Carbon 2022, 195, 165–173. [Google Scholar] [CrossRef]
  10. Han, C.D.; Segal, L. A study of fiber extrusion in wet spinning. II. Effects of spinning conditions on fiber formation. J. Appl. Polym. Sci. 1970, 14, 2999–3019. [Google Scholar] [CrossRef]
  11. Kulichikhin, V.G.; Skvortsov, I.Y.; Mironova, M.I.; Ozerin, A.N.; Kurkin, T.S.; Berkovich, A.K.; Frenkin, E.I.; Malkin, A.Y. From Polyacrylonitrile, its Solutions, and Filaments to Carbon Fibers II. Spinning PAN-Precursors and their Thermal Treatment. Adv. Polym. Technol. 2018, 37, 1099–1113. [Google Scholar] [CrossRef]
  12. Sun, L.; Shang, L.; Xiao, L.; Zhang, M.; Li, M.; Ao, Y. Structural changes of polyacrylonitrile fibers in the process of wet spinning. J. Appl. Polym. Sci. 2020, 137, 48905. [Google Scholar] [CrossRef]
  13. Kaur, J.; Millington, K.; Smith, S. Producing high-quality precursor polymer and fibers to achieve theoretical strength in carbon fibers: A review. J. Appl. Polym. Sci. 2016, 133, 43963. [Google Scholar] [CrossRef] [Green Version]
  14. Ahn, H.; Yeo, S.Y.; Lee, B.-S. Designing Materials and Processes for Strong Polyacrylonitrile Precursor Fibers. Polymers 2021, 13, 2863. [Google Scholar] [CrossRef] [PubMed]
  15. Sen, K.; Bajaj, P.; Sreekumar, T.V. Thermal behavior of drawn acrylic fibers. J. Polym. Sci. Part B-Polym. Phys. 2003, 41, 2949–2958. [Google Scholar] [CrossRef]
  16. Kirsten, M.; Meinl, J.; Schonfeld, K.; Michaelis, A.; Cherif, C. Characteristics of wet-spun and thermally treated poly acrylonitrile fibers. J. Appl. Polym. Sci. 2016, 133, 9. [Google Scholar] [CrossRef]
  17. Gao, Q.; Jing, M.; Chen, M.; Zhao, S.; Wang, Y.; Qin, J.; Yu, M.; Wang, C. Force field in coagulation bath at low temperature induced microfibril evolution within PAN nascent fiber and precursor fiber. J. Appl. Polym. Sci. 2020, 137, 49380. [Google Scholar] [CrossRef]
  18. Wang, Y.X.; Wang, C.G.; Bai, Y.J.; Bo, Z. Effect of the drawing process on the wet spinning of polyacrylonitrile fibers in a system of dimethyl sulfoxide and water. J. Appl. Polym. Sci. 2007, 104, 1026–1037. [Google Scholar] [CrossRef]
  19. Gao, Q.; Jing, M.; Chen, M.; Zhao, S.; Wang, W.; Qin, J.; Wang, C. Microfibril alignment induced by stretching fields during the dry-jet wet spinning process: Reinforcement on polyacrylonitrile fiber mechanical properties. Polym. Test. 2020, 81, 106191. [Google Scholar] [CrossRef]
  20. Wang, Y.; Tong, Y.; Zhang, B.; Su, H.; Xu, L. Formation of Surface Morphology in Polyacrylonitrile (PAN) Fibers during Wet-Spinning. J. Eng. Fibers Fabr. 2018, 13, 52–57. [Google Scholar] [CrossRef] [Green Version]
  21. Ouyang, Q.; Chen, Y.; Wang, X.; Ma, H.; Li, D.; Yang, J. Supramolecular structure of highly oriented wet-spun polyacrylonitrile fibers used in the preparation of high-performance carbon fibers. J. Polym. Res. 2015, 22, 229. [Google Scholar] [CrossRef]
  22. Gao, Q.; Jing, M.; Wang, C.; Zhao, S.; Chen, M.; Qin, J. Preparation of high-quality polyacrylonitrile precursors for carbon fibers through a high drawing ratio in the coagulation bath during a dry-jet wet spinning process. J. Macromol. Sci. Part B 2019, 58, 128–140. [Google Scholar] [CrossRef]
  23. Oya, N.; Johnson, D.J. Longitudinal compressive behaviour and microstructure of PAN-based carbon fibres. Carbon 2001, 39, 635–645. [Google Scholar] [CrossRef]
  24. Chand, S. Review carbon fibers for composites. J. Mater. Sci. 2000, 35, 1303–1313. [Google Scholar] [CrossRef]
  25. Li, H.; Liu, C.; Chen, J. Predicting and Characterizing Plastic Deformation Behavior of Transversely-isotropic Carbon Fiber Monofilament Using Finite Element Simulation and Nanoindentation. Fibers Polym. 2021, 22, 2316–2322. [Google Scholar] [CrossRef]
  26. Duan, S.; Liu, F.; Pettersson, T.; Creighton, C.; Asp, L.E. Determination of transverse and shear moduli of single carbon fibres. Carbon 2020, 158, 772–782. [Google Scholar] [CrossRef]
  27. Csanádi, T.; Németh, D.; Zhang, C.; Dusza, J. Nanoindentation derived elastic constants of carbon fibres and their nanostructural based predictions. Carbon 2017, 119, 314–325. [Google Scholar] [CrossRef] [Green Version]
  28. Tane, M.; Okuda, H.; Tanaka, F. Nanocomposite microstructures dominating anisotropic elastic modulus in carbon fibers. Acta Mater. 2019, 166, 75–84. [Google Scholar] [CrossRef]
  29. Shirasu, K.; Nagai, C.; Naito, K. Mechanical anisotropy of PAN-based and pitch-based carbon fibers. Mech. Eng. J. 2020, 7, 19–00599. [Google Scholar] [CrossRef] [Green Version]
  30. Shirasu, K.; Goto, K.; Naito, K. Microstructure-elastic property relationships in carbon fibers: A nanoindentation study. Compos. Part B Eng. 2020, 200, 108342. [Google Scholar] [CrossRef]
  31. Kawabata, S. Measurement of the transverse mechanical-properties of high-performance fibers. J. Text. Inst. 1990, 81, 432–447. [Google Scholar] [CrossRef]
  32. Fujita, K.; Sawada, Y.; Nakanishi, Y. Effect of cross-sectional textures on transverse compressive properties of pitch-based carbon fibers. J. Soc. Mater. Sci. Jpn. 2001, 50, 116–121. [Google Scholar] [CrossRef]
  33. Naito, K.; Tanaka, Y.; Yang, J.-M. Transverse compressive properties of polyacrylonitrile (PAN)-based and pitch-based single carbon fibers. Carbon 2017, 118, 168–183. [Google Scholar] [CrossRef]
  34. Guo, Z.; Chen, W.; Zheng, J. Improved quasi-static twin-fiber transverse compression of several high-performance fibers. Text. Res. J. 2019, 89, 1595–1613. [Google Scholar] [CrossRef]
  35. Sockalingam, S.; Bremble, R.; Gillespie, J.W., Jr.; Keefe, M. Transverse compression behavior of Kevlar KM2 single fiber. Compos. Part A Appl. Sci. Manuf. 2016, 81, 271–281. [Google Scholar] [CrossRef]
  36. Wong, S.; Pierlot, A.; Abbott, A.; Schutz, J. Direct Measurement of the Transverse Modulus of Carbon Fibres. Exp. Mech. 2022, 62, 769–778. [Google Scholar] [CrossRef]
  37. Morris, S. The Determination of the Lateral-Compression Modulus of Fibres. J. Text. Inst. 1968, 59, 536–547. [Google Scholar] [CrossRef]
  38. Hillbrick, L.K.; Kaiser, J.; Huson, M.G.; Naylor, G.R.S.; Wise, E.S.; Miller, A.D.; Lucas, S. Determination of the transverse modulus of cylindrical samples by compression between two parallel flat plates. SN Appl. Sci. 2019, 1, 724–738. [Google Scholar] [CrossRef] [Green Version]
  39. Raghavan, J.; Meshii, M. Creep rupture of polymer composites. Compos. Sci. Technol. 1997, 57, 375–388. [Google Scholar] [CrossRef]
  40. Struik, L.C.E. Physical Aging in Amorphous Polymers and Other Materials; Elsevier Scientific Pub. Co.: Amsterdam, The Netherlands, 1977. [Google Scholar]
  41. Nguyen-Tri, P.; Ghassemi, P.; Carriere, P.; Nanda, S.; Assadi, A.A.; Nguyen, D.D. Recent applications of advanced atomic force microscopy in polymer science: A review. Polymers 2020, 12, 1142. [Google Scholar] [CrossRef]
  42. Bohn, C.; Schaefgen, J.; Statton, W.J. Laterally ordered polymers: Polyacrylonitrile and poly (vinyl trifluoroacetate). Polym. Sci 1961, 55, 531. [Google Scholar] [CrossRef]
  43. Ge, Y.; Fu, Z.; Deng, Y.; Zhang, M.; Zhang, H. The effects of chemical reaction on the microstructure and mechanical properties of polyacrylonitrile (PAN) precursor fibers. J. Mater. Sci. 2019, 54, 12592–12604. [Google Scholar] [CrossRef]
  44. Knudsen, J.P. The influence of coagulation variables on the structure and physical properties of an acrylic fiber. Text. Res. J. 1963, 33, 13. [Google Scholar] [CrossRef]
  45. Khayyam, H.; Jazar, R.N.; Nunna, S.; Golkarnarenji, G.; Badii, K.; Fakhrhoseini, S.M.; Kumar, S.; Naebe, M. PAN precursor fabrication, applications and thermal stabilization process in carbon fiber production: Experimental and mathematical modelling. Prog. Mater. Sci. 2020, 107, 100575. [Google Scholar] [CrossRef]
  46. Gao, Q.; Jing, M.; Zhao, S.; Wang, Y.; Qin, J.; Yu, M.; Wang, C. Effect of spinning speed on microstructures and mechanical properties of polyacrylonitrile fibers and carbon fibers. Ceram. Int. 2020, 46, 23059–23066. [Google Scholar] [CrossRef]
  47. Bajaj, P.; Sreekumar, T.V.; Sen, K. Structure development during dry-jet-wet spinning of acrylonitrile/vinyl acids and acrylonitrile/methyl acrylate copolymers. J. Appl. Polym. Sci. 2002, 86, 773–787. [Google Scholar] [CrossRef]
  48. Shin, K.-A.; Park, S.; Nguyen, H.T.B.; Lee, J.H.; Lee, S.; Joh, H.-I.; Jo, S.M. Investigation into the gelation of polyacrylonitrile solution induced by dry-jet in spinning process and its effects on diffusional process in coagulation and structural properties of carbon fibers. Macromol. Res. 2018, 26, 544–551. [Google Scholar] [CrossRef]
  49. Moskowitz, J.D.; Jackson, M.B.; Tucker, A.; Cook, J.D. Evolution of polyacrylonitrile precursor fibers and the effect of stretch profile in wet spinning. J. Appl. Polym. Sci. 2021, 138, 50967. [Google Scholar] [CrossRef]
  50. Tan, L.; Liu, S.; Song, K.; Chen, H.; Pan, D. Gel-spun polyacrylonitrile fiber from pregelled spinning solution. Polym. Eng. Sci. 2010, 50, 1290–1294. [Google Scholar] [CrossRef]
Figure 1. (a) Load–displacement curves from sequential compression of 30C-7× WF at the same position (first—Black; second—Blue). Each cycle consists of a loading segment (solid circle), a 120 s hold segment at maximum load (solid circle), and an unloading segment (empty circle). (b) Creep during the hold segment, showing the exponential decay to the point creep plateaus. The data (solid circles) have been fitted with an exponential decay function (line).
Fibers 10 00054 g001
Figure 2. (a) Two fitted load–displacement curves from 30C-7× WF, with ET as indicated. These compressions were performed on the same fiber, with compression position less than 2 mm apart. (b) A histogram showing the distribution of the fitted ET values. The data is best fit by two normal distributions, centered at 1.37 GPa and 2.29 GPa with a standard deviation of 0.25 GPa and 0.26 GPa, respectively.
Fibers 10 00054 g002
Figure 3. SEM images showing the cross-sectional shape for (a) 30C-7×, (b) 30C-8×, (c) 30C-9×, (d) 30C-10×, and (e) 30C-11×. All images are at the same scale. An example of a circular (blue) and bean-shaped (green) cross-section has been indicated.
Fibers 10 00054 g003
Figure 4. SEM images showing the cross-sectional shape for (a) 60C-8×, (b) 60C-10×, and (c) 60C-13×. All images are at the same scale.
Fibers 10 00054 g004
Figure 5. Plots showing the dependence of ET on (a) EL and (b) TDR for the WFs measured in this study. The error bars represent the standard deviation.
Fibers 10 00054 g005
Figure 6. (a) A typical 2D diffraction pattern from a WF (left) and the peak profile resulting from azimuthally integrating along the ring indicated by the dashed line (right). Relationship between TDR and (b) orientation, (c) crystallite size, and (d) crystallinity for the WFs measured in this study. The error bars represent (a,b) the standard deviation and (c,d) the experimental uncertainty.
Fibers 10 00054 g006
Figure 7. Relationship between ET and orientation for the WFs measured in this study. The error bars represent the standard deviation.
Fibers 10 00054 g007
Figure 8. Relationship between ET and EL for the CFs measured in this study. The error bars represent the standard deviation (black) and 95% confidence intervals (blue).
Fibers 10 00054 g008
Table 1. The coagulation bath conditions, the stretching ratios at each stretching stage, and the total draw ratio (TDR) of the WFs measured in this study.
NameCoagulation ConditionsJet StretchWash Bath
Stretch
Hot Water
Stretch
Steam StretchTDR
30C-7×70% DMSO @ 30 °C + 50% DMSO @ 40 °C 0.71.252.503.297.2
30C-8×70% DMSO @ 30 °C + 50% DMSO @ 40 °C 0.71.252.503.668.0
30C-9×70% DMSO @ 30 °C + 50% DMSO @ 40 °C 0.71.252.504.209.2
30C-10×70% DMSO @ 30 °C + 50% DMSO @ 40 °C 0.71.252.504.5710.0
30C-11×70% DMSO @ 30 °C + 50% DMSO @ 40 °C 0.71.252.504.9410.8
60C-8×65% DMSO @ 60 °C 0.71.622.502.767.8
60C-10×65% DMSO @ 60 °C 0.71.622.503.5110.0
60C-13×65% DMSO @ 60 °C 0.71.622.504.4412.6
Table 2. The mean EL values, the breaking stress, the mean ET values, and the densities for the WFs and CFs investigated in this study. The EL and density values were measured using a Favimat. Standard deviations are indicated in the round brackets. The confidence intervals (95% confidence) have been provided for the modulus values. The number of measurements is indicated after each confidence interval in curly brackets.
NameEL (GPa)Con. Int. 95%Breaking Stress (GPa)ET (GPa)Con. Int. 95%Density (g/cm3)
30C-7×16.6 (0.28)0.12 {25}0.89 (0.05)1.32 (0.21)0.08 {32}0.67 (0.09)
30C-8×16.8 (0.33)0.14 {23}0.90 (0.08)1.10 (0.20)0.07 {34}1.18 (0.08)
30C-9×17.6 (0.24)0.10 {25}1.00 (0.06)1.24 (0.27)0.07 {62}1.18 (0.06)
30C-10×17.9 (0.34)0.14 {24}1.07 (0.06)0.93 (0.11)0.08 {10}1.18 (0.11)
30C-11×18.3 (0.29)0.12 {25}1.09 (0.07)1.06 (0.19)0.08 {24}1.18 (0.10)
60C-8×15.5 (0.32)0.13 {25}0.79 (0.05)1.63 (0.20)0.09 {20}1.18 (0.06)
60C-10×16.9 (0.32)0.13 {25}0.81 (0.06)1.65 (0.14)0.06 {20}1.18 (0.08)
60C-13×18.0 (0.37)0.15 {25}0.94 (0.09)1.22 (0.16)0.07 {20}1.18 (0.07)
Table 3. The orientation, crystallinity, and the crystallite size as measured using XRD for the WFs investigated in this study. Standard deviations are indicated in the round brackets, while experimental error is indicated after the ± sign.
NameOrientationCrystallinity (%)Crystallite Size (Å)
30C-7×0.955 (0.004)77 ± 883 ± 1
30C-8×0.952 (0.005)81 ± 1086 ± 3
30C-9×0.949 (0.004)83 ± 1091 ± 10
30C-10×0.962 (0.004)73 ± 6101 ± 4
30C-11×0.960 (0.004)79 ± 896 ± 8
60C-8×0.929 (0.005)77 ± 884 ± 2
60C-10×0.938 (0.004)72 ± 595 ± 7
60C-13×0.946 (0.004)76 ± 1092 ± 13
Publisher’s Note: MDPI stays neutral with regard to jurisdictional claims in published maps and institutional affiliations.