
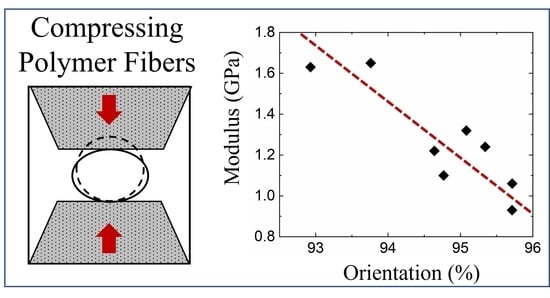
Improving Transverse Compressive Modulus of Carbon Fibers during Wet Spinning of Polyacrylonitrile

 , and
, and
Abstract
:
1. Introduction
2. Materials and Methods
2.1. Spinning
2.2. Carbonization
2.3. Compression
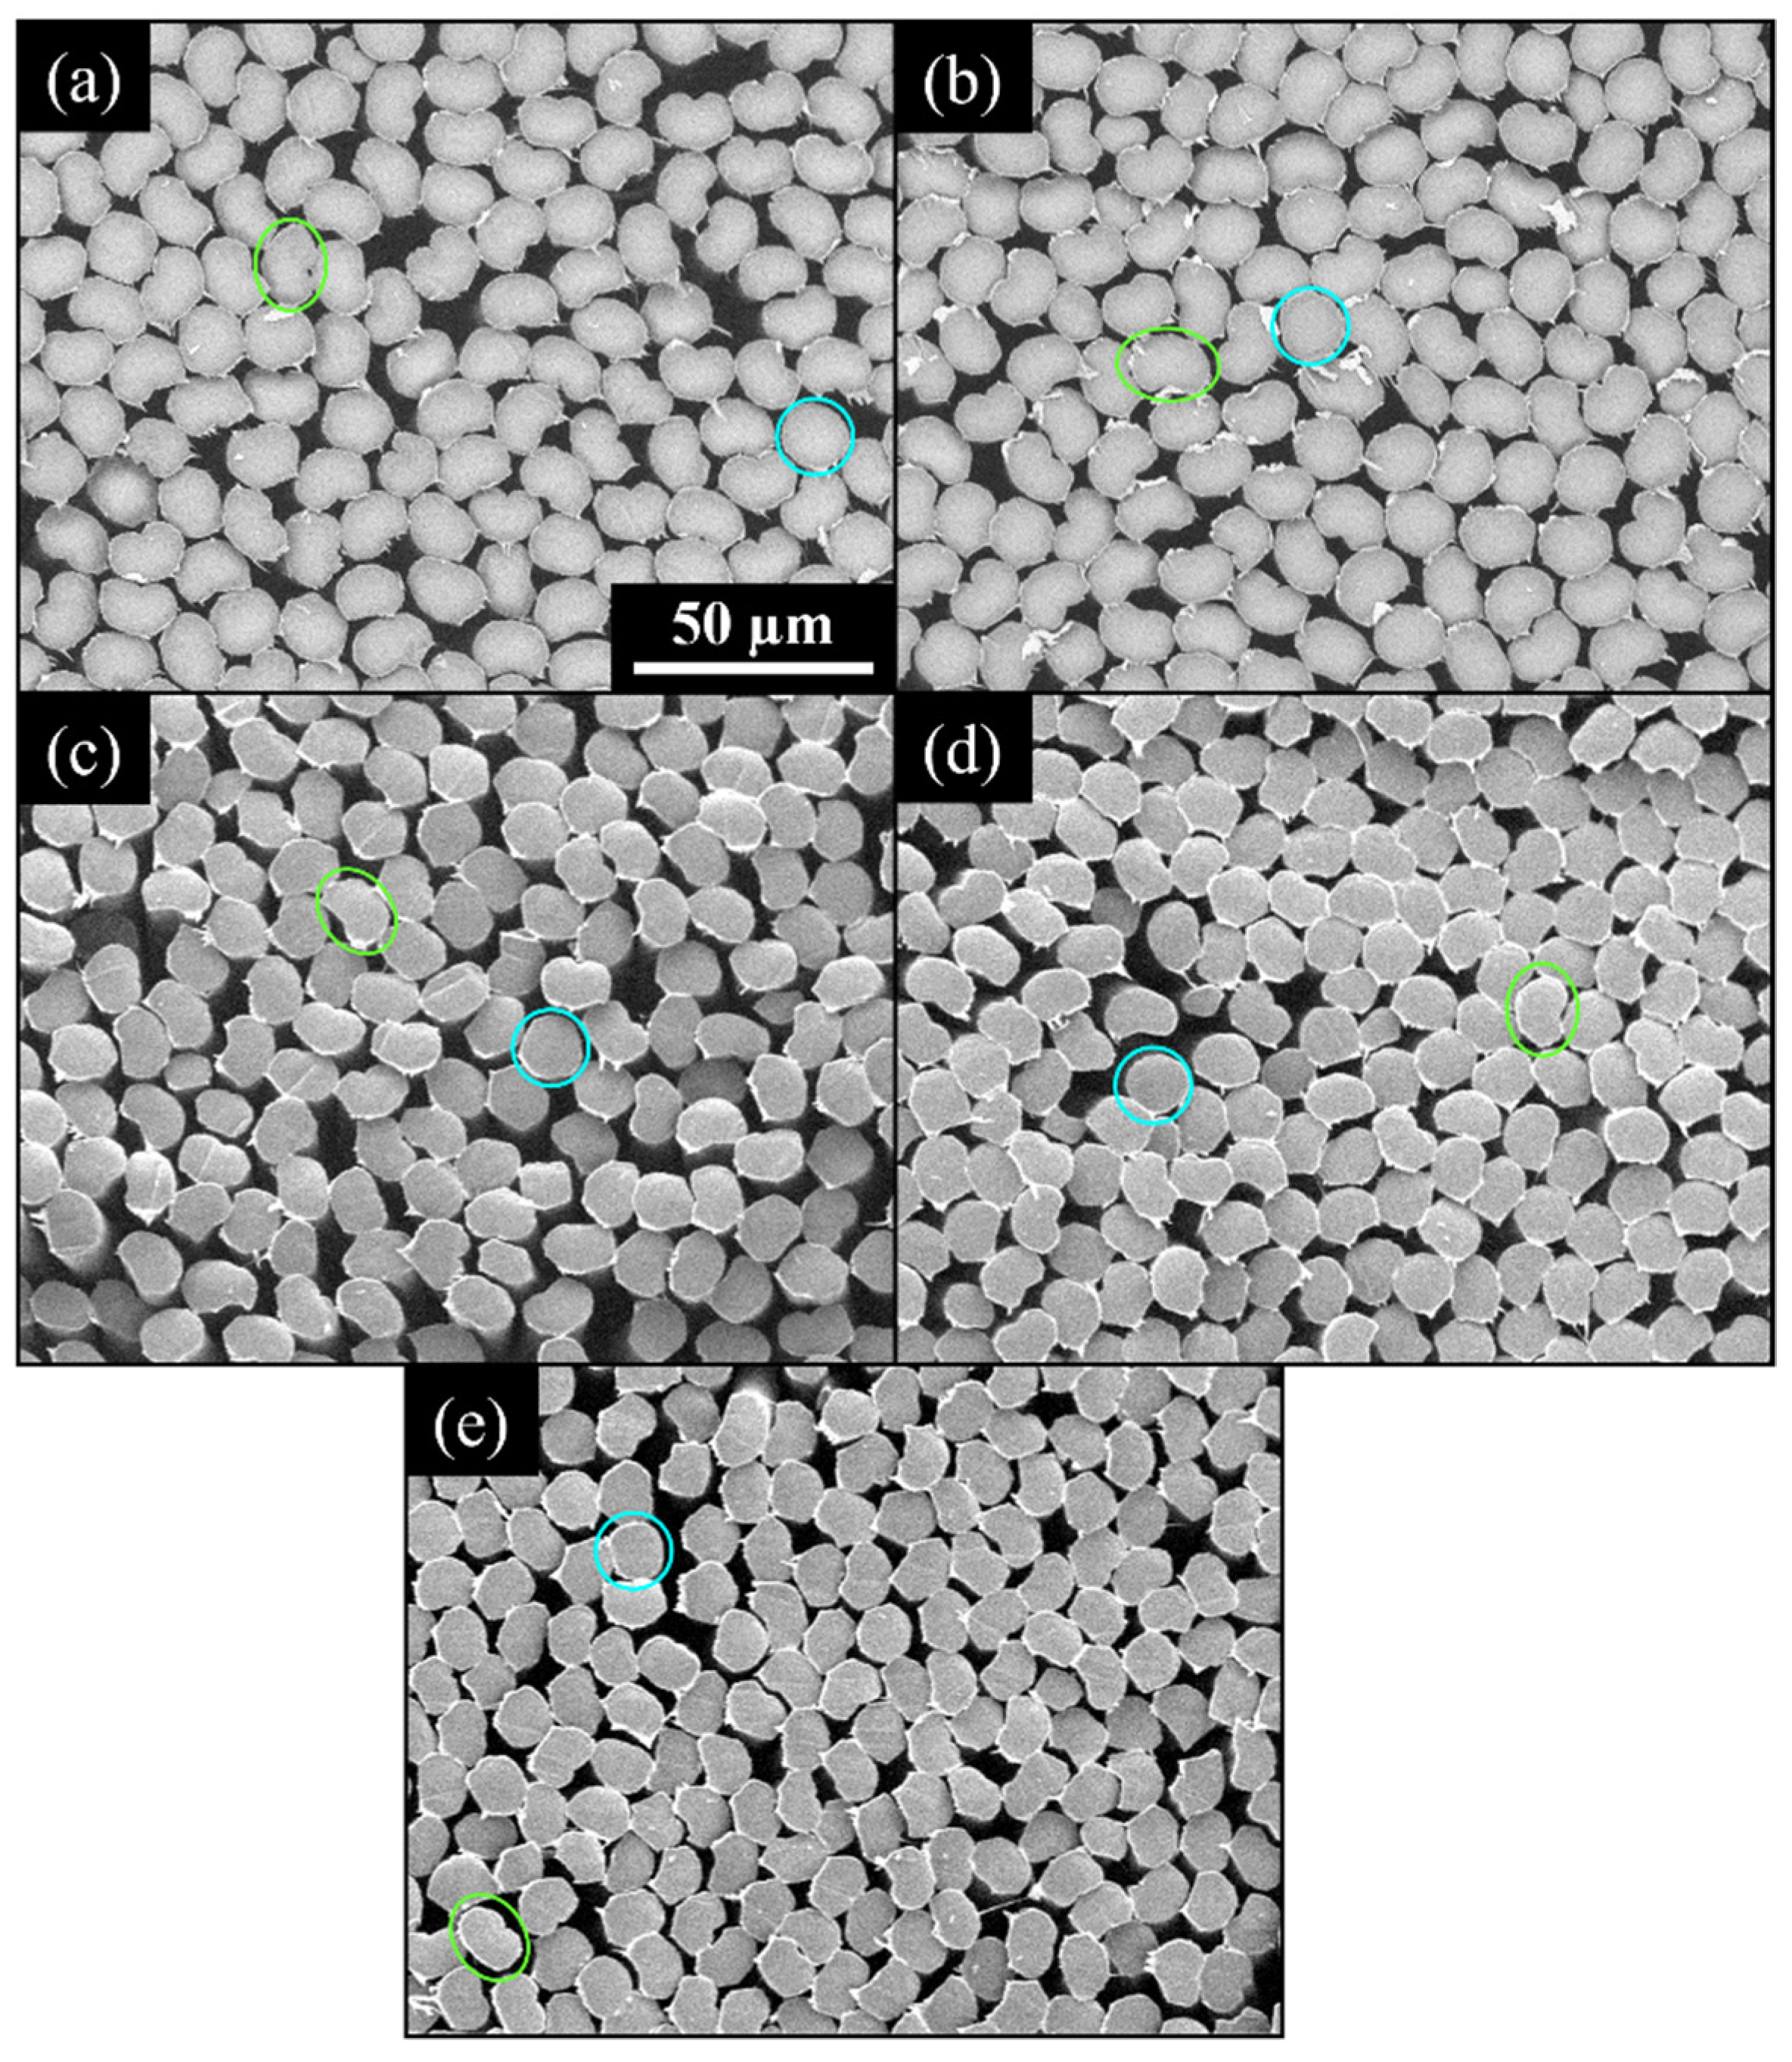
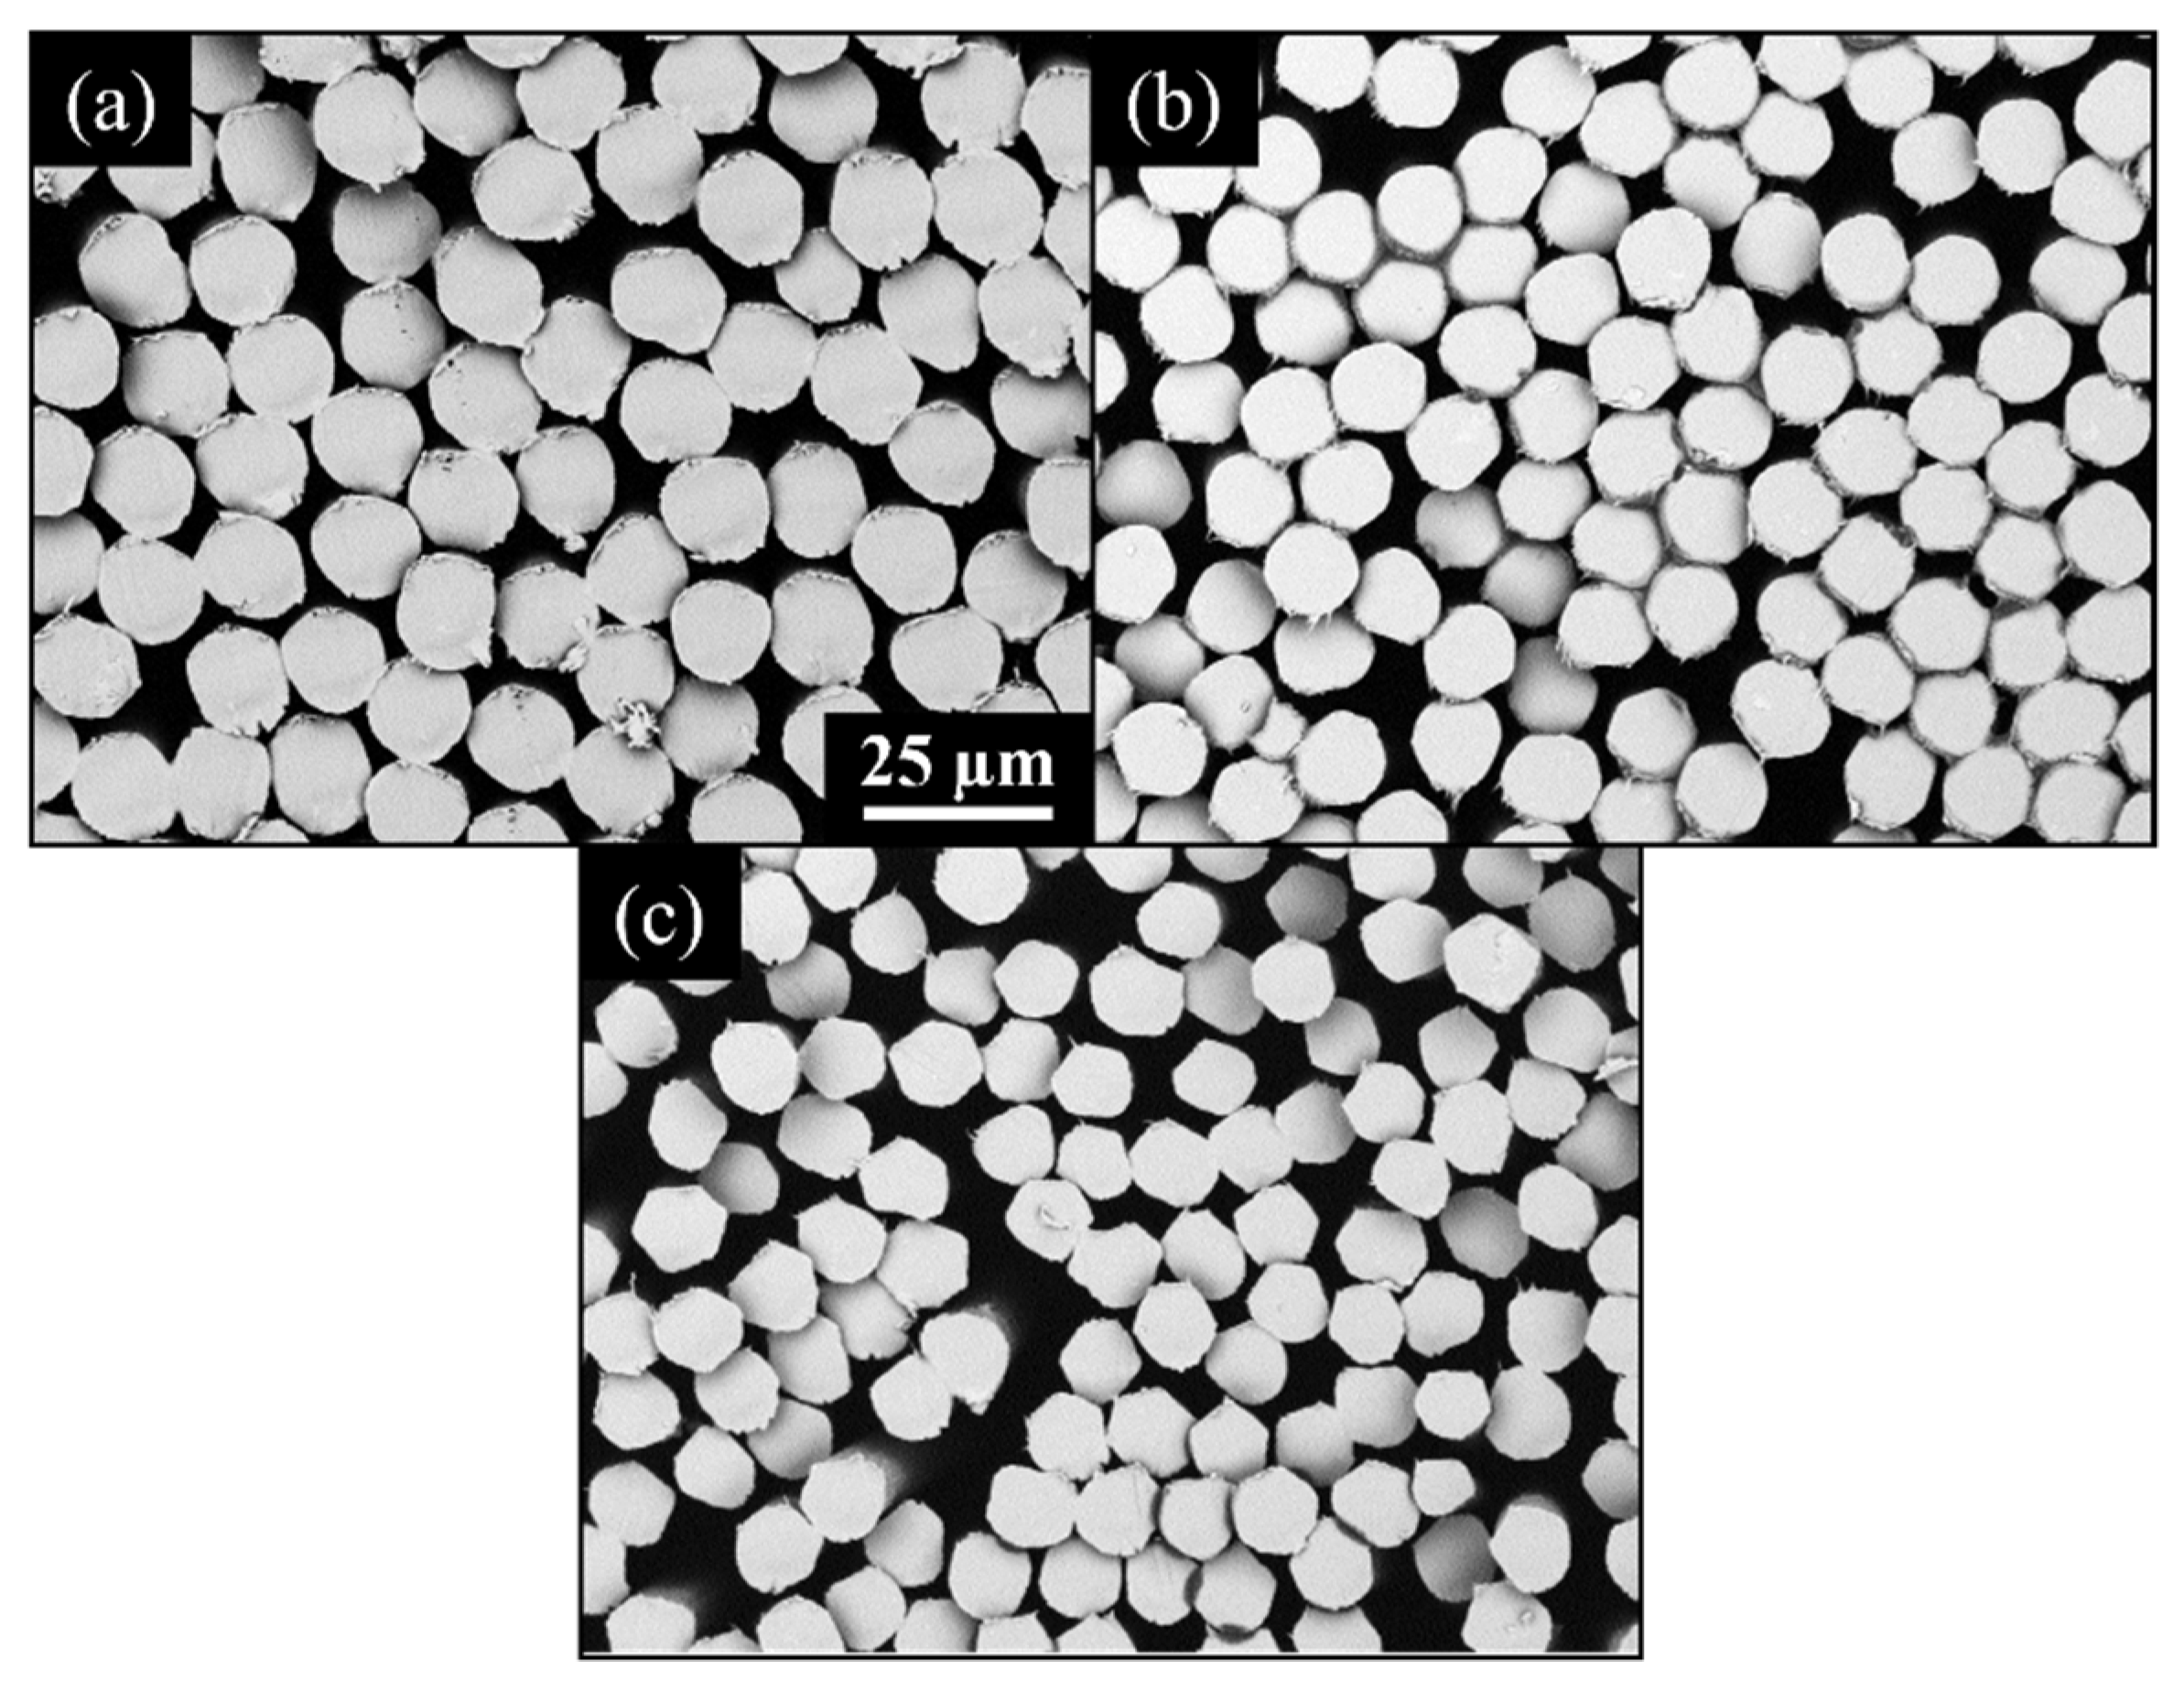
2.4. SEM
2.5. Favimat
2.6. X-ray Diffraction (XRD)
3. Results and Discussion
3.1. Subsection
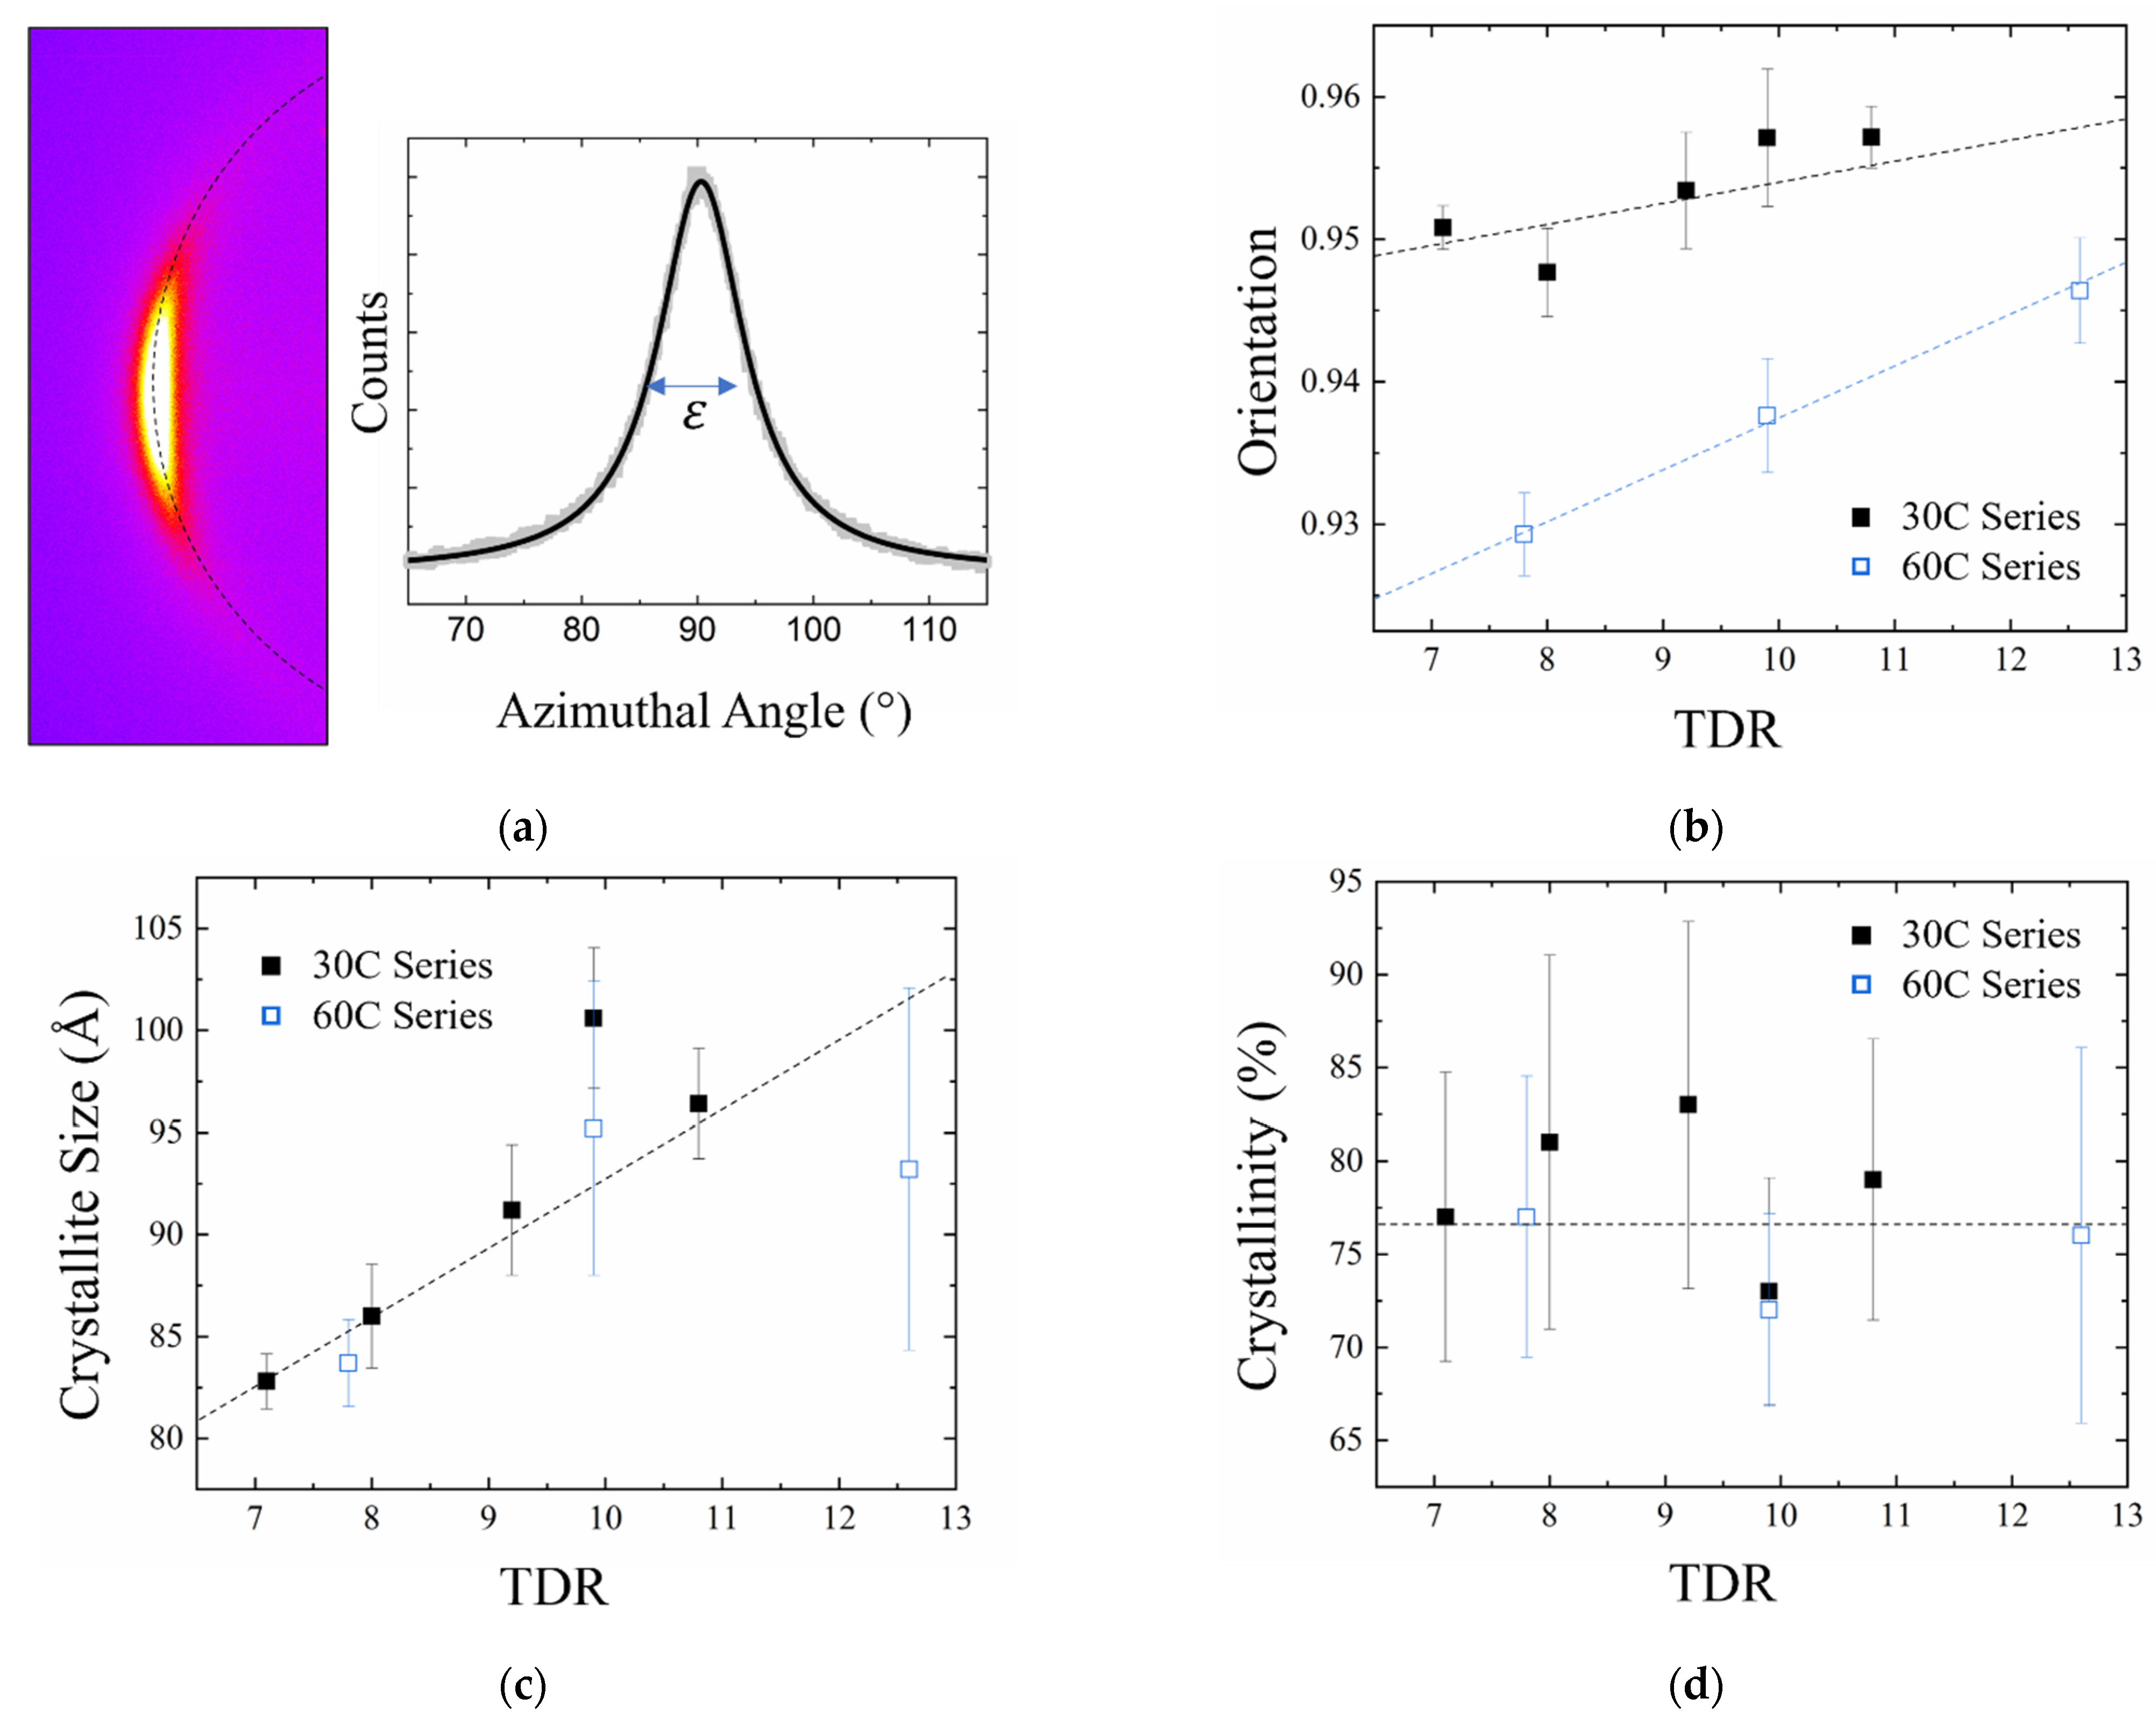
3.2. XRD
3.3. Carbonization
4. Conclusions
Author Contributions
Funding
Institutional Review Board Statement
Informed Consent Statement
Data Availability Statement
Acknowledgments
Conflicts of Interest
References
- Fitzer, E. Pan-based carbon fibers-present state and trend of the technology from the viewpoint of possibilities and limits to influence and to control the fiber properties by the process parameters. Carbon 1989, 27, 621–645. [Google Scholar] [CrossRef]
- Krenkel, W.; Berndt, F. C/C–SiC composites for space applications and advanced friction systems. Mater. Sci. Eng. A 2005, 412, 177–181. [Google Scholar] [CrossRef]
- Khayyam, H.; Fakhrhoseini, S.M.; Church, J.S.; Milani, A.S.; Bab-Hadiashar, A.; Jazar, R.N.; Naebe, M. Predictive modelling and optimization of carbon fiber mechanical properties through high temperature furnace. Appl. Therm. Eng. 2017, 125, 1539–1554. [Google Scholar] [CrossRef]
- Kumar, I.P.; Mohite, P.; Kamle, S. Axial compressive strength testing of single carbon fibres. Arch. Mech. 2013, 65, 27–43. [Google Scholar]
- Ji, X.; Wang, C.; Francis, B.A.; Chia, E.S.; Zheng, L.; Yang, J.; Joshi, S.C.; Chen, Z. Mechanical and interfacial properties characterisation of single carbon fibres for composite applications. Exp. Mech. 2015, 55, 1057–1065. [Google Scholar] [CrossRef]
- Barnet, F.R.; Norr, M.K. A three-dimensional structural model for a high modulus pan-based carbon fibre. Composites 1976, 7, 93–99. [Google Scholar] [CrossRef]
- Chari, S.S.; Bahl, O.P.; Mathur, R.B. Characterisation of acrylic fibres used for making carbon fibres. Fibre Sci. Technol. 1981, 15, 153–160. [Google Scholar] [CrossRef]
- Morris, E.A.; Weisenberger, M.C.; Rice, G.W. Properties of PAN Fibers Solution Spun into a Chilled Coagulation Bath at High Solvent Compositions. Fibers 2015, 3, 560–574. [Google Scholar] [CrossRef] [Green Version]
- Lee, J.-E.; Chae, Y.K.; Lee, D.J.; Choi, J.; Chae, H.G.; Kim, T.H.; Lee, S. Microstructural evolution of polyacrylonitrile fibers during industry-mimicking continuous stabilization. Carbon 2022, 195, 165–173. [Google Scholar] [CrossRef]
- Han, C.D.; Segal, L. A study of fiber extrusion in wet spinning. II. Effects of spinning conditions on fiber formation. J. Appl. Polym. Sci. 1970, 14, 2999–3019. [Google Scholar] [CrossRef]
- Kulichikhin, V.G.; Skvortsov, I.Y.; Mironova, M.I.; Ozerin, A.N.; Kurkin, T.S.; Berkovich, A.K.; Frenkin, E.I.; Malkin, A.Y. From Polyacrylonitrile, its Solutions, and Filaments to Carbon Fibers II. Spinning PAN-Precursors and their Thermal Treatment. Adv. Polym. Technol. 2018, 37, 1099–1113. [Google Scholar] [CrossRef]
- Sun, L.; Shang, L.; Xiao, L.; Zhang, M.; Li, M.; Ao, Y. Structural changes of polyacrylonitrile fibers in the process of wet spinning. J. Appl. Polym. Sci. 2020, 137, 48905. [Google Scholar] [CrossRef]
- Kaur, J.; Millington, K.; Smith, S. Producing high-quality precursor polymer and fibers to achieve theoretical strength in carbon fibers: A review. J. Appl. Polym. Sci. 2016, 133, 43963. [Google Scholar] [CrossRef] [Green Version]
- Ahn, H.; Yeo, S.Y.; Lee, B.-S. Designing Materials and Processes for Strong Polyacrylonitrile Precursor Fibers. Polymers 2021, 13, 2863. [Google Scholar] [CrossRef] [PubMed]
- Sen, K.; Bajaj, P.; Sreekumar, T.V. Thermal behavior of drawn acrylic fibers. J. Polym. Sci. Part B-Polym. Phys. 2003, 41, 2949–2958. [Google Scholar] [CrossRef]
- Kirsten, M.; Meinl, J.; Schonfeld, K.; Michaelis, A.; Cherif, C. Characteristics of wet-spun and thermally treated poly acrylonitrile fibers. J. Appl. Polym. Sci. 2016, 133, 9. [Google Scholar] [CrossRef]
- Gao, Q.; Jing, M.; Chen, M.; Zhao, S.; Wang, Y.; Qin, J.; Yu, M.; Wang, C. Force field in coagulation bath at low temperature induced microfibril evolution within PAN nascent fiber and precursor fiber. J. Appl. Polym. Sci. 2020, 137, 49380. [Google Scholar] [CrossRef]
- Wang, Y.X.; Wang, C.G.; Bai, Y.J.; Bo, Z. Effect of the drawing process on the wet spinning of polyacrylonitrile fibers in a system of dimethyl sulfoxide and water. J. Appl. Polym. Sci. 2007, 104, 1026–1037. [Google Scholar] [CrossRef]
- Gao, Q.; Jing, M.; Chen, M.; Zhao, S.; Wang, W.; Qin, J.; Wang, C. Microfibril alignment induced by stretching fields during the dry-jet wet spinning process: Reinforcement on polyacrylonitrile fiber mechanical properties. Polym. Test. 2020, 81, 106191. [Google Scholar] [CrossRef]
- Wang, Y.; Tong, Y.; Zhang, B.; Su, H.; Xu, L. Formation of Surface Morphology in Polyacrylonitrile (PAN) Fibers during Wet-Spinning. J. Eng. Fibers Fabr. 2018, 13, 52–57. [Google Scholar] [CrossRef] [Green Version]
- Ouyang, Q.; Chen, Y.; Wang, X.; Ma, H.; Li, D.; Yang, J. Supramolecular structure of highly oriented wet-spun polyacrylonitrile fibers used in the preparation of high-performance carbon fibers. J. Polym. Res. 2015, 22, 229. [Google Scholar] [CrossRef]
- Gao, Q.; Jing, M.; Wang, C.; Zhao, S.; Chen, M.; Qin, J. Preparation of high-quality polyacrylonitrile precursors for carbon fibers through a high drawing ratio in the coagulation bath during a dry-jet wet spinning process. J. Macromol. Sci. Part B 2019, 58, 128–140. [Google Scholar] [CrossRef]
- Oya, N.; Johnson, D.J. Longitudinal compressive behaviour and microstructure of PAN-based carbon fibres. Carbon 2001, 39, 635–645. [Google Scholar] [CrossRef]
- Chand, S. Review carbon fibers for composites. J. Mater. Sci. 2000, 35, 1303–1313. [Google Scholar] [CrossRef]
- Li, H.; Liu, C.; Chen, J. Predicting and Characterizing Plastic Deformation Behavior of Transversely-isotropic Carbon Fiber Monofilament Using Finite Element Simulation and Nanoindentation. Fibers Polym. 2021, 22, 2316–2322. [Google Scholar] [CrossRef]
- Duan, S.; Liu, F.; Pettersson, T.; Creighton, C.; Asp, L.E. Determination of transverse and shear moduli of single carbon fibres. Carbon 2020, 158, 772–782. [Google Scholar] [CrossRef]
- Csanádi, T.; Németh, D.; Zhang, C.; Dusza, J. Nanoindentation derived elastic constants of carbon fibres and their nanostructural based predictions. Carbon 2017, 119, 314–325. [Google Scholar] [CrossRef] [Green Version]
- Tane, M.; Okuda, H.; Tanaka, F. Nanocomposite microstructures dominating anisotropic elastic modulus in carbon fibers. Acta Mater. 2019, 166, 75–84. [Google Scholar] [CrossRef]
- Shirasu, K.; Nagai, C.; Naito, K. Mechanical anisotropy of PAN-based and pitch-based carbon fibers. Mech. Eng. J. 2020, 7, 19–00599. [Google Scholar] [CrossRef] [Green Version]
- Shirasu, K.; Goto, K.; Naito, K. Microstructure-elastic property relationships in carbon fibers: A nanoindentation study. Compos. Part B Eng. 2020, 200, 108342. [Google Scholar] [CrossRef]
- Kawabata, S. Measurement of the transverse mechanical-properties of high-performance fibers. J. Text. Inst. 1990, 81, 432–447. [Google Scholar] [CrossRef]
- Fujita, K.; Sawada, Y.; Nakanishi, Y. Effect of cross-sectional textures on transverse compressive properties of pitch-based carbon fibers. J. Soc. Mater. Sci. Jpn. 2001, 50, 116–121. [Google Scholar] [CrossRef]
- Naito, K.; Tanaka, Y.; Yang, J.-M. Transverse compressive properties of polyacrylonitrile (PAN)-based and pitch-based single carbon fibers. Carbon 2017, 118, 168–183. [Google Scholar] [CrossRef]
- Guo, Z.; Chen, W.; Zheng, J. Improved quasi-static twin-fiber transverse compression of several high-performance fibers. Text. Res. J. 2019, 89, 1595–1613. [Google Scholar] [CrossRef]
- Sockalingam, S.; Bremble, R.; Gillespie, J.W., Jr.; Keefe, M. Transverse compression behavior of Kevlar KM2 single fiber. Compos. Part A Appl. Sci. Manuf. 2016, 81, 271–281. [Google Scholar] [CrossRef]
- Wong, S.; Pierlot, A.; Abbott, A.; Schutz, J. Direct Measurement of the Transverse Modulus of Carbon Fibres. Exp. Mech. 2022, 62, 769–778. [Google Scholar] [CrossRef]
- Morris, S. The Determination of the Lateral-Compression Modulus of Fibres. J. Text. Inst. 1968, 59, 536–547. [Google Scholar] [CrossRef]
- Hillbrick, L.K.; Kaiser, J.; Huson, M.G.; Naylor, G.R.S.; Wise, E.S.; Miller, A.D.; Lucas, S. Determination of the transverse modulus of cylindrical samples by compression between two parallel flat plates. SN Appl. Sci. 2019, 1, 724–738. [Google Scholar] [CrossRef] [Green Version]
- Raghavan, J.; Meshii, M. Creep rupture of polymer composites. Compos. Sci. Technol. 1997, 57, 375–388. [Google Scholar] [CrossRef]
- Struik, L.C.E. Physical Aging in Amorphous Polymers and Other Materials; Elsevier Scientific Pub. Co.: Amsterdam, The Netherlands, 1977. [Google Scholar]
- Nguyen-Tri, P.; Ghassemi, P.; Carriere, P.; Nanda, S.; Assadi, A.A.; Nguyen, D.D. Recent applications of advanced atomic force microscopy in polymer science: A review. Polymers 2020, 12, 1142. [Google Scholar] [CrossRef]
- Bohn, C.; Schaefgen, J.; Statton, W.J. Laterally ordered polymers: Polyacrylonitrile and poly (vinyl trifluoroacetate). Polym. Sci 1961, 55, 531. [Google Scholar] [CrossRef]
- Ge, Y.; Fu, Z.; Deng, Y.; Zhang, M.; Zhang, H. The effects of chemical reaction on the microstructure and mechanical properties of polyacrylonitrile (PAN) precursor fibers. J. Mater. Sci. 2019, 54, 12592–12604. [Google Scholar] [CrossRef]
- Knudsen, J.P. The influence of coagulation variables on the structure and physical properties of an acrylic fiber. Text. Res. J. 1963, 33, 13. [Google Scholar] [CrossRef]
- Khayyam, H.; Jazar, R.N.; Nunna, S.; Golkarnarenji, G.; Badii, K.; Fakhrhoseini, S.M.; Kumar, S.; Naebe, M. PAN precursor fabrication, applications and thermal stabilization process in carbon fiber production: Experimental and mathematical modelling. Prog. Mater. Sci. 2020, 107, 100575. [Google Scholar] [CrossRef]
- Gao, Q.; Jing, M.; Zhao, S.; Wang, Y.; Qin, J.; Yu, M.; Wang, C. Effect of spinning speed on microstructures and mechanical properties of polyacrylonitrile fibers and carbon fibers. Ceram. Int. 2020, 46, 23059–23066. [Google Scholar] [CrossRef]
- Bajaj, P.; Sreekumar, T.V.; Sen, K. Structure development during dry-jet-wet spinning of acrylonitrile/vinyl acids and acrylonitrile/methyl acrylate copolymers. J. Appl. Polym. Sci. 2002, 86, 773–787. [Google Scholar] [CrossRef]
- Shin, K.-A.; Park, S.; Nguyen, H.T.B.; Lee, J.H.; Lee, S.; Joh, H.-I.; Jo, S.M. Investigation into the gelation of polyacrylonitrile solution induced by dry-jet in spinning process and its effects on diffusional process in coagulation and structural properties of carbon fibers. Macromol. Res. 2018, 26, 544–551. [Google Scholar] [CrossRef]
- Moskowitz, J.D.; Jackson, M.B.; Tucker, A.; Cook, J.D. Evolution of polyacrylonitrile precursor fibers and the effect of stretch profile in wet spinning. J. Appl. Polym. Sci. 2021, 138, 50967. [Google Scholar] [CrossRef]
- Tan, L.; Liu, S.; Song, K.; Chen, H.; Pan, D. Gel-spun polyacrylonitrile fiber from pregelled spinning solution. Polym. Eng. Sci. 2010, 50, 1290–1294. [Google Scholar] [CrossRef]


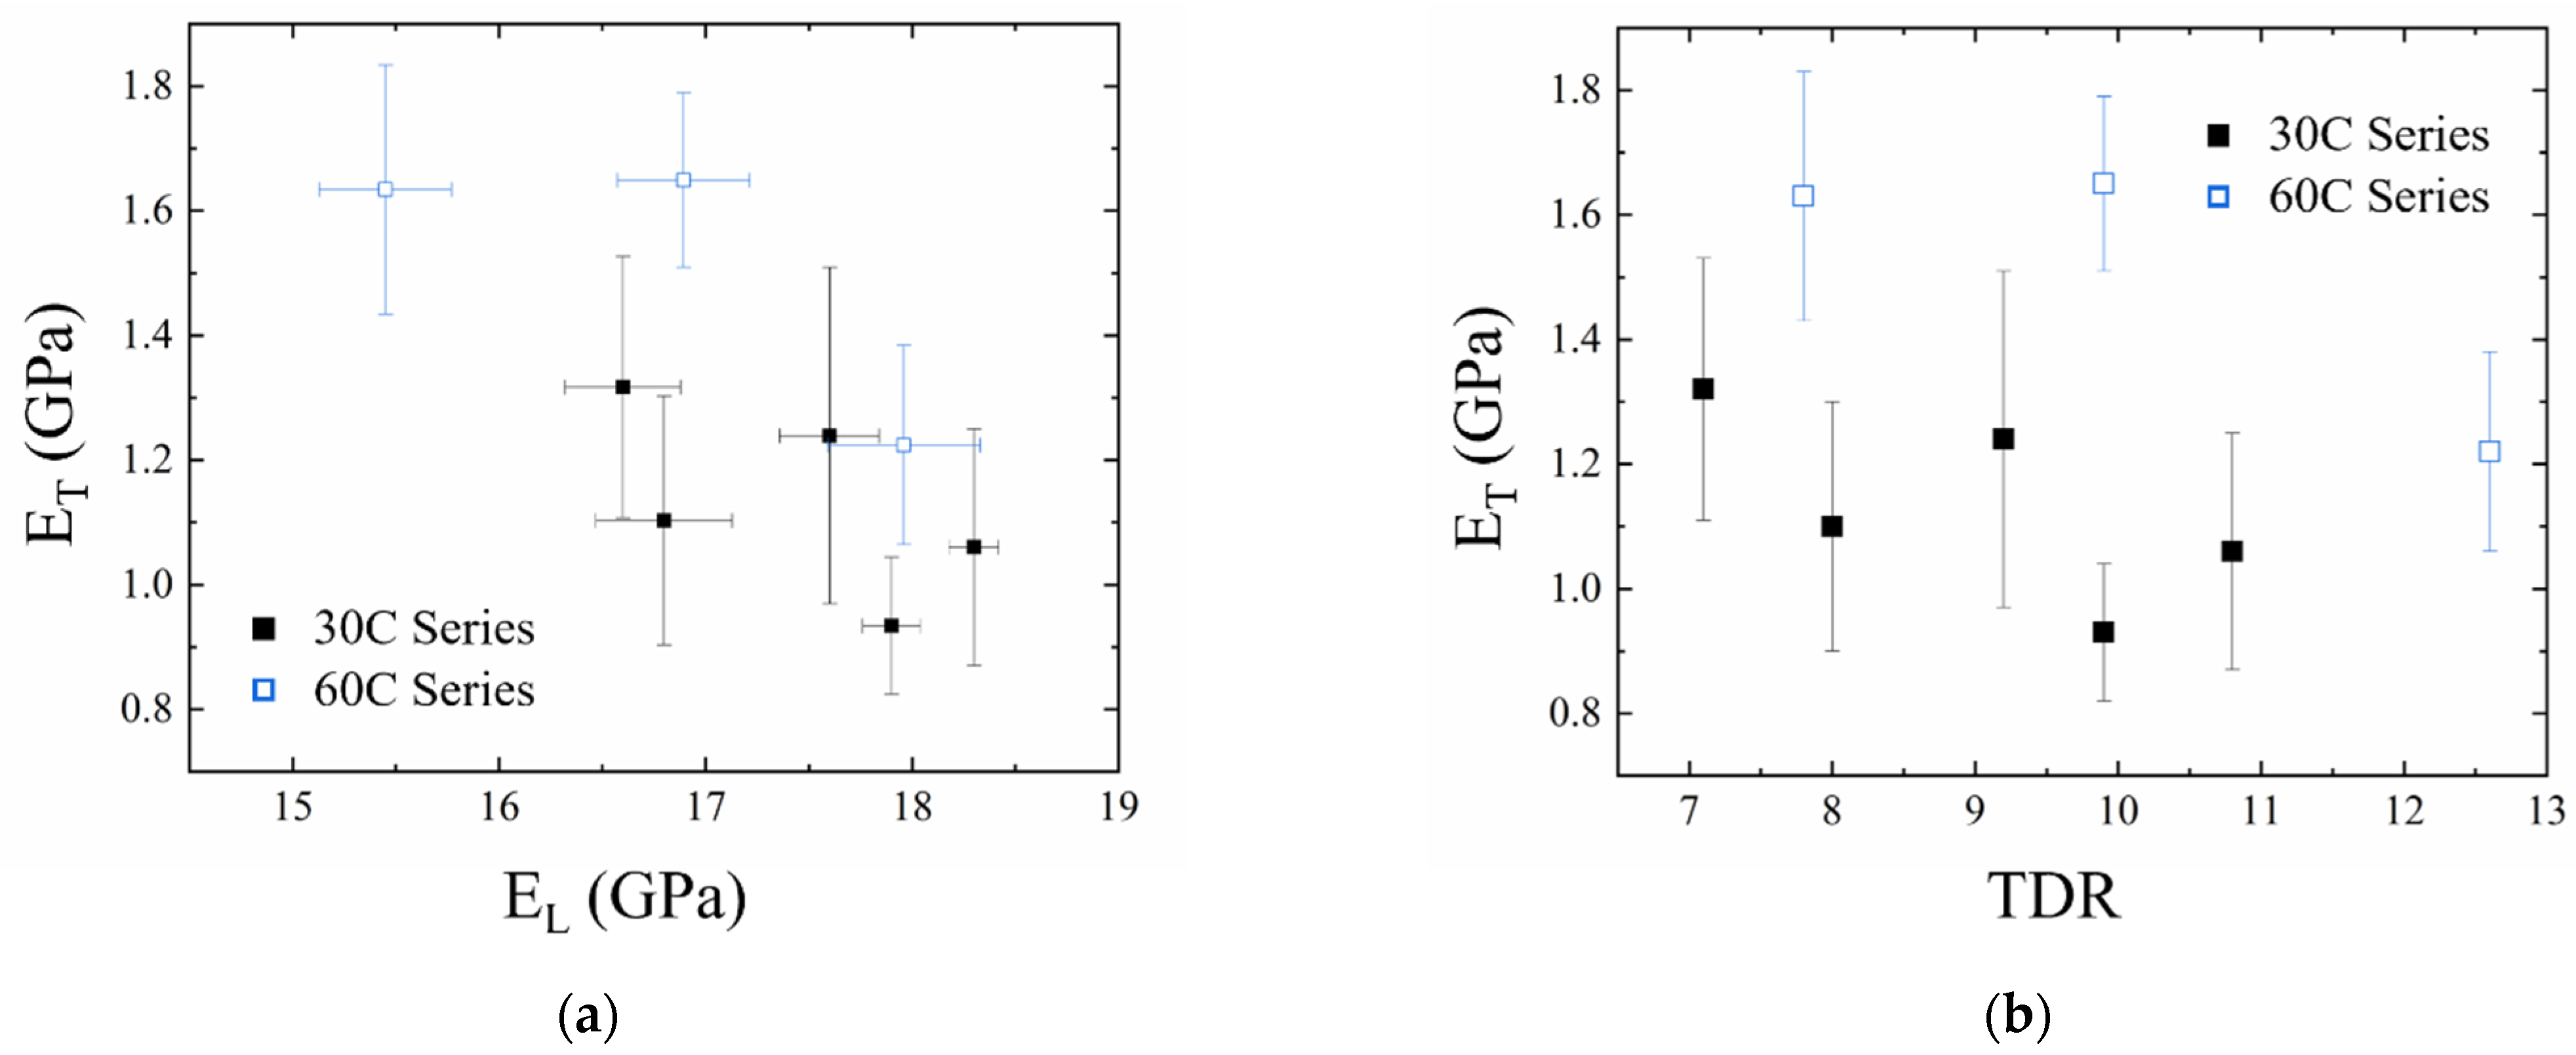
| Name | Coagulation Conditions | Jet Stretch | Wash Bath Stretch | Hot Water Stretch | Steam Stretch | TDR |
|---|---|---|---|---|---|---|
| 30C-7× | 70% DMSO @ 30 °C + 50% DMSO @ 40 °C | 0.7 | 1.25 | 2.50 | 3.29 | 7.2 |
| 30C-8× | 70% DMSO @ 30 °C + 50% DMSO @ 40 °C | 0.7 | 1.25 | 2.50 | 3.66 | 8.0 |
| 30C-9× | 70% DMSO @ 30 °C + 50% DMSO @ 40 °C | 0.7 | 1.25 | 2.50 | 4.20 | 9.2 |
| 30C-10× | 70% DMSO @ 30 °C + 50% DMSO @ 40 °C | 0.7 | 1.25 | 2.50 | 4.57 | 10.0 |
| 30C-11× | 70% DMSO @ 30 °C + 50% DMSO @ 40 °C | 0.7 | 1.25 | 2.50 | 4.94 | 10.8 |
| 60C-8× | 65% DMSO @ 60 °C | 0.7 | 1.62 | 2.50 | 2.76 | 7.8 |
| 60C-10× | 65% DMSO @ 60 °C | 0.7 | 1.62 | 2.50 | 3.51 | 10.0 |
| 60C-13× | 65% DMSO @ 60 °C | 0.7 | 1.62 | 2.50 | 4.44 | 12.6 |
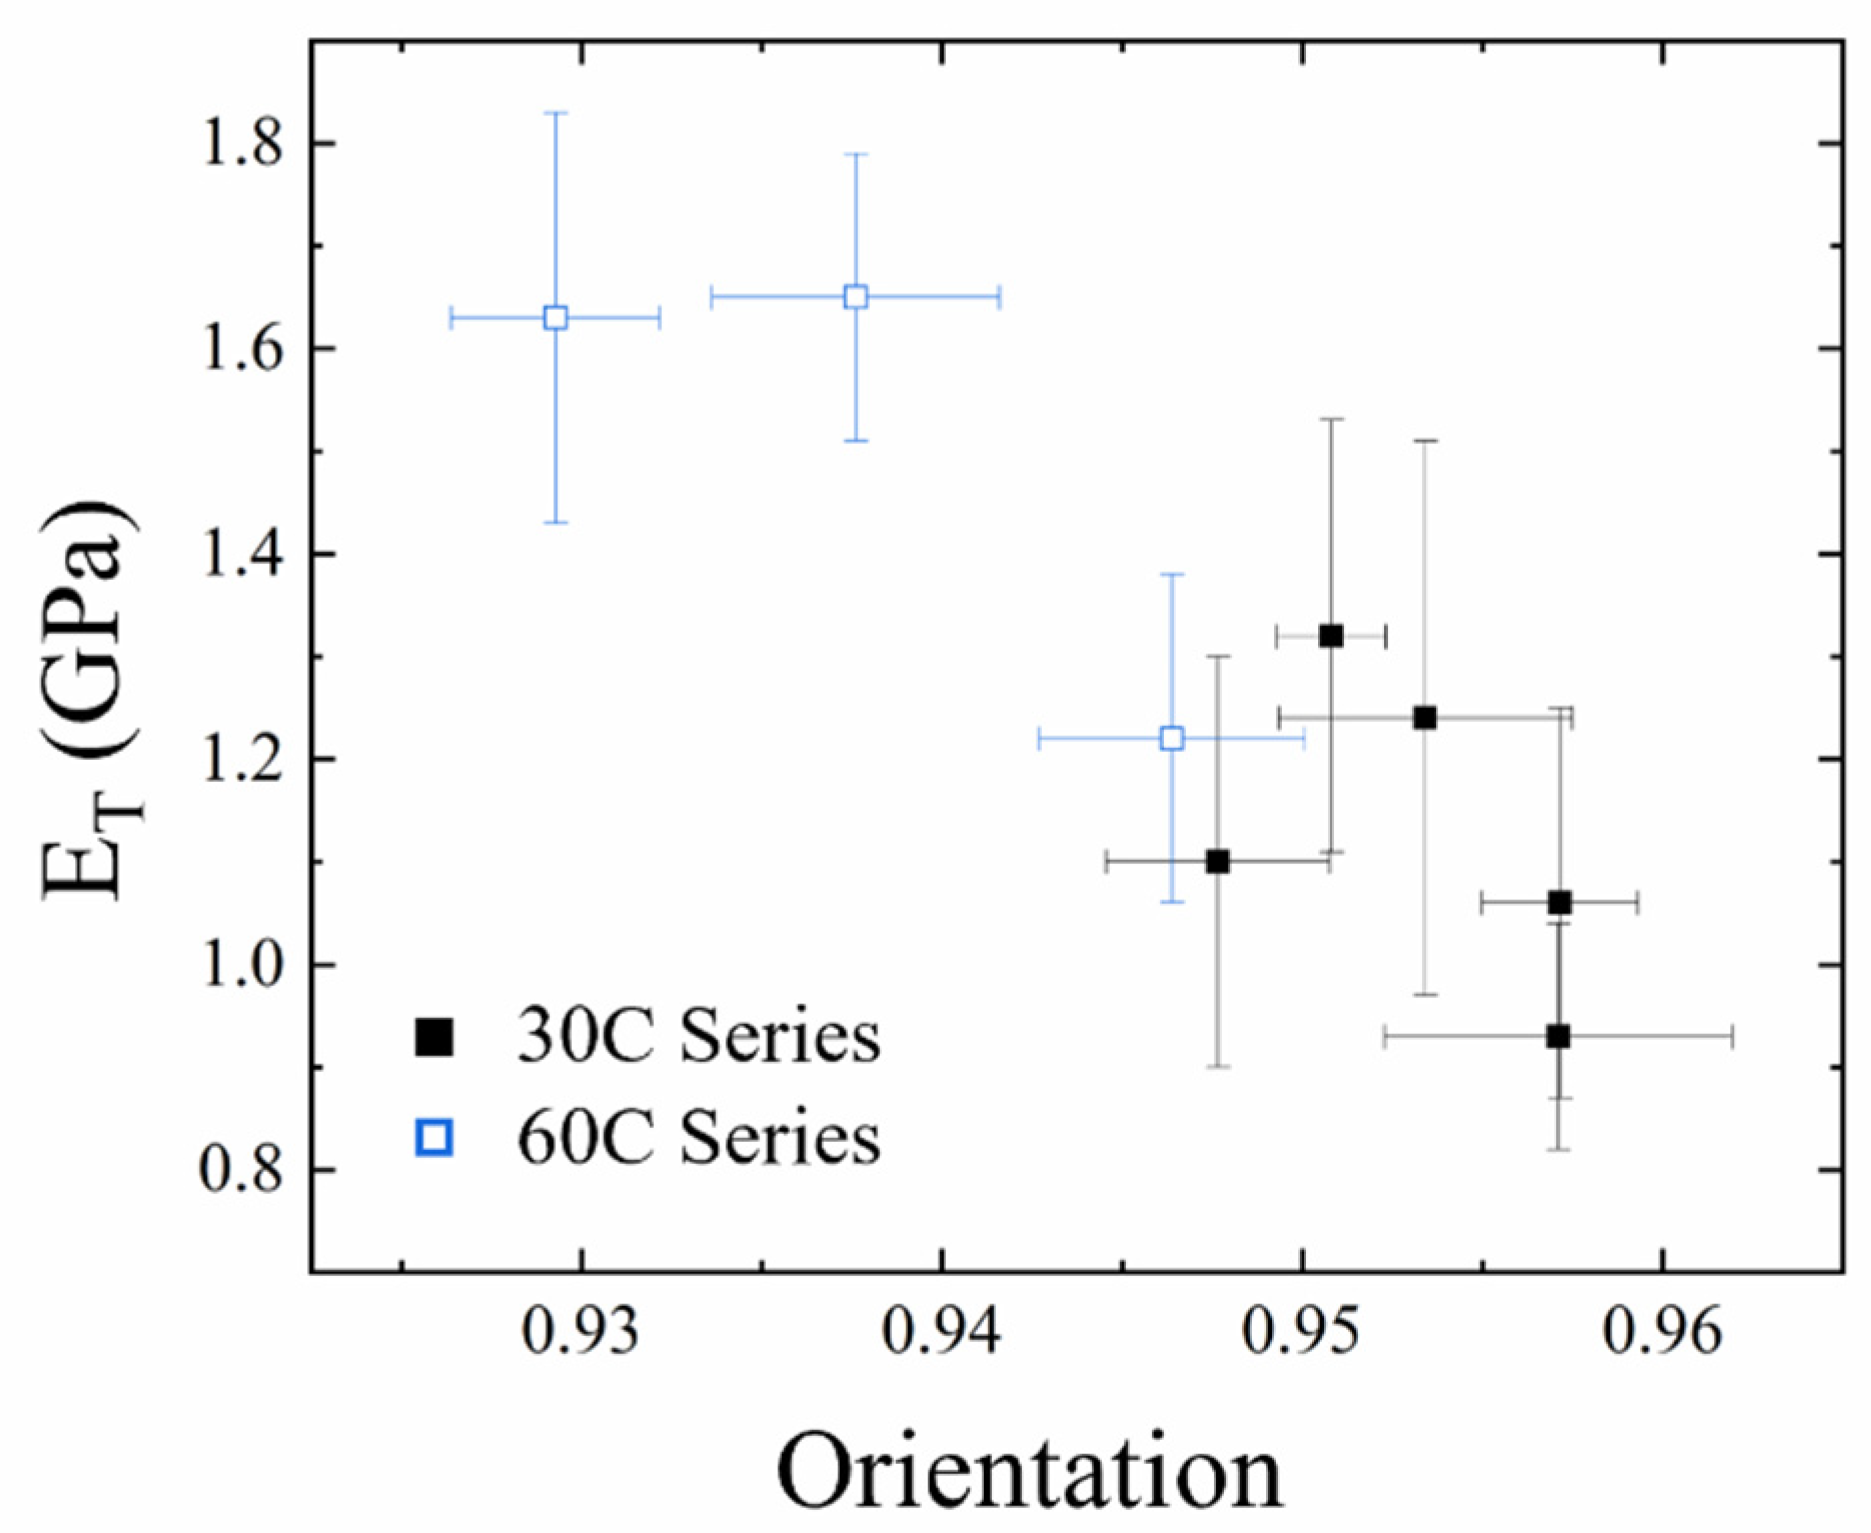
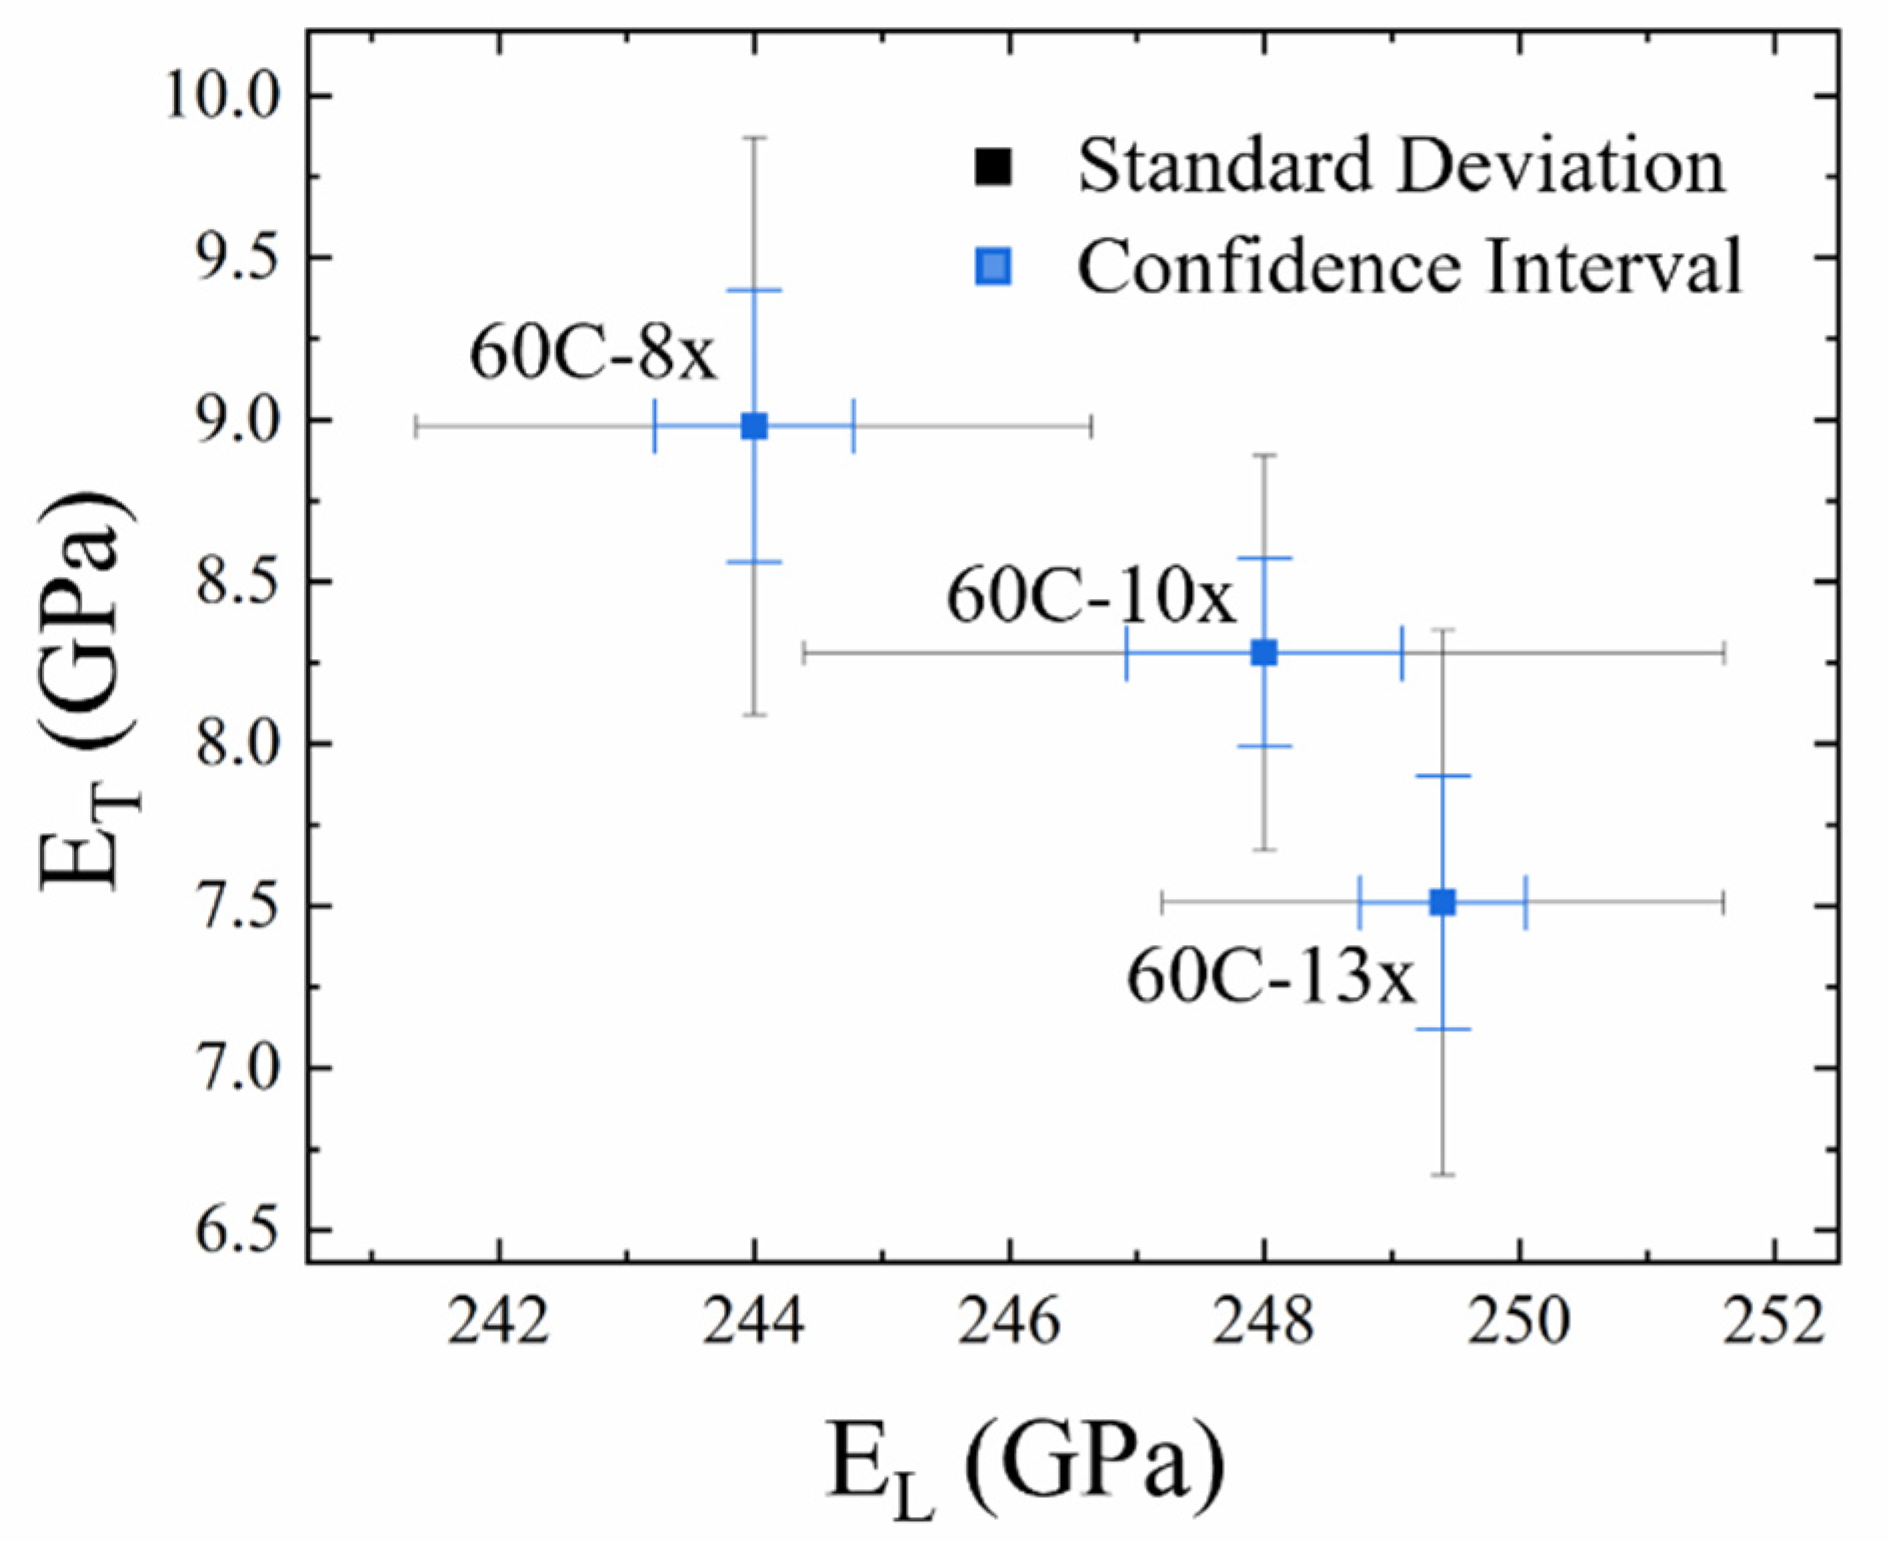
| Name | EL (GPa) | Con. Int. 95% | Breaking Stress (GPa) | ET (GPa) | Con. Int. 95% | Density (g/cm3) |
|---|---|---|---|---|---|---|
| 30C-7× | 16.6 (0.28) | 0.12 {25} | 0.89 (0.05) | 1.32 (0.21) | 0.08 {32} | 0.67 (0.09) |
| 30C-8× | 16.8 (0.33) | 0.14 {23} | 0.90 (0.08) | 1.10 (0.20) | 0.07 {34} | 1.18 (0.08) |
| 30C-9× | 17.6 (0.24) | 0.10 {25} | 1.00 (0.06) | 1.24 (0.27) | 0.07 {62} | 1.18 (0.06) |
| 30C-10× | 17.9 (0.34) | 0.14 {24} | 1.07 (0.06) | 0.93 (0.11) | 0.08 {10} | 1.18 (0.11) |
| 30C-11× | 18.3 (0.29) | 0.12 {25} | 1.09 (0.07) | 1.06 (0.19) | 0.08 {24} | 1.18 (0.10) |
| 60C-8× | 15.5 (0.32) | 0.13 {25} | 0.79 (0.05) | 1.63 (0.20) | 0.09 {20} | 1.18 (0.06) |
| 60C-10× | 16.9 (0.32) | 0.13 {25} | 0.81 (0.06) | 1.65 (0.14) | 0.06 {20} | 1.18 (0.08) |
| 60C-13× | 18.0 (0.37) | 0.15 {25} | 0.94 (0.09) | 1.22 (0.16) | 0.07 {20} | 1.18 (0.07) |
| Name | Orientation | Crystallinity (%) | Crystallite Size (Å) |
|---|---|---|---|
| 30C-7× | 0.955 (0.004) | 77 ± 8 | 83 ± 1 |
| 30C-8× | 0.952 (0.005) | 81 ± 10 | 86 ± 3 |
| 30C-9× | 0.949 (0.004) | 83 ± 10 | 91 ± 10 |
| 30C-10× | 0.962 (0.004) | 73 ± 6 | 101 ± 4 |
| 30C-11× | 0.960 (0.004) | 79 ± 8 | 96 ± 8 |
| 60C-8× | 0.929 (0.005) | 77 ± 8 | 84 ± 2 |
| 60C-10× | 0.938 (0.004) | 72 ± 5 | 95 ± 7 |
| 60C-13× | 0.946 (0.004) | 76 ± 10 | 92 ± 13 |
Publisher’s Note: MDPI stays neutral with regard to jurisdictional claims in published maps and institutional affiliations. |
© 2022 by the authors. Licensee MDPI, Basel, Switzerland. This article is an open access article distributed under the terms and conditions of the Creative Commons Attribution (CC BY) license (https://creativecommons.org/licenses/by/4.0/).
Share and Cite
Wong, S.; Hillbrick, L.K.; Kaur, J.; Seeber, A.J.; Schutz, J.A.; Pierlot, A.P. Improving Transverse Compressive Modulus of Carbon Fibers during Wet Spinning of Polyacrylonitrile. Fibers 2022, 10, 54. https://doi.org/10.3390/fib10060054
Wong S, Hillbrick LK, Kaur J, Seeber AJ, Schutz JA, Pierlot AP. Improving Transverse Compressive Modulus of Carbon Fibers during Wet Spinning of Polyacrylonitrile. Fibers. 2022; 10(6):54. https://doi.org/10.3390/fib10060054
Chicago/Turabian StyleWong, Sherman, Linda K. Hillbrick, Jasjeet Kaur, Aaron J. Seeber, Jurg A. Schutz, and Anthony P. Pierlot. 2022. "Improving Transverse Compressive Modulus of Carbon Fibers during Wet Spinning of Polyacrylonitrile" Fibers 10, no. 6: 54. https://doi.org/10.3390/fib10060054