Article

Reducing Global Warming Potential Impact of Bio-Based Composites Based of LCA

1
Institute of Design Technologies, Faculty of Materials Science and Applied Chemistry, Riga Technical University, LV-1048 Riga, Latvia
2
Institute of Materials and Structures, Riga Technical University, LV-1048 Riga, Latvia
*
Author to whom correspondence should be addressed.
Fibers 2022, 10(9), 79; https://doi.org/10.3390/fib10090079
Submission received: 3 August 2022 / Revised: 25 August 2022 / Accepted: 31 August 2022 / Published: 14 September 2022
(This article belongs to the Special Issue Natural Fiber Competitiveness and Sustainability)

Abstract

:
The view towards a sustainable bioeconomy is increasing the interest of using renewable natural resources in the production of composites. Until now, the production of sustainable composites has been mainly examined from the point of view of material composition and structure, by replacing petroleum-based components with those that are obtained from renewable resources known as natural fiber composites (NFCs). The usefulness of newly acquired materials is mostly evaluated considering their performance and economic costs, whereas the aspect of environmental protection is underestimated. The impact of composites that are made from renewable resources is examined within the two parts of this study—the first part compares different nitrogen (N) fertilization scenarios for plant origin (hemp and flax) fibers. When compared, hemp crops show higher CO2 accumulation, (−1.57 kg CO2 eq) than flax (−1.27 kg CO2 eq). In addition, the environmental impact of both fiber types is compared to polyamide composites, one of the traditionally used materials in the automotive industry in the second part of this study. According to the conducted life cycle assessment, Flax/PLA emits 1.19 kg CO2 eq per 1 kg composite, Hemp/PLA 1.7 kg CO2 eq per 1 kg composite, and PA66/GF 9.14 kg CO2 eq per 1 kg composite. After the comparison, it was concluded that bio-based composites are able to ensure lower CO2 emissions, because CO2 is accumulated and stored in the fibers, however the traditionally used composites are able to provide a lower impact in other environmental categories.

1. Introduction

Climate change is one of the biggest threats to the environment (weather contrasts with extremely low or high air temperatures, increased windiness, increased flooding in coastal areas, etc.); social environment (equal access to food and fresh water); and annual economic losses and changes must be made to mitigate the above impacts. To reduce the impact of climate change, the European Union has set a goal to reduce greenhouse gas emissions by 40% by 2030 [1]. Promoting the use of renewable energy and reducing non-renewable resources is an important means to achieve this goal.
Traditionally, composites for the automotive industry are obtained from petroleum-based polymers (the most widespread being polyethylene, polypropylene, also polyamide [2,3,4,5])—due to the availability of raw materials, economic viability, and constant and predictable characteristics. EP Directive 2009/28/EC [6] determines the use of energy that is obtained from renewable resources. Additionally—the demand for fuel consumption reduction promotes the use of light materials in the automotive industry [7]. The use of lightweight materials in both the exterior and interior parts of the vehicle is considered a priority as it improves the overall energy efficiency of the vehicle by reducing the vehicle mass. Due to their characteristics (lightness of the material, sound insulation), composites that are made from non-woven materials of natural origin fibers are becoming a widespread interior decoration material [8].
The carbon footprint of hemp fibers (364–406 kg CO2 ekv t of hemp) and flax fibers (349 kg CO2 ekv t of flax fibers) [9] is significantly less than their equivalents, for example, glass fiber (1.8–4.6 t CO2 ekv t of glass fibers) [10]. Due to the reduced carbon footprint, the use of hemp and flax fibers in composites contributes to greenhouse gas emission reduction and also allows the production of a product with a lighter weight.
The amount of polymers that are traditionally used in automotive composites can be reduced by adding fibers of lignocellulosic origin (e.g., hemp, flax, jute, and others [11]). A recycled polymer such as recycled polypropylene or a biodegradable polymer such as polylactide [12] can be used in the polymer matrix. The study compares the life cycle of two different composites that were obtained by the same proportion of plant fibers (40% by mass) and technology. The ratio of natural fibers and polymer fibers in non-woven materials is based on previous research [13,14,15] in the development of plant fiber and polymer composites. One biopolymer of biological origin is used for the matrix of both composites—polylactide (PLA); whereas for the reinforcement—hemp fibers (Hemp/PLA) in one variant and flax fibers (Flax/PLA) in the other. Within the framework of this study, the impact of composites that are made from renewable resources is examined by comparing different nitrogen (N) fertilization scenarios in the extraction process of plant-origin (hemp and flax) fibers. Variations of fertilization scenarios are reviewed, because nitrogen application has been shown to increase plant biomass [16] and the agricultural sector is responsible for 10.55% [1] of the total GHG emissions in the EU. The measures promoting the efficient use of fertilizers (precise use of mineral fertilizers, planning, and direct incorporation of organic fertilizers in the soil) are recognized as the most effective measures [17] of 17 GHG reduction measures in the territory of Latvia. The development and implementation of a precise fertilization plan and the purchase of appropriate equipment have the potential to reduce CO2 emissions by 50% [18]. The energy sector accounted for 77.01% of greenhouse gas emissions in 2019, about a third of which was created by the transport sector [17].
This study is a comparative LCA with the aim of examining the production process of bio-based composites, in order to compare their environmental impact with analogue, traditionally used materials with a similar function. Specifically, the aim of this study was to evaluate a hemp and PLA fiber blend composite that was obtained from a hemp and PLA fiber blend non-woven material and compare it with two other composites. One of the comparable composites is a composite containing flax and PLA fiber that is made by using the same technology. The other comparable material is a composite (used as luggage compartment tray of passenger car) that is available on the market, which contains polyamide 66 and 30 mas. % glass fibers (PA66/GF).
LCA publications have mainly investigated the environmental impacts of extraction processes and alternatives to these processes separately. The environmental impacts of composite manufacturing have also been studied separately. This study examines the environmental impacts of both the extraction of plant fibers and the manufacture of the composite together. By using this study, the potential manufacturers of natural origin fiber composite can evaluate environmental impacts of hemp/PLA and flax/PLA composites, and determine which impacts need to be mitigated and find ways for mitigating these impacts. Fiber growers and processors can evaluate how the particular process affects the overall characteristics of the composite and identify which of the production processes can be technologically changed or improved. Also, designers may choose the most suitable composites in the implementation of sustainable design solutions.

2. Methods

2.1. Goal and Scope Definition

A life cycle assessment (LCA) methodology was used for the purpose of this study, which is a standard procedure for assessing the environmental impact of the presented product systems [19]. The study was carried out in accordance with standards ISO 14040 and 14044:2006 [20]. The LCA calculation model of this study on input and output systems was created using SimaPro 8.5.2 LCA software, which is combined with the Ecoinvent v3 database that provides process data that are required for complete calculation. The data that were missing from the database were combined with previous studies by other researchers and from interviews with growers and were entered manually. The overall impact on the environment was evaluated by using the CML-IA-baseline method [21]. This method determines the potential harm on the environment from air, liquid, and solid emissions, by using appropriate equivalence factors for the selected compounds for several impact categories: global warming potential (GWP), acidification potential, eutrophication potential, tropospheric ozone and photochemical smog formation potential, stratospheric ozone depletion potential, and ecotoxicity potential. The global warming potential for the period of 100 years has been assessed by using the IPCC 2013 GWP 100a method [22].

2.2. Functional Unit

The study examines two functional units. In both cases the functional unit is a 1000 × 500 mm large composite, the area of which is similar to an average luggage compartment shelf panel of a vehicle, with thickness as the variable unit. In the first case of the functional value, the thickness of the material (Table S1), depends on the ultimate tensile stress of comparable composites of 18.24 MPa. The particular ultimate stress was chosen, because such ultimate tensile strength was established upon the examination of a Citröen C5 (2007) rear parcel tray on the market after cleaning the decorative finishing layer from the constructive layer. The composite on the market is manufactured from PA66 and 30 mas. % glass fiber, and in both functional value cases, this composite is used for comparison with hemp/PLA and flax/PLA composites. Data on tensile stress values of hemp/PLA and flax/PLA composites were based on previous studies [23,24].
In the second functional value case, the assumed material thickness is 4.5 mm (Table S2), which is similar to the thickness of an examined luggage compartment panel without the decorative finishing layer.

2.3. System Boundaries and Quality of Data

For the comparison of the LCA calculation of hemp/PLA and flax/PLA composite, an intermediate life cycle approach “cradle to gate” is applied (i.e., from raw material production (“cradle”) until the output of the final product from the factory (“gate”) Figure 1). The following production processes are included in the scope of this research: cultivation of fiber hemp (in the case of material containing hemp fiber) and flax fiber cultivation (in the case of material containing flax fiber), fiber processing, production of non-woven material, and composite production. The use and end stages have not been analyzed in the study.

2.4. Inventory Analysis

2.4.1. Data Assumptions and Description of the Inventory Data for Each Stage

Extraction of Hemp and Flax Fibers from Cultivation

The following data are given for the cultivation of hemp and flax fibers for production from the moment of sowing to fiber extraction, assuming that the production is carried out in the Zemgale region, Latvia. The data on seeds, use of pesticides, and fiber processing that is used in production calculations for both fibers were taken from the research that was carried out by Barth [25]. Inventory data in the Barth research are related to the conditions of the agricultural system in 2013/2014. In accordance with the aforementioned research, the seed rate that was used in the calculation is 50 kg for hemp and 110 kg for flax. Variations of fiber plant N fertilization for flax and the expected yield was calculated taking into account the Fertilization Standards for Field Crops drawn up by Kārkliņš [26]. Unlike for fiber flax, there are no individual recommended N fertilization norms for crops that are developed for fiber hemp (as well as for other hemp types) in accordance with Cabinet of Ministers (MK) Regulation No. 834, adopted on 23 December 2014, “Requirements Regarding the Protection of Water, Soil and Air from Pollution Caused by Agricultural Activity”. The paragraph of the same regulations stating that the amount of nitrogen per year may not exceed 170 kg per ha of land to be used for agriculture, is also applied for hemp. In order to demonstrate the impact of various fertilization scenarios not only on expected harvest, but also on the amount of CO2 emissions, data from studies carried out in Latvia at SIA “Latgales Lauksaimniecības zinātnes centrs” under the leadership of V. Stramkalne, were used [27,28]. Other activities that were related to the soil processing, field fertilization, harvesting, and the transportation of processed fibers that are covered in the study, are calculated using data from the season of 2018/2019 in the territory of Latvia. The cultivation of hemp fibers covers scenarios that vary with N fertilization doses of 0 kg/ha, 30 kg/ha, 60 kg/ha, and 90 kg/ha per year (hereinafter these fertilization scenarios are labelled as HN0, HN30, HN60, and HN90 sequentially from the smallest dose amount to the largest one). Flax fiber cultivation covers N fertilization scenarios with the dose of 0 kg/ha, 30 kg/ha, 35 kg/ha, and 40 kg/ha (hereinafter referred to as FN0, FN20, FN30, FN35, and FN40, respectively).
Inventory data for the 2018/2019 agricultural season is based on anonymous interviews with farmers (Rugaju district, Latvia). In addition to N, hemp is also fertilized with the complex base fertilizer (NPK) 15:15:15 300 kg ha−1 [29], and once in four years the soil is limed as well (200 kg ha−1) [25]. Additional mineral fertilizer for flax is applied following the Fertilization Standards for Field Crops, according to the N dose: 35–60 kg P2O4, 80–150 kg K2O [26], and 60 kg CaCO3 per hectare [25]. The fertilizer for flax in the amount of up to 20 kg ha−1 N is incorporated in the base fertilizer, and the rest—in the additional fertilizer.
Hemp and flax are used as rotation crops after cereal crops. A sequential schematic representation of the processes of both plants is displayed in Figure 2. Land preparation begins with tillage in autumn after the previous rotation crop is harvested. The next spring, the surface of the soil is levelled and, if necessary, limed. Liming has to be done separately (once in five years for hemp [25] and each year for flax). Before sowing, the field is fertilized—in the case of hemp, with the complex mineral fertilizer as base fertilizer, and in the case of flax, with nitrogen, phosphorus, and potassium mineral fertilizer. During the hemp vegetative stage, an additional fertilizer N is used in accordance with the dose variation: 0, 30, 60, or 90 kg h−1; for flax 20 kg h−1 is used as a base fertilizer (excluding 0 N and 20 N kg h−1 scenarios), and the rest is used as an additional fertilizer during the vegetative stage. After the basic fertilization, the field is harrowed, furrowed, and sown, all in one step. Unlike hemp, flax is sprayed with pesticides and herbicides during the growth stage. After the straw harvest has matured, it is cut in furrows and left on the field to dry. The straw harvest is turned over. The matured straw harvest is pressed in bales and transported to the fiber processing site, in both directions, without exceeding a total distance of 60 km in both directions. According to the literature, the CO2 accumulation per kg harvested is assumed to be 1.63 kg CO2 for hemp [30] and 1.49 kg CO2 for flax [31]. All tractor machinery that is involved in the aforementioned agricultural processes is divided into two groups: A—tractors, B—other agricultural machinery.
Emissions that are related to the use of mineral fertilizers, which the calculation program does not take into account, are reviewed separately. Ammonia emissions from ammonium nitrate fertilizers are calculated according to ECETOC [18]. Emission factors (EF) 0.02 kg NH3-N per kg N. According to Mosier [32], it is assumed that the nitrate nitrogen loss (NO3-N) into the groundwater is approximately 40 kg/ha. In this study, the NO3-N in the groundwater was calculated in proportion with the N dose that was used in the Mosier research and obtained nitrate nitrogen losses in groundwater. The emissions of nitrogen oxides (N2O-N) were calculated in accordance with Mosier: EF of direct emissions from soil emissions is 0.0125 kg N2O-N per kg N mineral fertilizer, applied after ammonia evaporation. The EF of indirect emissions is 0.01 kg N2O-N per kg NH3-N and 0.025 kg N2O-N per kg NO3-N. The emissions of nitrogen oxides (NOx-N) were calculated according to Rossier [33] in the amount of 10% of N2O-N emissions.
The run-off from PO4-P to surface waters is calculated according to Rossier [33], assuming an EF of 0.01 kg PO4-P per 1 kg P for applied fertilizers. The emissions from Cd, Cu, Ni, and Pb to the soil are calculated in accordance with the balance method, taking into account the input from fertilization and output through harvested products. The amount of heavy metals in mineral fertilizers is based on Rossier [33]. The reference for heavy metal uptake is based on data for a 6800 kg/ha wheat crop containing 0.12 mg/kg Cd, 5.9 mg/kg Cu, 0.22 mg/kg Ni, and 0.2 mg/kg of Pb [33].

Processing of Hemp and Flax Fibers

The processing of hemp and flax fibers begins after cutting the straws and their drying and tilling on the field. The dry yield of straws is pressed in rolls and loaded in the truck with a frontal loader tractor, to transport the yield for 30 km (round trip 60 km) to the fiber processing site.
The same technology is used in the processing of hemp and flax straws. The straws are processed on an automated processing line. The material is loaded in the slide table followed by roll opener. It is then followed by the scutcher, which processes straws by breaking them in order to separate shives from the fibers—the shives are separated from the fibers with pedal vibrators. Then, the fibers are transferred to the opening line. Dust extraction is carried out during the whole process [34].
In normal operation mode, the capacity of such a processing line is 1 t/h. The nominal capacity for the whole line is approximately 150 kW (baler opener 3 kW, vibrators 30 kW, the scutcher 105 kW, dust discharging, and fiber transportation 12 kW). The normal operating capacity is estimated at 75% of the nominal value, thus the electricity consumption per one ton of straws is estimated as approximately 112kWh [34]. Electricity is supplied from a public distribution network.

Production and Transportation of PLA Fibers

PLA is a synthetic biopolymer that is derived from naturally occurring sugars with a melting temperature of at least 135 °C [35]. PLA is compostable, biocompatible, and is processed with standard production equipment [36,37]. The data on PLA granule production and PLA fiber extrusion were taken from the Ecoinvent database. The total transportation of PLA fibers from the polymer production site to the composite production site includes three transportation stages: 436 km by cargo transport from the PLA production plant in High Point, USA to the port; 4209 nm by cargo ship from the port of Charleston, SC, USA to the port of Zeebrugge, Belgium; and 1979.5 km by cargo transport from the port of Zeebrugge, Belgium to the non-woven material-composite production site near Jelgava, Latvia.

Production of Non-Woven Materials

For hemp/PLA and flax/PLA, non-woven materials of both compositions, a multi-layered or so-called sandwich type structure is created, the production of which is described in previous studies [23,24].
The non-woven material production line capacity in a normal mode is 0.4 t/h. The nominal capacity of the whole line is approximately 55.5 kW (fiber disintegrator 7.5 kW, fiber veil arranging machine 6 kW, needle punching machine 36 kW, non-woven material cutting and winding machine 6 kW, and lighting 7 kW). The normal operating capacity is estimated at 75% of the nominal value. Thus, the electricity consumption per one ton of non-woven material is estimated at approximately 47 kWh. Electricity is supplied from a public distribution network.

Production of Composites

The hemp/PLA and flax/PLA composites (Figure 3) are produced from non-woven materials of the respective fiber compositions, which are heat-pressed in heat pressing-thermoforming machine.
The capacity of the composite production line in a normal mode is the capacity of the non-woven material production line added together with the heat pressing-thermoforming machine with a nominal operating capacity of 55 kW. The total capacity of the composite production line in a nominal mode is 117.5 kW and 88.1 kW in a normal mode.

2.4.2. Allocation Procedure

After processing of hemp and flax straws, the following is obtained: fibers, shives and dust (small particles)—fiber as the main product, shives and dust as by-products. Since the use of shives for composites and litter is increasing, it is also possible to gain economic benefit from managing this by-product. The quantity of the obtained product from mass from the processing of hemp straws was taken from data of studies that were carried out in 2012 at the “Latgales Lauksaimniecības zinātnes centrs” on the fiber hemp variety Białobrzeskie [29]. Information regarding flax straw processing is based on the Latvian Fertilization Standards for Field Crops [27]. The economic allocation of both crops slightly varies depending on the dose of N fertilization—as the amount of fertilization increases, the weight of fiber mass over fiber increases. For hemp, the average economic allocation (Table S3) for fibers is 76.06%, and 23.94% for shives. For flax, the average economic allocation (Table S4) for fibers is 86.55%, and 13.45% for shives.
Scraps are inevitable in the production of non-woven materials. After additional carding, these scraps can be used in the production of another non-woven material after preparing the fiber mass. The economic allocation of non-woven material containing hemp fibers is 77% for the main product and 23% for scraps. The same economic allocation is for the non-woven material containing flax fibers.

2.4.3. Comparison Scenarios

The comparison was carried out by searching for alternative solutions to the composites on the market which are produced using fossil resources. As an alternative solution, a composite that is made of non-woven material, which contains 40 mas. % hemp fibers and 60 mas. % PLA fibers, was compared (in the case of another alternative composition, flax fibers are used instead of hemp). The non-woven material is made with the mechanical needle punching method. A total of 20% of PLA fibers are placed in both the upper and the lower layer of the non-woven material. The remaining 60% of the PLA fiber amount is divided into three equal parts and each part is mixed together with one third of the total hemp fiber amount. The composite is obtained by heat pressing the non-woven material. Both previously mentioned composite alternatives have been compared to the composite on the market, which is made of PA66 and 30 mas. % glass fiber. The cultivation conditions of the hemp and flax fibers were compared for both alternative composites. Individually for the hemp/PLA composite, impacts from fertilization scenarios HN0, HN30, HN60, and HN90, and FN0, FN20, FN30, FN35, and FN40 for the flax/PLA composite were compared. The impacts of the two alternative composites and the composite on the market was compared at a load-bearing capacity of 41 kN and a thickness of 4.5 mm.

3. Results

3.1. Environmental Impact of Cultivation of Hemp and Flax

The CML graph (Figure 4) displays environmental impact of hemp and flax cultivation, depending on N fertilization dose per 1 ha. Upon evaluation of the environmental impact of hemp cultivation, depending on fertilization scenarios, the biggest variation changes are observed in acidification and eutrophication. In the case of soil acidification, proportionally increasing the fertilization dose increases the impact—with fertilization dose HN30 (almost 34%), HN60 (~61.5%), and significantly greater impact with fertilization scenario HN90 (77.35%). A similar effect is also observed with eutrophication—HN0 (22%), HN30 (34%), HN60 (~58%), and HN90 (66.5%). In the case of hemp cultivation, the impact on global warming potential is proportional for all fertilization scenarios.
Comparing the two crops, the environmental impact is lower and the CO2 accumulation is higher for hemp than for flax. The flax FN0 scenario has a significantly greater environmental impact (excluding photochemical oxidation, acidification, and eutrophication) and lower CO2 accumulation than the other flax scenarios. The gradual decrease of impact between scenarios FN20, FN30, FN35, and FN40, may be explained with the involvement of agricultural machinery and increase of their capacity at an increasingly higher fertilization dose. Within each individual impact category, seeing how the intensity of impact values changes (impacts decrease with increasing fertilizer dose) between fertilization scenarios shows that it is beneficial to fertilize flax. A different situation is observed with acidification and eutrophication—if the fertilizer dose is increased, the impact also increases, whereas with a maximum fertilizer dose, the impact on both environment criteria starts to decrease.
In the cultivation of hemp, no changes in CO2 accumulation between HN0 (100%) and other fertilization scenarios HN30, HN60 and HN90, are observed. Excluding photochemical oxidation, acidification and eutrophication, impacts on other covered environmental categories vary between 6 and 30%, with the HN90 scenario having the lowest impact.
Also, in the case of flax cultivation fertilization scenarios, as in the case of hemp cultivation, most of the changes in data variations impacting the environment can be observed in acidification, eutrophication, as well as in photochemical oxidation and global warming potential. The CML graph (Figure 5) displays emission sources on global warming potential in hemp cultivation (fertilization scenarios HN0 and HN40) and flax cultivation (fertilization scenarios FN0 and FN40). In hemp cultivation, the main emission sources under the HN0 fertilization scenario are diesel fuel and the use of diesel fuel consuming agricultural machinery. In the case of the HN90 fertilization scenario, the previously mentioned emission sources are supplemented by emissions from ammonia that is caused by the use of mineral fertilizers. In both hemp cultivation cases, emissions are significantly exceeded by the large CO2 accumulation—96% of the total impacts in both fertilization scenarios.
In the case of flax cultivation, the main emission sources of FN0 fertilization scenario are diesel fuel and the use of diesel fuel consuming agricultural machinery, as well as the use of pesticides and herbicides. The accumulation of CO2 of FN0 fertilization scenario is almost 66% of the total impacts of this scenario. As the fertilizer norm increases (for the HN40 fertilization scenario), the amount of emissions per unit of flax harvest decreases. Diesel emissions, which have the biggest impact, decrease to 11%, while emissions from the use of agricultural machinery use fall to 1.5%. With FN40 there is an increase in CO2 accumulation up to 83%, which in the case of flax reflects the benefit of fertilization.

3.2. Environmental Impact of Hemp and Flax Processing, and PLA Fiber Production and Transportation

In the processing of fibers, the amount of emissions is considered for the green mass yield from 1 ha. Data from the different fertilizer scenarios show an evenly proportional impact on the environment. Soil acidification and eutrophication are exceptions. In further calculations, fibers from HN90 and FN40 fertilization scenarios are considered. Under these fertilization scenarios, the conversion of flax to GWP has a higher positive impact than hemp by almost 30%. For acidification and eutrophication, the impact of hemp fiber processing accounts for 62–73%, for the other environmental impact categories that are considered it accounts for up to 36% of the impact of flax processing.
Despite the long distance between the PLA fiber production site and the non-woven production site, the production of the polymer fiber itself has a greater impact on environmental processes (Figure 6). The total transport impacts in other environmental categories account for up to 31% of the impacts of PLA production. The exception is ozone layer depletion, where the impact of transport accounts for 55%. Amongst the transportation stages and means, the longest distance across the Atlantic Ocean by ship transport has the lowest impact, whereas the greatest impact is from transportation of the fiber from a port in Belgium to the non-woven material and composite production site with a truck by land road.

3.3. Environmental Impact of Production of Non-Woven Materials

Considering the manufacturing process of non-woven materials per 1 ton of raw material used, GWP is the only impact category where flax/PLA FN40 non-woven material has a lower impact (1.06 kg CO2 eq and 43% less) than hemp/PLA non-woven material. In the other environmental impact categories, the environmental impact of hemp fiber-based material from production is lower than for flax/PLA non-woven material.
On photochemical oxidation, the hemp/PLA HN90 non-woven material has the largest difference of effect with the flax/PLA FN40 composition—0.0012 kg C2H4 eq and 84% less, with a further large difference of effect on abiotic depletion—7.15 × 10⁻⁶ kg Sb eq and 54% less, on eutrophication—0.053 kg PO4 eq and 56% less, on human toxicity—0.68 kg 1.4-DB eq and 46% less, and on seawater ecotoxicity—1.44 × 10³ and 40% less. Higher impacts and smaller differences between non-woven materials occur in acidification, ozone depletion, abiotic (fossil resource) depletion, terrestrial ecotoxicity, and freshwater ecotoxicity.
In the manufacturing process of hemp/PLA HN90 non-woven material, the environment categories with the highest impact are processes that are related to the production of PLA fibers, which have the highest impacts on freshwater ecotoxicity (97%), terrestrial ecotoxicity (93%), marine ecotoxicity (87%), and GWP (88%). Processes that are related to the cultivation and production of hemp fibers are other major impactors, particularly eutrophication (92%), acidification (92%), and photochemical degradation (48%). Hemp production contributes positively to the non-woven materials global warming potential by giving it a 43% negative impact in relation to the other components. Freight transport (with load capacity 16–32 mt) for the transportation of hemp harvest, hemp fibers, and PLA fibers can be mentioned as the third biggest impactor, which accordingly has the greatest impact on the depletion of the ozone layer (21%). The fourth biggest source of impact arises from maritime transport; however, its impact does not exceed emissions from freight transport in any of the environment categories.
Although the PLA fiber production impacts in the process of flax/PLA FN0 non-woven material production are proportionally high, in relation to the other material-forming components, they are slightly lower than for hemp/PLA HN0 non-woven material.

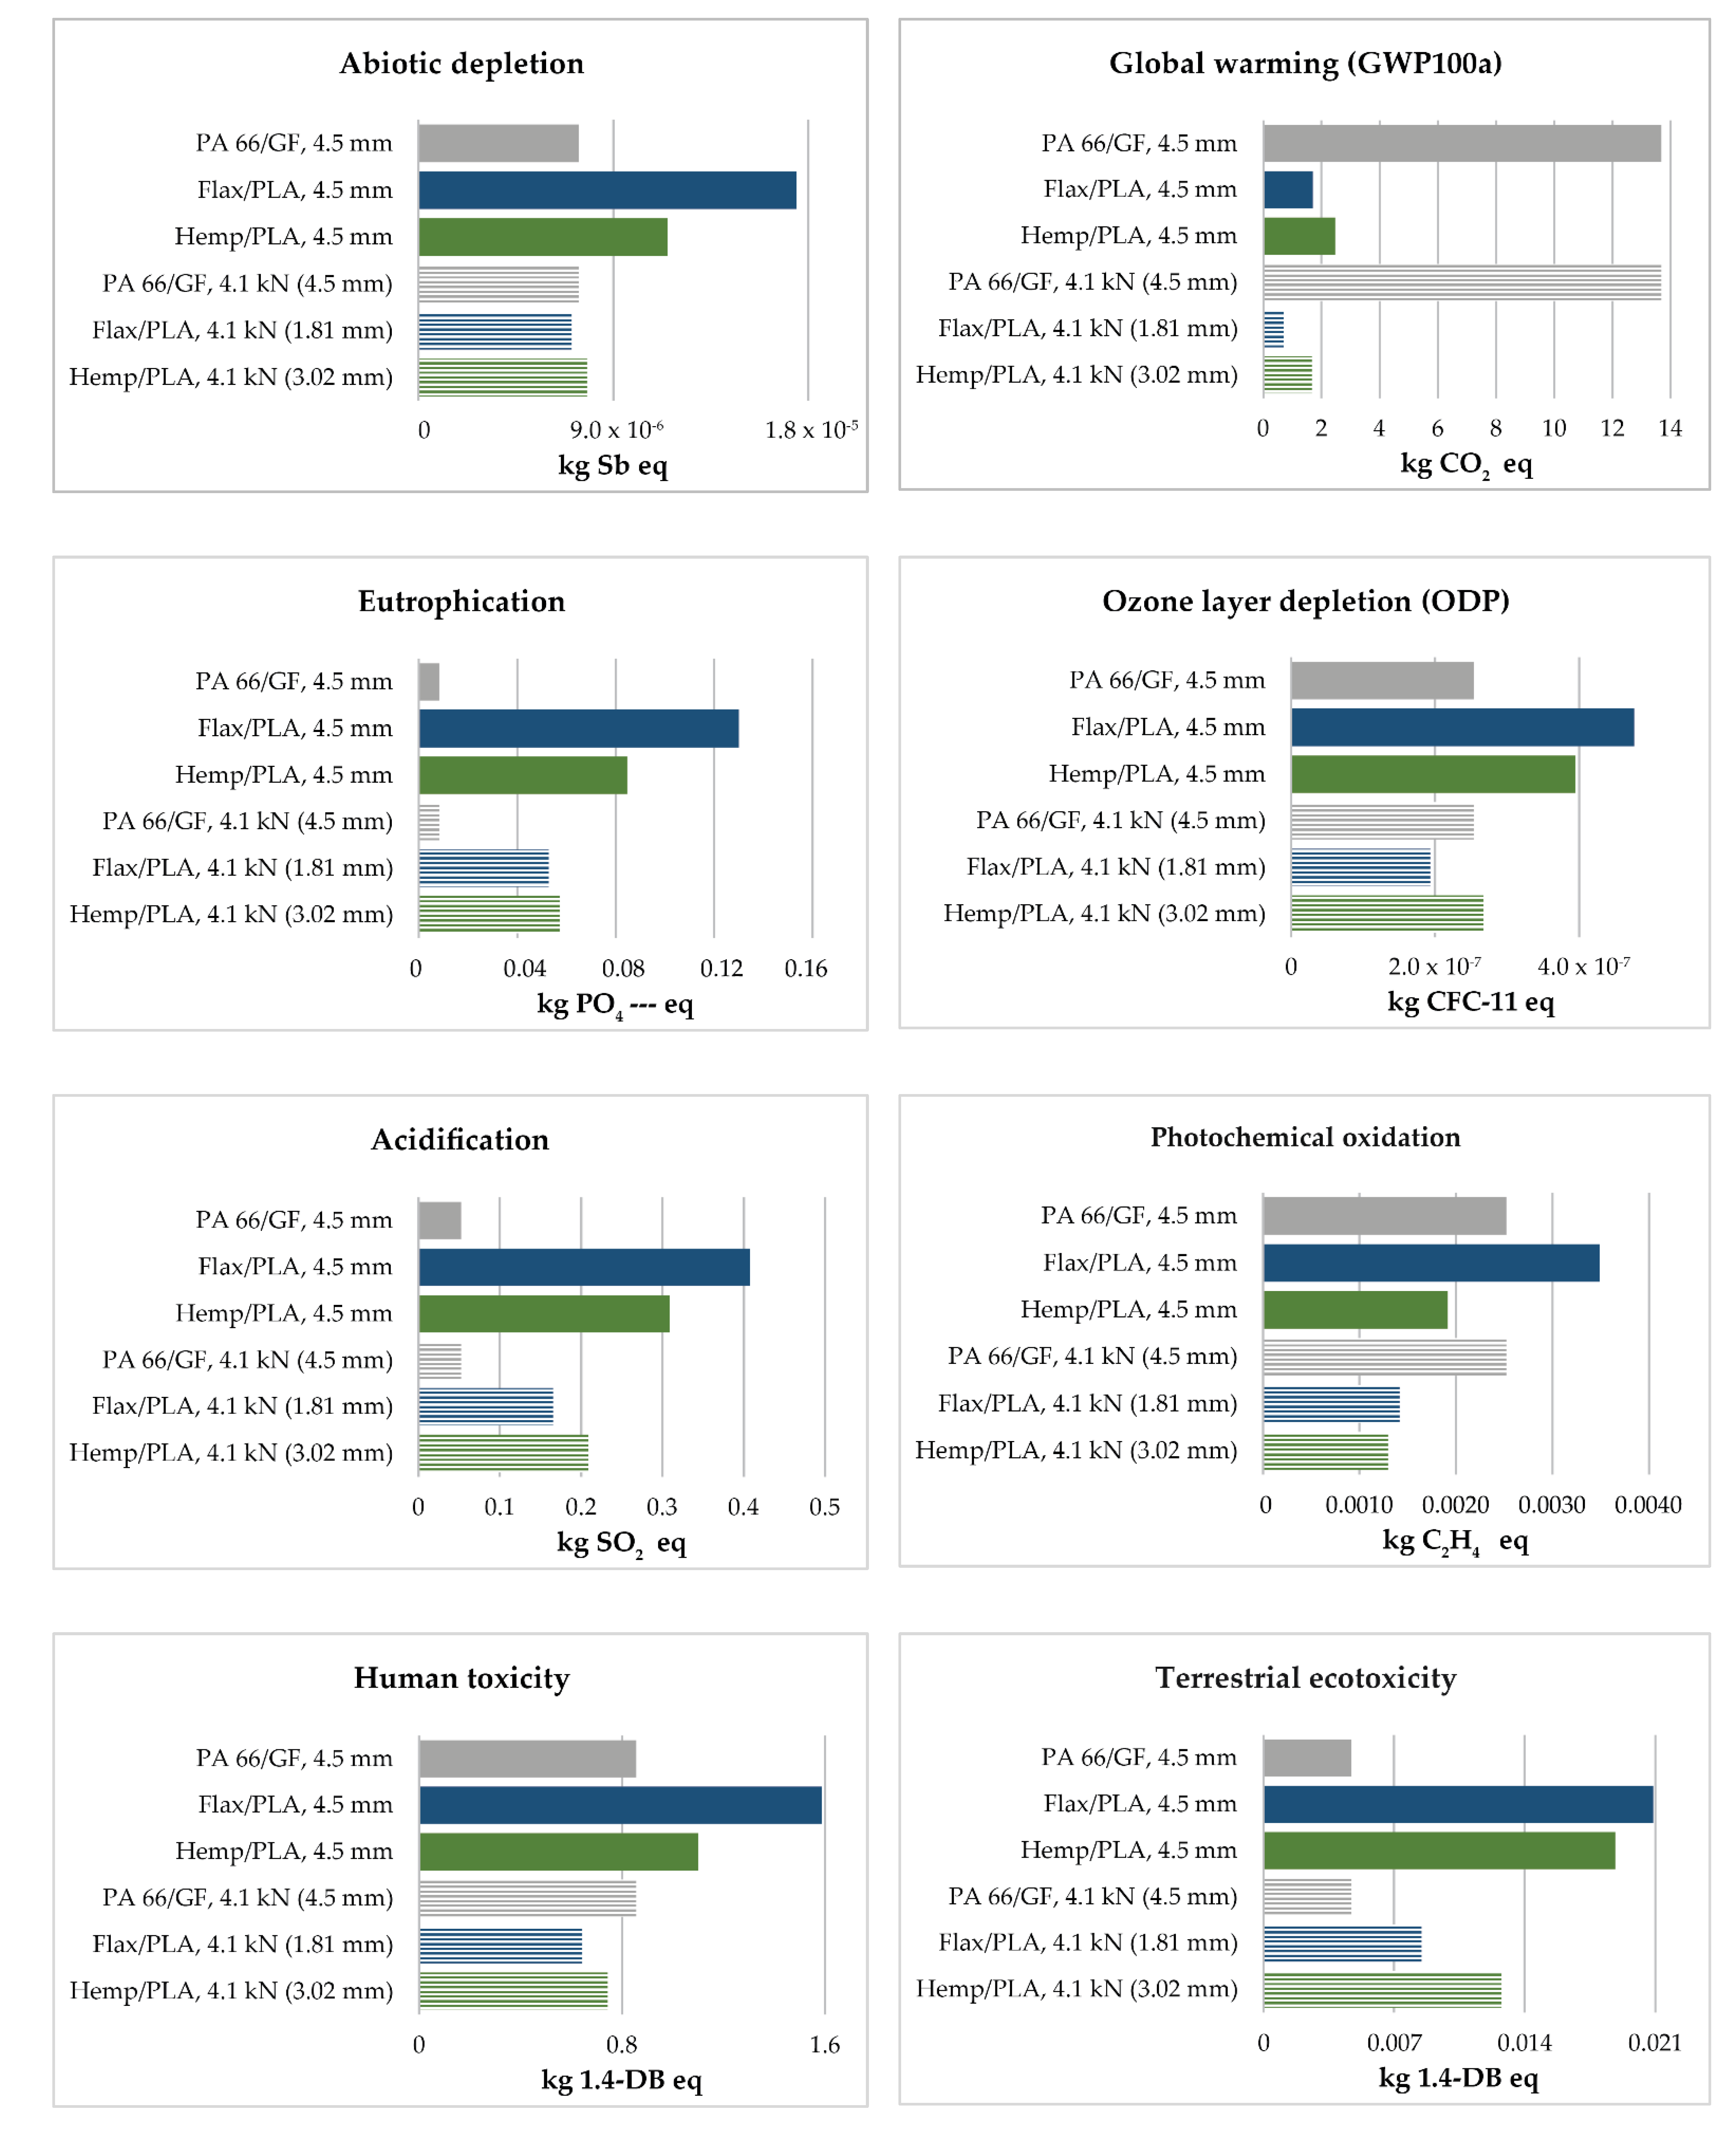
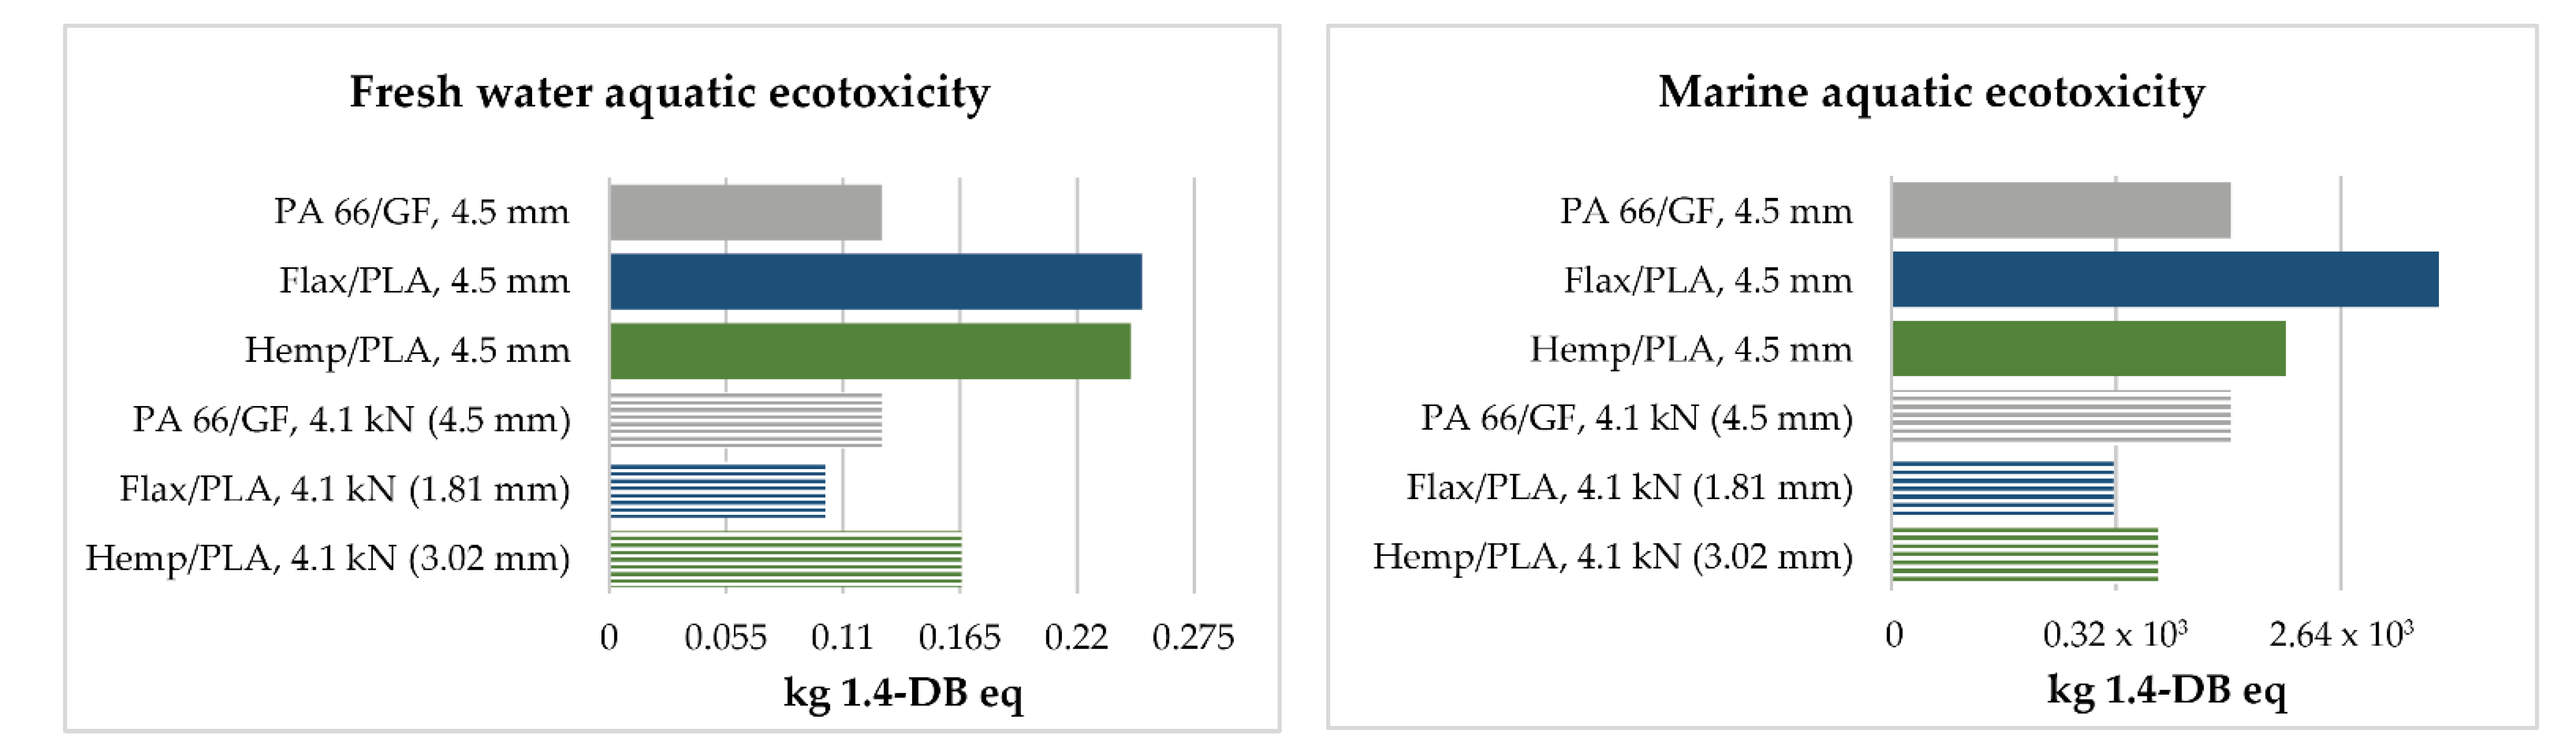
3.4. Environmental Impact of Production of Composites

The impacts from composite production are considered per 1 ton of non-woven material and within the composition of both materials, flax is 11–12% higher than emissions from non-woven material production. The comparison of environmental impacts of both composites hemp/PLA HN90 and flax/PLA FN40 in CML in the considered environment categories is proportional to the environmental impacts of the production of non-woven materials of these two compositions. Similar to the non-woven material production process, the environmental impact of hemp/PLA HN0 from the production process is smaller than the flax/PLA FN0 composite, with the exception of the impact on GWP. The production process of both composites consists of impacts resulting from the production process of non-woven material (mainly all impact) and electricity that is used for the production of the composite (accounts for less than 1% in the case of the hemp/PLA HN90 composite and slightly above 1% for the flax/PLA FN40 composite).
Both alternative composites and the composite on the market were compared according to two functional units (Figure 7). The composite tensile strength at 41 kN was considered as the first functional value (and the thickness 4.5 mm PA66/GF). To reach the selected strength threshold, each variation of the composite requires a different amount of raw materials, which varies in a fairly wide range. The difference between the smallest and the largest required amount of fibers is 61.33%. The greatest impact on the environmental categories arises from the difference in the amount of mass that is used. At GWP, the lowest impact is observed for the flax/PLA 41 kN (1.81 mm) (0.69 kg CO2 eq) composite, the hemp/PLA 41 kN (3.02 mm) composite has a 2.4-times higher impact, with the highest impact for the PA66/GF composite at 13.68 kg CO2 eq (almost 20 times higher than the lowest impact composite). At abiotic depletion, all three composites have similar effects and vary in amplitude 7.08 × 10⁻⁶–7.78 × 10⁻⁶ kg Sb eq.
For the h/PLA 41 kN (3.02 mm) composite, the lowest effect of 0.0013 kg C2H4 eq occurs at photochemical degradation. The lowest effects for the same composite are eutrophication with 0.057 kg PO4 eq, ozone depletion with 2.67 × 10⁻⁷ kg CFC-11 eq, acidification with 0.21 kg SO2 eq, terrestrial ecotoxicity with 0.013 kg 1.4-DB eq, and freshwater ecotoxicity with 0.17 kg 1.4-DB eq.
The lowest effects of the flax/PLA 41 kN (1.81 mm) composite occur at 1.93 kg CFC-11 eq ozone depletion, 0.64 kg 1.4-DB eq human toxicity, 0.10 kg 1.4-DB eq freshwater ecotoxicity, and 1.31 × 10³ kg 1.4-DB eq seawa1.4-DBter ecotoxicity.
For the PA66/GF composite, the lowest impact occurs at eutrophication with 0.0082 kg PO4 eq, at acidification with 0.05 kg SO2 eq. Furthermore, in the comparison of the other two plant fiber-based composites, the lowest impact is at a terrestrial ecotoxicity of 0.005 kg 1.4-DB eq. The highest effects of this composite occur at photochemical oxidation of 0.0025 kg C2H4 eq, human toxicity of 0.86 kg 1.4-DB eq, and seawater ecotoxicity of 2.00 × 10⁻³ kg 1.4-DB eq.
In the case of the second functional value, the thickness of all three composites is 4.5 mm and the amount of raw materials that is required for their production equalizes: the difference between the smallest and the largest amount of raw material mass is 4.7%. Similar to the first functional value, the flax/PLA composition has the lowest environmental impact at the same thickness (1.70 kg CO2 eq). For the same thickness, the effect of the hemp/PLA composite is 1.45-times higher and that of the PA66/GF composite is 8-times higher. At GWP, flax/PLA (4.5 mm) with 1.7 kg CO2 eq has the lowest impact, hemp/PLA (4.5 mm) has a 45% higher impact, and PA66/GF 8-times higher impact.
For the hemp/PLA (4.5 mm) composite, the lowest effect of 0.0019 kg C2H4 eq is at photochemical oxidation.
Among the three composite variations that were considered, the flax/PLA composite has the lowest impacts at GWP and the highest impacts in the other environmental categories that were considered. Significantly higher impacts (impact difference with the nearest value composite is within 35%) occur at abiotic depletion—1.74 × 10⁻⁵ kg Sb eq, eutrophication—0.13 kg PO4 eq, acidification—0.41 kg SO2 eq, photochemical oxidation—0.0035 kg C2H4 eq, human toxicity—1.59 kg 1.4-DB eq, and seawater ecotoxicity—3.22 × 10³ kg 1.4-DB eq.
With the exception of GWP and photochemical oxidation, the PA66/GF composite has the lowest impacts for the other environmental impacts that were considered. Significantly lower impacts (by 77–94% lower than the highest impacts in the reviewed environmental categories) at eutrophication 0.008 kg PO4 eq, acidification 0.05 kg SO2 eq and terrestrial ecotoxicity 0.005 kg 1.4-DB eq. Low impacts (38–58% lower than the highest impacts in the environmental categories that were considered) maintaining at abiotic depletion 7.41 × 10⁻⁶ kg Sb eq, ozone depletion 2.54 × 10⁻⁷ kg CFC-11 eq, human toxicity 0.86 kg 1.4-DB eq, freshwater ecotoxicity 0.13 kg 1.4-DB eq, and seawater ecotoxicity 2.00 × 10³ kg 1.4-DB eq.
For all three compared composites, separately, the amount of CO2 that was emitted was analyzed by the GWP 100 factor, and the lowest being for the flax/PLA composite with 1.19 kg CO2 eq per 1 kg composite (2.8 kg CO2 eq per 1 kg composite if the used fibers were from the FN0 fertilization scenario). For comparison—for the hemp/PLA composite 1.7 kg CO2 eq per 1 kg (1.72 kg CO2 eq per 1 kg composite, if the used fibers were from the HN0 fertilization scenario). The PA66/GF composite displays the highest amount of emitted CO2 emissions with 9.14 kg CO2 eq per 1 kg PA66/GF composite, which is 87% more than from the flax/PLA and 81% more than from the hemp/PLA composite.

4. Discussion

As predicted, nitrogen application promoted biomass growth in both hemp [16] and flax. The CML charts demonstrate that flax crops that were fertilized according to FN0 scenario when it is already fertilized with potassium and phosphorus is justified, because the use of agricultural machinery is more rational and the amount of diesel fuel consumption per one unit of yield decreases. By increasing the fertilizer dose, the amount of the yield increases and the use of pesticides and herbicides per one unit of yield decreases. In the case of hemp cultivation, at the maximum fertilization dose HN90, the emissions per unit of yield become lower than in the case of the fertilization HN0 scenario, but the diversity of emissions increases. By comparing the two crops, the amount of emissions from hemp cultivation, regardless of the chosen fertilization scenario with the exception of acidification and eutrophication, is less than from flax cultivation. Positive features of growing hemp fiber arise from higher yield gains by mass per unit area. The use of complex base fertilizer should be taken into account for the creation of emission promoting conditions from hemp cultivation. The results of the Gomez–Campas research show agricultural activities and electricity production to be the biggest contributors to the environmental impacts of flax technical textile [38]. Within the framework of this study, the biggest influences on the cultivation of both types of fiber are the use of diesel fuel and agricultural machinery.
Although the origin of the raw materials of the PA66/GF composite on the market are fossil resources, due to the mechanical properties of the material and the composite production technology, it shows the lowest environmental impact among other composites in several impact categories (eutrophication, acidification, terrestrial ecotoxicity, and abiotic depletion). The composite of this composition has an expressed superiority of the lowest impacts on eutrophication and acidification, the other thinner variations of the analogous composites fall three to four times behind in their impacts. In LCA calculation, La Rosa has compared a glass fiber and hemp fiber carpet and the first one has higher impact in all categories, except in occupation of land area [24]. Our study demonstrates the impact of PLA fiber on composites containing plant fibers, which increases the total environmental impact of the composites, but still the impact of these composites on global warming potential is several times lower than from the PA66/GF composite.
The lowest emissions amongst the analogue composite variations are from the thinner versions of each composition (at a functional unit 41 kN). If both of the composites containing plant fibers are evaluated at a functional unit of load-bearing capacity of 41 kN, the hemp/PLA HN90 composite has a higher impact on a greater number of impact categories than the flax/PLA FN40 composite. At the functional unit value 4.5 mm, the flax/PLA FN40 composite has the highest impact in all the impact categories, except the global warming potential. The results of LCA analysis that were obtained through this study regarding the impact of the use of natural fibers in comparison with composites that were extracted from non-renewable resources, are similar to the trends in the results of LCA analysis by other authors.
Assuming that the manufacturing technology of the compared composites is the same (different working set-ups), a comparison by raw material price (aggregating the average price of several manufacturers) would result in flax/PLA FN40 having the lowest raw material cost (EUR 1.67 [39,40,41]), hemp/PLA HN90 being 1.43 [40,41,42]-times more expensive, and PA66/GF being 3.26 [40,43]-times more expensive by the first functional unit. At the second functional unit (material thickness 4.5 mm), the hemp/PLA HN90 composite has the lowest raw material cost (EUR 3.53). For the other composites, the raw material costs equalize—the flax/PLA FN40 composite is 1.17-times more expensive and the PA66/GF composite 1.55-times more expensive. Thus, the bio-composites can be cost-competitive if accounting for raw material price.
Mansor [44] has made a summary of various LCA studies comparing petroleum-based composites with either NFC-enhanced or analogous bio-composite versions of the same compositions. The data of the summarized studies show that even a partial substitution of petroleum-based materials with natural fibers in the composition of the composite reduces the amount of energy that is required to produce the analogue composite and GHGs. The summarized data demonstrate that the reinforcement of composites with natural fibers up to 40 wt%, allows the NFC to remain competitive in terms of durability and provide advantages in terms of the amount of energy that is required for its production. Energy differences can be observed in the production of composite raw materials and in the management of the composite at the end of its life cycle, since the production, transportation, and even the use of analogue composites are the same.
For example, in the production of materials for vehicle door handles, Delgado-Aguilar [45] used a sugar fiber (CF) 40 wt% and 50 wt% reinforced polypropylene (PP) composite in the first and second case, and a glass fiber (GF) 20 wt% and 30 wt% reinforced PP composite in the third and fourth case. The LCA analysis demonstrates the positive impact of the use of natural fibers compared to a composite with synthetic content, because the lowest carbon footprint is produced by CF 50 wt% + PP, followed by CF 40 wt% + PP, GF 30 wt% + PP, and GF 20 wt% + PP. Oliver-Ortega [46] has also carried out an LCA analysis for vehicle door handle composite variations: wood flour (WF) (40 wt%, 50 wt% and 60 wt%), reinforced polypropylene 11 (PA11), and glass fiber (GF) (20 wt% and 30 wt%) reinforced PP composites. The analysis data showed that in all WF-PA11 composite variation cases the environmental impact and carbon footprint is higher than from GF-PP composite variations. The author explains the obtained results with high energy consumption, which is required for the production of PA11. In the LCA analysis that was carried out by Beigbeder [47] for two types of bio-composites: wood flour (WF) 20 wt% -reinforced PP, and flax fiber-reinforced PLA composite waste on waste scenarios, for both composites, the lowest energy consumption and lowest environmental impact is observed in processing.

5. Conclusions

The development and use of a blend of flax and PLA fibers, as well as hemp and PLA fibers, in composites is appropriate to reduce the carbon footprint compared to traditionally used petroleum-based composites. For example, to produce a panel of the same overall size (by area and thickness), the flax/PLA composite produces a carbon footprint of 1.19 kg CO2 per 1 kg of composite and is 87% less than 1 kg of PA66/GF composite. The footprint of the hemp/PLA composite is 81% smaller than that of the 1 kg PA66/GF composite. The use of a blend of hemp or flax and PLA fibers in composites compared to PA66/GF allows a significant reduction of CO2 emissions and global warming potential but increases the impact on other environmental categories such as eutrophication, acidification, and terrestrial ecotoxicity. The negative emissions that are associated with hemp/PLA and flax/PLA bio-based composites comes from crop growing. These emissions could be reduced in future using more resource-saving farming practices.
The CML data show that in hemp and flax cultivation, the carbon footprint reduction depends on the N fertilizer dose, with higher gains in hemp cultivation—1.57 kg CO2 difference per kg green mass between 0 and 90 kg N fertilizer dose per ha. In comparison, for flax cultivation, 0.02 kg CO2 per kg green matter can be saved from fertilizer scenarios.
Although the current price offer shows that the raw material price of the natural and PLA fiber blend composite is competitive with the PA66/GF composite, it should be noted that the price of natural fibers is variable, depending on the yield and the increase in the energy costs.
As the production of PLA fibers is energy intensive, there is potential for flax/PLA and hemp/PLA blend composites to reduce their carbon footprint, either by making the PLA fiber extraction process more environmentally friendly or by replacing PLA fibers with a less energy intensive polymer.

Supplementary Materials

The following supporting information can be downloaded at: https://www.mdpi.com/article/10.3390/fib10090079/s1. Tables S1 and S2 describe the thickness, mass and density values of all three compared composites at both functional units. Table S3 describes the economic allocation of hemp straw (fibre and straw) processing depending on the applied fertilization scenario for hemp cultivation. Analogous information on the economic allocation of flax straw processing is presented in Table S4. Table S1: Functional unit at 41 kN strength; Table S2: Functional unit 1000 × 500 × 4.5 mm; Table S3: Economic allocation of hemp straw processing; Table S4: Economic allocation of flax straw processing.

Author Contributions

Conceptualization, A.S., E.S. and M.S.; methodology, M.S.; software, A.S. and M.S.; validation, A.S., E.S. and M.S.; formal analysis, M.S.; investigation, A.S.; resources, A.S. and M.S.; data curation, A.S.; writing—original draft preparation, A.S. and M.S.; writing—review and editing, A.S., E.S. and M.S.; visualization, A.S.; supervision, M.S.; project administration, A.S. and M.S.; funding acquisition, A.S. and M.S. All authors have read and agreed to the published version of the manuscript.

Funding

Arta Seile was supported by the European Social Fund within the Project No 8.2.2.0/20/I/008 «Strengthening of PhD students and academic personnel of Riga Technical University and BA School of Business and Finance in the strategic fields of specialization» of the Specific Objective 8.2.2 «To Strengthen Academic Staff of Higher Education Institutions in Strategic Specialization Areas» of the Operational Programme «Growth and Employment». Arta Seile was also supported by Riga Technical University’s Doctoral Grant programme. Maris Sinka was supported by the European Regional Development Fund within the Activity 1.1.1.2 “Post-doctoral Research Aid” of the Specific Aid Objective 1.1.1 “To increase the research and innovative capacity of scientific institutions of Latvia and the ability to attract external financing, investing in human resources and infrastructure” of the Operational Programme “Growth and Employment” (No.1.1.1.2/VIAA/3/19/394).

Institutional Review Board Statement

Not applicable.

Informed Consent Statement

Not applicable.

Data Availability Statement

Not applicable.

Conflicts of Interest

The authors declare no conflict of interest. The funders had no role in the design of the study; in the collection, analyses, or interpretation of data; in the writing of the manuscript, or in the decision to publish the results.

References

  1. Piot, A.; Béjat, T.; Jay, A.; Bessette, L.; Wurtz, E.; Barnes-Davin, L. Study of a hempcrete wall exposed to outdoor climate: Effects of the coating. Constr. Build. Mater. 2017, 139, 540–550. [Google Scholar] [CrossRef]
  2. Fung, W.; Hardcastle, M. 7—Other Textile Applications. In Textiles in Automotive Engineering; Fung, W., Hardcastle, M., Eds.; Woodhead Publishing: Cambridge, UK, 2001; pp. 227–253. [Google Scholar] [CrossRef]
  3. Groz-Beckert. All the Latest Information from the Textile World, Trendsetter: Finer Fibres. Available online: https://www.groz-beckert.com/en/company/news/newsletter/felting/2011/m4_felting_nonwovenincars.html (accessed on 3 August 2022).
  4. Fung, W.; Hardcastle, M. 6—Product Engineering—Interior Trim. In Textiles in Automotive Engineering; Fung, W., Hardcastle, M., Eds.; Woodhead Publishing: Cambridge, UK, 2001; pp. 194–226. [Google Scholar] [CrossRef]
  5. Anand, S.C.; Brunnschweiler, D.; Swarbrick, G.; Russell, S.J. 5—Mechanical bonding. In Handbook of Nonwovens; Russell, S.J., Ed.; Woodhead Publishing: Cambridge, UK, 2007; pp. 201–297. [Google Scholar] [CrossRef]
  6. The European Parliament and the Council of the European Union. Directive 2009/28/EC of the European Parliament and of the Council of 23 April 2009 on the Promotion of the Use of Energy from Renewable Sources and Amending and Subsequently Repealing Directives 2001/77/EC and 2003/30/EC (Text with EEA relevance). Off. J. Eur. Union 2009, 140, 1–16. Available online: http://data.europa.eu/eli/dir/2009/28/oj (accessed on 12 June 2022).
  7. Stewart, R. Lightweighting the automotive market. Reinf. Plast. 2009, 53, 14–21. [Google Scholar] [CrossRef]
  8. Chen, J.Y. Reducing Noise in Automotive Interiors. In Textile Advances in the Automotive Industry; Shishoo, R., Ed.; Woodhead Publishing Limited: Cambridge, UK, 2008; pp. 198–228. [Google Scholar]
  9. De Beaus, N.; Carus, M.; Barth, M. Carbon Footprint and Sustainability of Different Natural Fibres for Biocomposites and Insulation Material. Hürth. August 2019. Available online: www.nova-institut.eu (accessed on 3 August 2022).
  10. Toffe, G.T.; Ismail, S.O.; Montalvão, D.; Knight, J.; Ren, G. A scale-up of energy-cycle analysis on processing non-woven flax/PLA tape and triaxial glass fibre fabric for composites. J. Manuf. Mater. Processing 2019, 3, 92. [Google Scholar] [CrossRef]
  11. Mohammed, L.; Ansari, M.N.M.; Pua, G.; Jawaid, M.; Islam, M.S. A Review on Natural Fiber Reinforced Polymer Composite and Its Applications. Int. J. Polym. Sci. 2015, 2015, 243947. [Google Scholar] [CrossRef]
  12. Farah, S.; Anderson, D.G.; Langer, R. Physical and mechanical properties of PLA, and their functions in widespread applications—A comprehensive review. Adv. Drug Deliv. Rev. 2016, 107, 367–392. [Google Scholar] [CrossRef] [PubMed]
  13. Ramaswamy, S.; Institut für Textiltechnik of ITA RWCH Aachen University, Aachen, North Rhine-Westphalia, Germany. Personal communication, 2013.
  14. Hu, R.; Lim, J.K. Fabrication and mechanical properties of completely biodegradable hemp fiber reinforced polylactic acid composites. J. Compos. Mater. 2007, 41, 1655–1669. [Google Scholar] [CrossRef]
  15. Hargitai, H.; Rácz, I.; Anandjiwala, R.D. Development of HEMP fiber reinforced polypropylene composites. J. Thermoplast. Compos. Mater. 2008, 21, 165–174. [Google Scholar] [CrossRef]
  16. Papastylianou, P.; Kakabouki, I.; Travlos, I. Effect of nitrogen fertilization on growth and yield of industrial hemp (Cannabis sativa L.). Not. Bot. Horti Agrobot. Cluj-Napoca 2018, 46, 197–201. [Google Scholar] [CrossRef]
  17. Eiropas Parlaments. Siltumnīcefekta Gāzu Emisijas Valstu Un Sektoru Dalījumā (Infografika). 17 October 2019. Available online: https://www.europarl.europa.eu/news/lv/headlines/society/20180301STO98928/siltumnicefekta-gazu-emisijas-valstu-un-sektoru-dalijuma-infografika (accessed on 12 June 2022).
  18. Grīnfelde, I.; Bērziņa, L.; Lauva, D.; Šņore, Z.; Oficiere, S. Rokasgrāmata Lauksaimniekiem SEG Aprēķināšanai Saimniecības Līmenī Un Tā Samazināšnas Pasākumi. Jelgava; 2014. Available online: https://www.lad.gov.lv/files/ladDocument/1670/4_1_4_2_LLU_Rokasgramata_SEG_2014.pdf (accessed on 12 June 2022).
  19. Tortoioli, S.; Paolotti, L.; Romagnoli, F.; Boggia, A.; Rocchi, L. Environmental Assessment of Bio-Oil Transformation from Thistle in the Italian Context: An LCA Study. Environ. Clim. Technol. 2020, 24, 430–446. [Google Scholar] [CrossRef]
  20. ISO 14040:2006; Environmental Management—Life Cycle Assessment—Principles and Framework. International Organization for Standartization: Geneva, Switzerland, July 2006; pp. 1–20. Available online: https://www.iso.org/standard/37456.html (accessed on 12 June 2022).
  21. Goedkoop, M.; Oele, M.; Leijting, J.; Ponsioen, T.; Meijer, E. Introduction to LCA with SimaPro. 2016. Available online: www.pre-sustainability.com (accessed on 12 June 2022).
  22. Stocker, T.F.; Qin, D.; Plattner, G.-K.; Tignor, M.; Allen, S.K.; Boschung, J.; Nauels, A.; Xia, Y.; Bex, V.; Midgley, P.M. IPCC, Climate Change 2013: The Physical Science Basis, Contribution of Working Group I to the Fifth Assessment Report of the Intergovernmental Panel on Climate Change; Cambridge University Press: Cambridge, UK; New York, NY, USA, 2013; p. 1535. [Google Scholar]
  23. Seile, A.; Belakova, D. Hemp Made Bio-Composites. Mater. Sci. Text. Cloth. Technol. 2014, 9, 22–27. [Google Scholar] [CrossRef]
  24. Seile, A.; Belakova, D. Properties of Long Flax Fiber Reinforced Nonwoven and Composite Materials. In Proceedings of the 15th International Scientific Conference Engineering for Rural Development, Jelgava, Latvia, 25–27 May 2016; pp. 990–996. [Google Scholar]
  25. Barth, M.; Carus, M. Carbon Footprint and Sustainability of Different Natural Fibres for Biocomposites and Insulation Material Study Providing Data for the Automotive and Insulation Industry MultiHemp. Hürth. April 2015. Available online: www.nova-institut.eu (accessed on 1 October 2021).
  26. Kārkliņš, A.; Ruža, A. Lauku Kultūraugu Mēslošanas Normatīvi; Latvian University of Agriculture: Jelgava, Latvia, 2013; pp. 8–25. [Google Scholar]
  27. Adamovičs, A. Industriālo Kaņepju (Cannabis sativa L.) Audzēšanas un Novākšanas Tehnoloģiju Izstrāde Produkcijas Ieguvei ar Augstu Pievienoto Vērtību. In Proceedings of the Atskaite par Zemkopības Ministrijas Subsīdiju Tēmu Nr. 270314/S70, Jelgava, Latvia, 2 May 2014; Available online: https://www.zm.gov.lv/public/ck/files/ZM/lauku_attistiba/zinatne/Adamovics_kanepes_ZM_05_12sais_pdf.pdf (accessed on 24 July 2022).
  28. Adamovičs, A. Industriālo kaņepju (Cannabis sativa L.) audzēšanas un novākšanas tehnoloģiju izstrāde produkcijas ieguvei ar augstu pievienoto vērtību. In Proceedings of the Atskaite par Zemkopības Ministrijas Subsīdiju Tēmu Nr. 070515/S36, Jelgava, Latvia, 11 November 2015; Available online: https://www.llu.lv/lv/projekti/apstiprinatie-projekti/2015/industrialo-kanepju-cannabis-sativa-l-audzesanas-novaksanas (accessed on 24 July 2022).
  29. Stramkale, V. A. Research Results Year 2012. B. Research Results Year 2010, Latgale Agriculture Research Centre: Vilani, Latvia, 2012.
  30. Vosper, J. The Role of Industrial Hemp in Carbon Farming. In GoodEarth Resources PTY LTD (ABN 79 124 022 859); 2018. Available online: https://www.aph.gov.au/DocumentStore.ashx?id=ae6e9b56-1d34-4ed3-9851-2b3bf0b6eb4f (accessed on 24 July 2022).
  31. Haije, W.G. Comparative Environmental Life Cycle Assessment of Composite Materials. 2018. Available online: https://www.researchgate.net/publication/238107819 (accessed on 5 December 2021).
  32. Mosier, A.; Kroeze, C.; Nevison, C.; Oenema, O.; Seitzinger, S.; van Cleemput, O. Closing the global N2O budget: Nitrous oxide emissions through the agricultural nitrogen cycle: OECD/IPCC/IEA phase II development of IPCC guidelines for national greenhouse gas inventory methodology. Nutr. Cycl. Agroecosyst. 1998, 52, 225–248. [Google Scholar] [CrossRef]
  33. Rossier, D. Ecobilan: Adaptation de la Méthode Écobilan Pour la Gestion Environnementale de L’exploitation Agricole; Service Romand de Vulgarisation Agricole: Lausanne, Switzerland, 1998; p. 49. [Google Scholar]
  34. Sinka, M.; van den Heede, P.; de Belie, N.; Bajare, D.; Sahmenko, G.; Korjakins, A. Comparative life cycle assessment of magnesium binders as an alternative for hemp concrete. Resour. Conserv. Recycl. 2018, 133, 288–299. [Google Scholar] [CrossRef]
  35. European Commission. 2004/34/EC of 23 March 2004 amending, for the purposes of adapting to technical progress, Annexes I and II to Directive 96/74/EC of the European Parliament and of the Council on textile names (Text with EEA relevance). Off. J. 2004, 089, 0035. Available online: https://eur-lex.europa.eu/legal-content/LV-EN/TXT/?uri=CELEX:32004L0034 (accessed on 19 June 2022).
  36. Söderbaum, E. 1—Requirements for Automotive Textiles—A carproducer’s View. In Textile Advances in the Automotive Industry; Shishoo, R., Ed.; Woodhead Publishing: Cambridge, UK, 2008; pp. 3–16. [Google Scholar] [CrossRef]
  37. Mokhena, T.C.; Sefadi, J.S.; Sadiku, E.R.; John, M.J.; Mochane, M.J.; Mtibe, A. Thermoplastic processing of PLA/cellulose nanomaterials composites. Polymers 2018, 10, 1363. [Google Scholar] [CrossRef] [PubMed]
  38. Gomez-Campos, A.; Vialle, C.; Rouilly, A.; Sablayrolles, C.; Hamelin, L. Flax fiber for technical textile: A life cycle inventory. J. Clean. Prod. 2021, 281, 125177. [Google Scholar] [CrossRef]
  39. Flagma. Льнoвoлoкнo длиннoе и кoрoткoе, пакля. Available online: https://flagma.by/lnovolokno-dlinnoe-i-korotkoe-paklya-o4262634.html (accessed on 12 February 2022).
  40. New Media Publisher GmbH. Real Time Price List. Available online: https://plasticker.de/preise/pms_en.php?kat=Mahlgut&aog=A&show=ok&make=ok (accessed on 15 July 2022).
  41. MarketsandMarkets. Polylactic Acid Market by Grade (Thermoforming, Extrusion, Injection Molding, Blow Molding), Application (Rigid Thermoform, Film & Sheet, Bottles), End-Use Industry (Packaging, Consumer Goods, Agricultural, Textile, Biomedical) and Region (2022–2026). Available online: https://www.marketsandmarkets.com/Market-Reports/polylactic-acid-pla-market-29418964.html (accessed on 12 February 2022).
  42. SIA Zalers. Šķiedra. Available online: http://www.hemptime.lv/ (accessed on 12 February 2022).
  43. Nylon 66, PA 66 Prices. Available online: http://www.plastemart.com/nylon-66-PA-66-pricelist/polymer-prices (accessed on 28 January 2022).
  44. Mansor, M.R.; Fadzullah, S.H.S.M.; Nurfaizey, A.H. Chapter 5—Life Cycle Assessment (LCA) Analysis of Composite Products in Automotive Applications. In Biocomposite and Synthetic Composites for Automotive Applications; Sapuan, S.M., Ilyas, R.A., Eds.; Woodhead Publishing: Cambridge, UK, 2021; pp. 147–172. [Google Scholar] [CrossRef]
  45. Delgado-Aguilar, M.; Tarrés, Q.; Marques, M.D.F.V.; Espinach, F.X.; Julián, F.; Mutjé, P.; Vilaseca, F. Explorative Study on the Use of Curauá Reinforced Polypropylene Composites for the Automotive Industry. Materials 2019, 12, 4185. [Google Scholar] [CrossRef] [PubMed] [Green Version]
  46. Oliver-Ortega, H.; Julian, F.; Espinach, F.X.; Tarrés, Q.; Ardanuy, M.; Mutjé, P. Research on the use of lignocellulosic fibers reinforced bio-polyamide 11 with composites for automotive parts: Car door handle case study. J. Clean. Prod. 2019, 226, 64–73. [Google Scholar] [CrossRef]
  47. Beigbeder, J.; Soccalingame, L.; Perrin, D.; Bénézet, J.-C.; Bergeret, A. How to manage biocomposites wastes end of life? A life cycle assessment approach (LCA) focused on polypropylene (PP)/wood flour and polylactic acid (PLA)/flax fibres biocomposites. Waste Manag. 2018, 83, 184–193. [Google Scholar] [CrossRef] [PubMed] [Green Version]
Figure 1. The main stages of composite production from extraction to the output of the final product from the factory.
Fibers 10 00079 g001
Figure 2. A sequential schematic representation of the processes with inputs and outputs in the cultivation of fiber crops: (a) hemp; (b) flax.
Fibers 10 00079 g002
Figure 3. Composite samples: (a) hemp/PLA; (b) flax/PLA.
Fibers 10 00079 g003
Figure 4. Environmental impact of flax and hemp cultivation depending on fertilization scenarios.
Fibers 10 00079 g004
Figure 5. CML2 baseline results from hemp and flax fertilization scenarios HN0, HN90, FN0, and FN40 for global warming (GWP100a) impact category.
Fibers 10 00079 g005
Figure 6. Environmental impact of production and transportation of polylactide fibers.
Fibers 10 00079 g006
Figure 7. Environmental impact of hemp/PLA HN90, flax/PLA FN40, and PA 66/GF composites with both functional units. Method: CML-IA baseline V3.04/EU25/Characterization/Excluding long-term emissions.
Fibers 10 00079 g007aFibers 10 00079 g007b
Publisher’s Note: MDPI stays neutral with regard to jurisdictional claims in published maps and institutional affiliations.

