
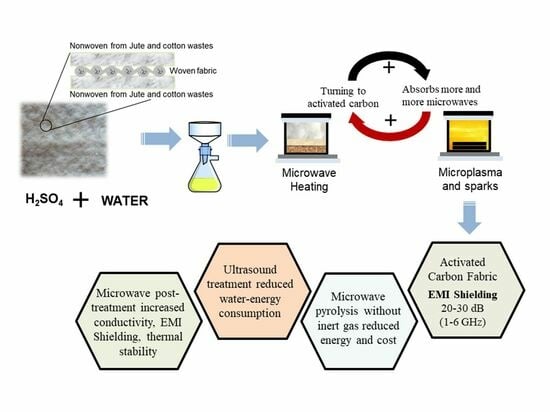
Development of Activated Carbon Textiles Produced from Jute and Cotton Wastes for Electromagnetic Shielding Applications


Abstract
:
1. Introduction
2. Materials and Methods
2.1. Materials
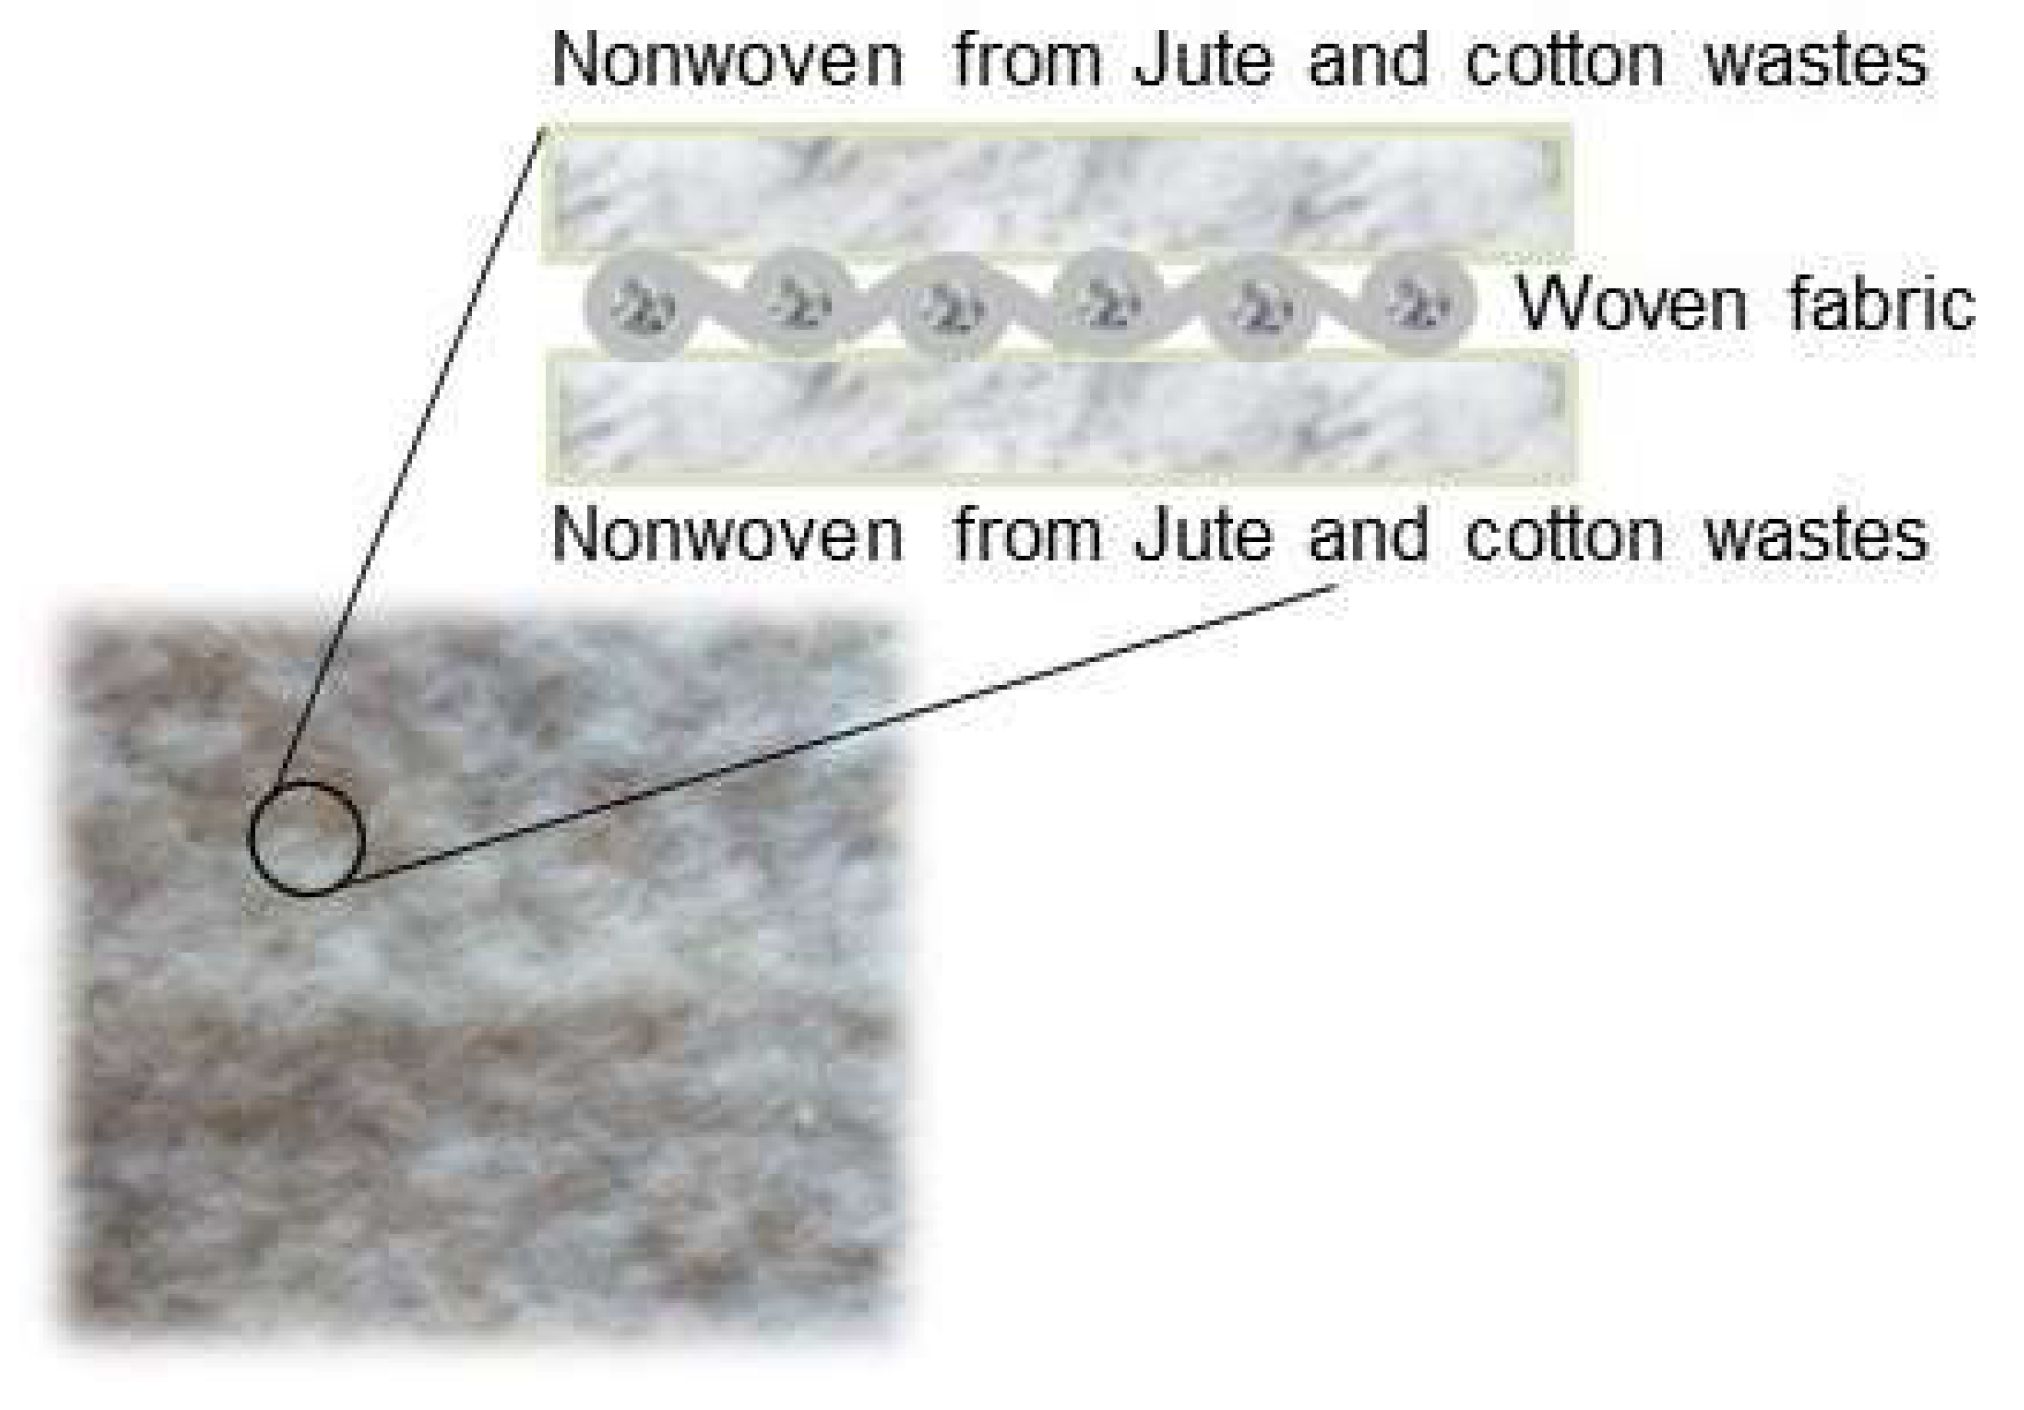
2.2. Textile Production
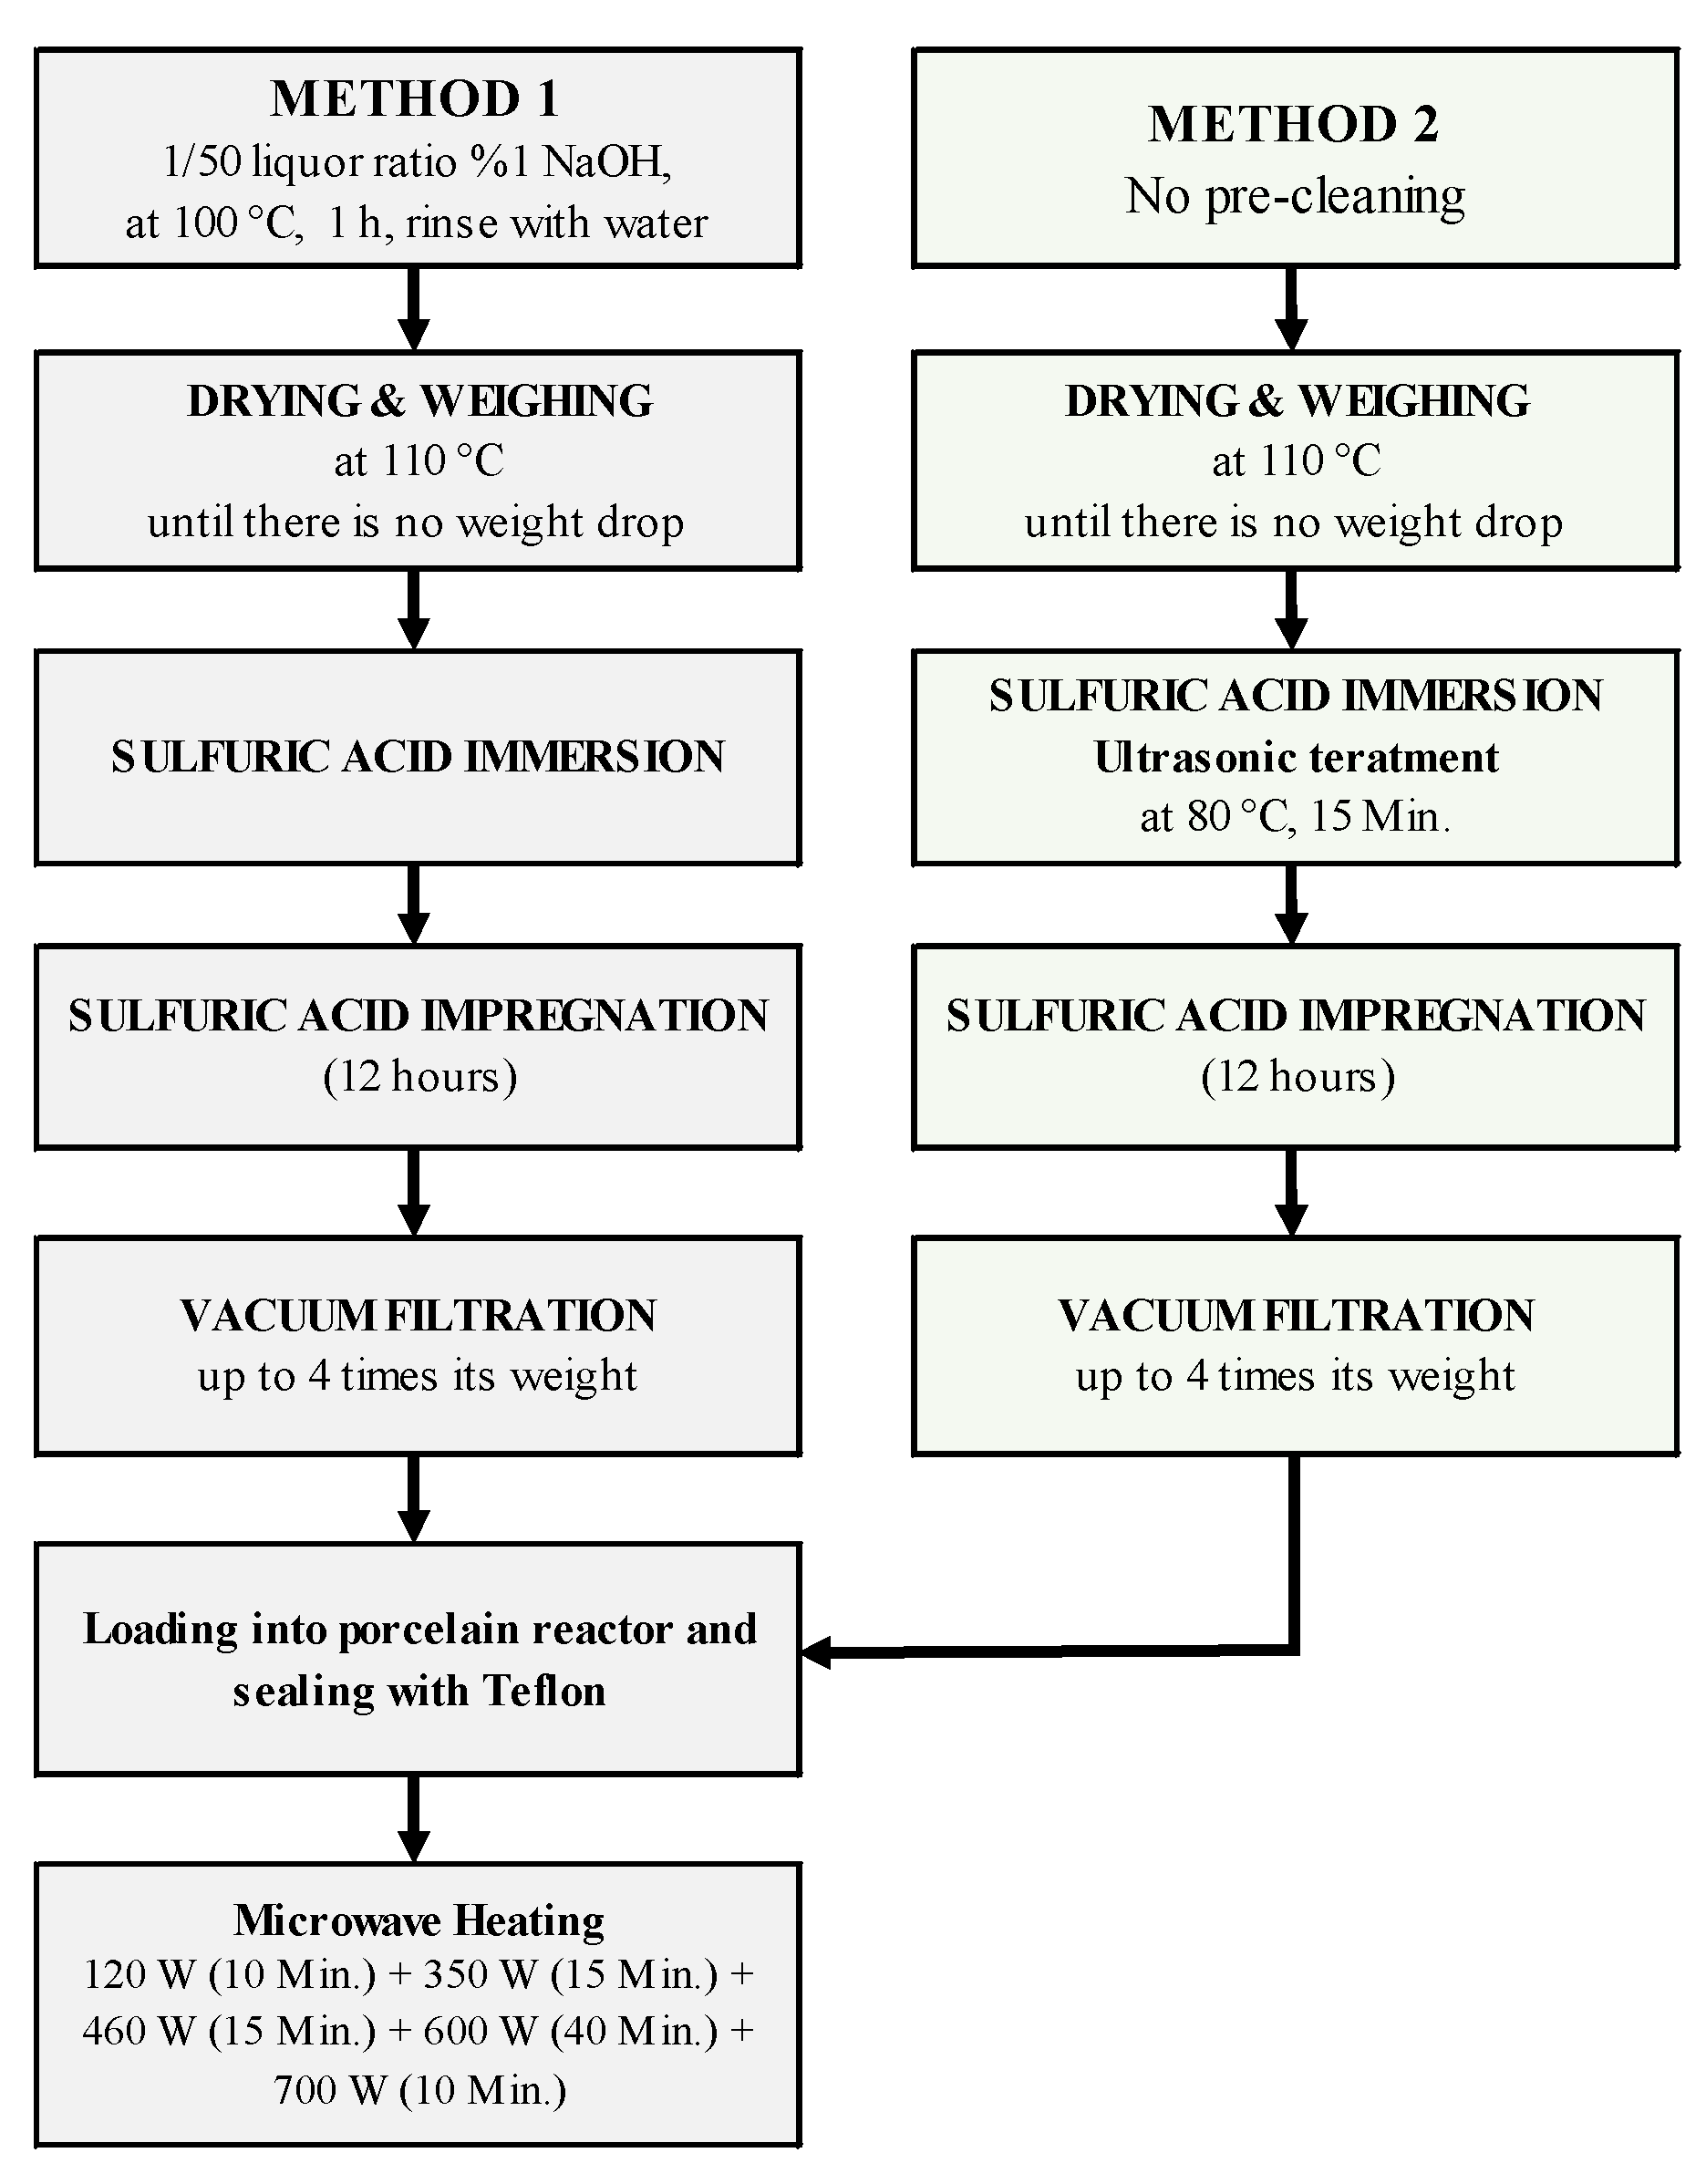
2.3. Pyrolysis System and Experiments
2.4. Characterizations
3. Results
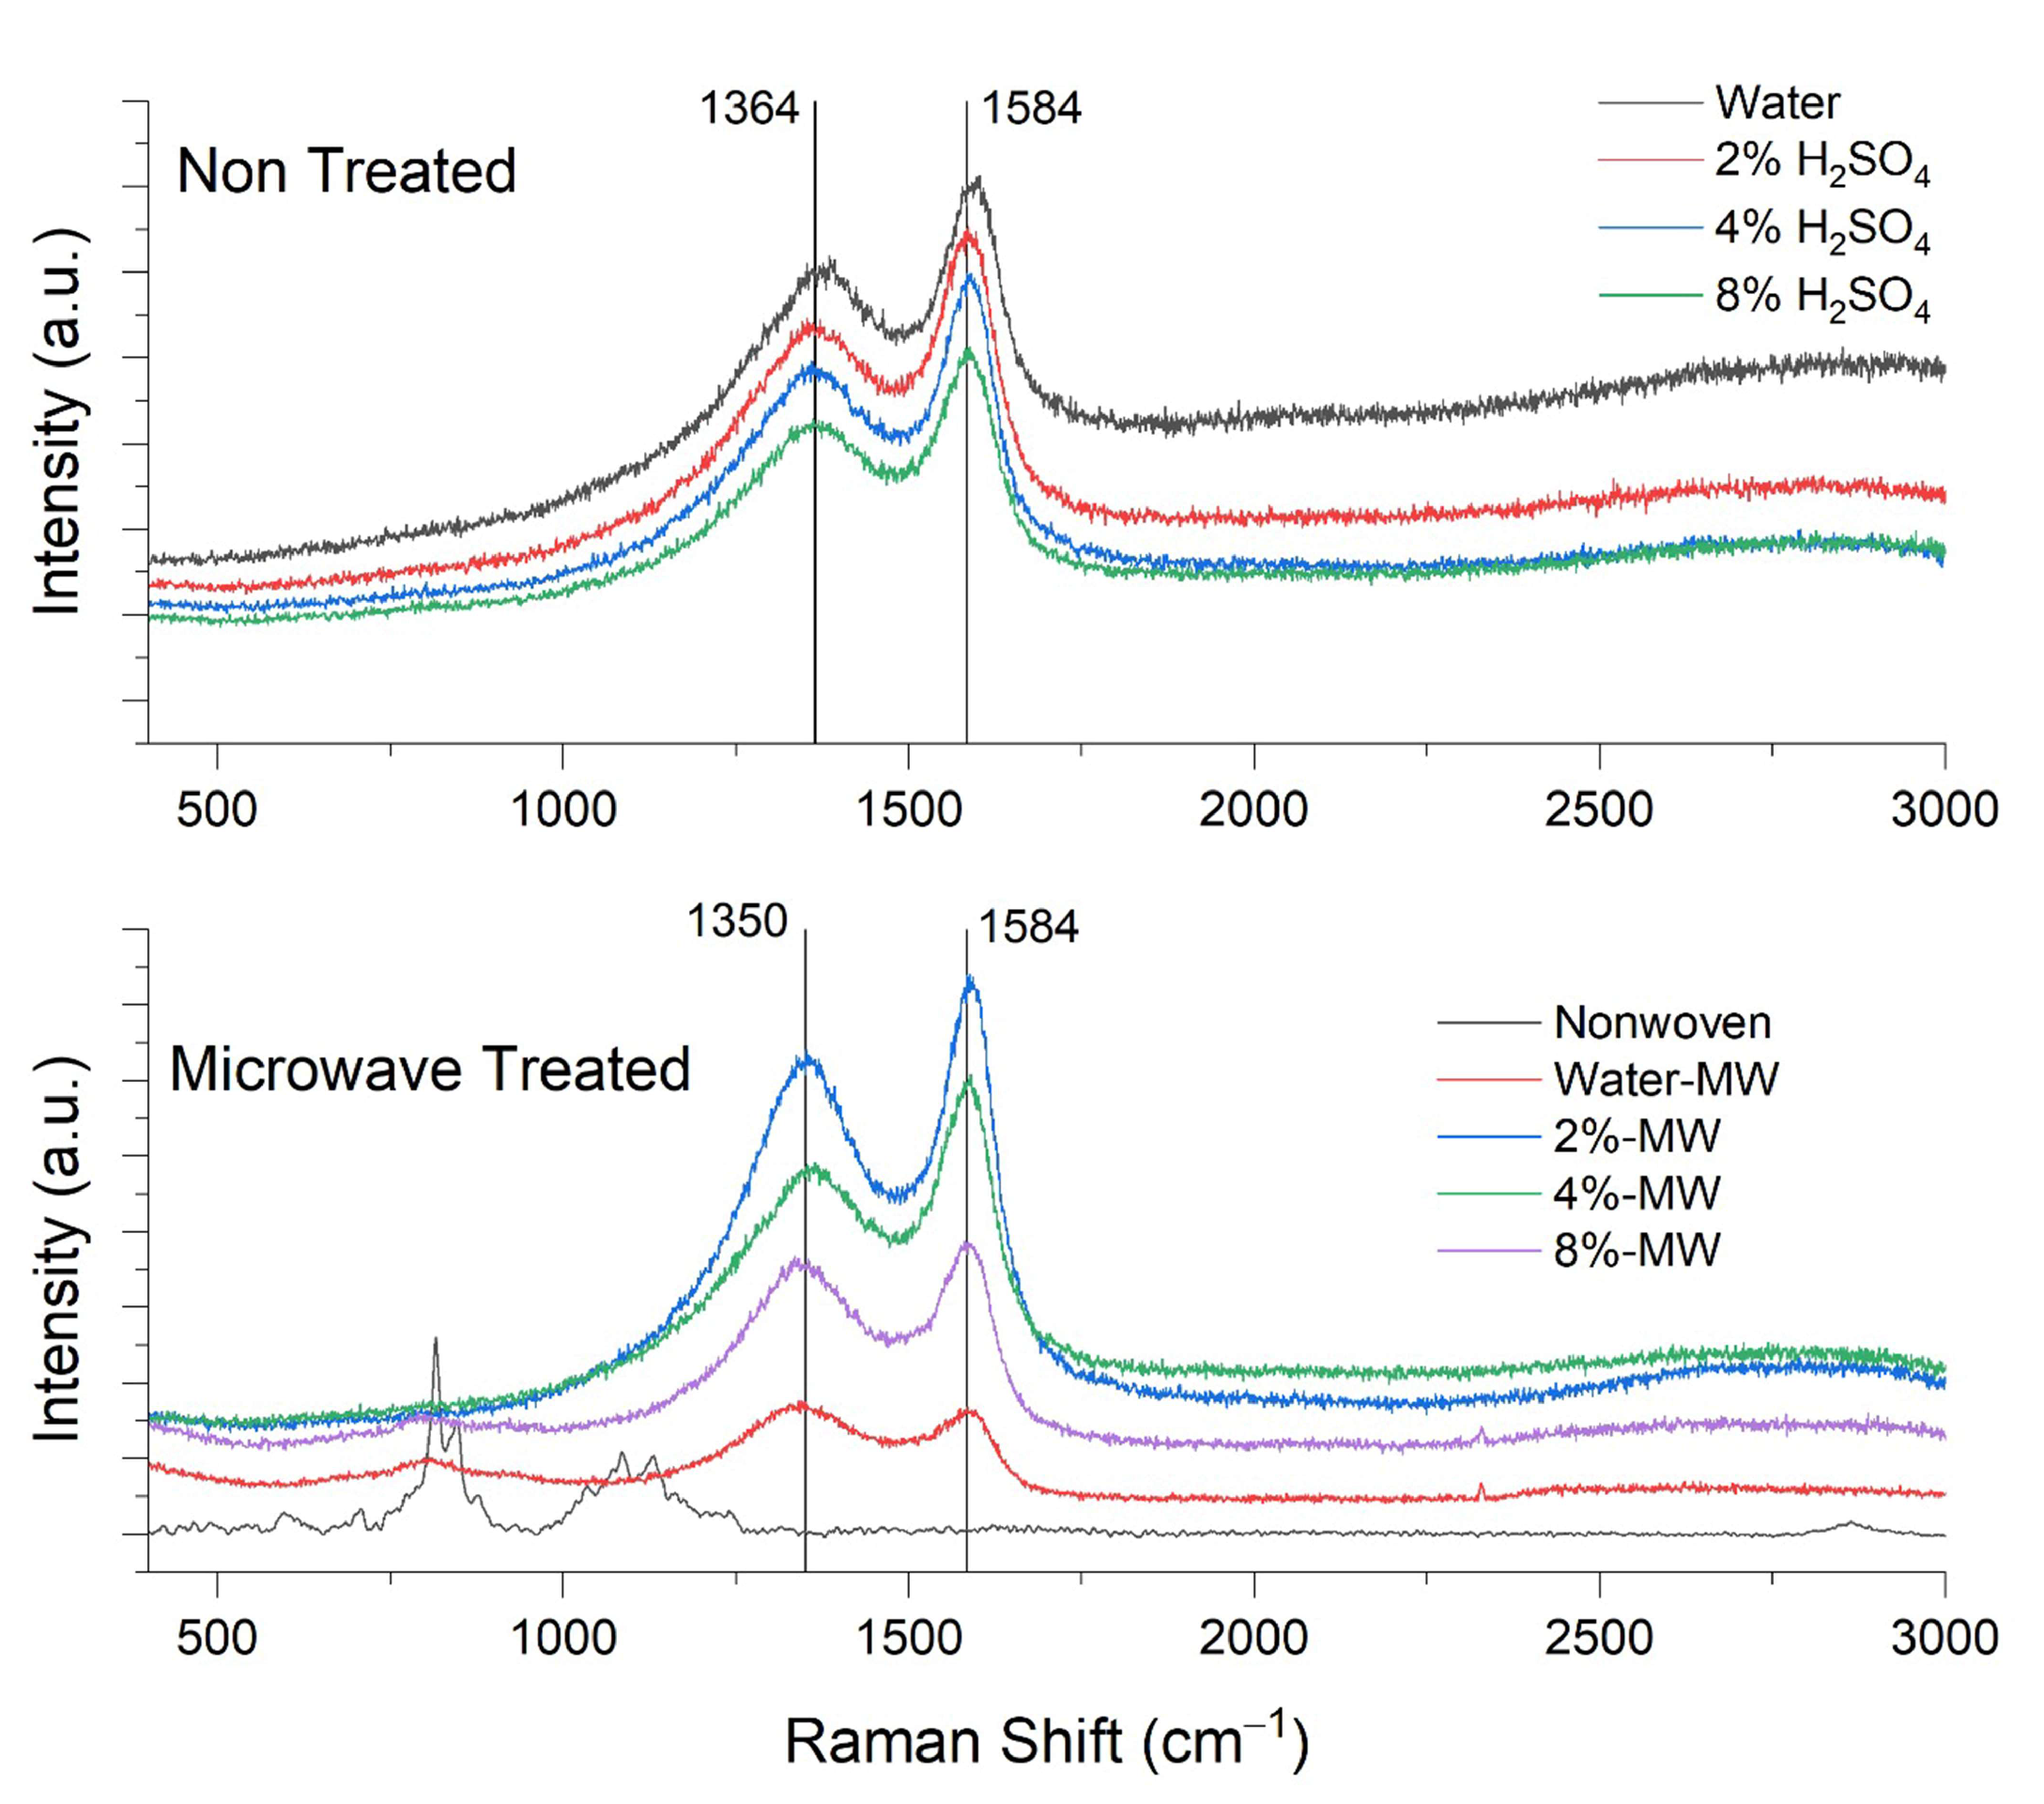
3.1. Raman Analysis
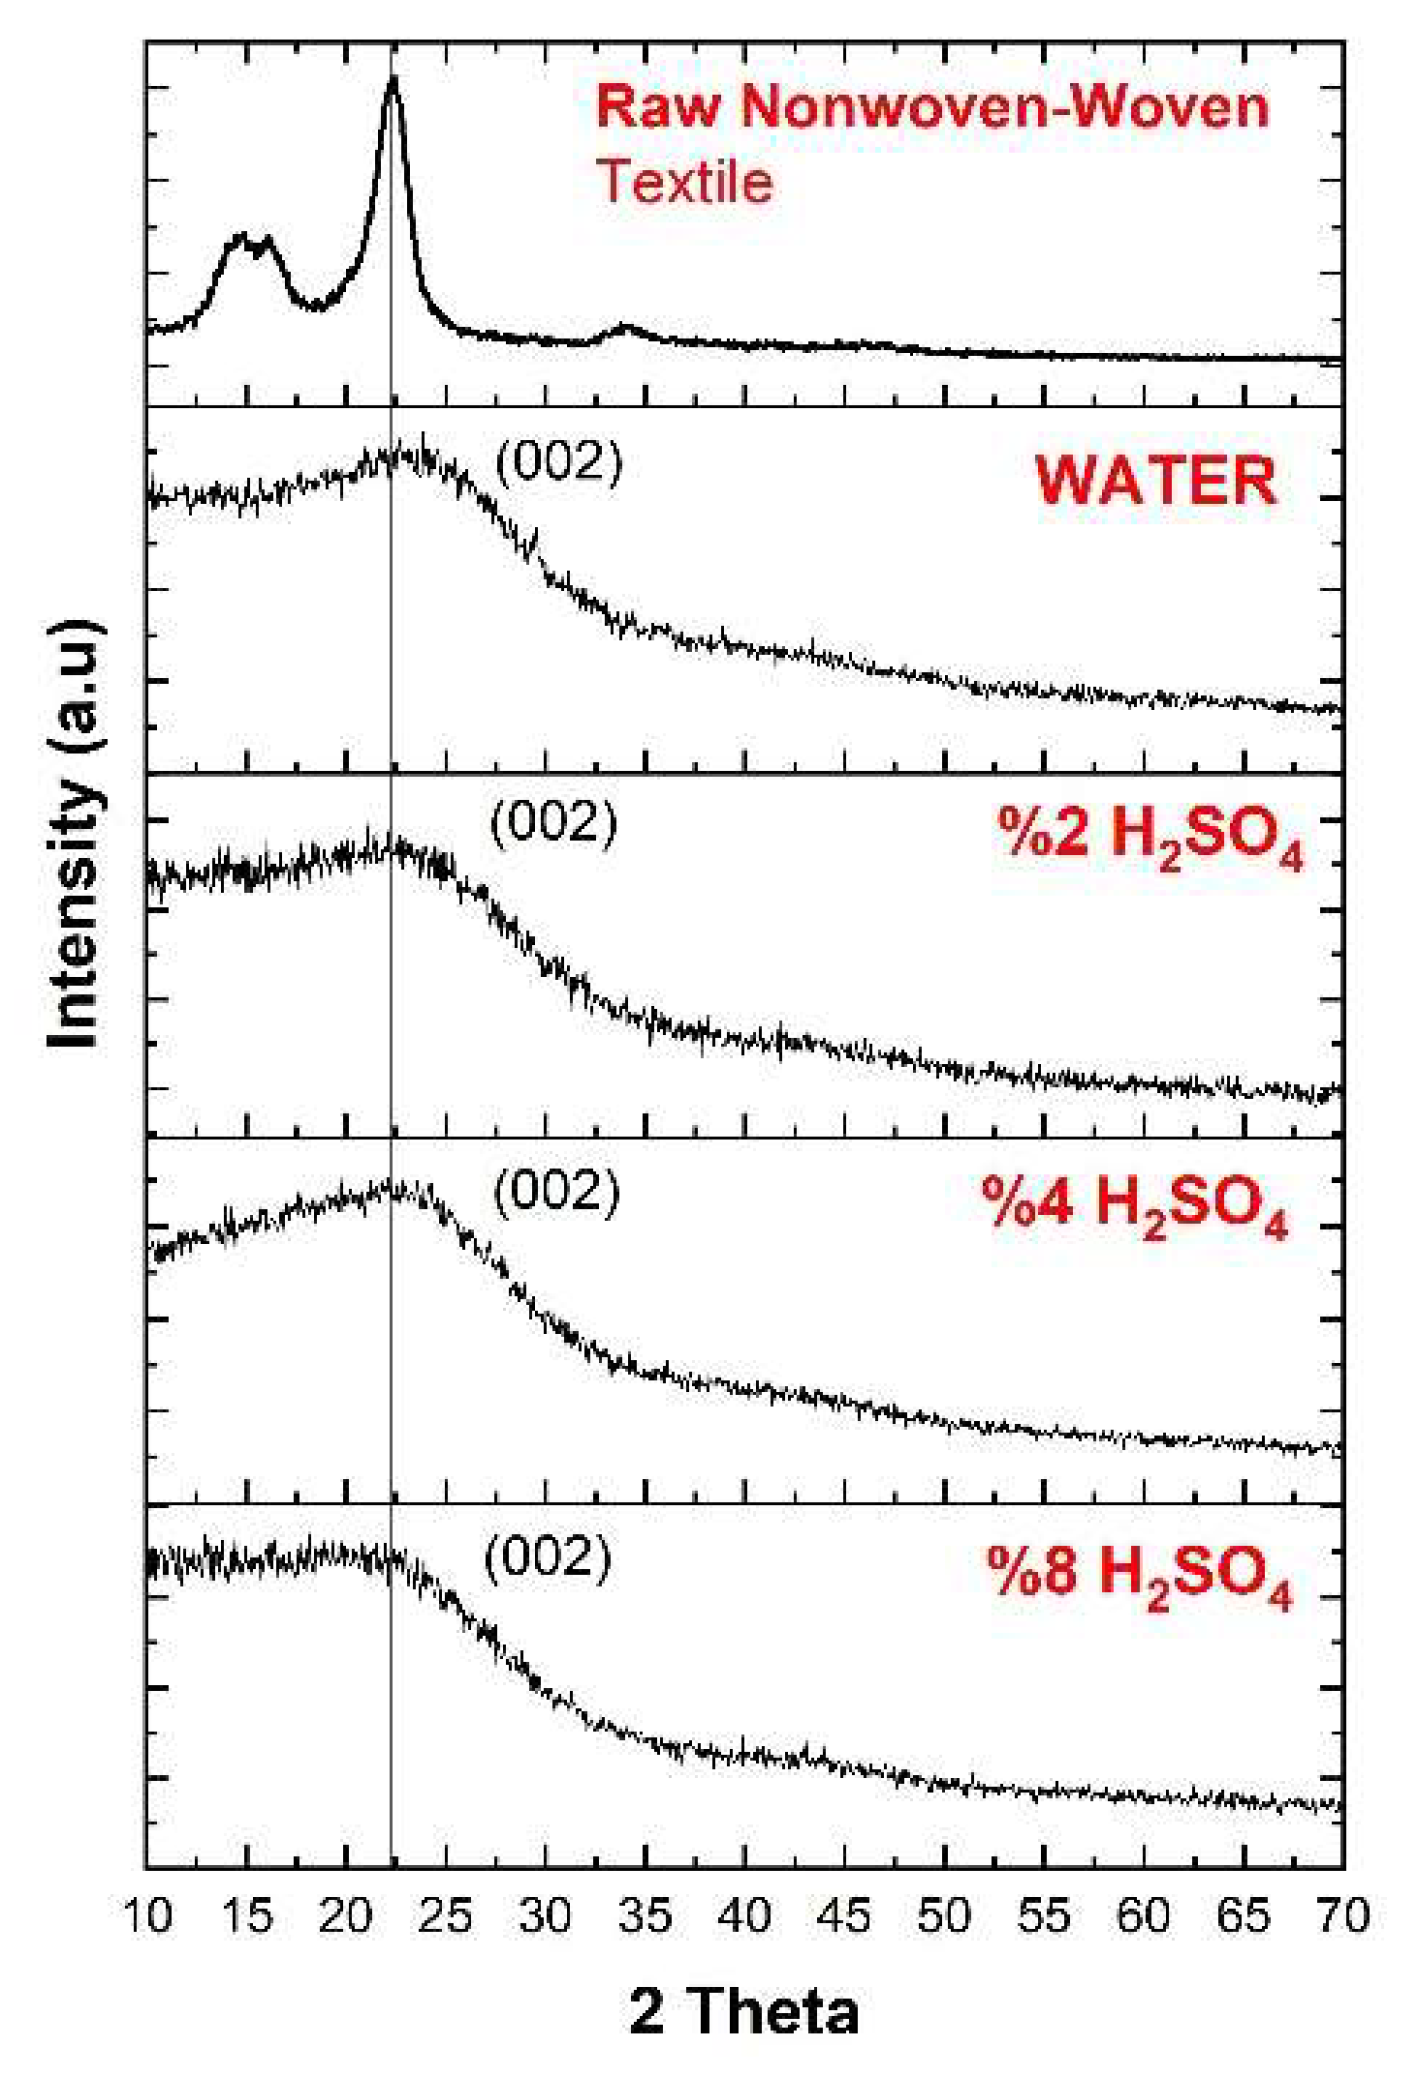
3.2. XRD Analysis
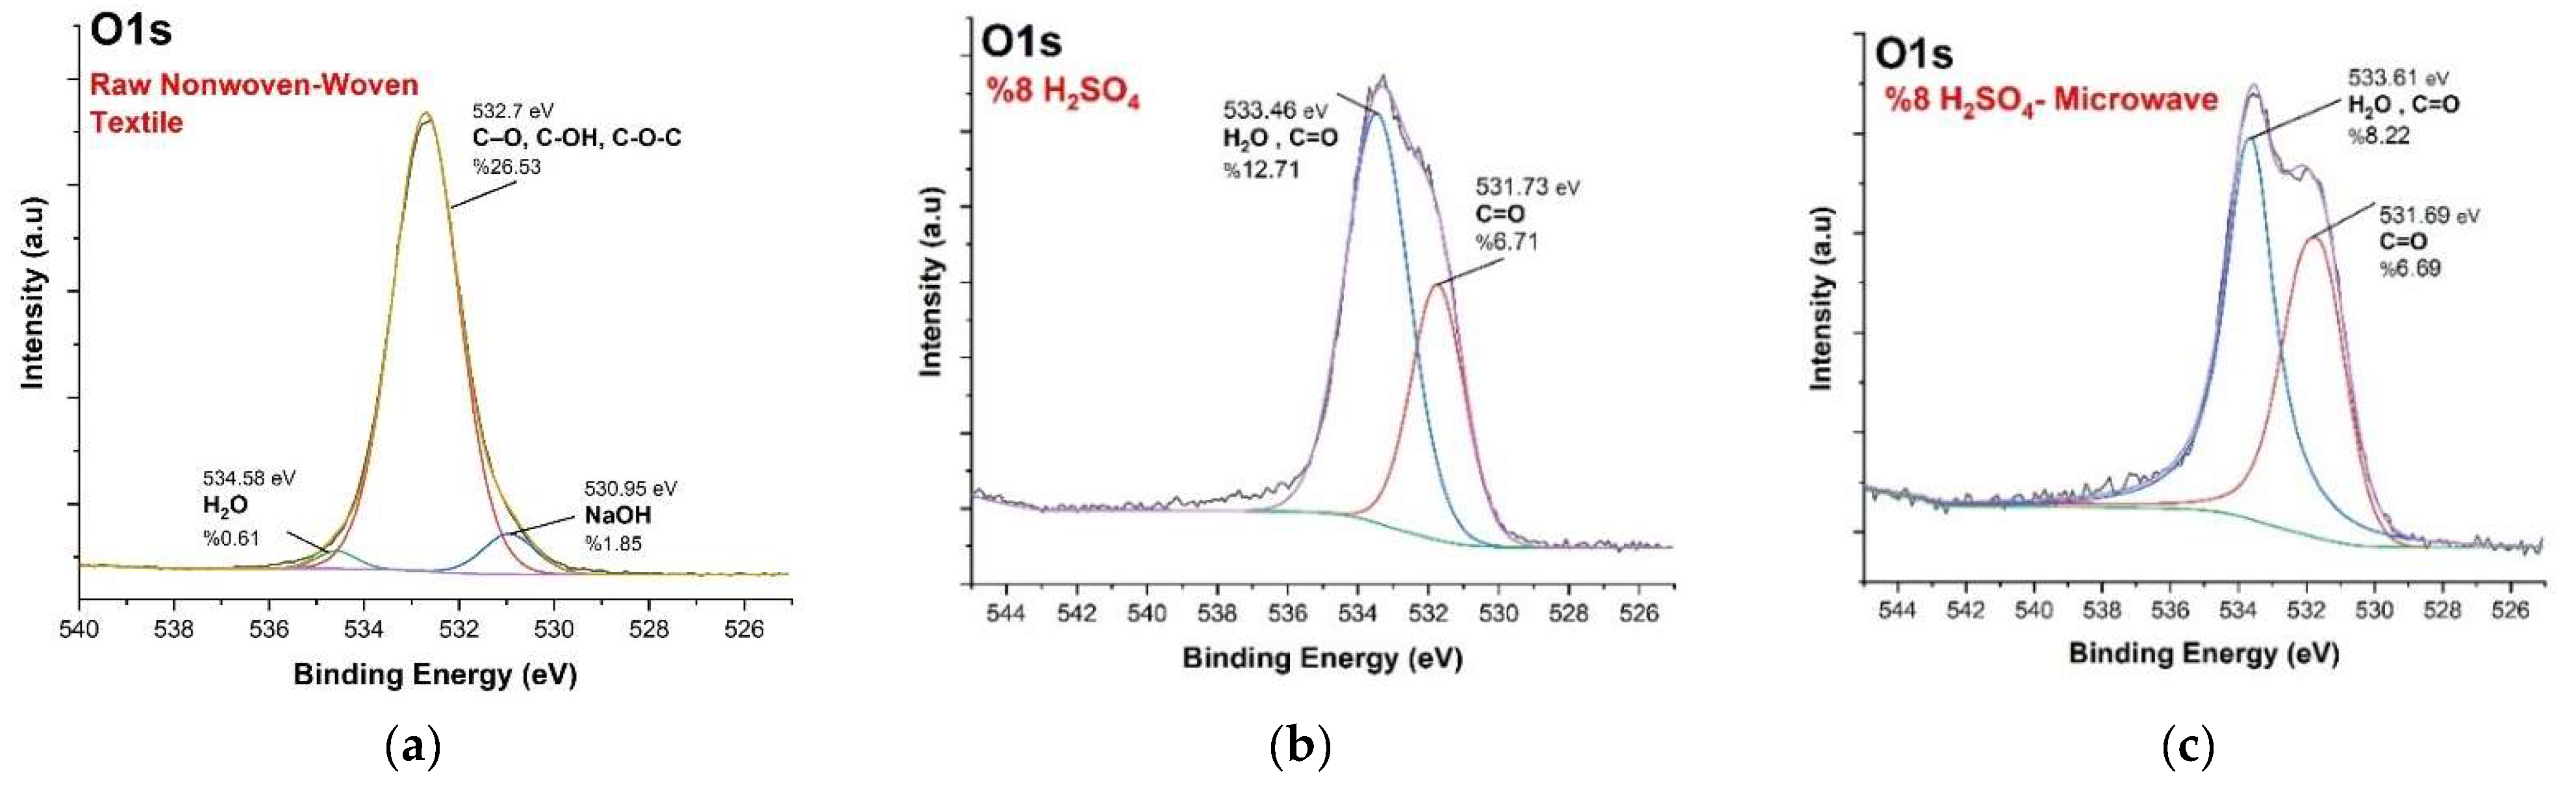
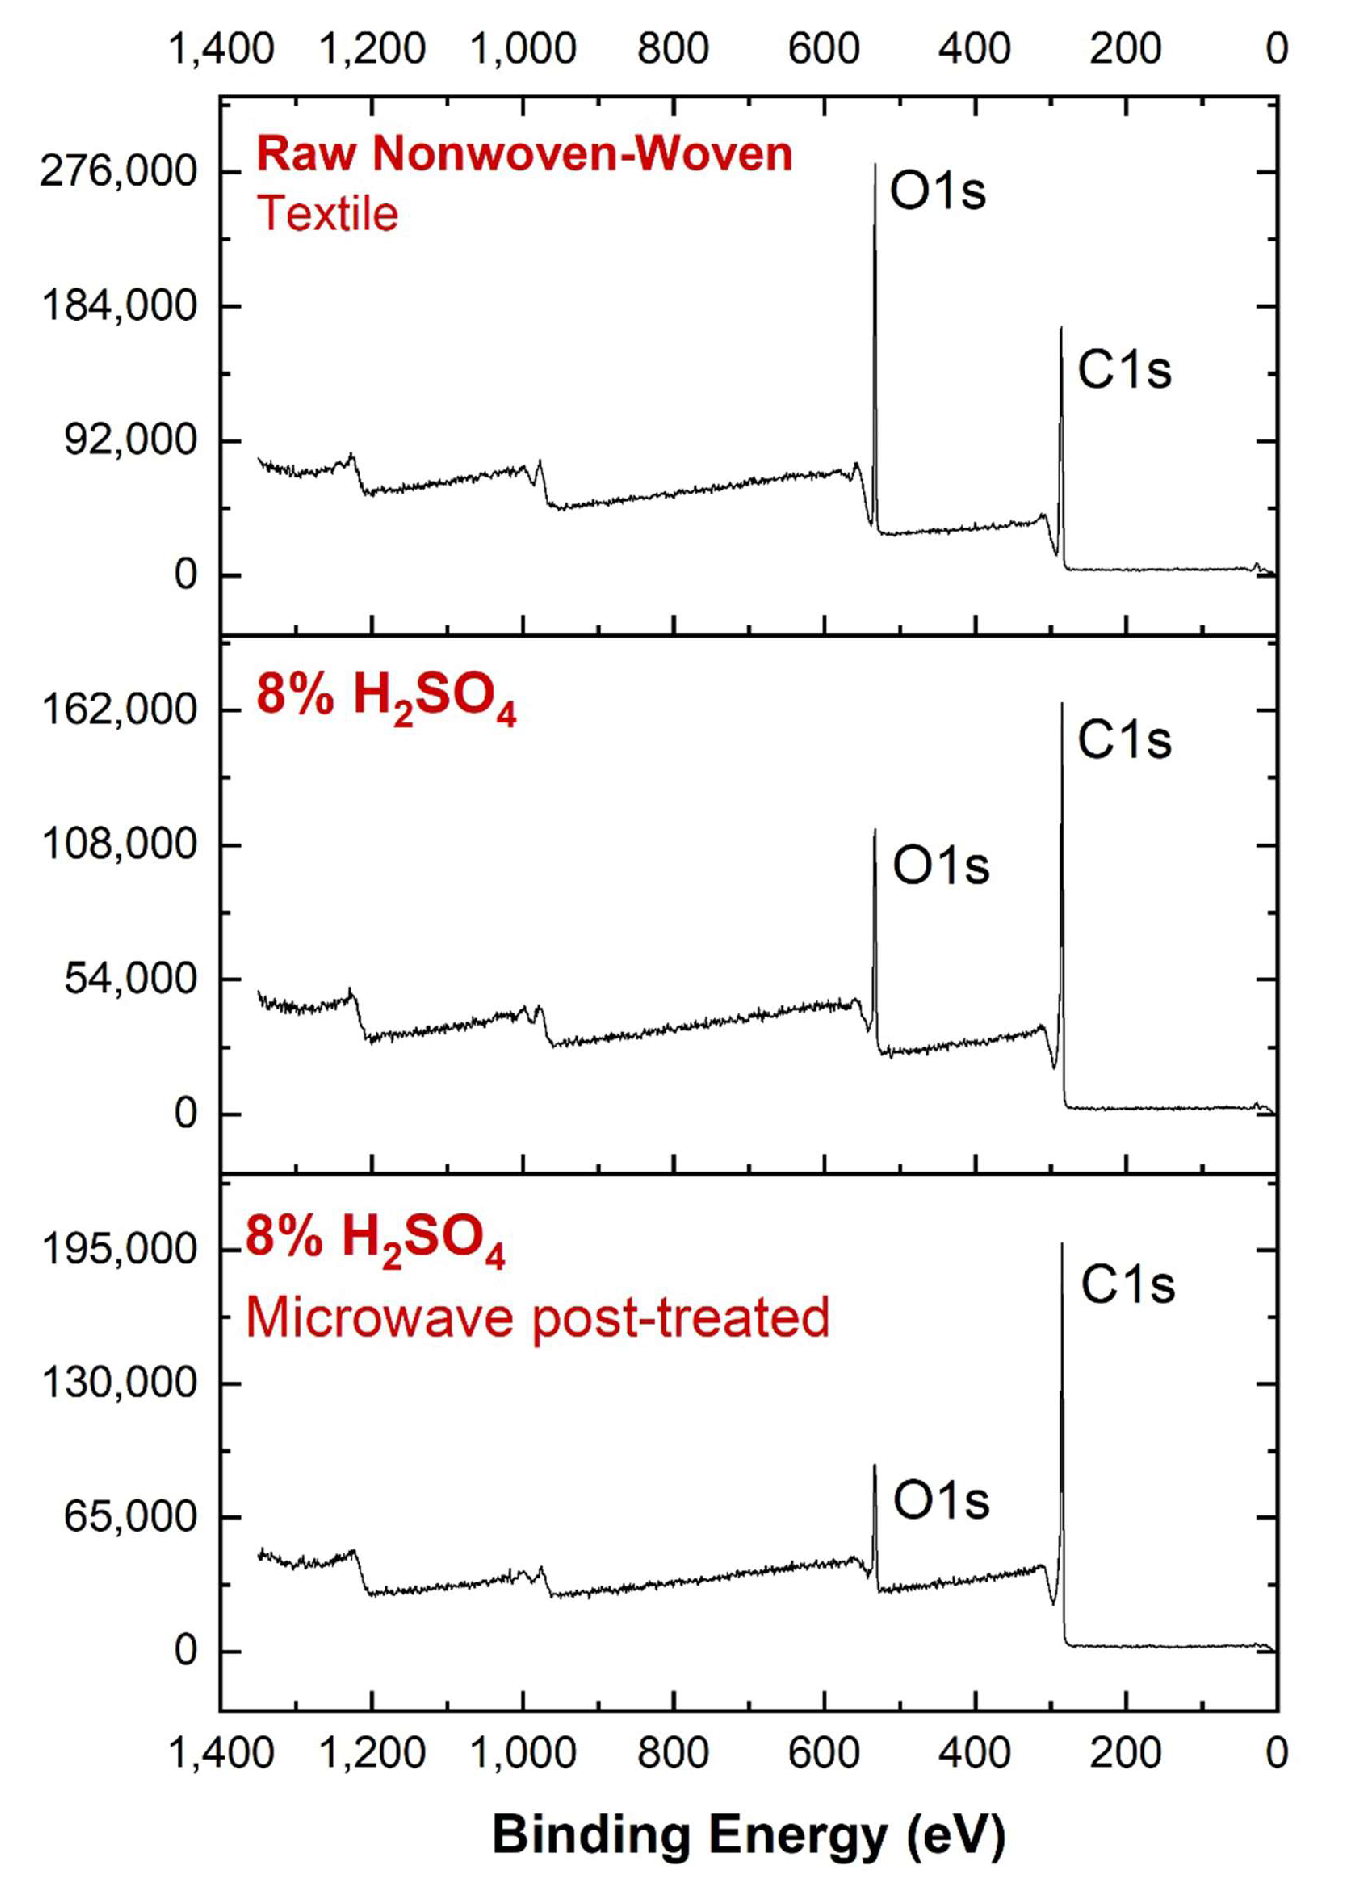
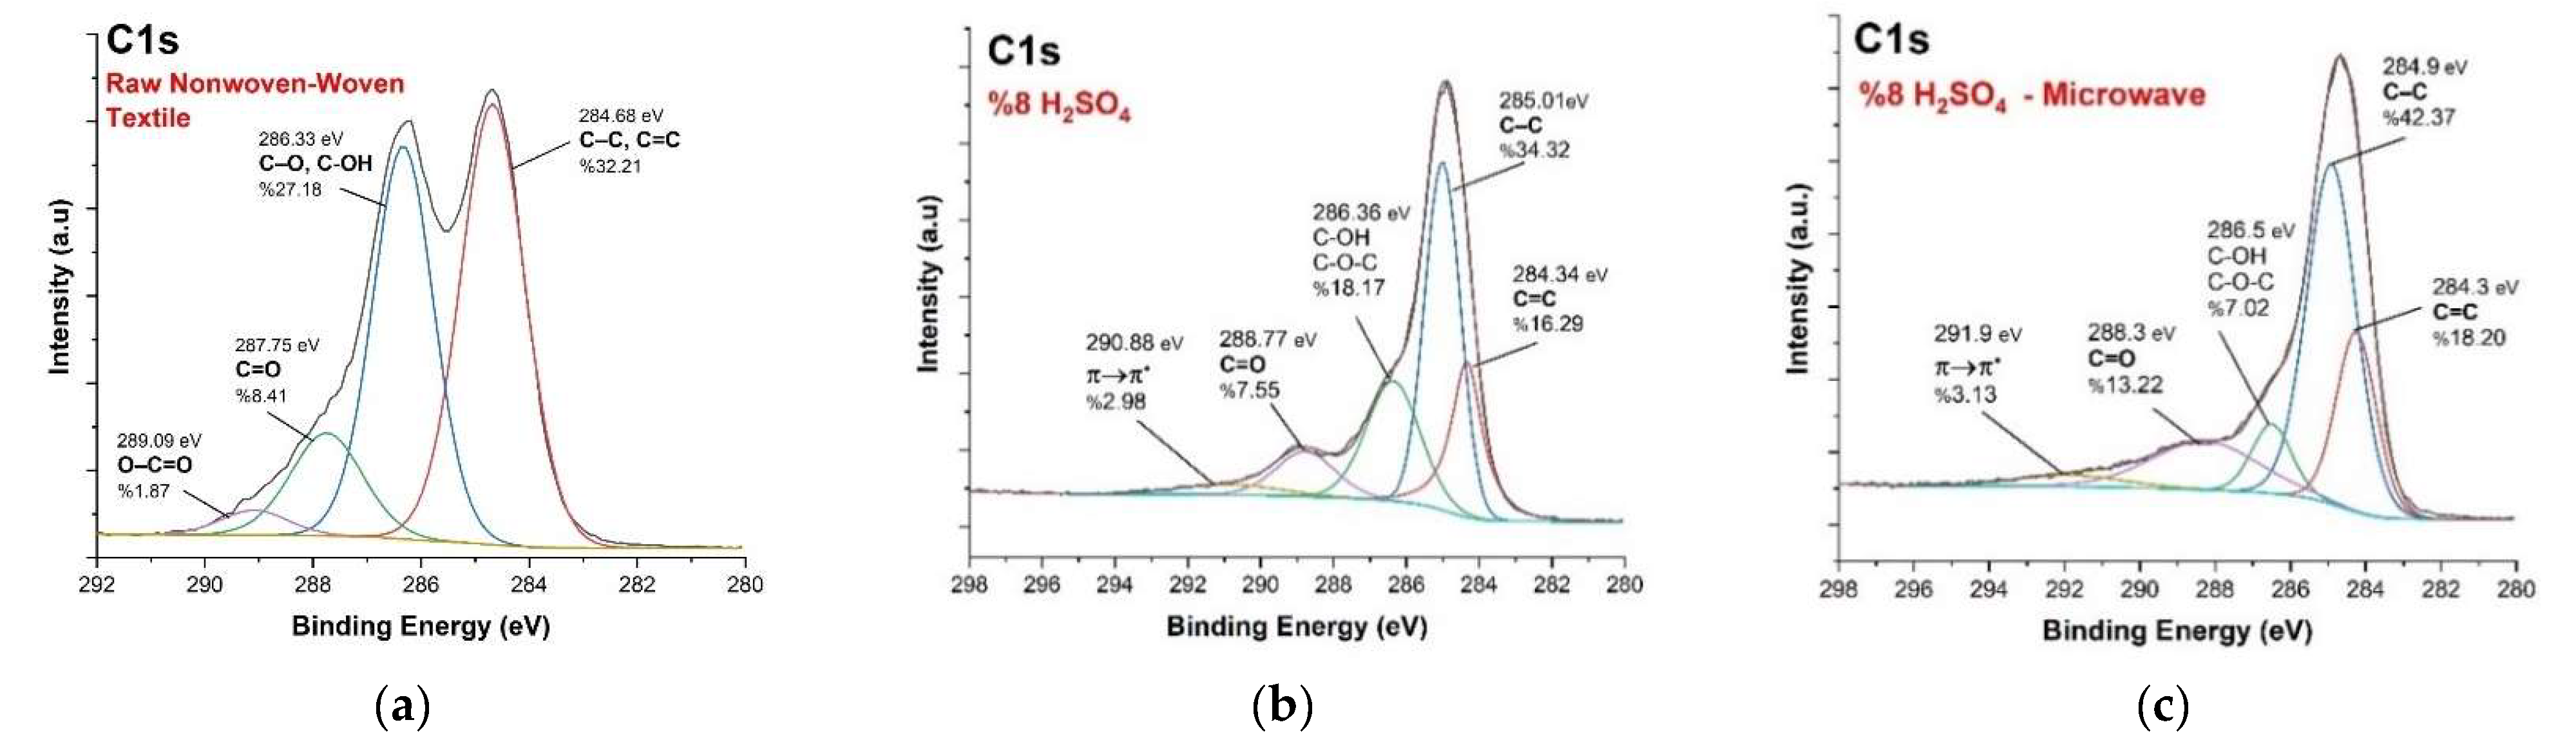
3.3. XPS Analysis
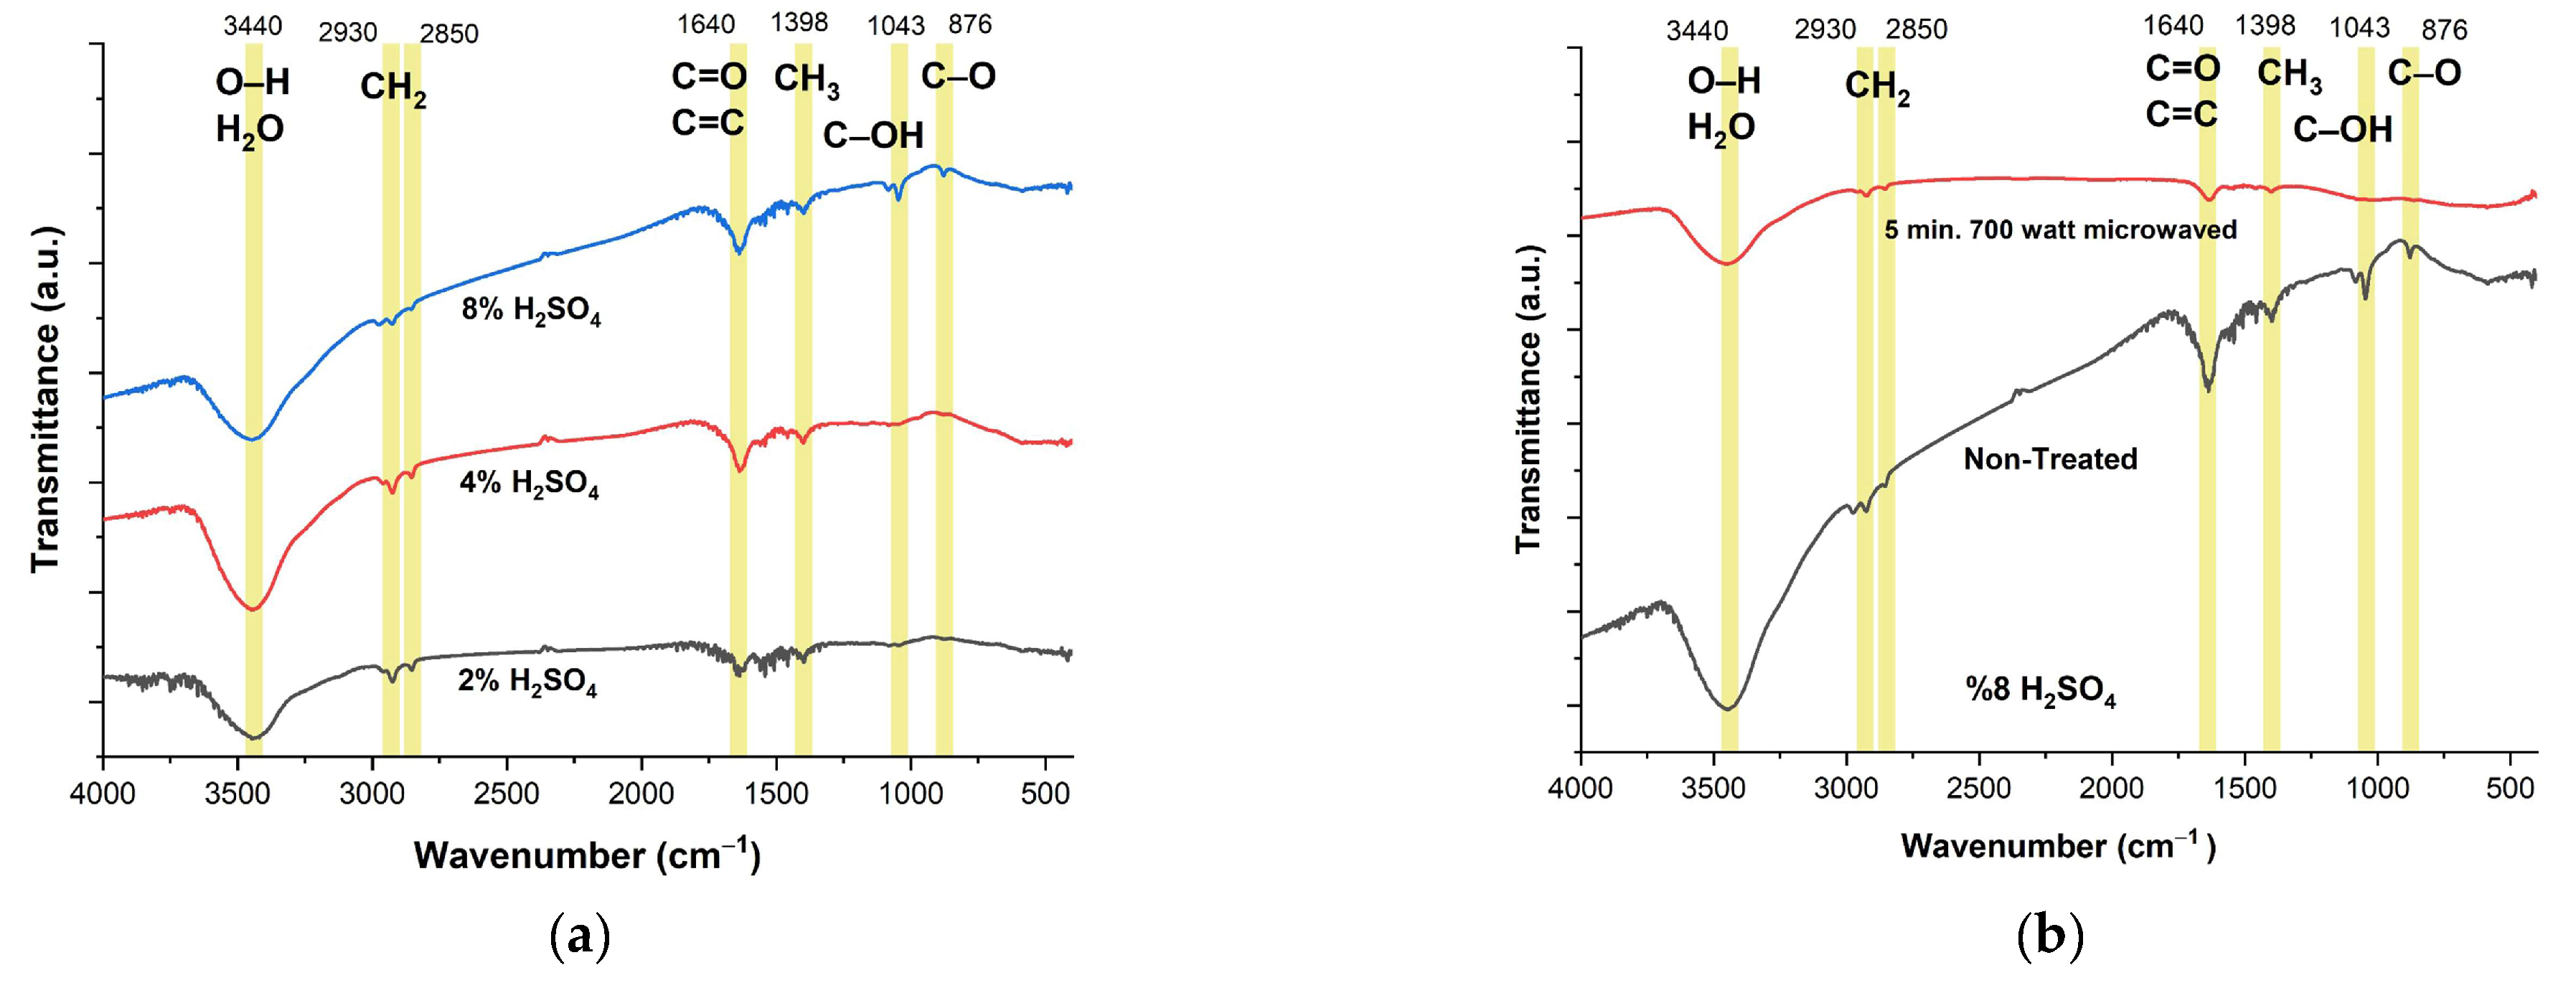
3.4. FT-IR Analysis
3.5. TGA Analysis
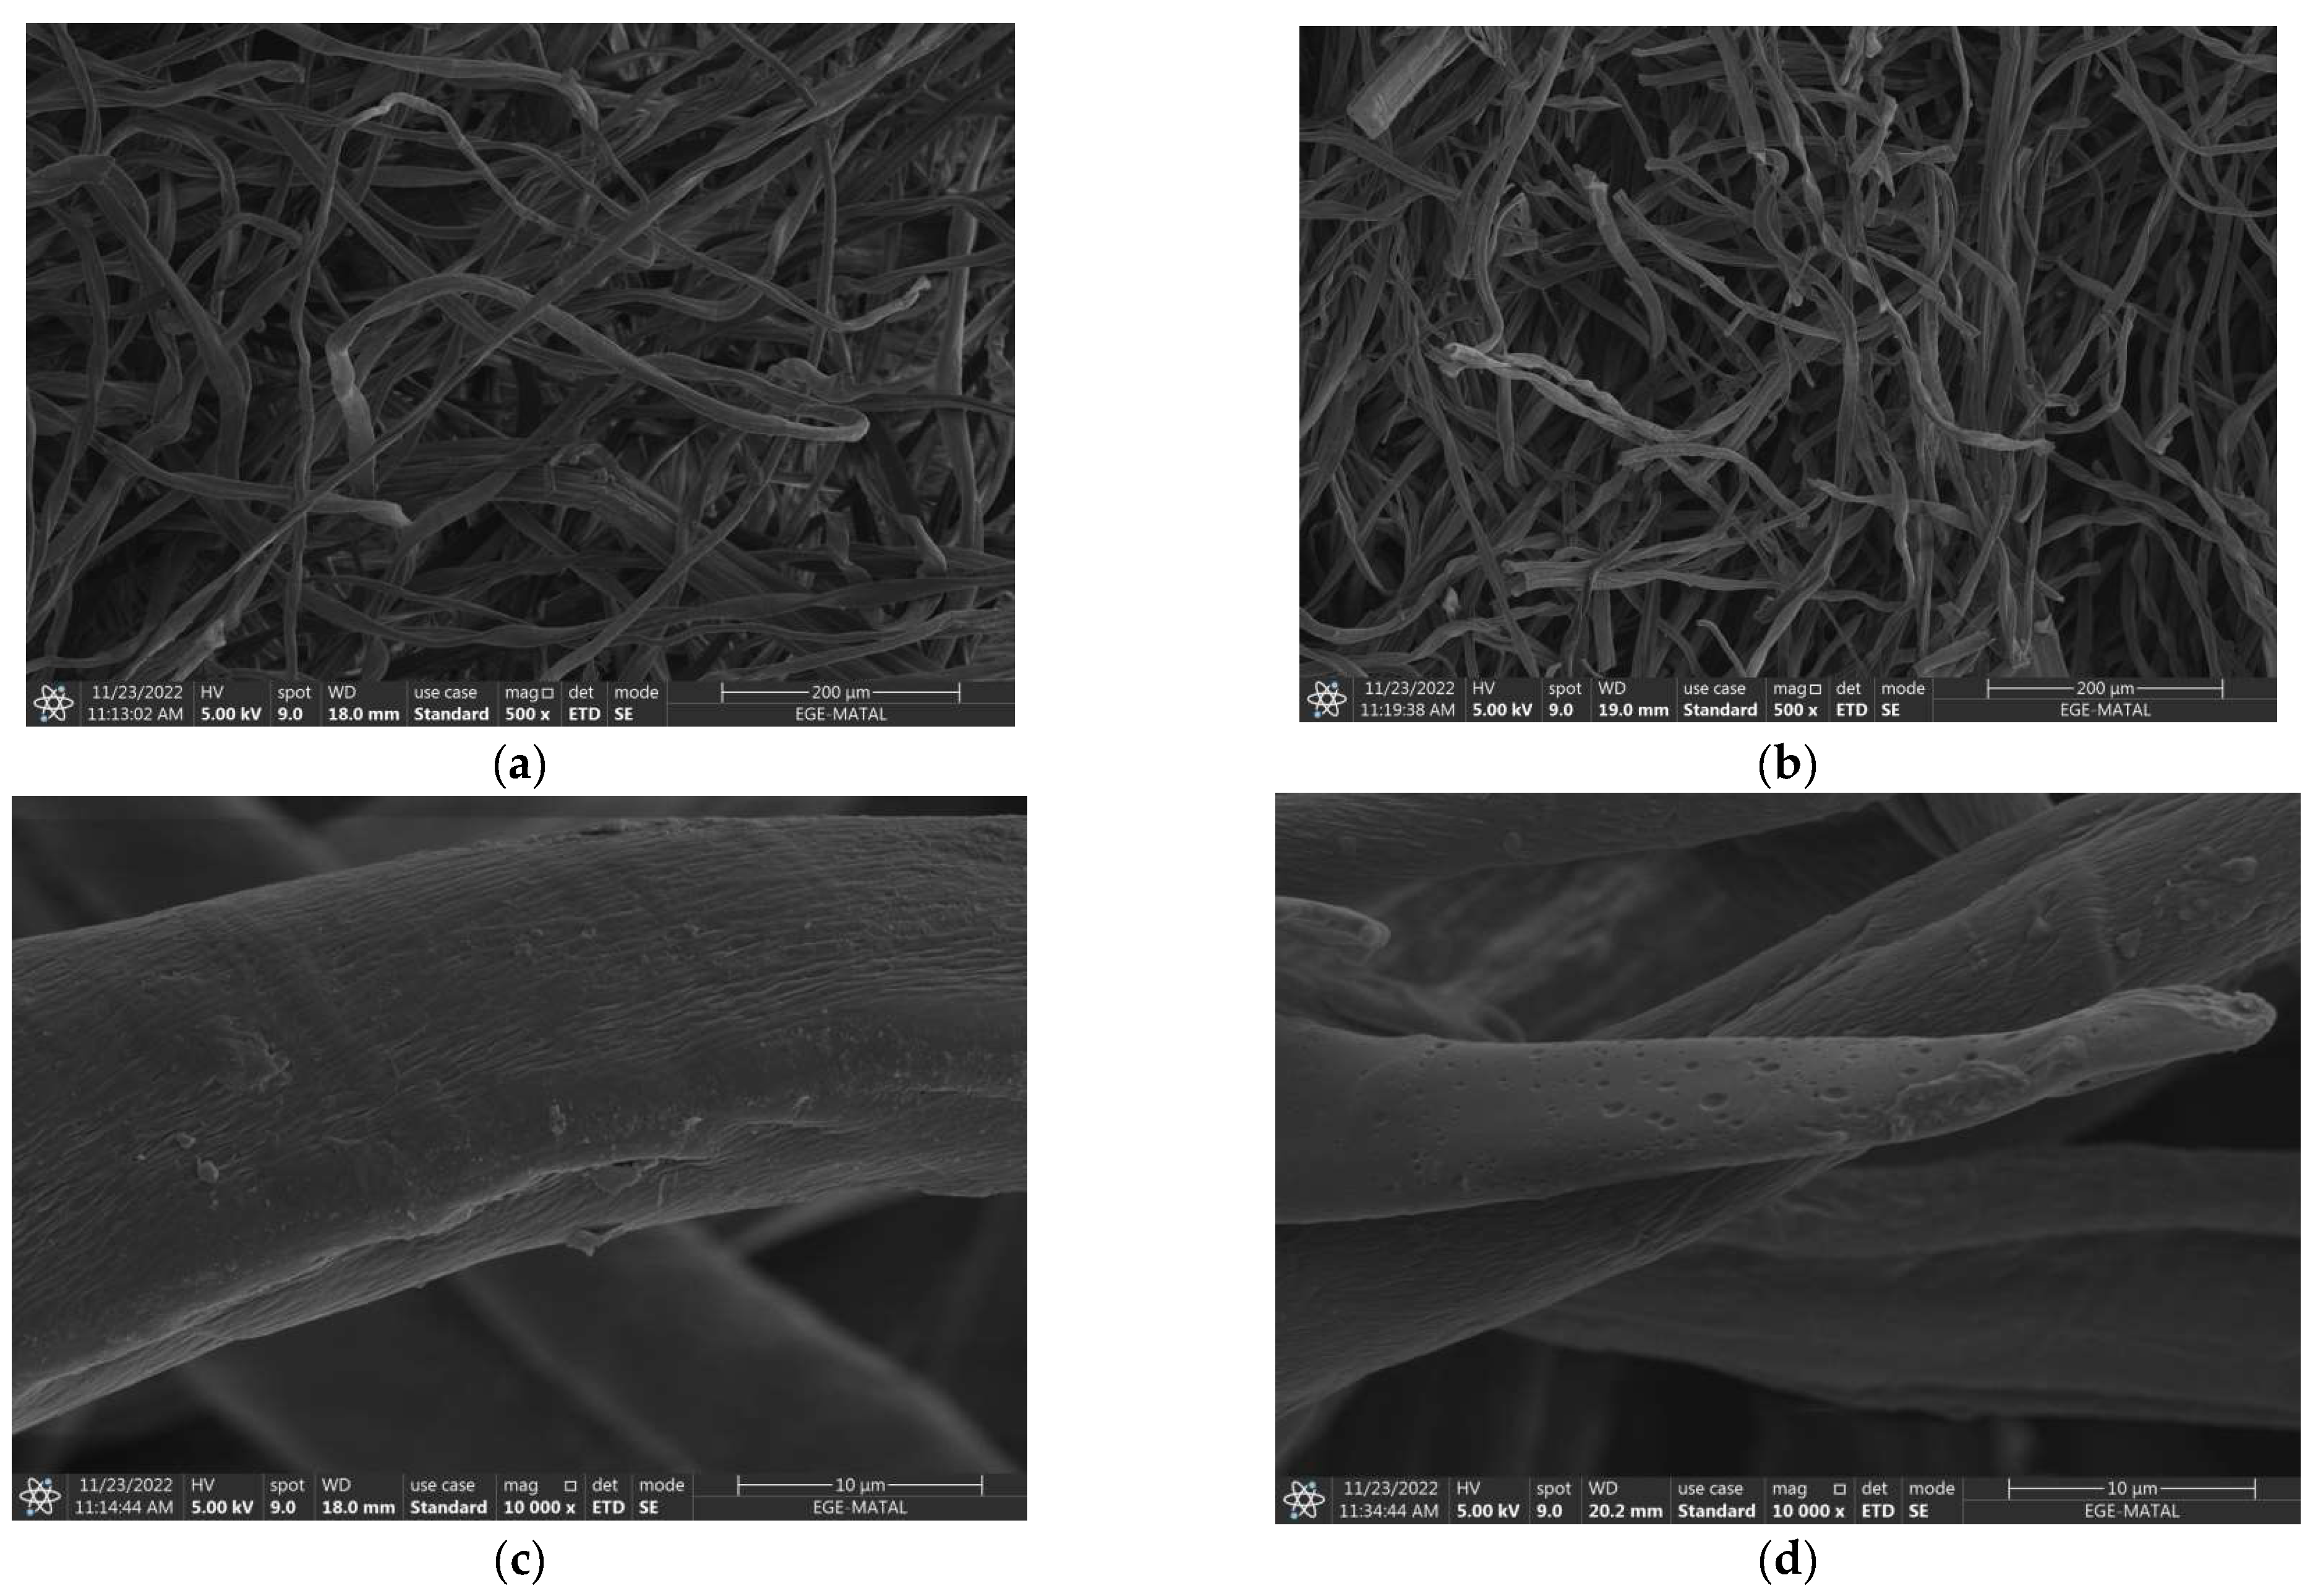
3.6. SEM Analysis
3.7. Yield, BET, Elemental-CHNS and Conductivity
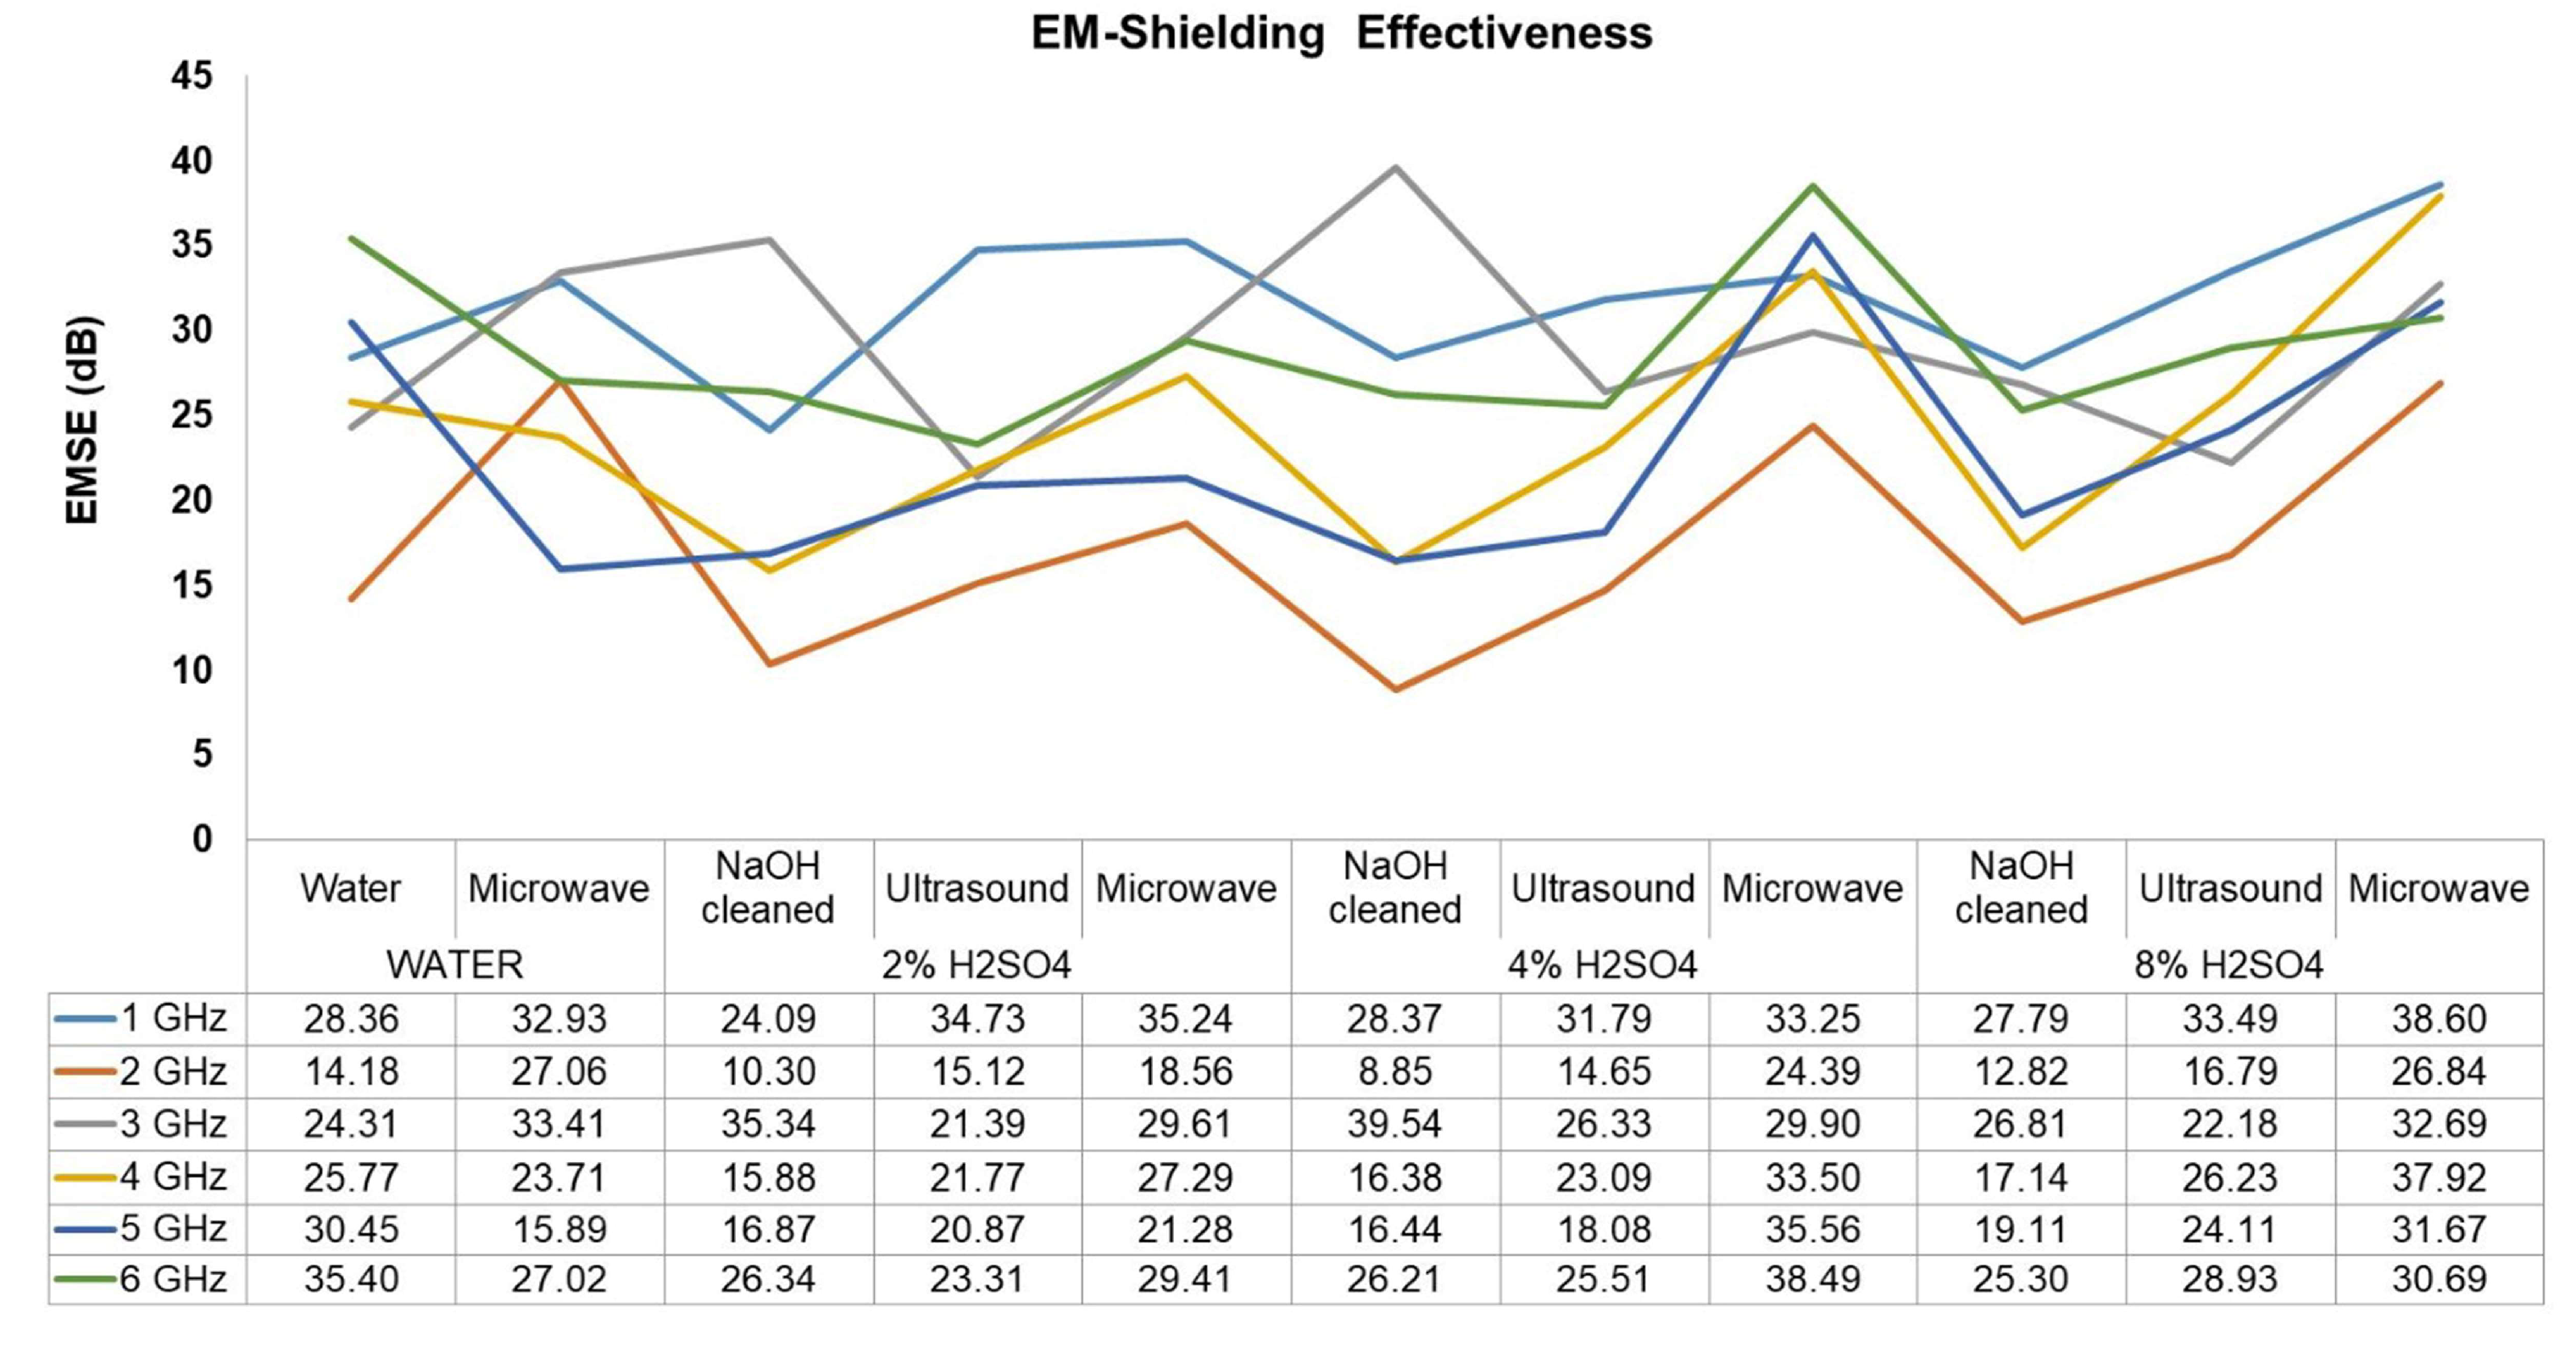
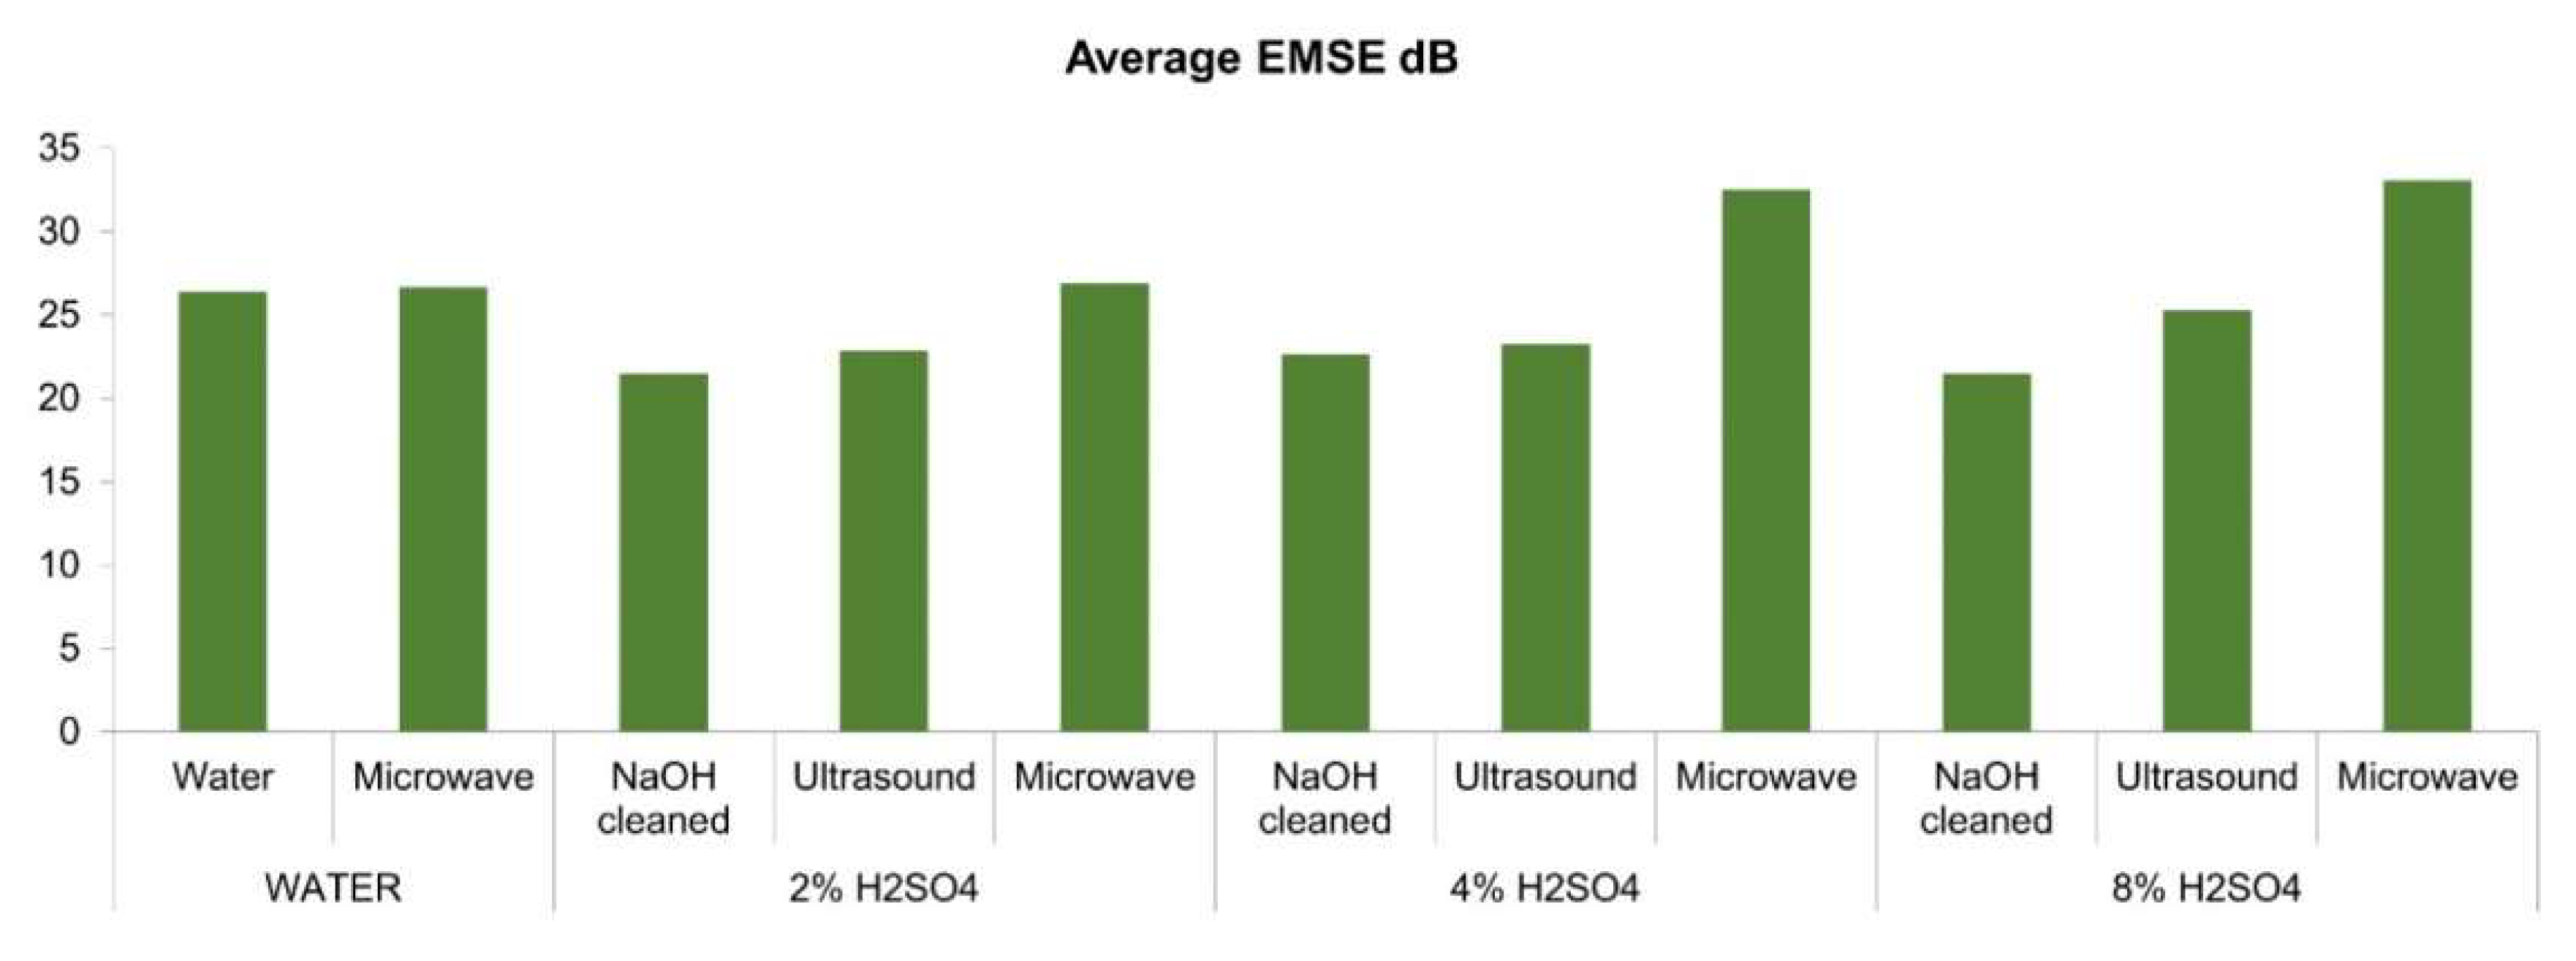
3.8. Measurements of Electromagnetic Shielding
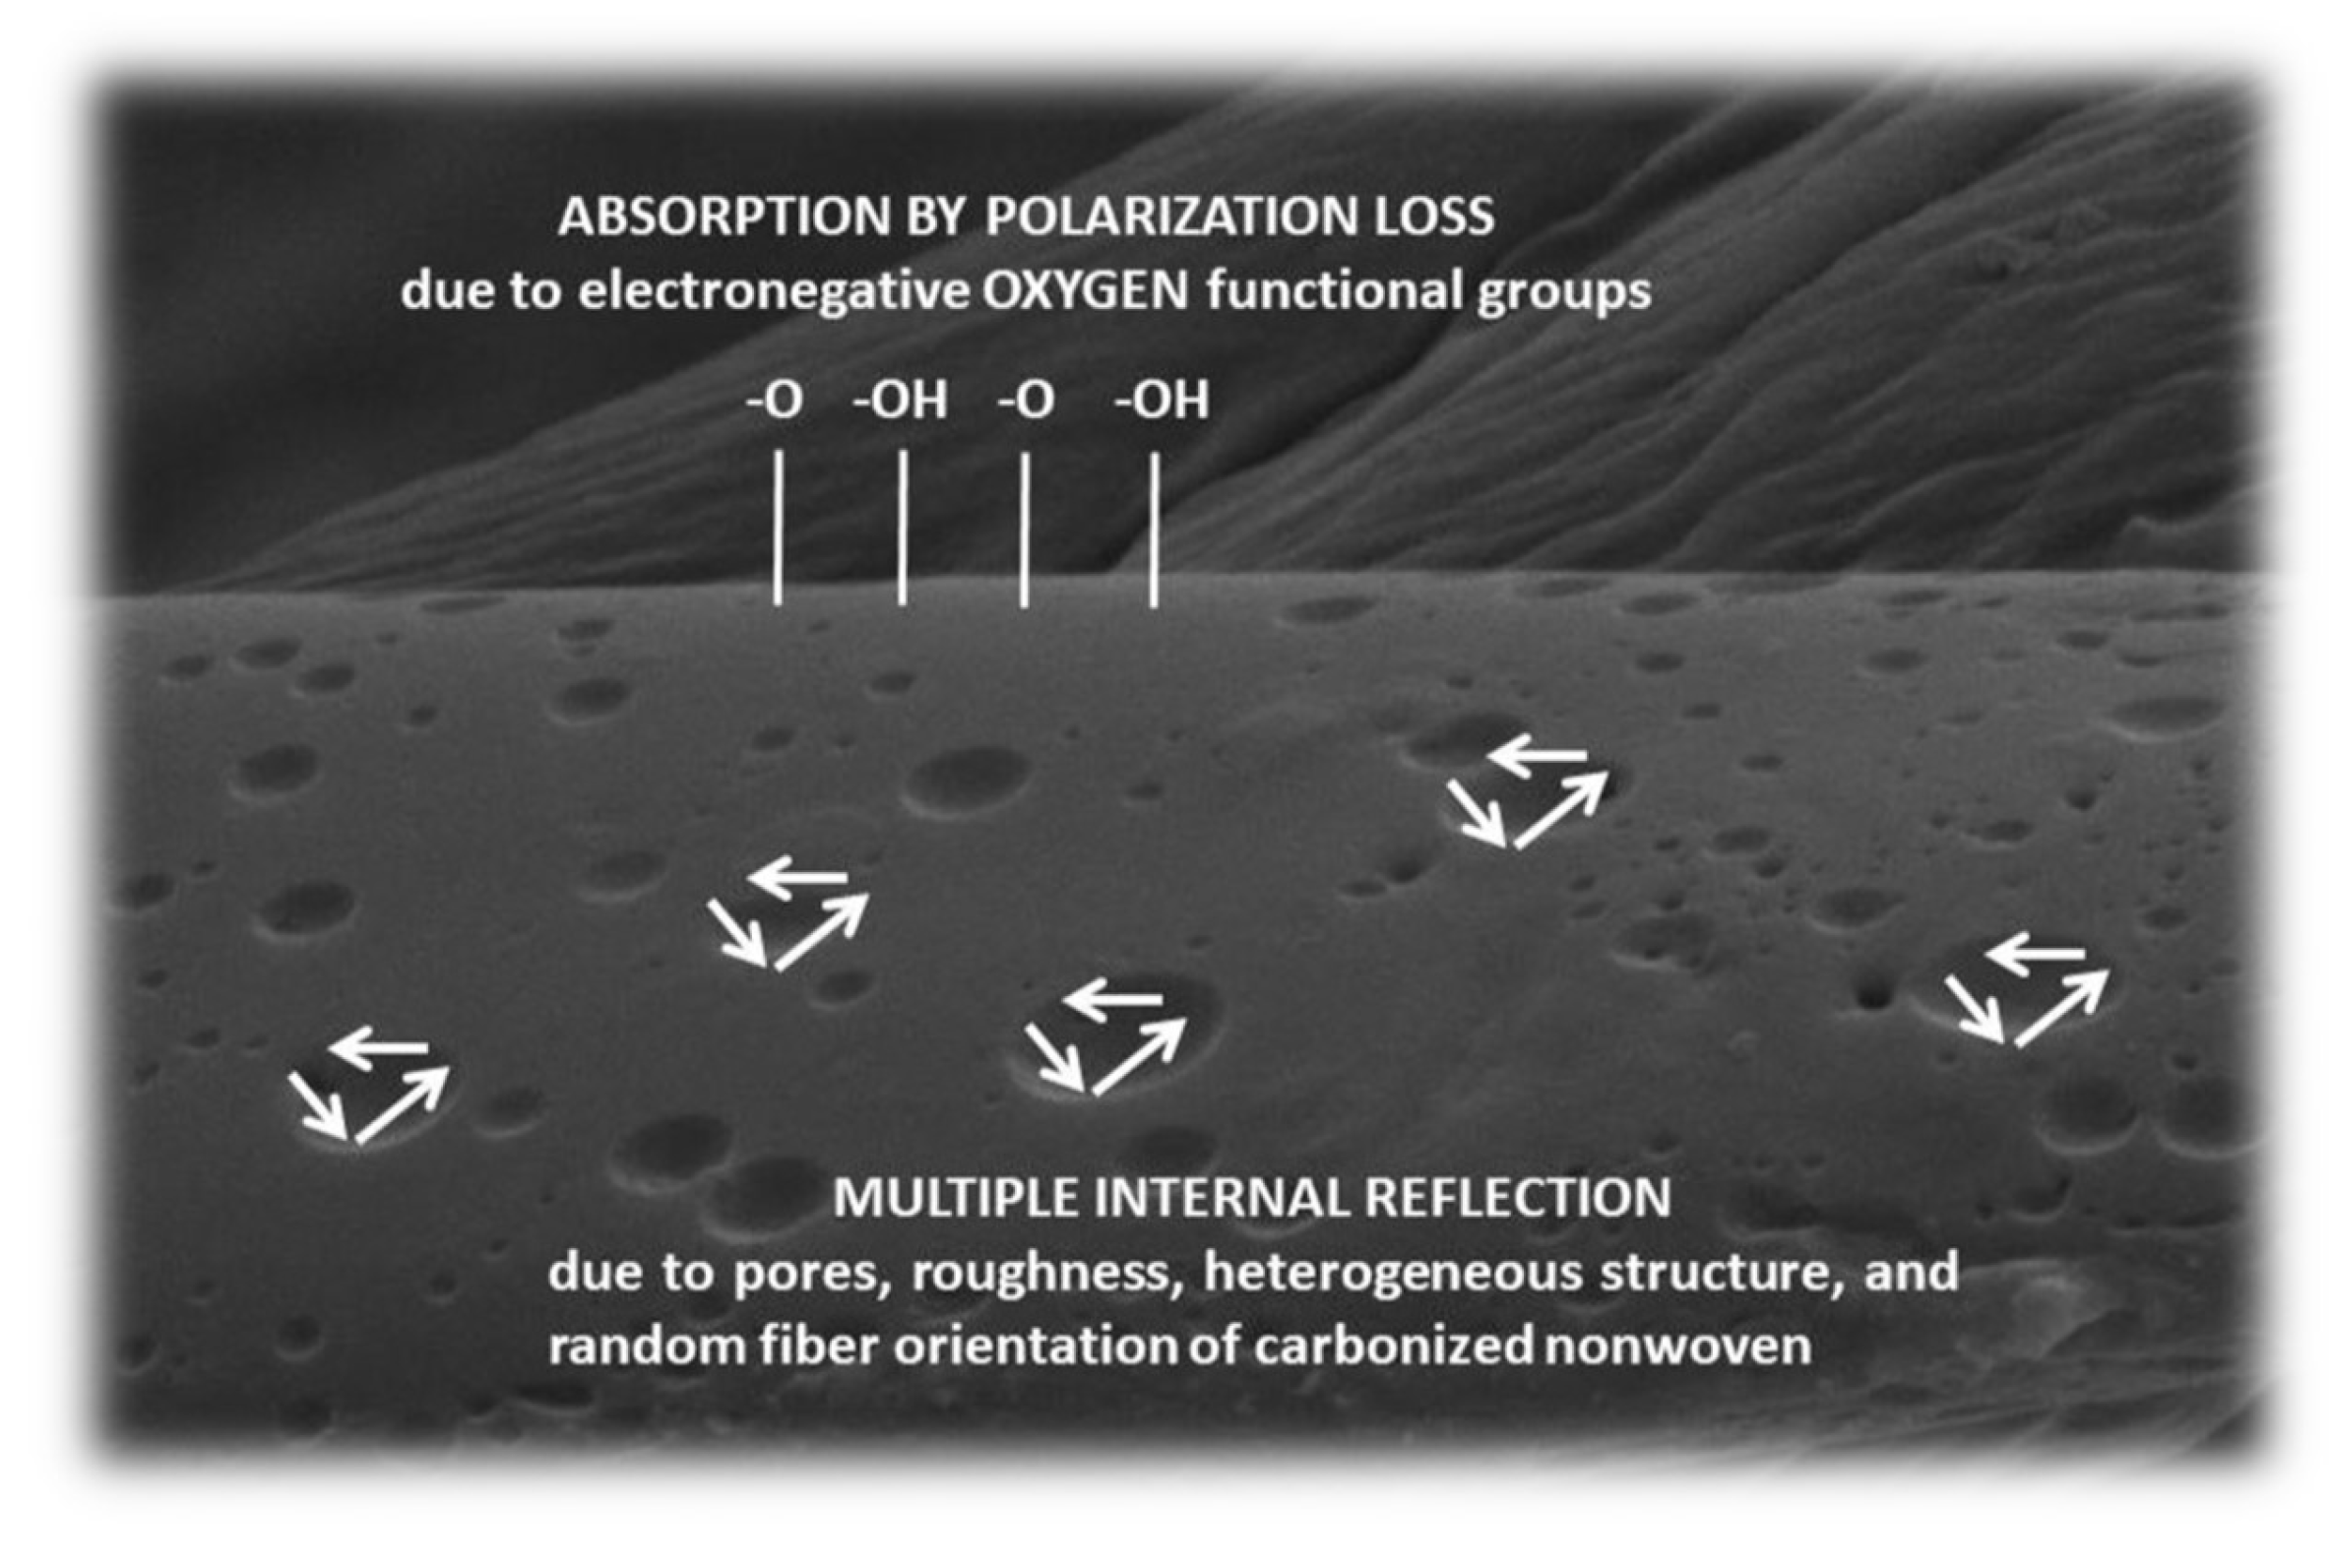
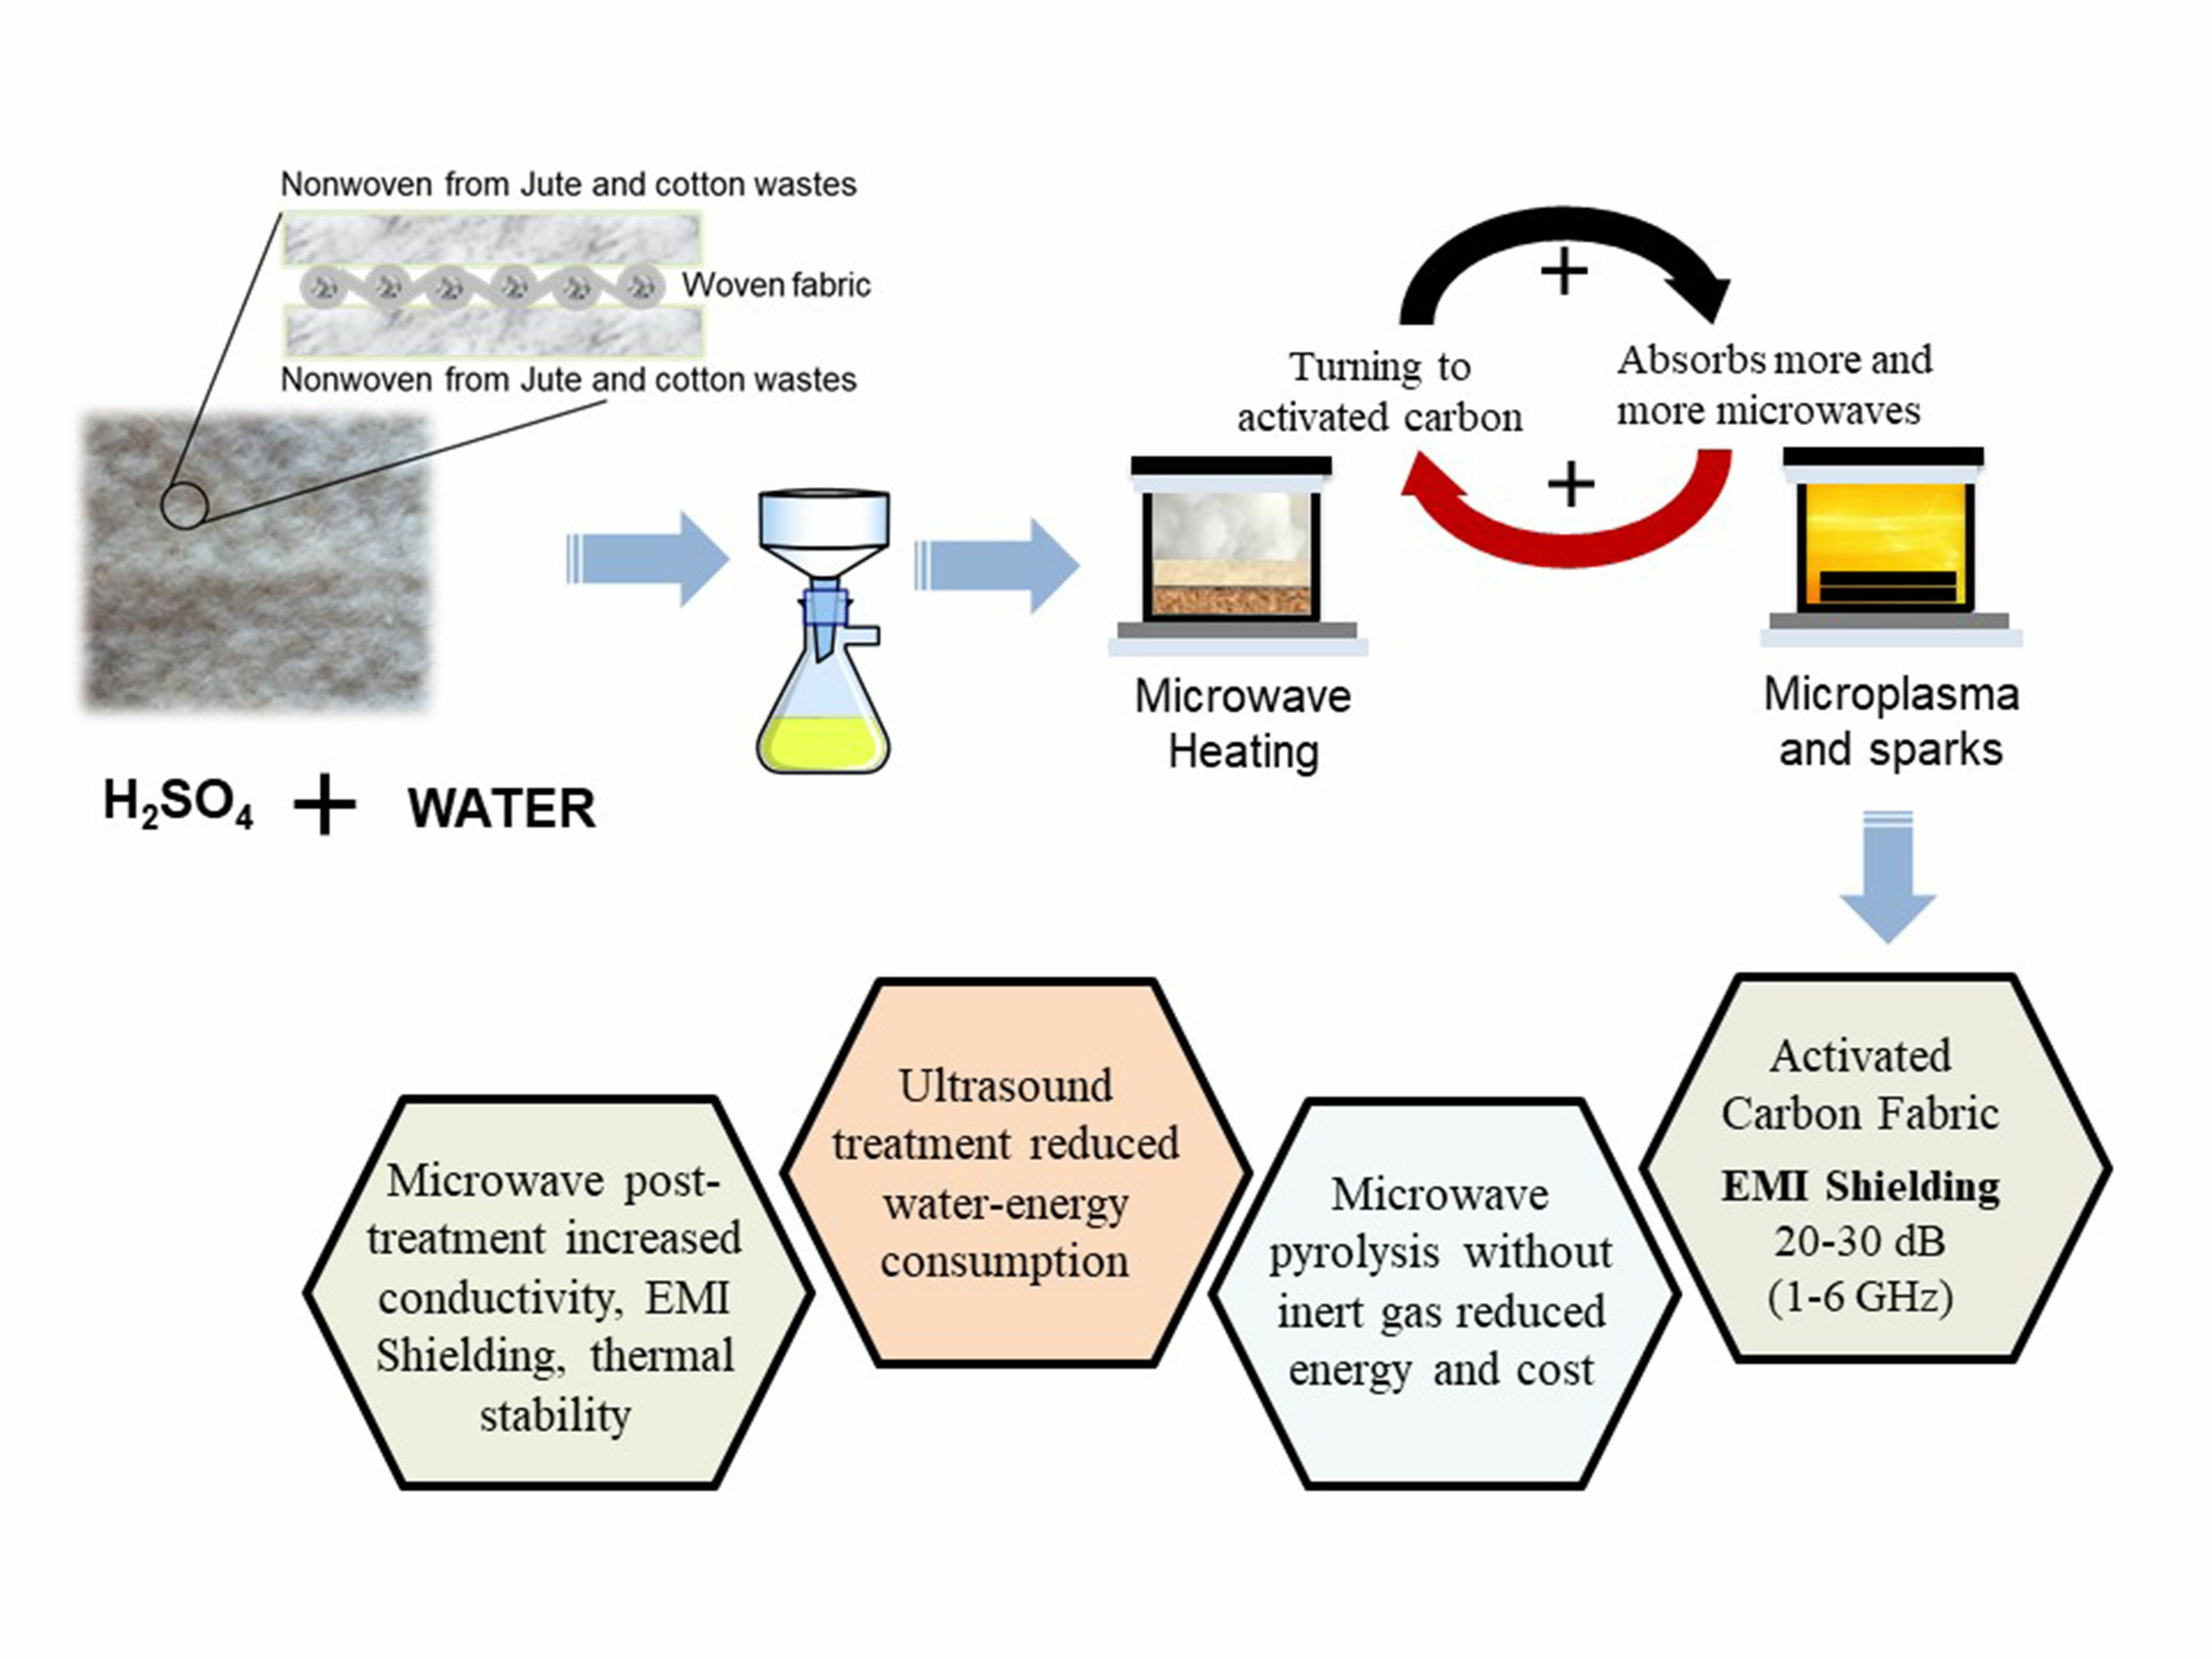
- As acid concentration increases, pore numbers and surface roughness increase, which increases the degree of multiple internal reflection and thus increases EMI shielding.
- A 700-watt microwave post-treatment for 5 min positively affects conductivity and thus EM shielding.
4. Discussion
4.1. The Role of Sulfuric Acid in the Process and Carbonization Mechanism
4.2. Mechanism of EMI Shielding and the Importance of Surface Chemistry and Physics
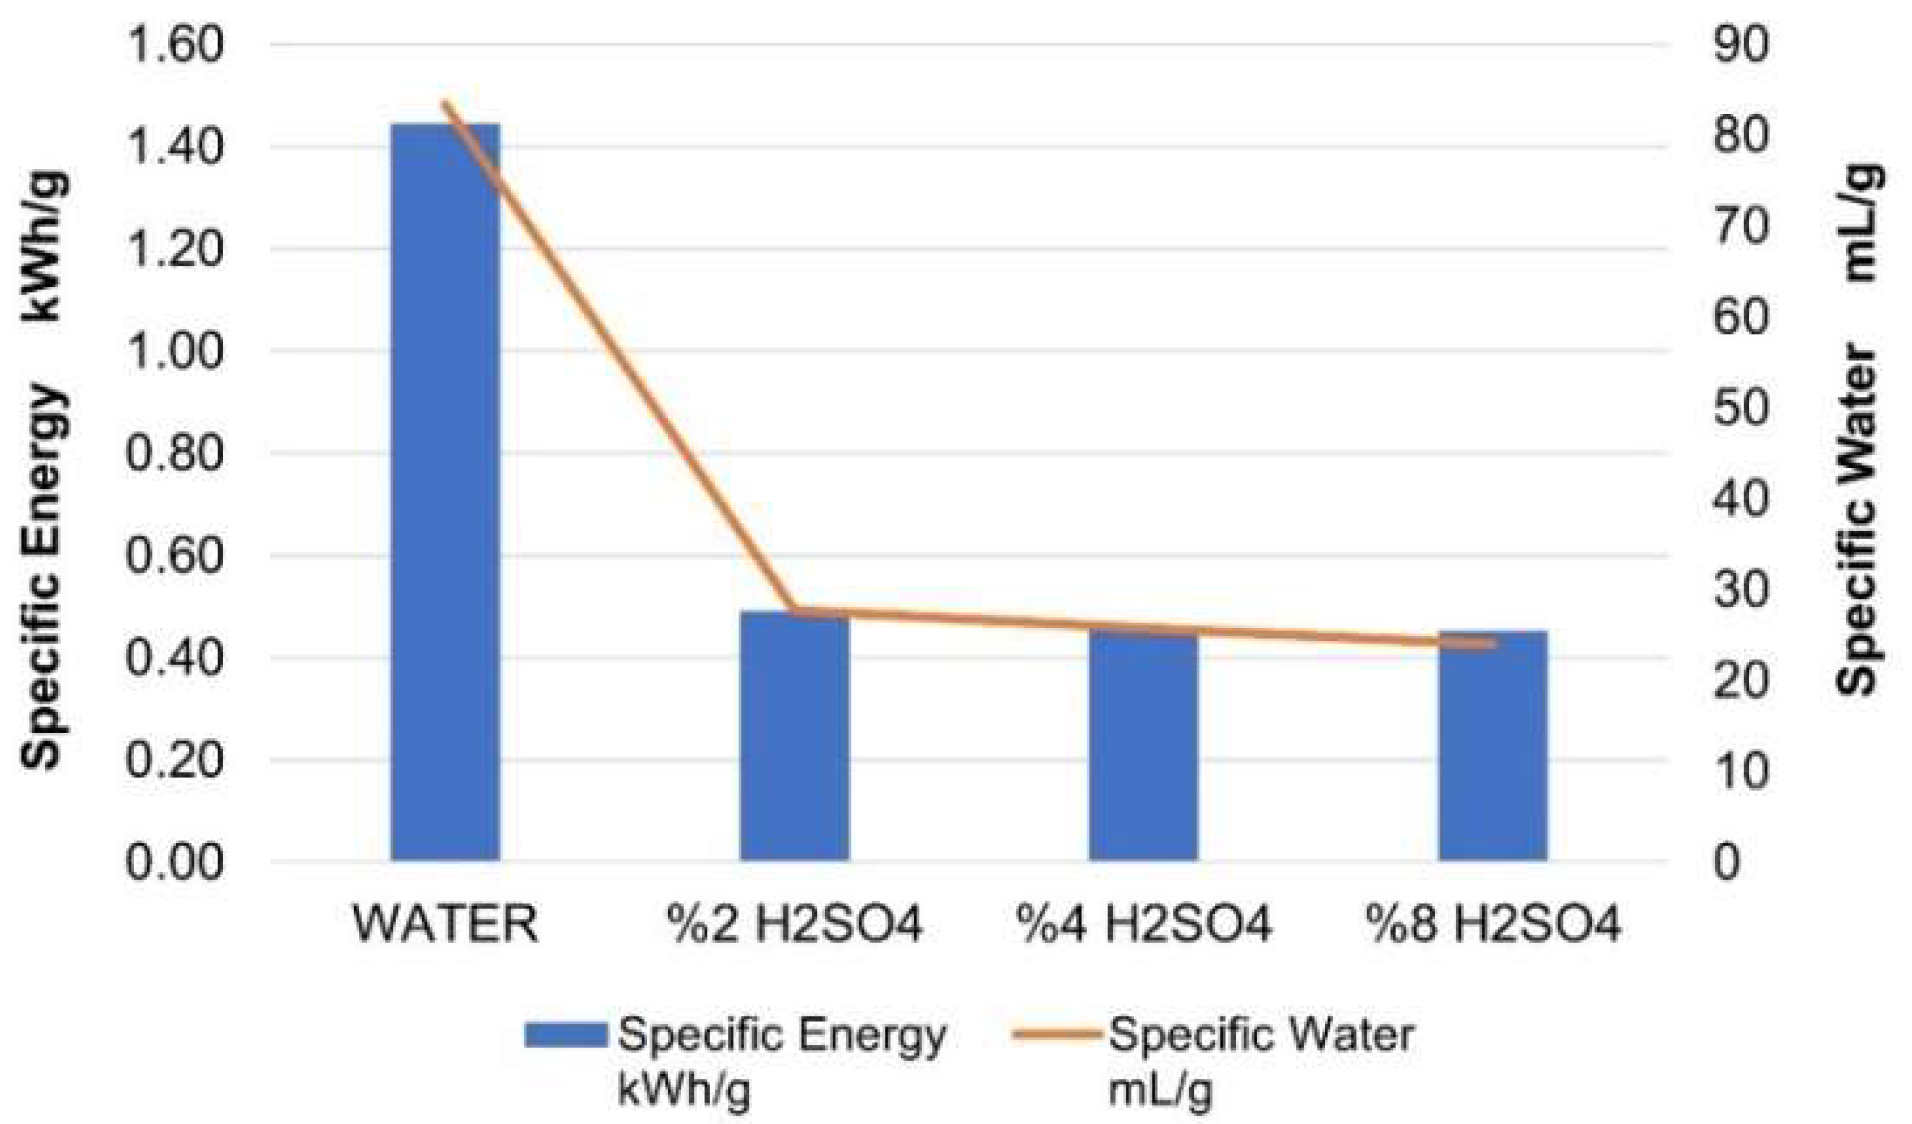
4.3. Green Metrics of the Study
5. Conclusions
Supplementary Materials
Author Contributions
Funding
Data Availability Statement
Acknowledgments
Conflicts of Interest
Abbreviations
| AC | Activated Carbon |
| BET | Brunauer-Emmett-Teller |
| CHNS | Elemental Carbon, Hydrogen, Nitrogen, Sulphur |
| EMI | Electromagnetic Interference |
| FT-IR | Fourier-Transform Infrared Spectroscopy |
| FWHM | Full Width Half Maximum |
| MW | Microwave post-treated |
| PDMS | Polydimethylsiloxane |
| PTFE | Politetrafloroetilen or Teflon |
| PVA | Polyvinyl Alcohol |
| UT | Ultrasound treated |
| WATER | Nonwoven was carbonized with only water |
| XPS | X-ray photoelectron spectroscopy |
| XRD | X-ray diffraction |
References
- Geetha, S.; Kumar, K.K.S.; Rao, C.R.K.; Vijayan, M.; Trivedi, D.C. EMI Shielding: Methods and Materials—A Review. J. Appl. Polym. Sci. 2009, 112, 2073–2086. [Google Scholar] [CrossRef]
- Gupta, S.; Tai, N.H. Carbon Materials and Their Composites for Electromagnetic Interference Shielding Effectiveness in X-Band. Carbon N. Y. 2019, 152, 159–187. [Google Scholar] [CrossRef]
- Ali, A.; Baheti, V.; Militky, J.; Khan, Z.; Tunakova, V.; Naeem, S. Copper Coated Multifunctional Cotton Fabrics. J. Ind. Text. 2018, 48, 448–464. [Google Scholar] [CrossRef]
- Naeem, S.; Baheti, V.; Tunakova, V.; Militky, J.; Karthik, D.; Tomkova, B. Development of Porous and Electrically Conductive Activated Carbon Web for Effective EMI Shielding Applications. Carbon N. Y. 2017, 111, 439–447. [Google Scholar] [CrossRef]
- Wanasinghe, D.; Aslani, F.; Ma, G.; Habibi, D. Review of Polymer Composites with Diverse Nanofillers for Electromagnetic Interference Shielding. Nanomaterials 2020, 10, 541. [Google Scholar] [CrossRef] [PubMed]
- Cheng, J.; Li, C.; Xiong, Y.; Zhang, H.; Raza, H.; Ullah, S.; Wu, J.; Zheng, G.; Cao, Q.; Zhang, D.; et al. Recent Advances in Design Strategies and Multifunctionality of Flexible Electromagnetic Interference Shielding Materials. Nano-Micro Lett. 2022, 14, 80. [Google Scholar] [CrossRef]
- Prekas, K.; Stathopoulos, N.A.; Savaidis, S.P.; Vassiliadis, S. Behaviour of The Electrically Conductive Textile Yarns in The Shf Range. In Proceedings of the SMARTEX—World Textiles Conference, Kafrelsheik, Egypt, 22–24 November 2011. [Google Scholar]
- Blachowicz, T.; Wójcik, D.; Surma, M.; Magnuski, M.; Ehrmann, G.; Ehrmann, A. Textile Fabrics as Electromagnetic Shielding Materials—A Review of Preparation and Performance. Fibers 2023, 11, 29. [Google Scholar] [CrossRef]
- Xia, C.; Zhang, S.; Ren, H.; Shi, S.Q.; Zhang, H.; Cai, L.; Li, J. Scalable Fabrication of Natural-Fiber Reinforced Composites with Electromagnetic Interference Shielding Properties by Incorporating Powdered Activated Carbon. Materials 2016, 9, 10. [Google Scholar] [CrossRef]
- Jiao, Z.; Huyan, W.; Yang, F.; Yao, J.; Tan, R.; Chen, P.; Tao, X.; Yao, Z.; Zhou, J.; Liu, P. Achieving Ultra-Wideband and Elevated Temperature Electromagnetic Wave Absorption via Constructing Lightweight Porous Rigid Structure. Nano-Micro Lett. 2022, 14, 173. [Google Scholar] [CrossRef]
- Zhang, M.; Han, C.; Cao, W.Q.; Cao, M.S.; Yang, H.J.; Yuan, J. A Nano-Micro Engineering Nanofiber for Electromagnetic Absorber, Green Shielding and Sensor. Nano-Micro Lett. 2021, 13, 27. [Google Scholar] [CrossRef]
- Lv, Q.; Peng, Z.; Meng, Y.; Pei, H.; Chen, Y.; Ivanov, E.; Kotsilkova, R. Three-Dimensional Printing to Fabricate Graphene-Modified Polyolefin Elastomer Flexible Composites with Tailorable Porous Structures for Electromagnetic Interference Shielding and Thermal Management Application. Ind. Eng. Chem. Res. 2022, 61, 16733–16746. [Google Scholar] [CrossRef]
- Fan, M.; Chen, R.; Lu, Y.; Liu, R.; Ma, Y.; Zhao, Q.; Ran, S.; Tang, P.; Bin, Y. Flexible Microfibrillated Cellulose/Carbon Nanotube Multilayered Composite Films with Electromagnetic Interference Shielding and Thermal Conductivity. Compos. Commun. 2022, 35, 101293. [Google Scholar] [CrossRef]
- Bai, W.; Zhai, J.; Zhou, S.; Cui, C.; Wang, W.; Jiang, S.; Cheng, C.; Ren, E.; Xiao, H.; Zhou, M.; et al. Flexible MOF on CoXFe1-XOOH@Biomass Derived Alloy@Carbon Films for Efficient Electromagnetic Interference Shielding and Energy Conversion. Carbon N. Y. 2022, 199, 96–109. [Google Scholar] [CrossRef]
- Xie, C.; Wang, Y.; Wang, W.; Yu, D. Flexible, Conductive and Multifunctional Cotton Fabric with Surface Wrinkled MXene/CNTs Microstructure for Electromagnetic Interference Shielding. Colloids Surfaces A Physicochem. Eng. Asp. 2022, 651, 129713. [Google Scholar] [CrossRef]
- Tang, X.; Lin, G.; Liu, C.; Cao, T.; Xia, Y.; Yi, K.; Zhang, S.; Liu, X. Lightweight and Tough Multilayered Composite Based on Poly(Aryl Ether Nitrile)/Carbon Fiber Cloth for Electromagnetic Interference Shielding. Colloids Surf. A Physicochem. Eng. Asp. 2022, 650, 129578. [Google Scholar] [CrossRef]
- Zhan, Y.; Oliviero, M.; Wang, J.; Sorrentino, A.; Buonocore, G.G.; Sorrentino, L.; Lavorgna, M.; Xia, H.; Iannace, S. Enhancing the EMI Shielding of Natural Rubber-Based Supercritical CO2 Foams by Exploiting Their Porous Morphology and CNT Segregated Networks. Nanoscale 2019, 11, 1011–1020. [Google Scholar] [CrossRef]
- Lee, J.; Liu, Y.; Liu, Y.; Park, S.J.; Park, M.; Kim, H.Y. Ultrahigh Electromagnetic Interference Shielding Performance of Lightweight, Flexible, and Highly Conductive Copper-Clad Carbon Fiber Nonwoven Fabrics. J. Mater. Chem. C 2017, 5, 7853–7861. [Google Scholar] [CrossRef]
- Mahani, A.A.; Motahari, S.; Nayyeri, V. Synthesis, Characterization and Dielectric Properties of One-Step Pyrolyzed/Activated Resorcinol-Formaldehyde Based Carbon Aerogels for Electromagnetic Interference Shielding Applications. Mater. Chem. Phys. 2018, 213, 492–501. [Google Scholar] [CrossRef]
- Lai, D.; Chen, X.; Liu, X.; Wang, Y. Flexible Poly(Vinyl Alcohol)/Reduced Graphene Oxide Coated Carbon Composites for Electromagnetic Interference Shielding. ACS Appl. Nano Mater. 2018, 1, 5854–5864. [Google Scholar] [CrossRef]
- Wang, H.; Xu, Z.; Kohandehghan, A.; Li, Z.; Cui, K.; Tan, X.; Stephenson, T.J.; King’Ondu, C.K.; Holt, C.M.B.; Olsen, B.C.; et al. Interconnected Carbon Nanosheets Derived from Hemp for Ultrafast Supercapacitors with High Energy. ACS Nano 2013, 7, 5131–5141. [Google Scholar] [CrossRef] [PubMed]
- Um, J.H.; Ahn, C.Y.; Kim, J.; Jeong, M.; Sung, Y.E.; Cho, Y.H.; Kim, S.S.; Yoon, W.S. From Grass to Battery Anode: Agricultural Biomass Hemp-Derived Carbon for Lithium Storage. RSC Adv. 2018, 8, 32231–32240. [Google Scholar] [CrossRef]
- Xiong, W.; Hu, X.; Wu, X.; Zeng, Y.; Wang, B.; He, G.; Zhu, Z. A Flexible Fiber-Shaped Supercapacitor Utilizing Hierarchical NiCo2O4@polypyrrole Core-Shell Nanowires on Hemp-Derived Carbon. J. Mater. Chem. A 2015, 3, 17209–17216. [Google Scholar] [CrossRef]
- Wang, Y.; Yang, R.; Li, M.; Zhao, Z. Hydrothermal Preparation of Highly Porous Carbon Spheres from Hemp (Cannabis sativa L.) Stem Hemicellulose for Use in Energy-Related Applications. Ind. Crops Prod. 2015, 65, 216–226. [Google Scholar] [CrossRef]
- Sun, W.; Lipka, S.M.; Swartz, C.; Williams, D.; Yang, F. Hemp-Derived Activated Carbons for Supercapacitors. Carbon N. Y. 2016, 103, 181–192. [Google Scholar] [CrossRef]
- Lam, S.S.; Chase, H.A. A Review on Waste to Energy Processes Using Microwave Pyrolysis. Energies 2012, 5, 4209–4232. [Google Scholar] [CrossRef]
- Wu, C.; Budarin, V.L.; Gronnow, M.J.; De Bruyn, M.; Onwudili, J.A.; Clark, J.H.; Williams, P.T. Conventional and Microwave-Assisted Pyrolysis of Biomass under Different Heating Rates. J. Anal. Appl. Pyrolysis 2014, 107, 276–283. [Google Scholar] [CrossRef]
- Arpia, A.A.; Chen, W.; Lam, S.S.; Rousset, P.; Luna, D.G. De Sustainable Biofuel and Bioenergy Production from Biomass Waste Residues Using Microwave-Assisted Heating: A Comprehensive Review. Chem. Eng. J. 2020, 403, 126233. [Google Scholar] [CrossRef]
- Baskar, G.; Kalavathy, G.; Aiswarya, R.; Abarnaebenezer Selvakumari, I. Advances in Bio-Oil Extraction from Nonedible Oil Seeds and Algal Biomass; Elsevier Ltd.: Amsterdam, The Netherlands, 2019; ISBN 9780081027288. [Google Scholar]
- Karthik, D.; Baheti, V.; Militky, J.; Naeem, M.S.; Tunakova, V.; Ali, A. Activated Carbon Derived from Carbonization of Kevlar Waste Materials: A Novel Single Stage Method. Materials 2021, 14, 6433. [Google Scholar] [CrossRef]
- Intani, K.; Latif, S.; Kabir, A.K.M.R.; Müller, J. Effect of Self-Purging Pyrolysis on Yield of Biochar from Maize Cobs, Husks and Leaves. Bioresour. Technol. 2016, 218, 541–551. [Google Scholar] [CrossRef]
- Intani, K.; Latif, S.; Cao, Z.; Müller, J. Characterisation of Biochar from Maize Residues Produced in a Self-Purging Pyrolysis Reactor. Bioresour. Technol. 2018, 265, 224–235. [Google Scholar] [CrossRef] [PubMed]
- Kong, S.H.; Lam, S.S.; Yek, P.N.Y.; Liew, R.K.; Ma, N.L.; Osman, M.S.; Wong, C.C. Self-Purging Microwave Pyrolysis: An Innovative Approach to Convert Oil Palm Shell into Carbon-Rich Biochar for Methylene Blue Adsorption. J. Chem. Technol. Biotechnol. 2019, 94, 1397–1405. [Google Scholar] [CrossRef]
- Xia, C.; Shi, S.Q. Self-Activation for Activated Carbon from Biomass: Theory and Parameters. Green Chem. 2016, 18, 2063–2071. [Google Scholar] [CrossRef]
- Christian, J.; Quillope, C.; Carpio, R.B.; Gatdula, K.M.; Concepcion, M.; Detras, M.; Doliente, S.S. Optimization of Process Parameters of Self-Purging Microwave Pyrolysis of Corn Cob for Biochar Production. Heliyon 2021, 7, e08417. [Google Scholar] [CrossRef]
- Afzal, M.Z.; Zhang, H.; Aurangzeb, M.; Bing, W.; Zhang, Y. A Case Study of Bio-Char Production from Biomass Using Microwave Assisted Pyrolysis and Its Utilization. Int. J. Eng. Work. 2018, 5, 87–95. [Google Scholar]
- Wang, C.; Zou, R.; Qian, M.; Kong, X.; Huo, E.; Lin, X.; Wang, L.; Zhang, X.; Ruan, R.; Lei, H. Improvement of the Carbon Yield from Biomass Carbonization through Sulfuric Acid Pre-Dehydration at Room Temperature. Bioresour. Technol. 2022, 355, 127251. [Google Scholar] [CrossRef]
- TS EN 50147-12005-04; Anechoic Chambers—Part 1: Shield Attenuation Measurement. Slovenian Institute for Standardization: Ljubljana, Slovenia, 2005.
- Ni, Z.; Wang, Y.; Yu, T.; Shen, Z. Raman Spectroscopy and Imaging of Graphene. Nano Res. 2008, 1, 273–291. [Google Scholar] [CrossRef]
- Liu, J.; Li, Q.; Zou, Y.; Qian, Q.; Jin, Y.; Li, G.; Jiang, K.; Fan, S. The Dependence of Graphene Raman D-Band on Carrier Density. Nano Lett. 2013, 13, 6170–6175. [Google Scholar] [CrossRef]
- Tang, B.; Guoxin, H.; Gao, H. Raman Spectroscopic Characterization of Graphene. Appl. Spectrosc. Rev. 2010, 45, 369–407. [Google Scholar] [CrossRef]
- Farma, R.; Fatjrin, D.; Awitdrus; Deraman, M. Physical Properties of Activated Carbon from Fibers of Oil Palm Empty Fruit Bunches by Microwave Assisted Potassium Hydroxide Activation. AIP Conf. Proc. 2017, 1801, 040001. [Google Scholar] [CrossRef]
- Kim, T.H.; Jeon, E.K.; Ko, Y.; Jang, B.Y.; Kim, B.S.; Song, H.K. Enlarging the D-Spacing of Graphite and Polarizing Its Surface Charge for Driving Lithium Ions Fast. J. Mater. Chem. A 2014, 2, 7600–7605. [Google Scholar] [CrossRef]
- Xu, K.; Li, Y.; Xiong, J.; Ou, X.; Su, W.; Zhong, G.; Yang, C. Activated Amorphous Carbon with High-Porosity Derived from Camellia Pollen Grains as Anode Materials for Lithium/Sodium Ion Batteries. Front. Chem. 2018, 6, 366. [Google Scholar] [CrossRef]
- Maulina, S.; Mentari, V.A. Comparison of Functional Group and Morphological Surface of Activated Carbon from Oil Palm Fronds Using Phosphoric Acid (H3PO4) and Nitric Acid (HNO3) as an Activator. IOP Conf. Ser. Mater. Sci. Eng. 2019, 505, 012023. [Google Scholar] [CrossRef]
- Martin, M.C. Characteristic IR Band Positions. Available online: https://www2.lbl.gov/mmartin/bl1.4/IRbands.html%0A (accessed on 7 May 2022).
- Fierro, V.; Torné-Fernández, V.; Celzard, A.; Montané, D. Influence of the Demineralisation on the Chemical Activation of Kraft Lignin with Orthophosphoric Acid. J. Hazard. Mater. 2007, 149, 126–133. [Google Scholar] [CrossRef]
- Isahak, W.N.R.W.; Hisham, M.W.M.; Yarmo, M.A. Highly Porous Carbon Materials from Biomass by Chemical and Carbonization Method: A Comparison Study. J. Chem. 2013, 2013, 620346. [Google Scholar] [CrossRef]
- Kim, D.Y.; Nishiyama, Y.; Wada, M.; Kuga, S. High-Yield Carbonization of Cellulose by Sulfuric Acid Impregnation. Cellulose 2001, 8, 29–33. [Google Scholar] [CrossRef]
- Manocha, S.; Prasad, G.R.; Joshi, P.; Zala, R.S.; Gokhale, S.S.; Manocha, L.M. Preparation and Characterization of Activated Carbon from Demineralized Tyre Char. AIP Conf. Proc. 2013, 1538, 109–112. [Google Scholar] [CrossRef]
- Jia, F.; Dong, J.; Dai, X.; Liu, Y.; Wang, H.; Lu, Z. Robust, Flexible, and Stable CuNWs/MXene/ANFs Hybrid Film Constructed by Structural Assemble Strategy for Efficient EMI Shielding. Chem. Eng. J. 2023, 452, 139395. [Google Scholar] [CrossRef]
- Kashani, H.; Giroux, M.; Johnson, I.; Han, J.; Wang, C.; Chen, M. Unprecedented Electromagnetic Interference Shielding from Three-Dimensional Bi-Continuous Nanoporous Graphene. Matter 2019, 1, 1077–1087. [Google Scholar] [CrossRef]
- Cheng, E.M.; Mohd Nasir, N.F.; Shahriman, A.B.; Baharuddin, S.A.; Abdul Majid, M.S.; Leech, P.W.; Tanner, P.; Holland, A.S. Electromagnetic Interference (EMI) Analysis on Surface Roughness of 3c-Silicon Carbide (3C-SiC) Deposited on Silicon (Si) Substrate. J. Telecommun. Electron. Comput. Eng. 2018, 10, 73–77. [Google Scholar]
- Qiang, M.; Jian-Jun, J.; Shao-Wei, B.; Bin, T.; Pei, L.; Hua-Hui, H. Microwave Properties and Surface Topography of Soft Magnetic Films with High Resistivity. Chin. Phys. B 2009, 18, 2063–2067. [Google Scholar] [CrossRef]
- Jimenez-Gonzalez, C.; Ponder, C.S.; Broxterman, Q.B.; Manley, J.B. Using the Right Green Yardstick: Why Process Mass Intensity Is Used in the Pharmaceutical Industry To Drive More Sustainable Processes. Org. Process Res. Dev. 2011, 15, 912–917. [Google Scholar] [CrossRef]
- Schuepfer, D.B.; Badaczewski, F.; Guerra-Castro, J.M.; Hofmann, D.M.; Heiliger, C.; Smarsly, B.; Klar, P.J. Assessing the Structural Properties of Graphitic and Non-Graphitic Carbons by Raman Spectroscopy. Carbon N. Y. 2020, 161, 359–372. [Google Scholar] [CrossRef]
- Shahedifar, V.; Rezadoust, A.M. Thermal and Mechanical Behavior of Cotton/Vinyl Ester Composites: Effects of Some Flame Retardants and Fiber Treatment. J. Reinf. Plast. Compos. 2013, 32, 681–688. [Google Scholar] [CrossRef]
- Thakur, M.; Sharma, A.; Ahlawat, V.; Bhattacharya, M.; Goswami, S. Process Optimization for the Production of Cellulose Nanocrystals from Rice Straw Derived α-Cellulose. Mater. Sci. Energy Technol. 2020, 3, 328–334. [Google Scholar] [CrossRef]


| Material | Production Method | Max. EMSE (dB) | Frequency (GHz) | Thickness (cm) | SSE/t dB cm2g−1 | Ref. |
|---|---|---|---|---|---|---|
| Carbon Fiber Polymethacrylimide | Polymerization: water bath at 50 °C for 4 days Foaming: 240 °C—1 h | Reflection Loss −53.2 | 2–18 GHz | 0.2 | - | [10] |
| NiCo2O4 nanofiber Carbon | Electrospinning and calcination up to 700 °C—2 h in N2 | 13.44 | 2–18 GHz | - | - | [11] |
| Polyolefin-Graphene | Ultrasonication, extruding and 3D printing | 35 | 8.2–12.4 (X-band) | 0.2 | 244.9 | [12] |
| Cellulose-CNT | Ultrasonication Vacuum filtration | 26.67 | 5.85–8.2 (C-band). | 0.0036 | 9944 | [13] |
| CoFe/CoCu PDMS Carbon Cotton fabric | Hydrothermal reaction Calcination: 1000 °C—1 h in argon PDMS encapsulation | 73.46 | 2–18 | 0.024 | 12,227.21 | [14] |
| MXene-CNT– Cotton fabric | Spray-coating Mxene, CNT, PDMS | 46.05 | 8.2–12.4 (X-band) | 0.0138 | 6710 | [15] |
| Carbon Fiber Poly (aryl ether nitrile) | Ultrasonication Coating layer-by-layer | 37.76 | 8.2–12.4 (X-band) | 0.2 | 543 | [16] |
| Natural Rubber CNT Foam | Supercritical CO2 foaming | 33.74 | 8.2–12.4 (X-band) | 0.13 | 312.69 | [17] |
| Activated Carbon- Copper Nonwoven | Electroless plating | 70 | 1.5–10 | 0.04 | 11,162 | [18] |
| Activated Carbon Aerojel | Sol-gel process and pyrolysis | 20 | 8.2–12.4 (X-band) | 1.1 0.2 | - | [19] |
| Activated Carbon RGO PVA | Drop casting | 9.7 21 | 8.2 | 0.08 0.2 | - | [20] |
| Activated Carbon from acrylic fibrous waste | Pyrolysis in muffle furnace without inert atmosphere Most closely related study | 28.29 | 2.45 | 1.16 | - | [4] |
| Activated Carbon from jute-cotton waste | Pyrolysis in microwave without inert atmosphere | 39.54 | 3 GHz | 0.245 | 950.71 | This Work |
| Production Parameters | |
|---|---|
| Needle penetration depth | 1 cm |
| Folding-belt speed | 2.8 m/min |
| Needle penetration depth | 2.5 mm |
| Needle penetration depth for joining nonwovens and woven fabric | 1.2 cm |
| Analysis | Equipment | Analysis Method |
|---|---|---|
| Raman Carbon Fingerprints | Renishaw (Renishaw, Wotton–under–Edge, UK) | Laser λ = 532 nm, power = 2.5 mW, grating: 2400 g mm−1.The magnification of the microscope optics for the collection was set to ×20. D and G bands were calculated from a Gaussian peak-fitting function using the original data without any smoothing. 400–3000 cm−1 |
| XRD Diffraction Crystal Structure | Rigaku Ultima IV X-Ray Diffractometer (Rigaku, The Woodlands, TX, USA) | Bragg–Brentano geometry, Cu Kα (λ = 0.15443 nm), 10° ≤ 2θ ≤ 70°, 20 kV-40 mA, slit:10 mm, scan speed: 2°, scan step: 0.06° |
| FT-IR Surface Chemistry | Thermo Scientific Nicolet iS50 (Thermo Fisher Scientific, Madison, WI, USA) | 400–4000 cm−1, scanning resolution is 0.5 cm−1. |
| XPS Surface Chemistry | Thermo Scientific K-Alpha (Thermo Fisher Scientific, East Grinstead, UK) | X-ray source: Al Kα Monochromatic (1486.68 eV) X-ray dimension: 250 μm, sample area: 60 × 60 mm, analyzer: 180°, energy: 50 eV, scanning: 10 |
| TGA Thermal Stability | TA Instruments SDT Q600 V20.9 (TA Instruments, New Castle, DE, USA) | From room temperature to 900 °C (temperature ramping 10 °C/min) under N2 atmosphere (100 mL/min). Pan: Alumina |
| BET Porosity | Micrometrics 3 Flex (Micromeritics, Nor-cross, GA, USA) | Brunauer Emmet Teller (BET) method, N2 adsorption-desorption isotherms at 78.39 K, relative pressure range P/P0 from 0.01 to 1, outgassed 300 °C for 5 h under N2 gas |
| SEM Morphology | Carl Zeiss 300VP (Carl Zeiss, Jena, Germany) | All sample surfaces were sputtered with gold. |
| 4-Probe Conductivity | Lucas Signatone Pro4 (Lucas Signatone Corp., Gilroy, CA, USA) | 4-probe method. The measurements were done via a computer-controlled Keithley based on the average of 5 measurements. |
| EMI Shielding | Consept Test and Technology System (Consept Test and Technology System, Gebze, Turkey) | Effectiveness of the 3D activated carbons at EMI shielding was tested in an anechoic chamber and a frequency range of 1 to 6 GHz by the EN50147-1 standard |
| Material | ~Moisture% | Tonset (°C) | Decomposition Temperature (°C) | Tendset (°C) | Residue % |
|---|---|---|---|---|---|
| Raw Nonwoven + Woven Textile Structure | 7.21 | 335.74 | 355.31 | 372.56 | 5.86 |
| AC Textile Structure, 8% Acid | 10.86 | 382.99 | 531.01 | 673.45 | 48.76 |
| AC Textile Structure, 8% Acid Microwave Post-treated | 7.95 | 434.77 | 585.55 | 697.96 | 62.70 |
| Activator | Surface Area (m2/g) | Micropore Area (m2/g) | Micro Pore Volume (cm3/g) | Total Pore Volume (cm3/g) | Vmic/Vtot % | Pore (nm) Diameter |
|---|---|---|---|---|---|---|
| WATER | 380.7 | 355.39 (93%) | 0.1632 | 0.1796 | 90.8686 | 1.72 |
| 2% H2SO4 | 246.66 | 222.31 (90%) | 0.1199 | 0.1242 | 96.53784 | 2.01 |
| 4% H2SO4 | 353.29 | 307.55 (87%) | 0.1612 | 0.186 | 86.66667 | 2.11 |
| 8% H2SO4 | 383.92 | 276.42 (72%) | 0.1349 | 0.2008 | 67.18127 | 2.13 |
| 8% H2SO4, Microwave-treated | 382.33 | 256.15 (67%) | 0.1245 | 0.1995 | 62.40602 | 2.11 |
| RAW | WATER | 2% H2SO4 | 4% H2SO4 | 8% H2SO4 | |||||
|---|---|---|---|---|---|---|---|---|---|
| UT * | MW * | UT * | MW * | UT * | MW * | UT * | MW * | ||
| Product Yield | 14.40 | 41.48 | 43.80 | 46.73 | |||||
| BET m2/g | 380.70 | 246.66 | 353.29 | 383.92 | |||||
| Resistivity (Ohm-cm) | 1.1 × 10⁵ | 9.62 | 3.3 × 10⁷ | 2.16 | 2.4 × 10⁷ | 1.12 | 2.5 × 10⁷ | 2.2 × 10⁶ | |
| Carbon | 43.55 | 60.83 | 66.33 | 65.80 | 67.36 | 68.60 | 85.49 | 70.34 | 86.94 |
| Hydrogen | 6.58 | 2.53 | 1.94 | 2.93 | 2.63 | 2.63 | 1.69 | 3.02 | 1.48 |
| Nitrogen | 0.31 | 1.41 | 2.08 | 0.55 | 0.47 | 1.32 | 0.76 | 0.89 | 0.40 |
| Sulfur | 0.84 | 0.28 | 4.25 | 0.59 | 0.32 | 0.28 | 0.14 | 0.34 | 0.05 |
| Pre-Post Treatment | EMSE (dB) | Average EMSE | Maximums | Minimums | Specific EMSE | SSE/t | ||||||||
|---|---|---|---|---|---|---|---|---|---|---|---|---|---|---|
| 1 GHz | 2 GHz | 3 GHz | 4 GHz | 5 GHz | 6 GHz | dB | dB GHz | dB GHz | SSE | |||||
| WATER | WATER | 28.36 | 14.18 | 24.31 | 25.77 | 30.45 | 35.40 | 26.41 | 35.40 | 6 | 14.18 | 2 | 186.04 | 759.34 |
| Microwave | 32.93 | 27.06 | 33.41 | 23.71 | 15.89 | 27.02 | 26.67 | 33.41 | 3 | 15.89 | 5 | 187.86 | 766.76 | |
| 2% H2SO4 | NaOH | 24.09 | 10.30 | 35.34 | 15.88 | 16.87 | 26.34 | 21.47 | 35.34 | 3 | 10.30 | 2 | 151.23 | 617.26 |
| Ultrasound | 34.73 | 15.12 | 21.39 | 21.77 | 20.87 | 23.31 | 22.87 | 34.73 | 1 | 15.12 | 2 | 161.06 | 657.37 | |
| Microwave | 35.24 | 18.56 | 29.61 | 27.29 | 21.28 | 29.41 | 26.90 | 35.24 | 1 | 18.56 | 2 | 189.47 | 773.33 | |
| 4% H2SO4 | NaOH | 28.37 | 8.85 | 39.54 | 16.38 | 16.44 | 26.21 | 22.63 | 39.54 | 3 | 8.85 | 2 | 159.41 | 650.66 |
| Ultrasound | 31.79 | 14.65 | 26.33 | 23.09 | 18.08 | 25.51 | 23.24 | 31.79 | 1 | 14.65 | 2 | 163.71 | 668.20 | |
| Microwave | 33.25 | 24.39 | 29.90 | 33.50 | 35.56 | 38.49 | 32.52 | 38.49 | 6 | 24.39 | 2 | 229.03 | 934.81 | |
| 8% H2SO4 | NaOH | 27.79 | 12.82 | 26.81 | 17.14 | 19.11 | 25.30 | 21.50 | 27.79 | 1 | 12.82 | 2 | 151.41 | 617.98 |
| Ultrasound | 33.49 | 16.79 | 22.18 | 26.23 | 24.11 | 28.93 | 25.29 | 33.49 | 1 | 16.79 | 2 | 178.12 | 727.04 | |
| Microwave | 38.60 | 26.84 | 32.69 | 37.92 | 31.67 | 30.69 | 33.07 | 38.60 | 1 | 26.84 | 2 | 232.93 | 950.71 | |
| ACTIVATOR | PMI | Specific Water mL/g | Specific Energy kWh/g | Average EMSE dB | Unit Cost $/g |
|---|---|---|---|---|---|
| WATER | 90.28 | 83.333 | 1.44 | 26.41 | 0.2274 |
| 2% H2SO4 | 49.35 | 27.736 | 0.49 | 26.90 | 0.0817 |
| 4% H2SO4 | 41.05 | 25.714 | 0.46 | 32.52 | 0.0849 |
| 8% H2SO4 | 49.13 | 24.000 | 0.45 | 33.07 | 0.0975 |
Disclaimer/Publisher’s Note: The statements, opinions and data contained in all publications are solely those of the individual author(s) and contributor(s) and not of MDPI and/or the editor(s). MDPI and/or the editor(s) disclaim responsibility for any injury to people or property resulting from any ideas, methods, instructions or products referred to in the content. |
© 2023 by the authors. Licensee MDPI, Basel, Switzerland. This article is an open access article distributed under the terms and conditions of the Creative Commons Attribution (CC BY) license (https://creativecommons.org/licenses/by/4.0/).
Share and Cite
Sert, S.; Duran Kaya, D.; Körlü, A. Development of Activated Carbon Textiles Produced from Jute and Cotton Wastes for Electromagnetic Shielding Applications. Fibers 2023, 11, 110. https://doi.org/10.3390/fib11120110
Sert S, Duran Kaya D, Körlü A. Development of Activated Carbon Textiles Produced from Jute and Cotton Wastes for Electromagnetic Shielding Applications. Fibers. 2023; 11(12):110. https://doi.org/10.3390/fib11120110
Chicago/Turabian StyleSert, Sema, Deniz Duran Kaya, and Ayşegül Körlü. 2023. "Development of Activated Carbon Textiles Produced from Jute and Cotton Wastes for Electromagnetic Shielding Applications" Fibers 11, no. 12: 110. https://doi.org/10.3390/fib11120110