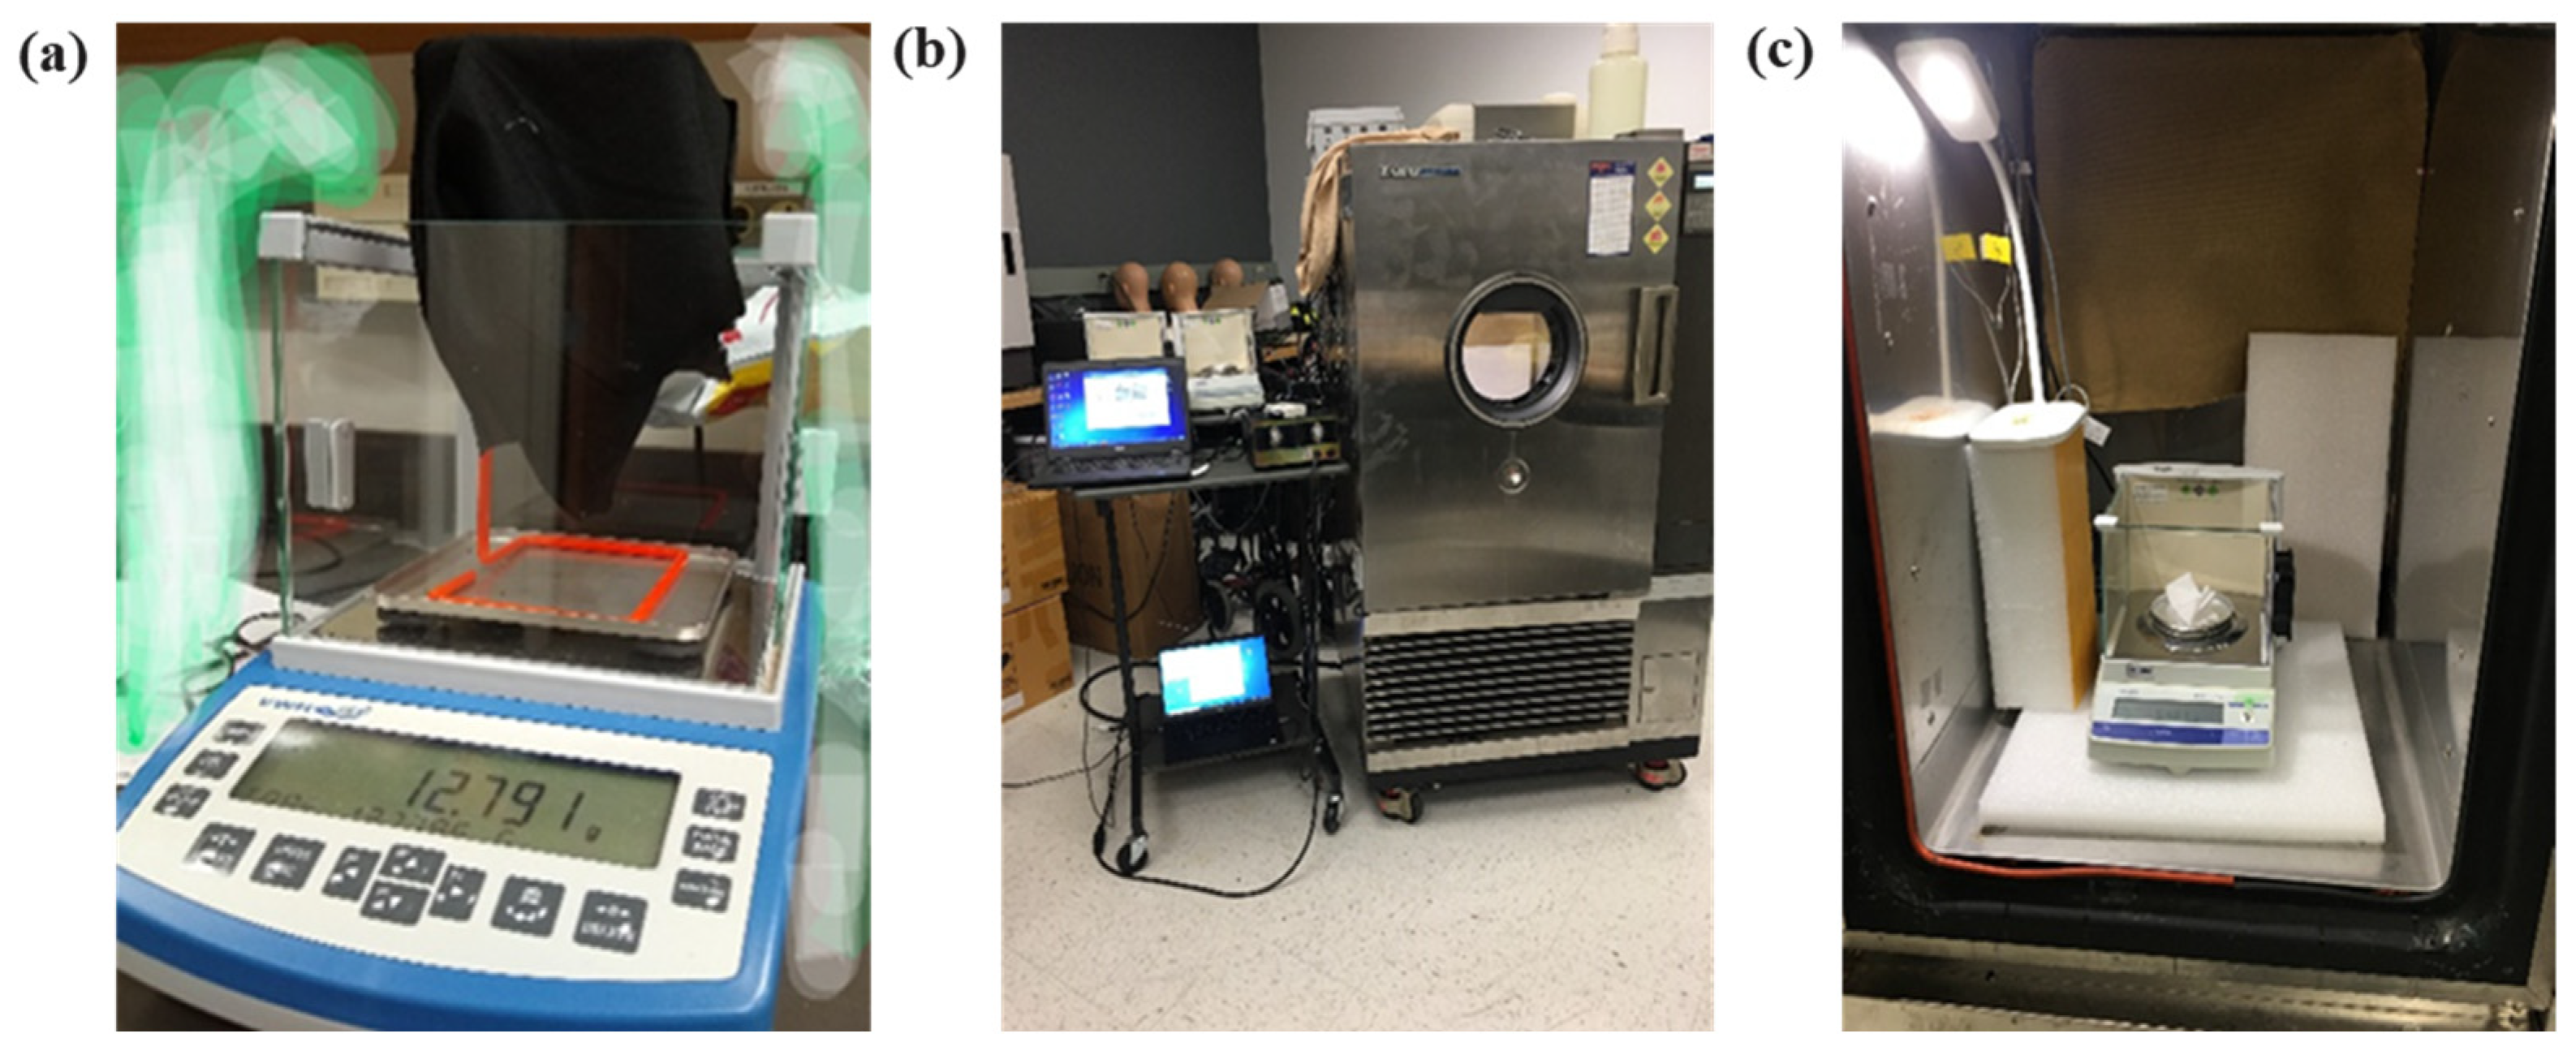
Dynamic Regain Test.
3.1. Oven Dry Method
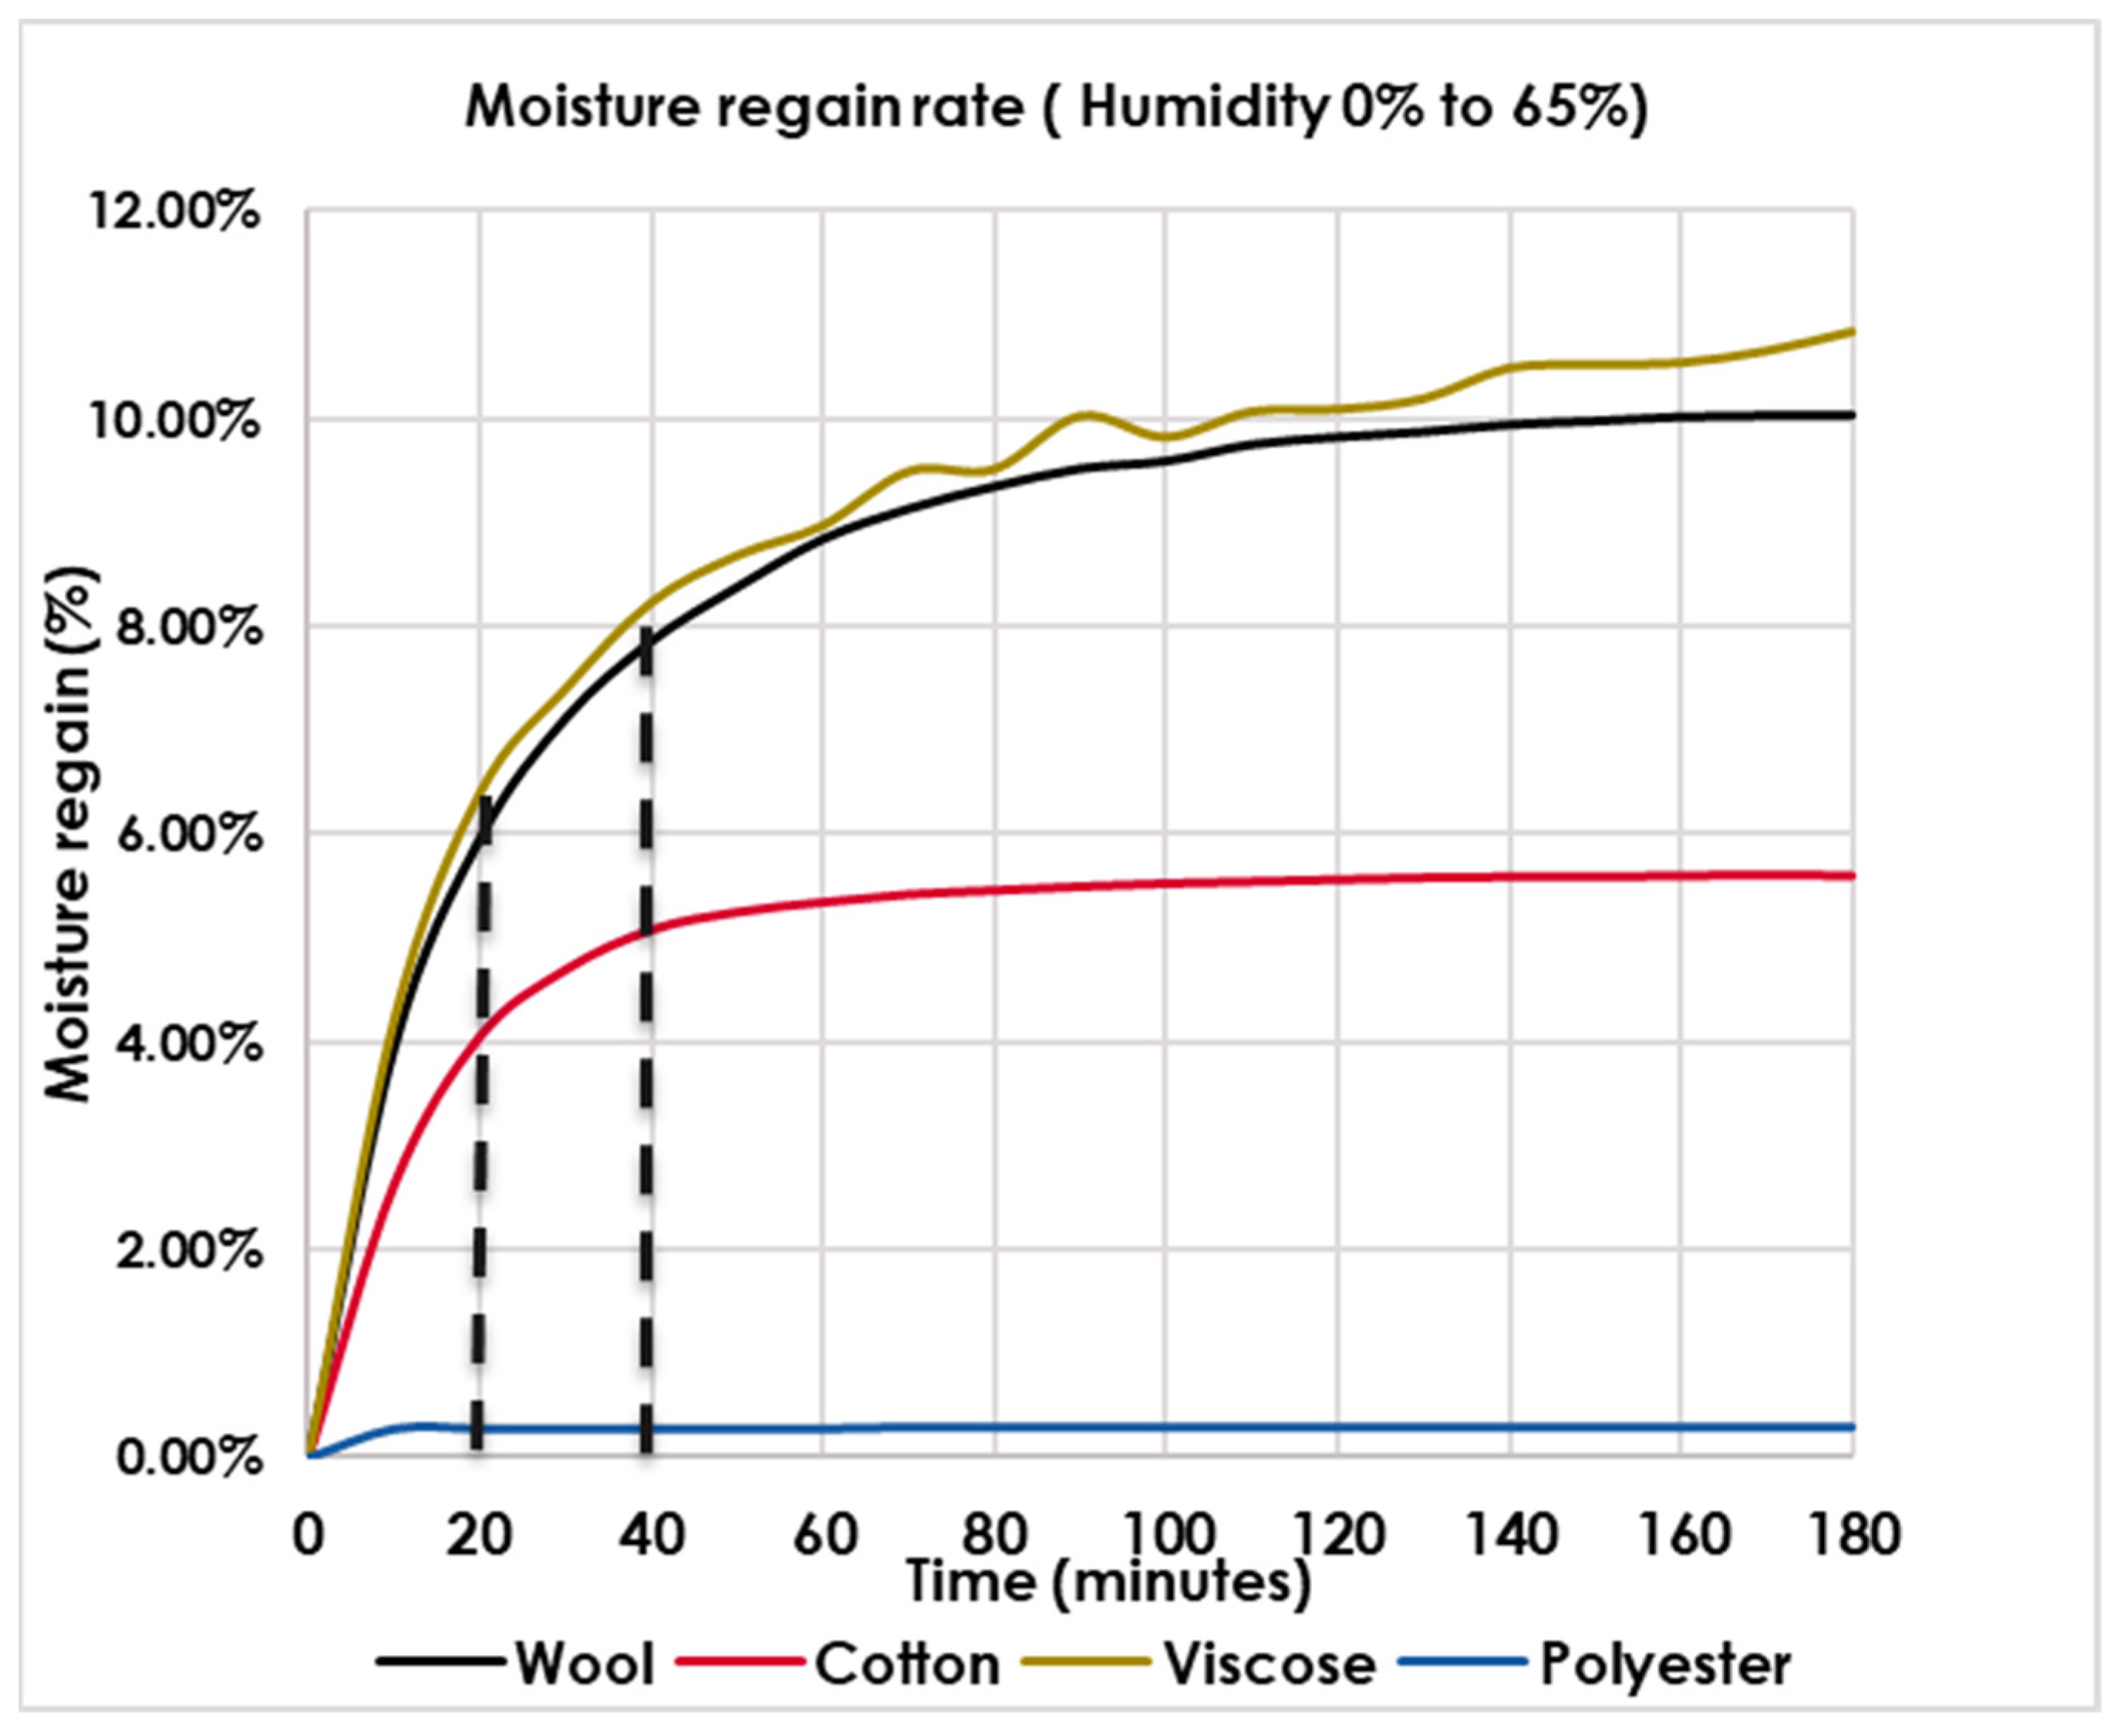
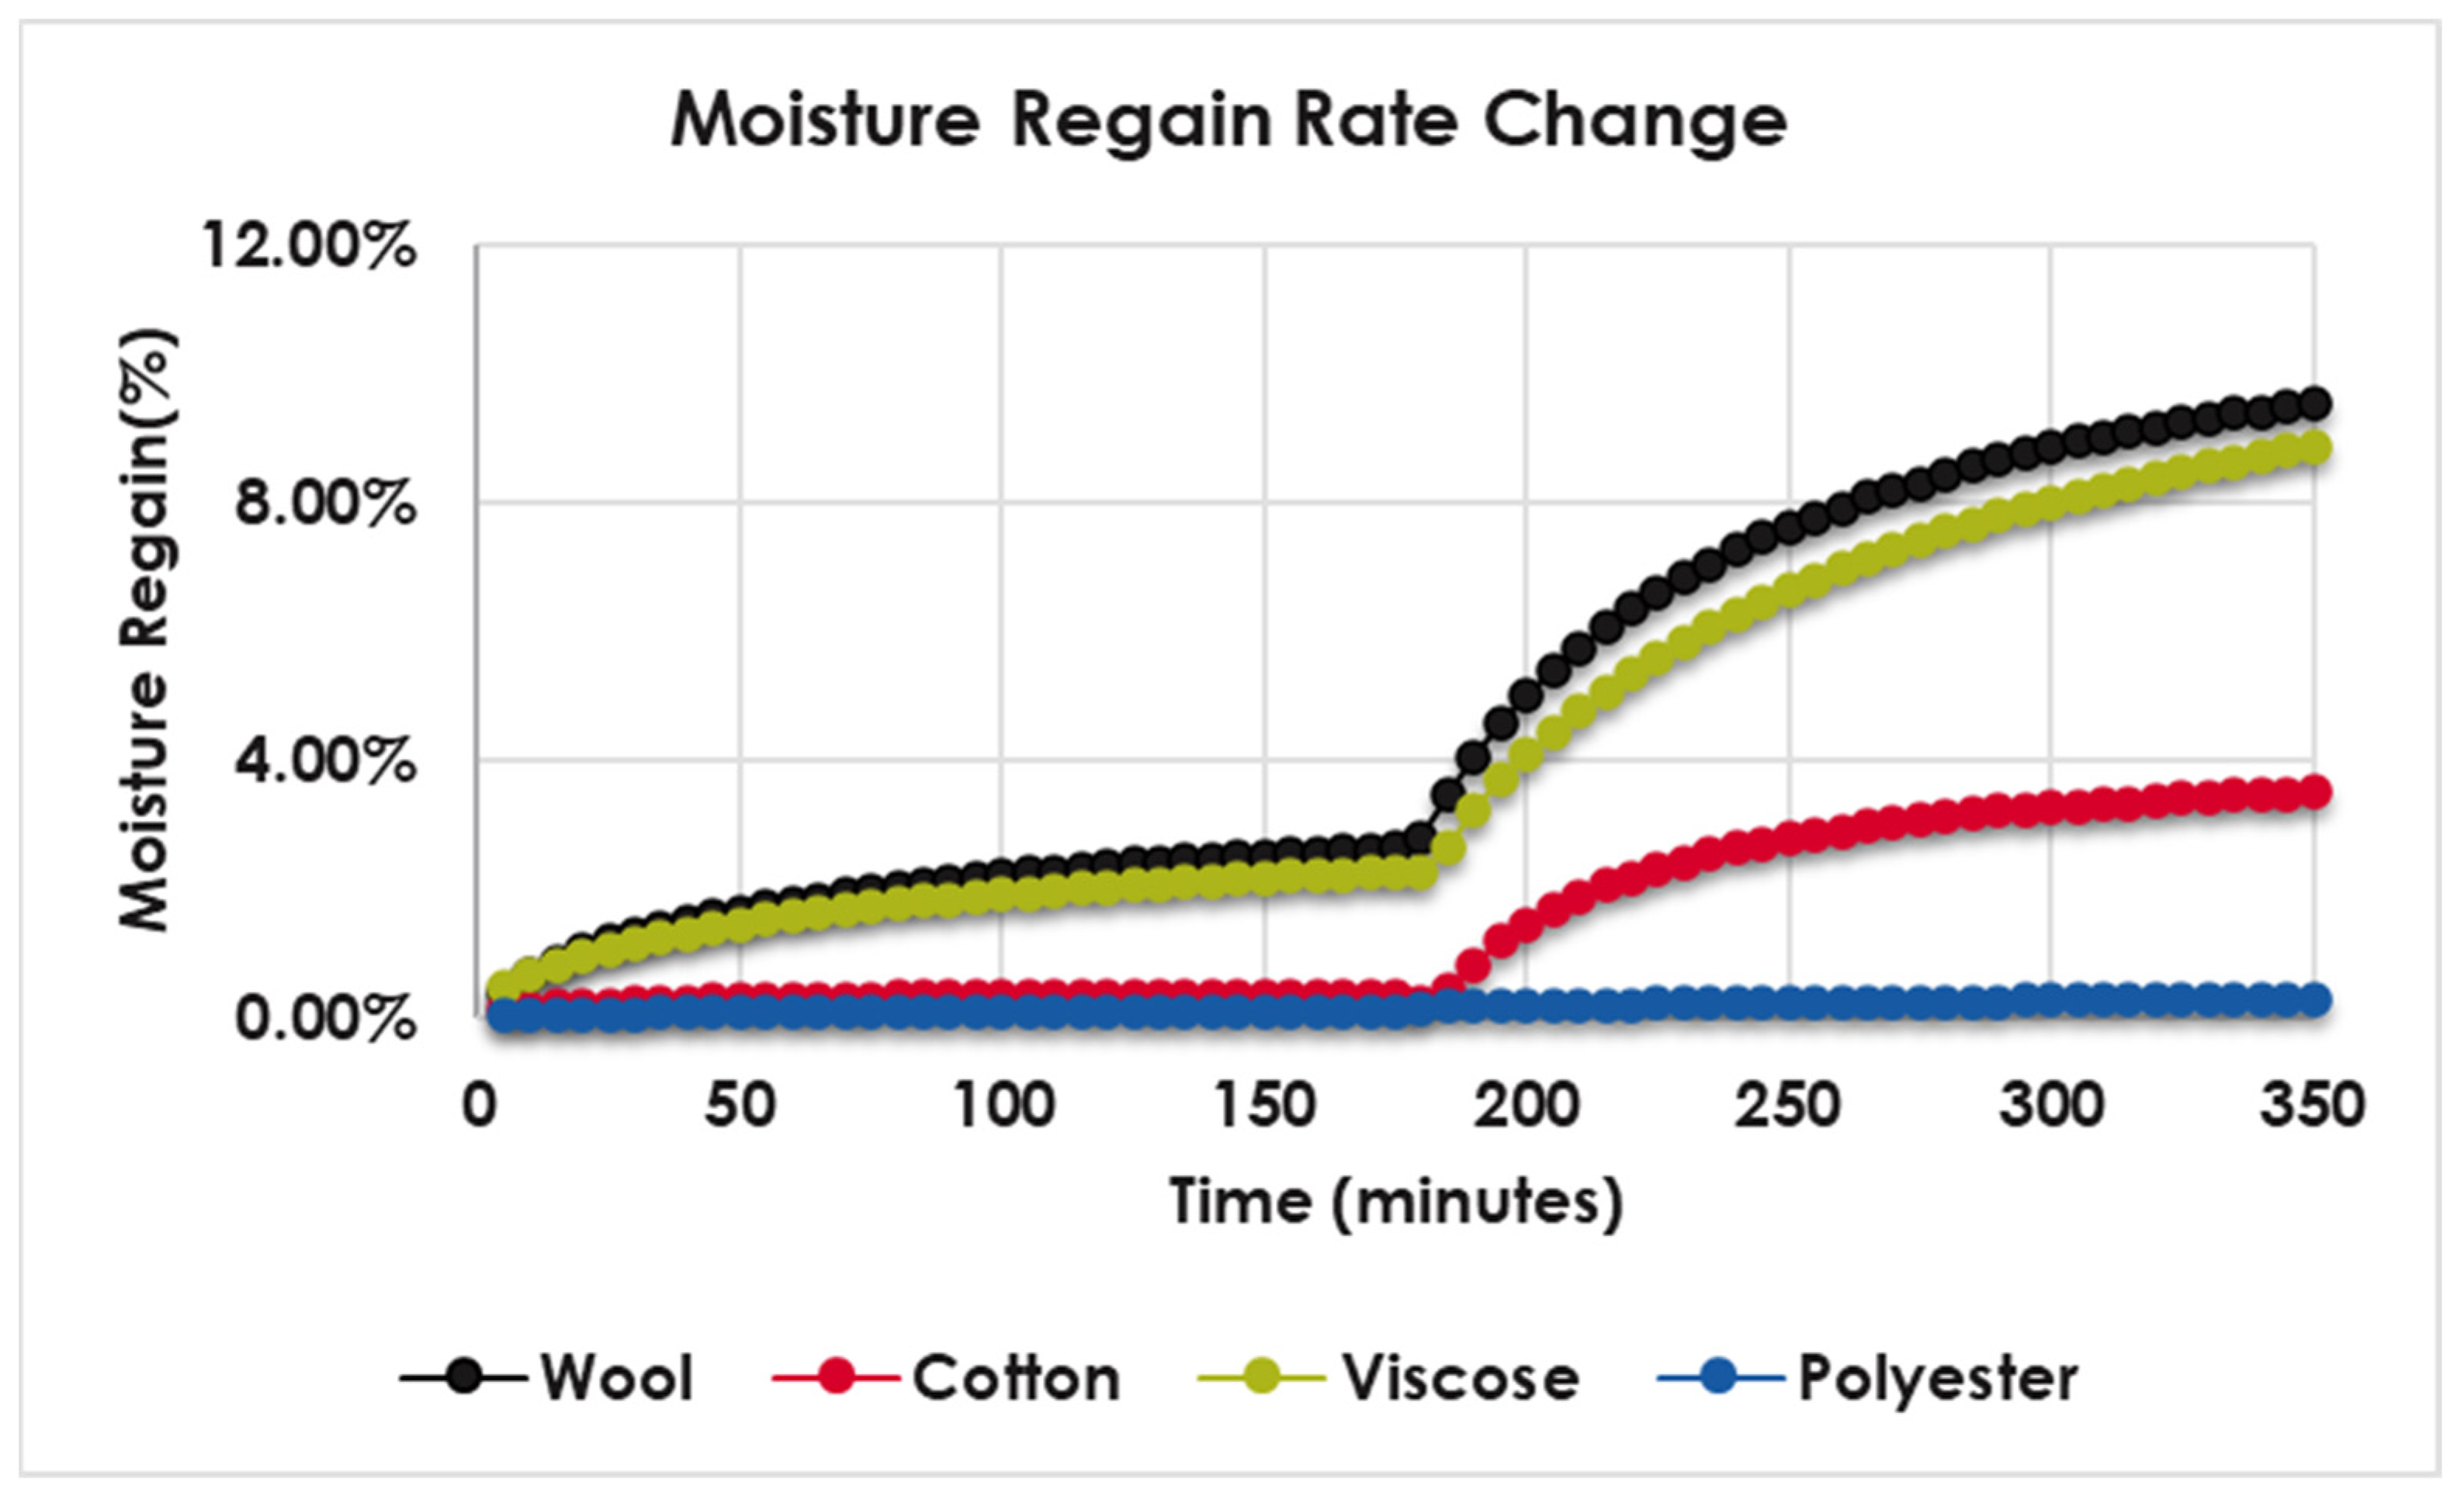
Figure 3 shows the moisture regain graph (%) versus time (minutes) for all fabric samples. All fabrics exhibited a similar pattern curve, having two phases. In the first phase, from the start of the test to about 20–30 min, the moisture was absorbed at a high rate due to the high RH gradient in RH (0 to 65%). After this rapid initial phase, the fabrics continued to slowly absorb water vapor from the environment until the end of the experiment. As observed before, not all fabrics reached their expected regain value after 3 h, but the water vapor absorption rate in the wool and viscose samples was greater than in the cotton samples. At 30 min after the first start of the rapid uptake phases, the values for wool, viscose, cotton, and polyester were 7.0%, 7.4%, 4.7%, and 0.3%, respectively; these values are approximately 50% of their expected moisture regain percentage.
The RH gradient between textile samples and the environment started to decrease as time passed. All curves had a “transition point,” after which the moisture regain rate only increased slowly (but steadily). The consequence of this curve flattening, due to the fundamental physics of water vapor diffusion and transport, is that the exothermic effect will also decrease as it is directly related to the water vapor uptake rate (curve steepness). Thus, from these primary curves, an estimate of the duration of the exothermic effects can be derived. Polyester, if it shows any exothermic effect, will have a short effect of up to 10 min max. The effect for cotton is likely to last up to 40 min maximum as the uptake rate (slope) becomes small after that. The expected effect for wool and viscose could be up to 80–100 min (two times as long) and even longer.
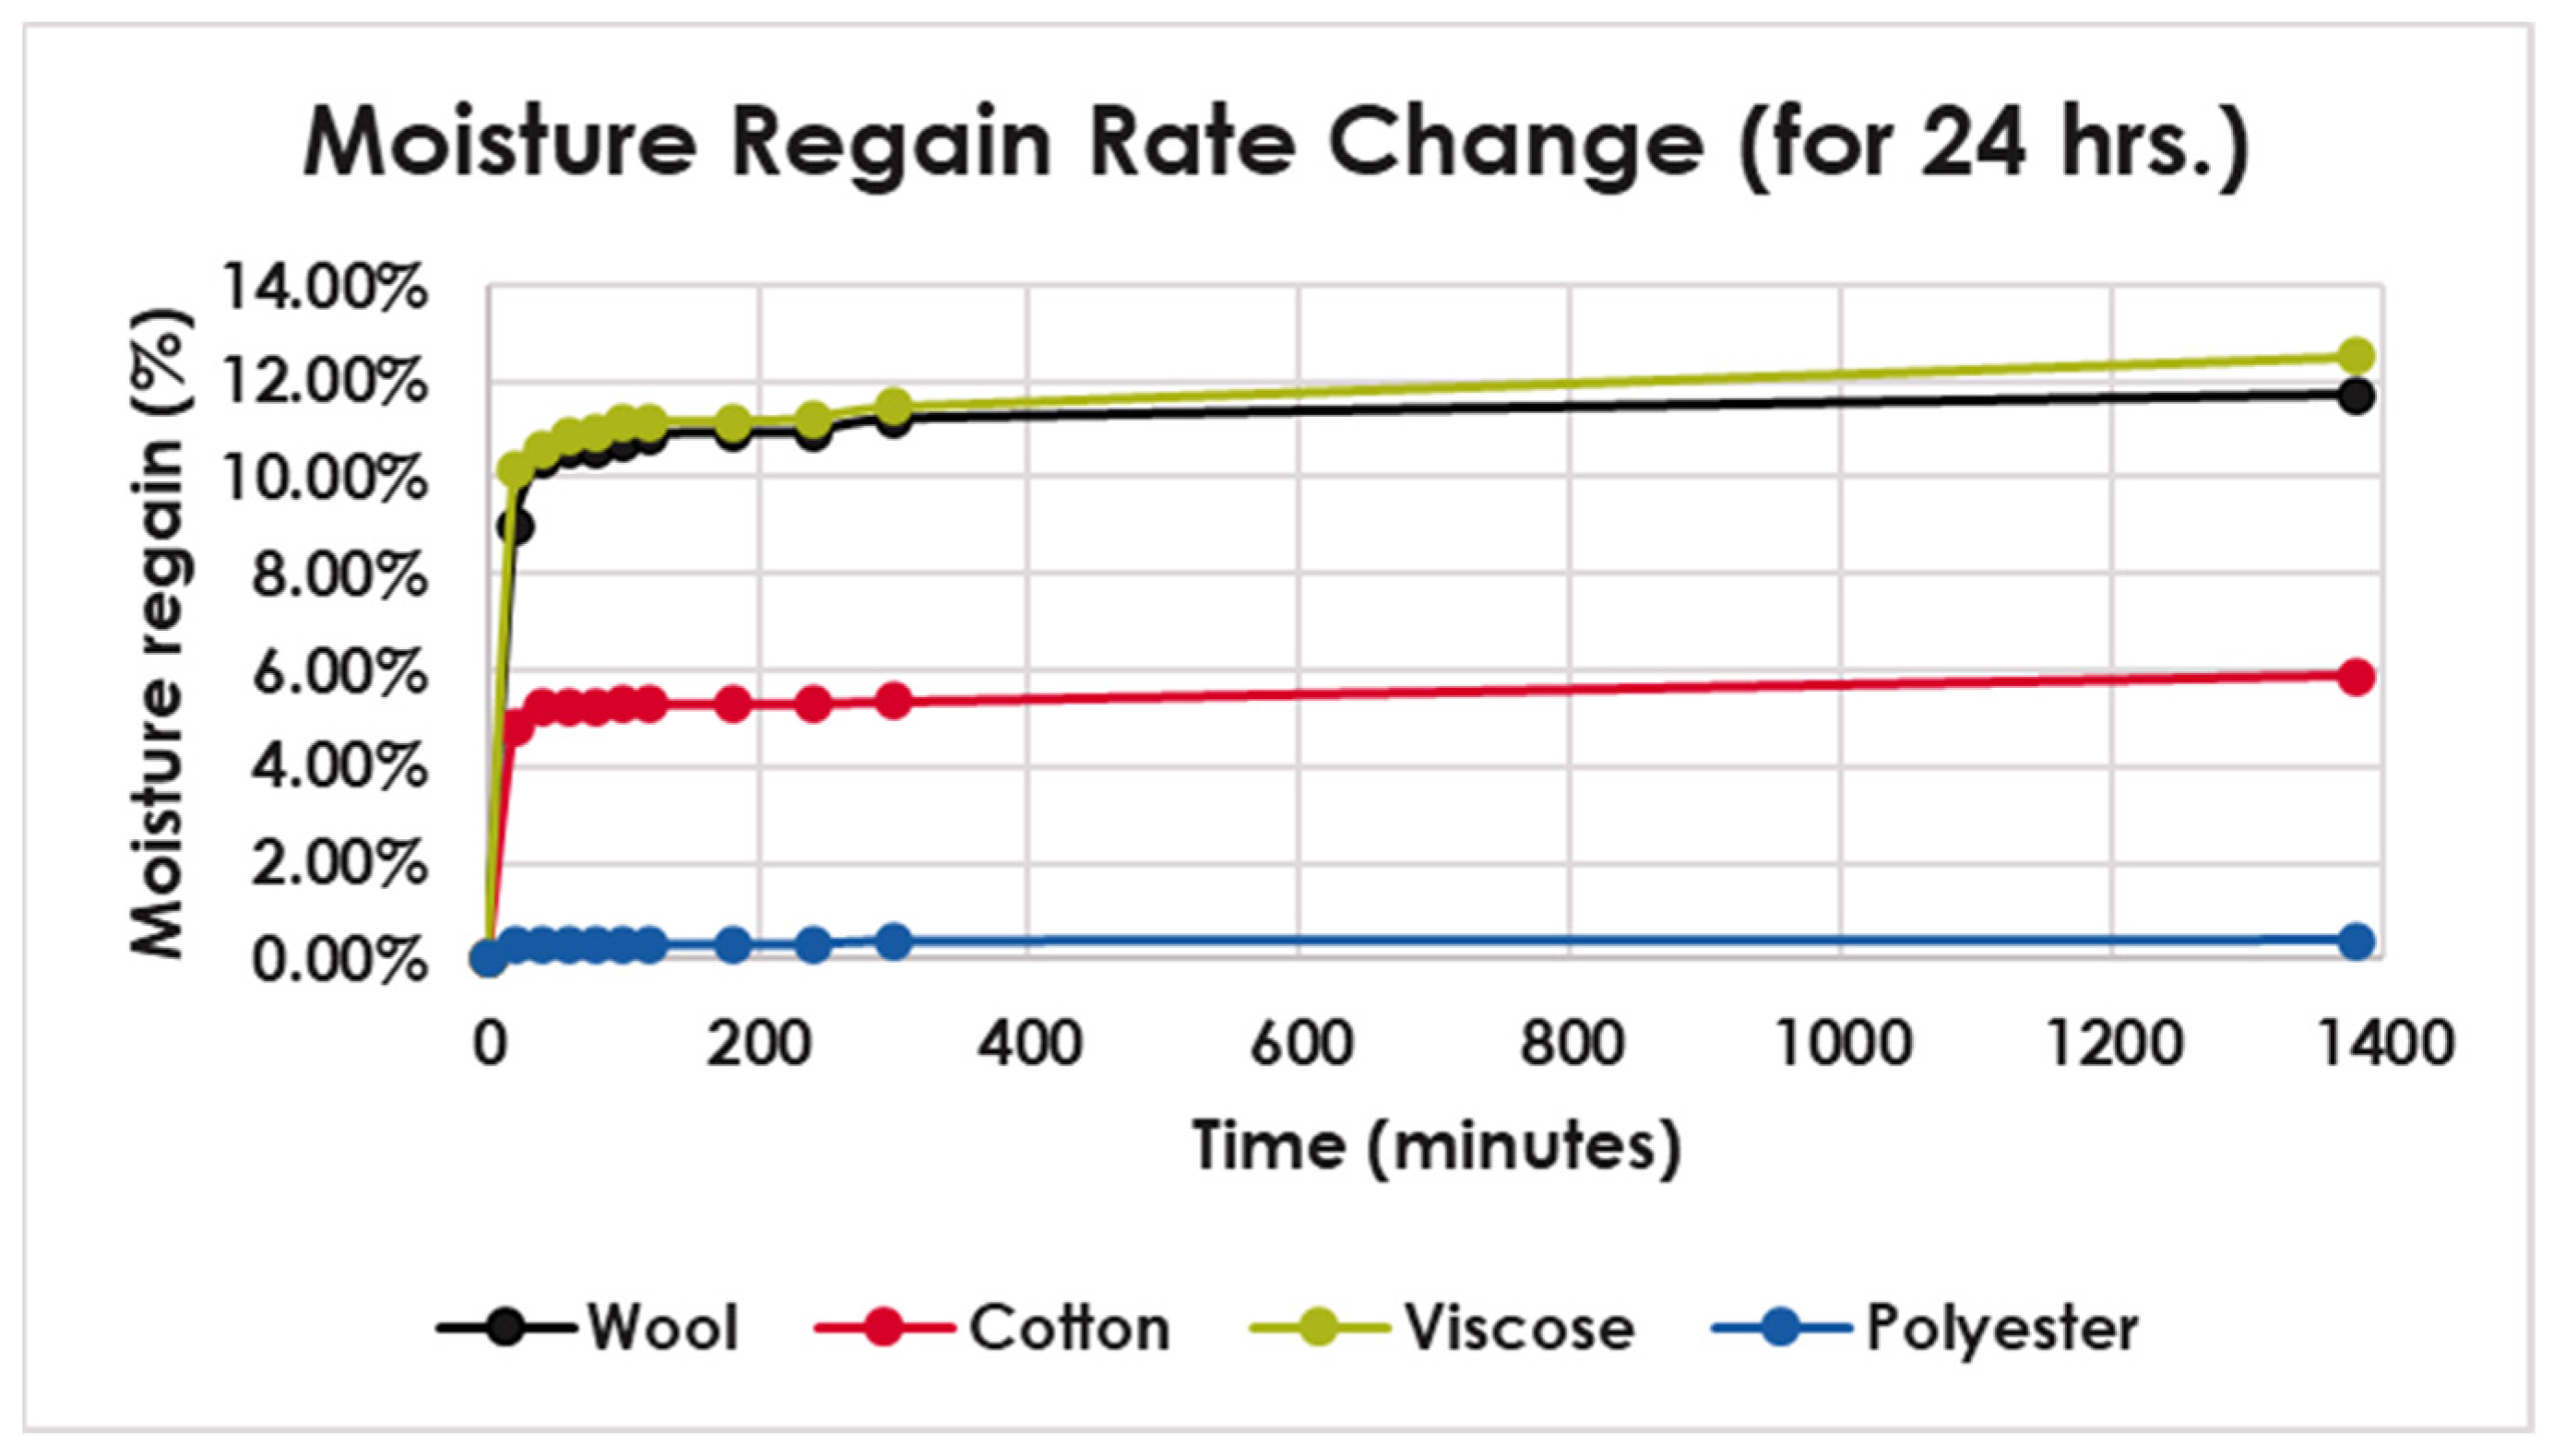
Figure 4 further shows the rapid initial increase in regain, after which there is a very long and slow process to reach the final steady state, up to 24 h. With the focus on the regain rate measurement in the first hour, the experiment was conducted at the 1 Hz sampling rate.
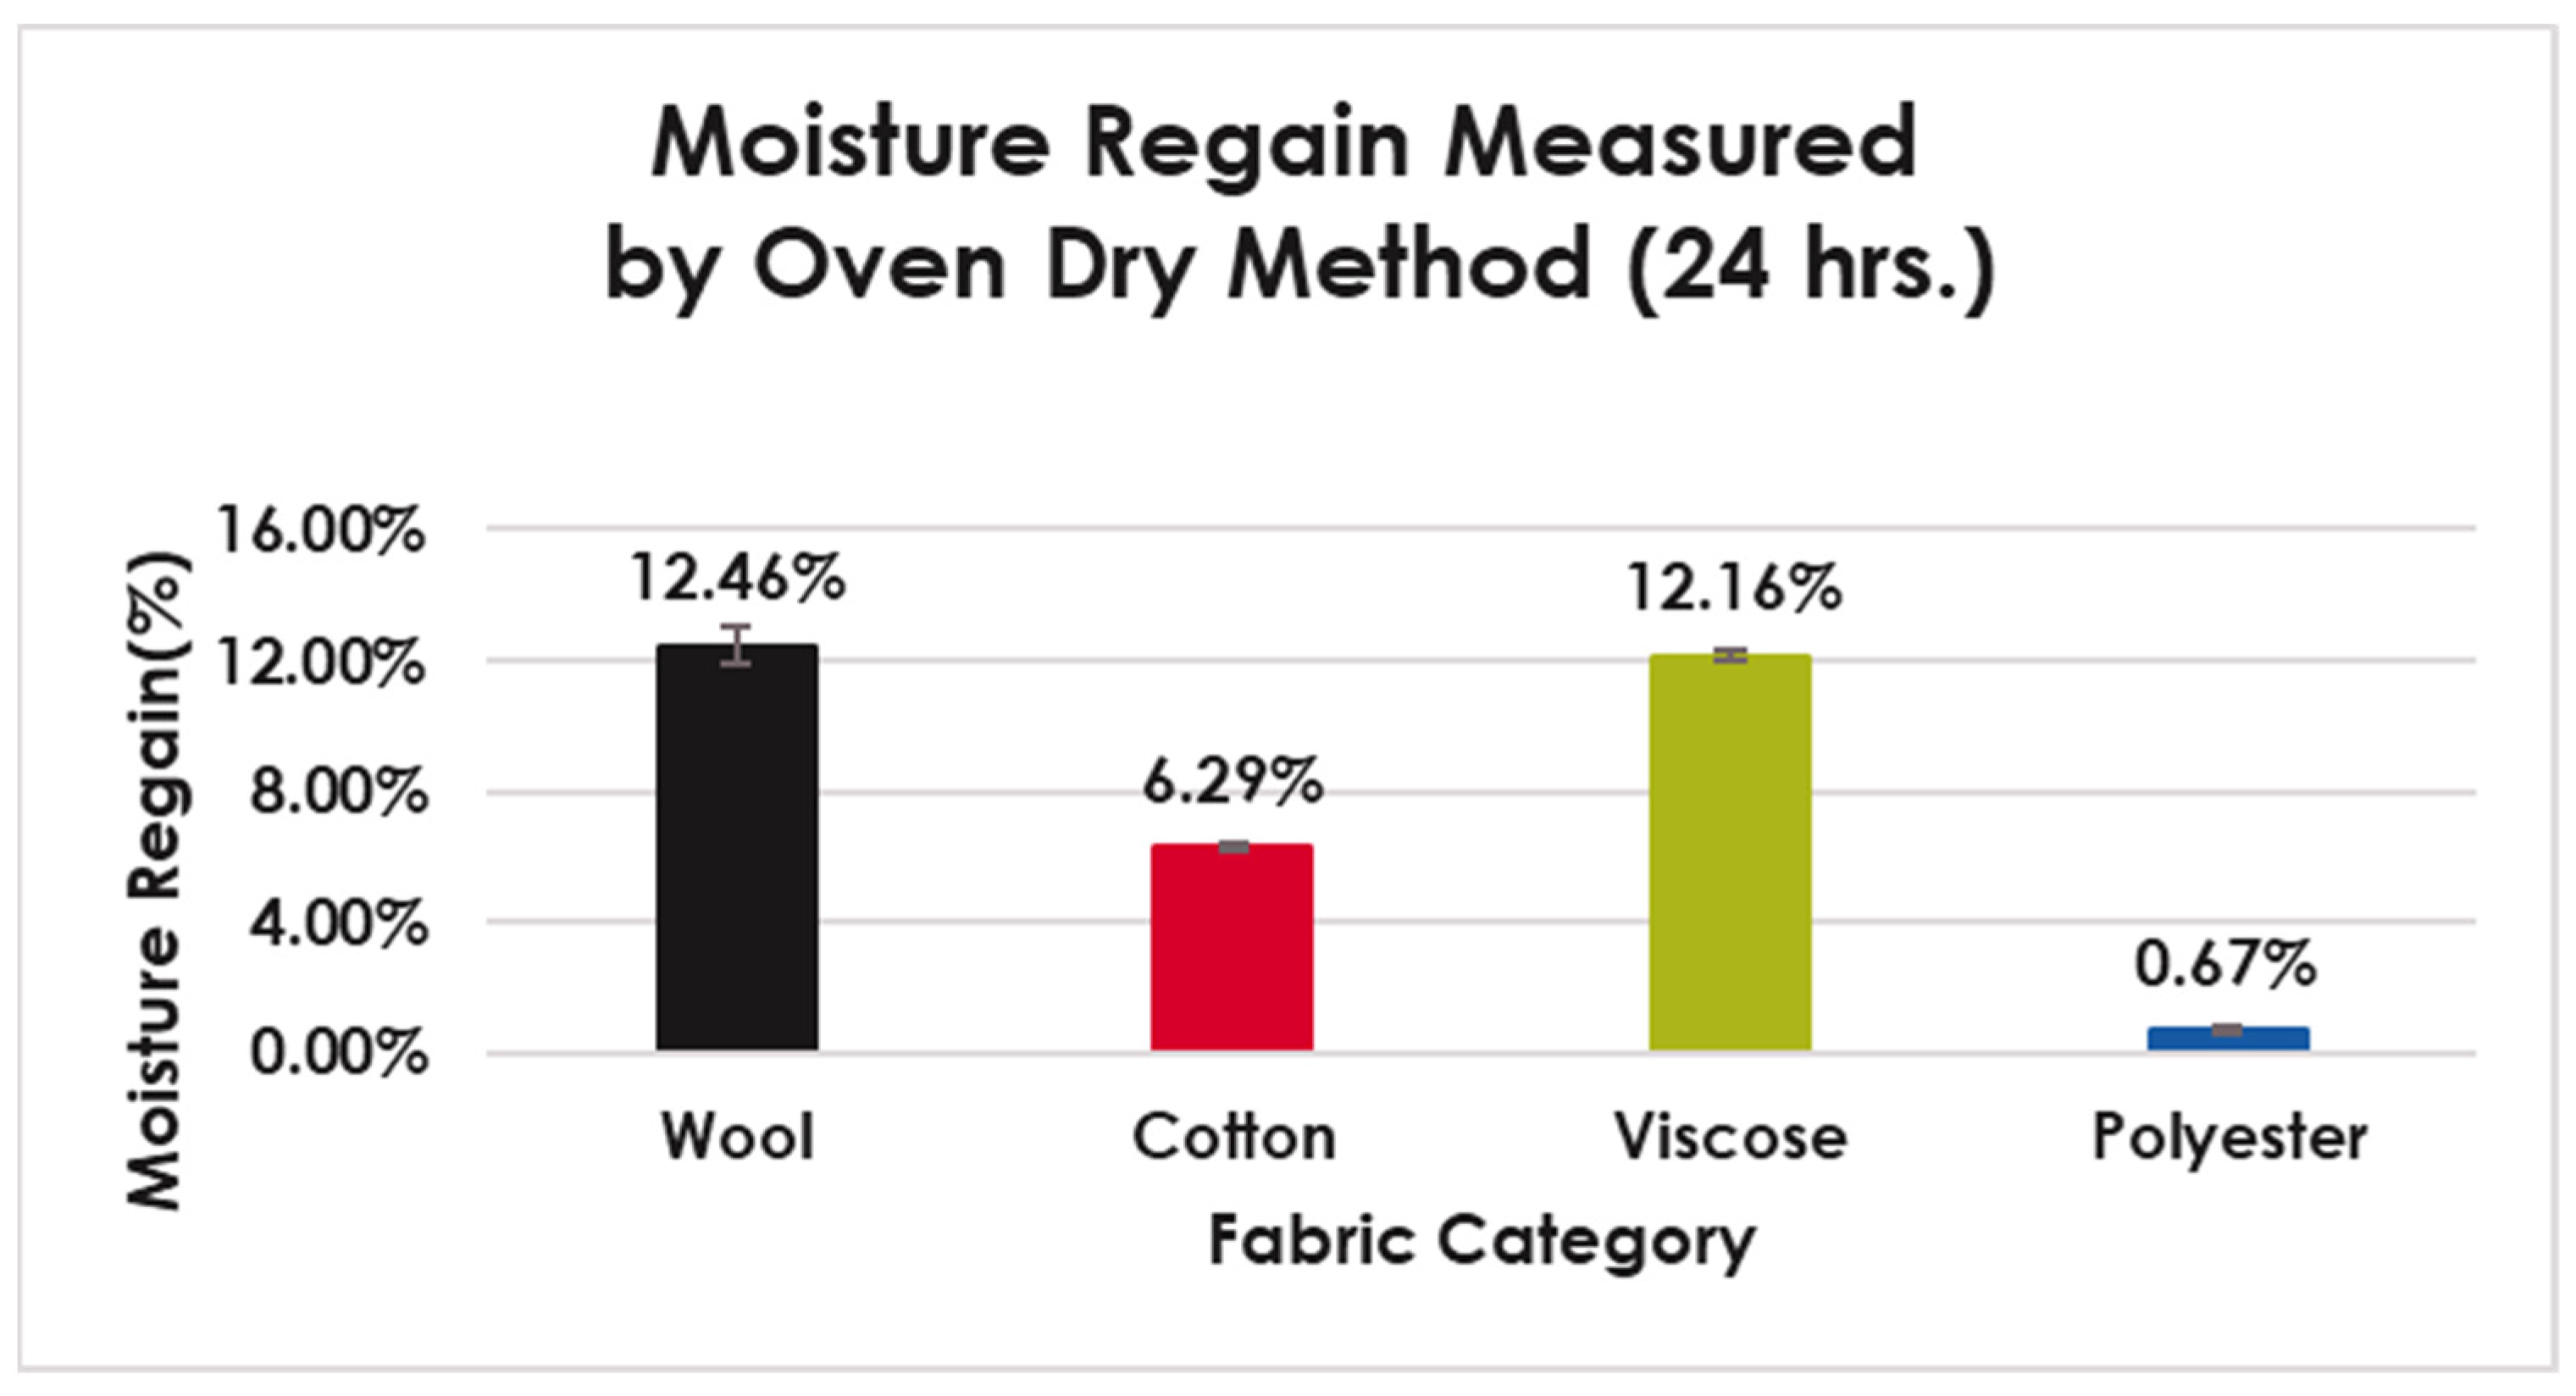
Figure 5 shows the regain values measured after 24 h of the experiment. With this method, all values appeared consistently slightly below (about 1–2%) the reported values from the literature.
3.2. Two-Phase Humidity Change
During a two-phase humidity change experiment, shown in
Figure 6, all of the curves showed similar patterns based on the absorbency capacity of the fabric. However, it seemed that after 180 min (3 h) of the experiment, all of the fiber types had lower regain values than the literature values. For the initial period of three hours, wool and viscose showed some degree of moisture regaining behavior; however, after switching the humidity to a higher value, the behavior pattern looked more prominent, increasing from a value of 3.46% to almost 10% for wool and 2.66% to almost 9% for viscose. As per usual, polyester did not show any response at all. Cotton had a response between that of wool and polyester. The result indicated that a higher humidity gradient accelerated the moisture absorption behavior of the textile fiber and helped it regain equilibrium faster.
From these experiments, it was evident that viscose and wool absorbed the highest amount of moisture, as expected. Both fabrics are hygroscopic in nature. In the case of wool, the -NH
2 and -COOH groups help to absorb moisture. The morphology of wool is complex and thus water vapor was absorbed slowly; after 3 h of the experiment, the wool had not reached its final equilibrium value. In the case of viscose and cotton, the -COOH groups help to absorb moisture. The moisture regain rate of viscose was much higher than that of cotton. This might be due to morphological and structural differences. Viscose has a circular cross section and provides more surface area than cotton for moisture absorption [
26,
27]. Moisture regain rate varies significantly with the type of fabric; polyester absorbs the least amount of moisture. The first phase for polyester is the shortest; on the other hand, the moisture regain rate for viscose and wool is the highest.
Thus, the conclusion of these dynamic regain experiments should be that the initial rapid regain uptake rate will be dominant for the realistic exothermic effects, as that is directly related to the regain rate [
3]. This means that although wool and viscose have a higher steady-state regain and their initial regain rate is higher than that of cotton, the differences may be predicted to be, in reality, smaller than their end regain values. Instead of a difference of 6 g of water vapor per 100 g fabric (e.g., 13 for wool versus 7 for cotton), we may only expect a difference in generated heat from 2 g of absorbed water vapor per 100 g fabric (i.e., 6 g versus 4 g). Still, these experiments show that the exothermic effect differs significantly between wool/viscose, cotton, and polyester.
3.3. ISO 16533 Test
These three experiments (E1, E2, E3) aimed to determine the optimal protocol for these exothermic tests to detect reliable and significant differences among different types of fiber. The experiments were focused on determining the effect of mass (increasing sample volume) and temperature sensor size. A larger sample (double) folded in the same area was expected to have a larger increase in temperature as measured by the sensor folded within the sample. The smaller temperature sensor was expected to have better intimate contact with the sample and thus better register the temperature changes.
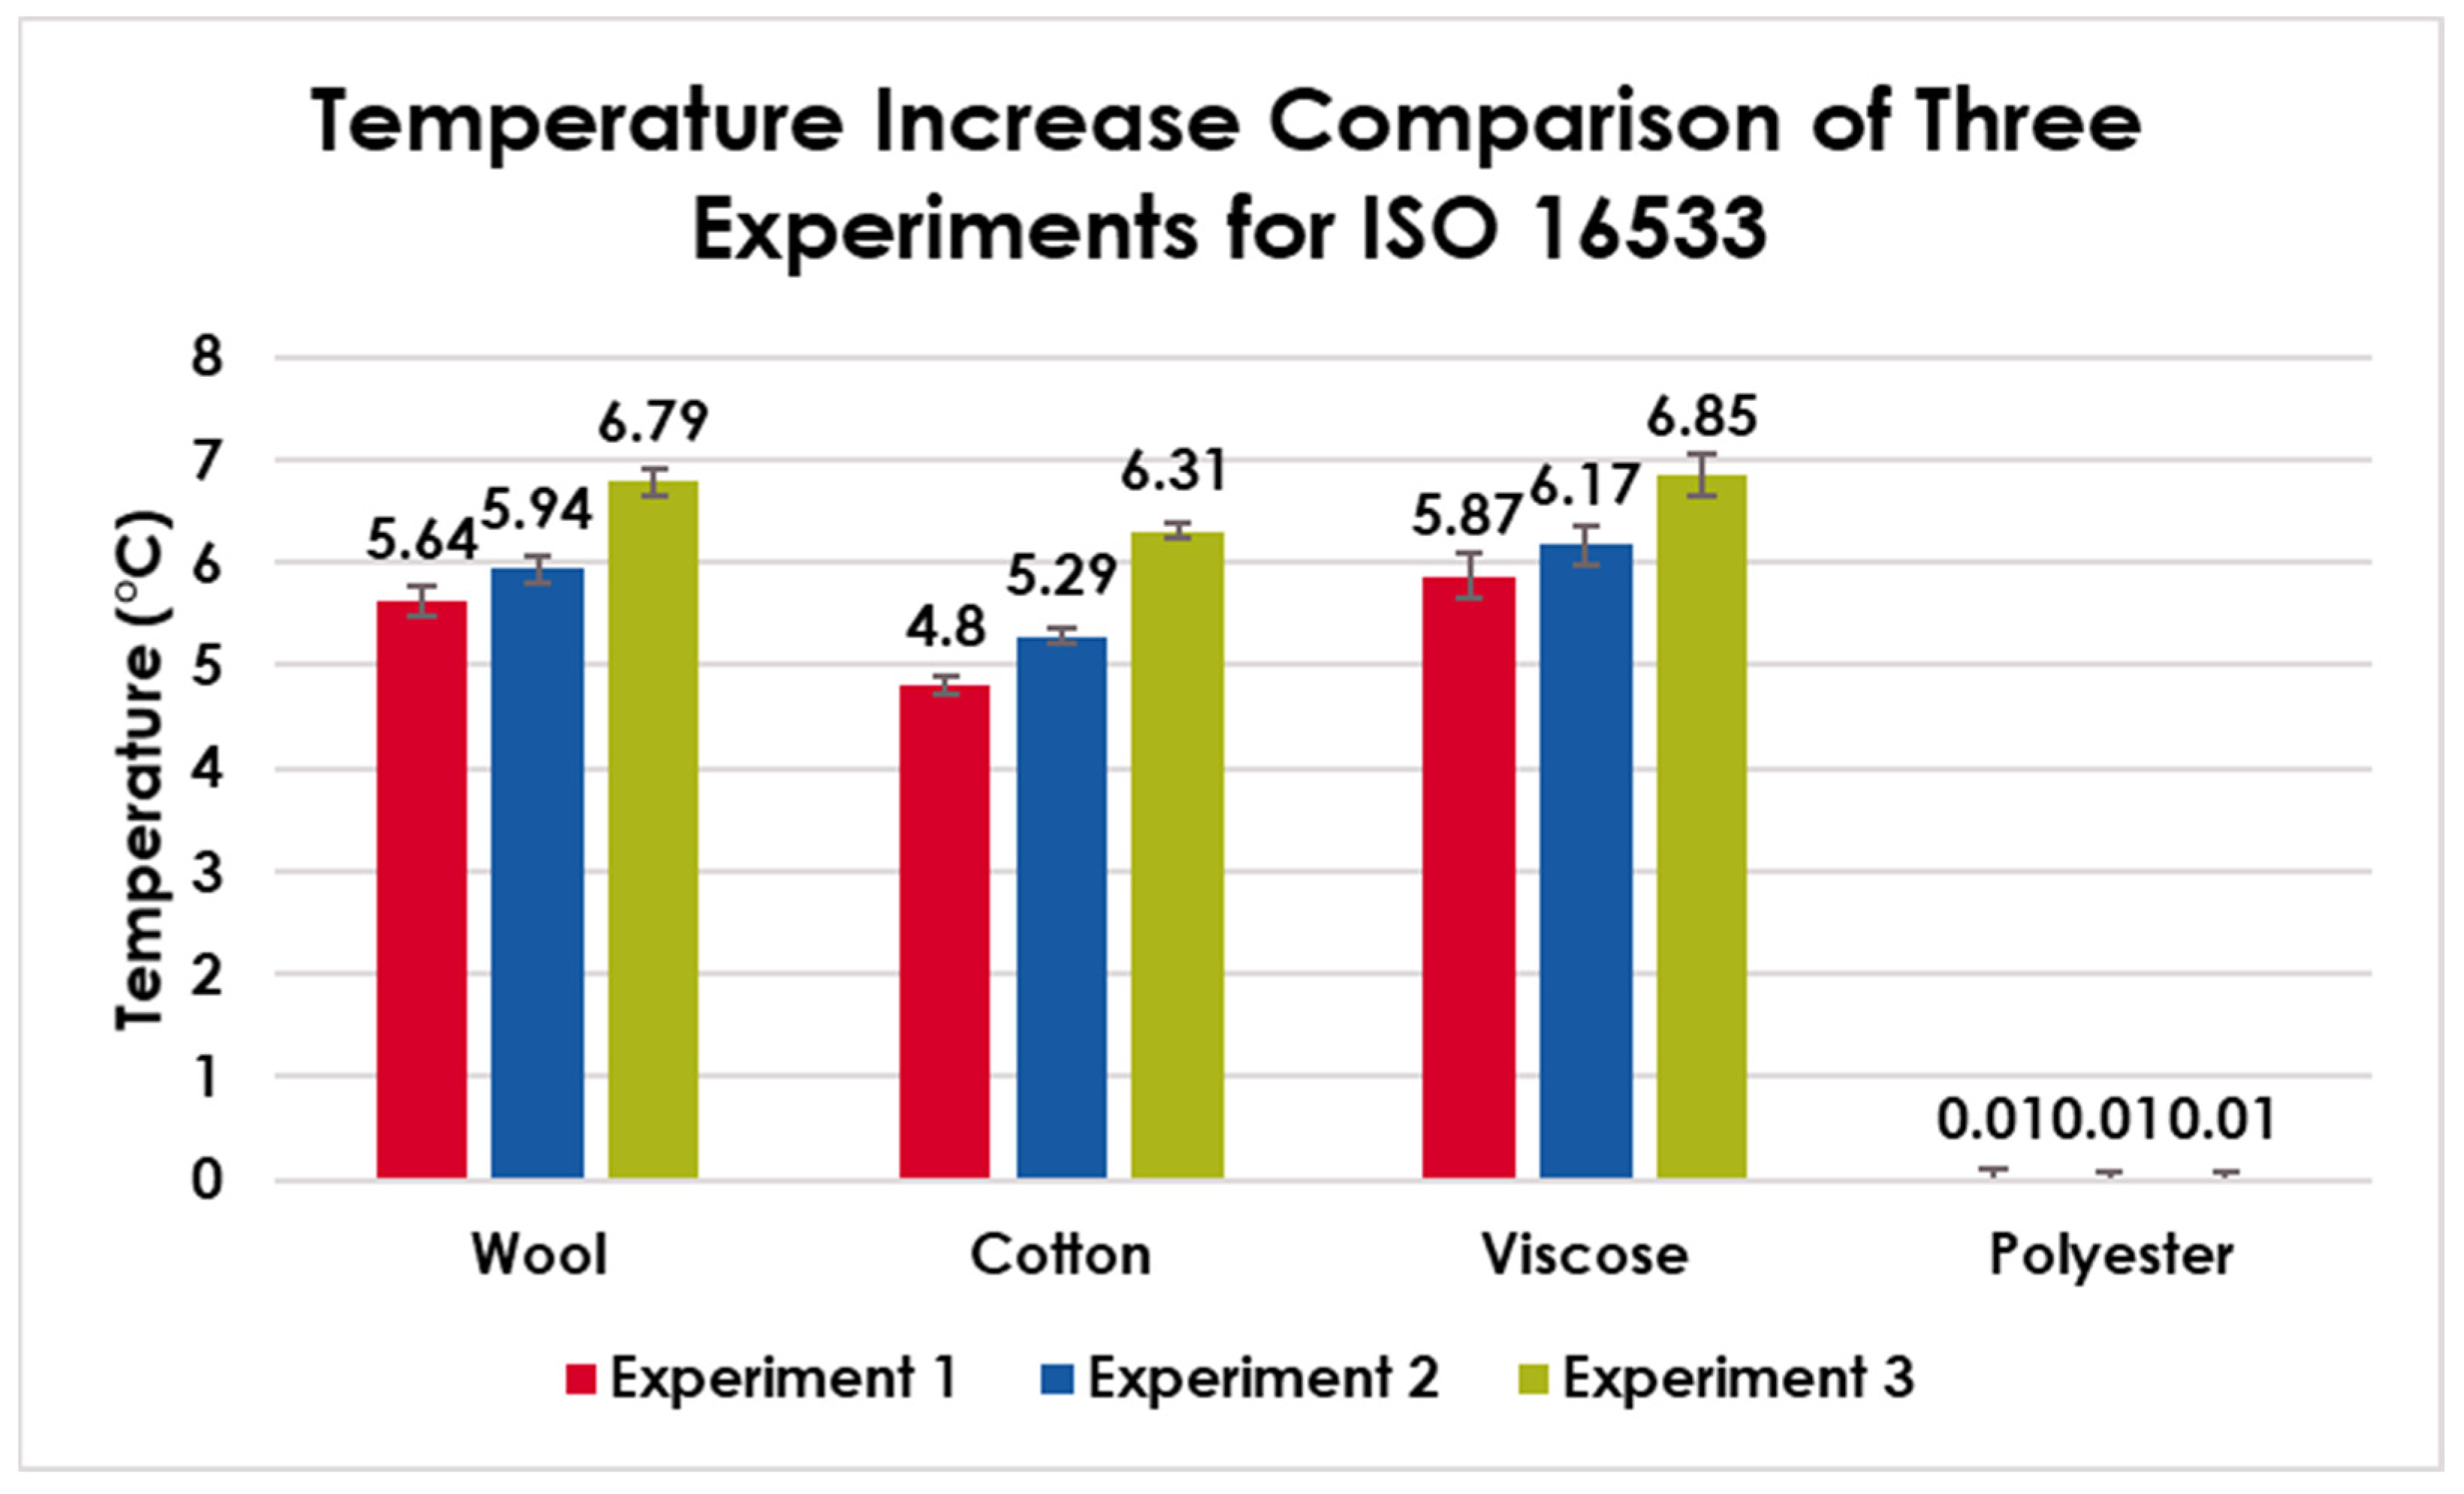
Figure 7 indicates that the three experiments on the same type of fabrics had increasing test results in terms of temperature increase. From E1, viscose fabrics had the highest temperature increase of 5.87 °C, while polyester had the lowest or almost no temperature increase. Cotton increased by 4.80 °C when switching the fabric from low to high humidity, while for wool, it was 5.64 °C. In addition, viscose had the highest temperature increase of 6.17 °C and 6.85 °C, respectively, for Experiment 2 and Experiment 3. In comparison, wool had an increase of 5.94 °C and 6.79 °C, and cotton had an increase of 5.29 °C and 6.31 °C, respectively, for E2 and E3. Polyester did not show any responses at all in the three experiments.
Tukey’s HSD post hoc test was used for each experiment to see if there was a mean difference in temperature increase between the fiber types using different principles. ANOVA yielded statistically significant differences for each pair of fiber type in each experiment, while showing no statistically significant differences between wool and viscose. This means that for the ISO 16533 test, during the step changes in humidity from low to high, the differences in mean temperature increase among each pair of wool, cotton, viscose, and polyester are significant, while the pair wool–viscose did not show any significant results for the increase in mean temperature (
Table 3). Even using a small sensor size minimizes the differences between fiber types. In
Table 4, it is evident that there are no statistically significant differences between wool, cotton, and viscose in terms of their temperature while changing the humidity from low to high. Increasing thickness yielded significant differences between the fiber types; additionally, in this case, the wool–viscose pair did not show any differences in temperature increase (
Table 5). Therefore, ISO 16533 can demonstrate the existence of an exothermic effect, but there is not enough evidence to say that the ISO 16533 test cannot differentiate between fiber types of relatively the same moisture regain percentage, for example, wool (14–19%) and viscose (13%) [
6].
3.4. Dynamic Hot Plate Test
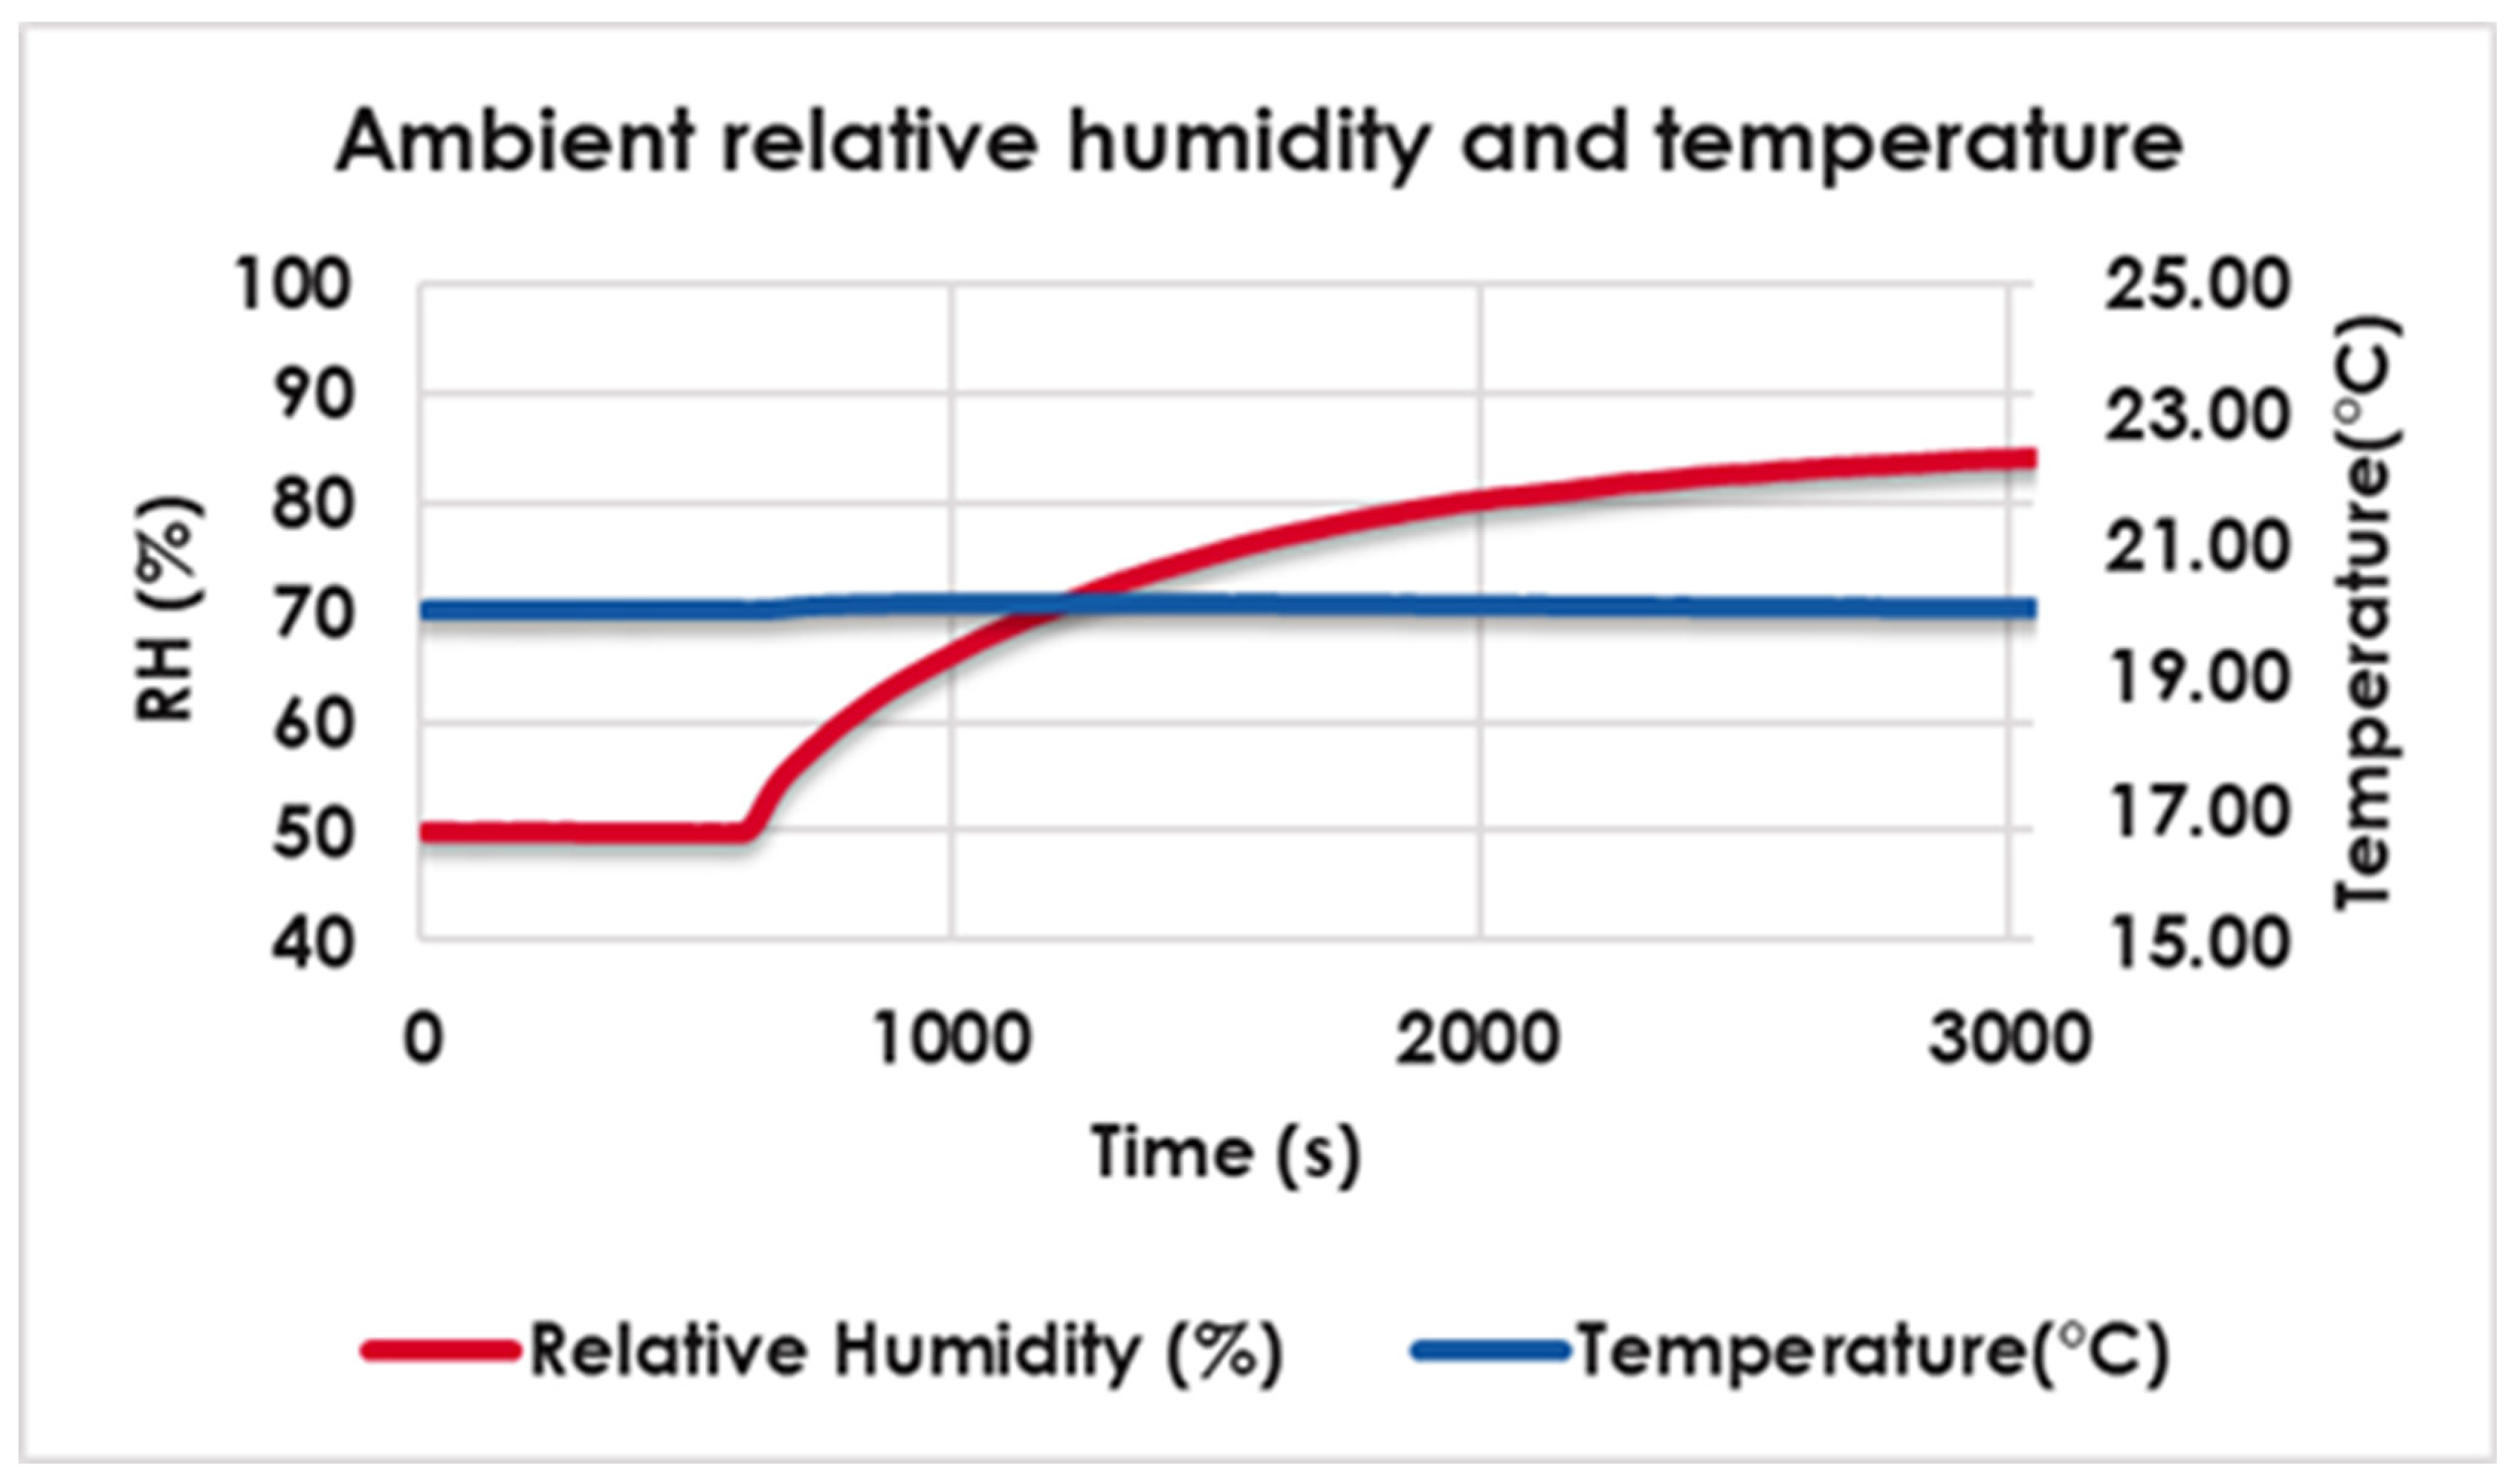
In this test, the change in the heat flux input of the increase in the hot plate as a function of the humidity is of interest. Fabrics generate heat as humidity increases; therefore, the hot plate’s heat flux input would be reduced to keep the temperature constant. The area of reducing heat flux over time represents the heat that is generated by the fabrics when they absorb moisture from the ambient environment. Since each fabric had a different thermal resistance, all heat flux curves were calibrated to the same baseline. The ambient temperature and RH are shown below in
Figure 8. The ambient temperature was stable and well controlled, while the ambient RH took some time to increase. The chamber took 23 min to increase the RH from 50% to 80% and 40 min to reach 85%.
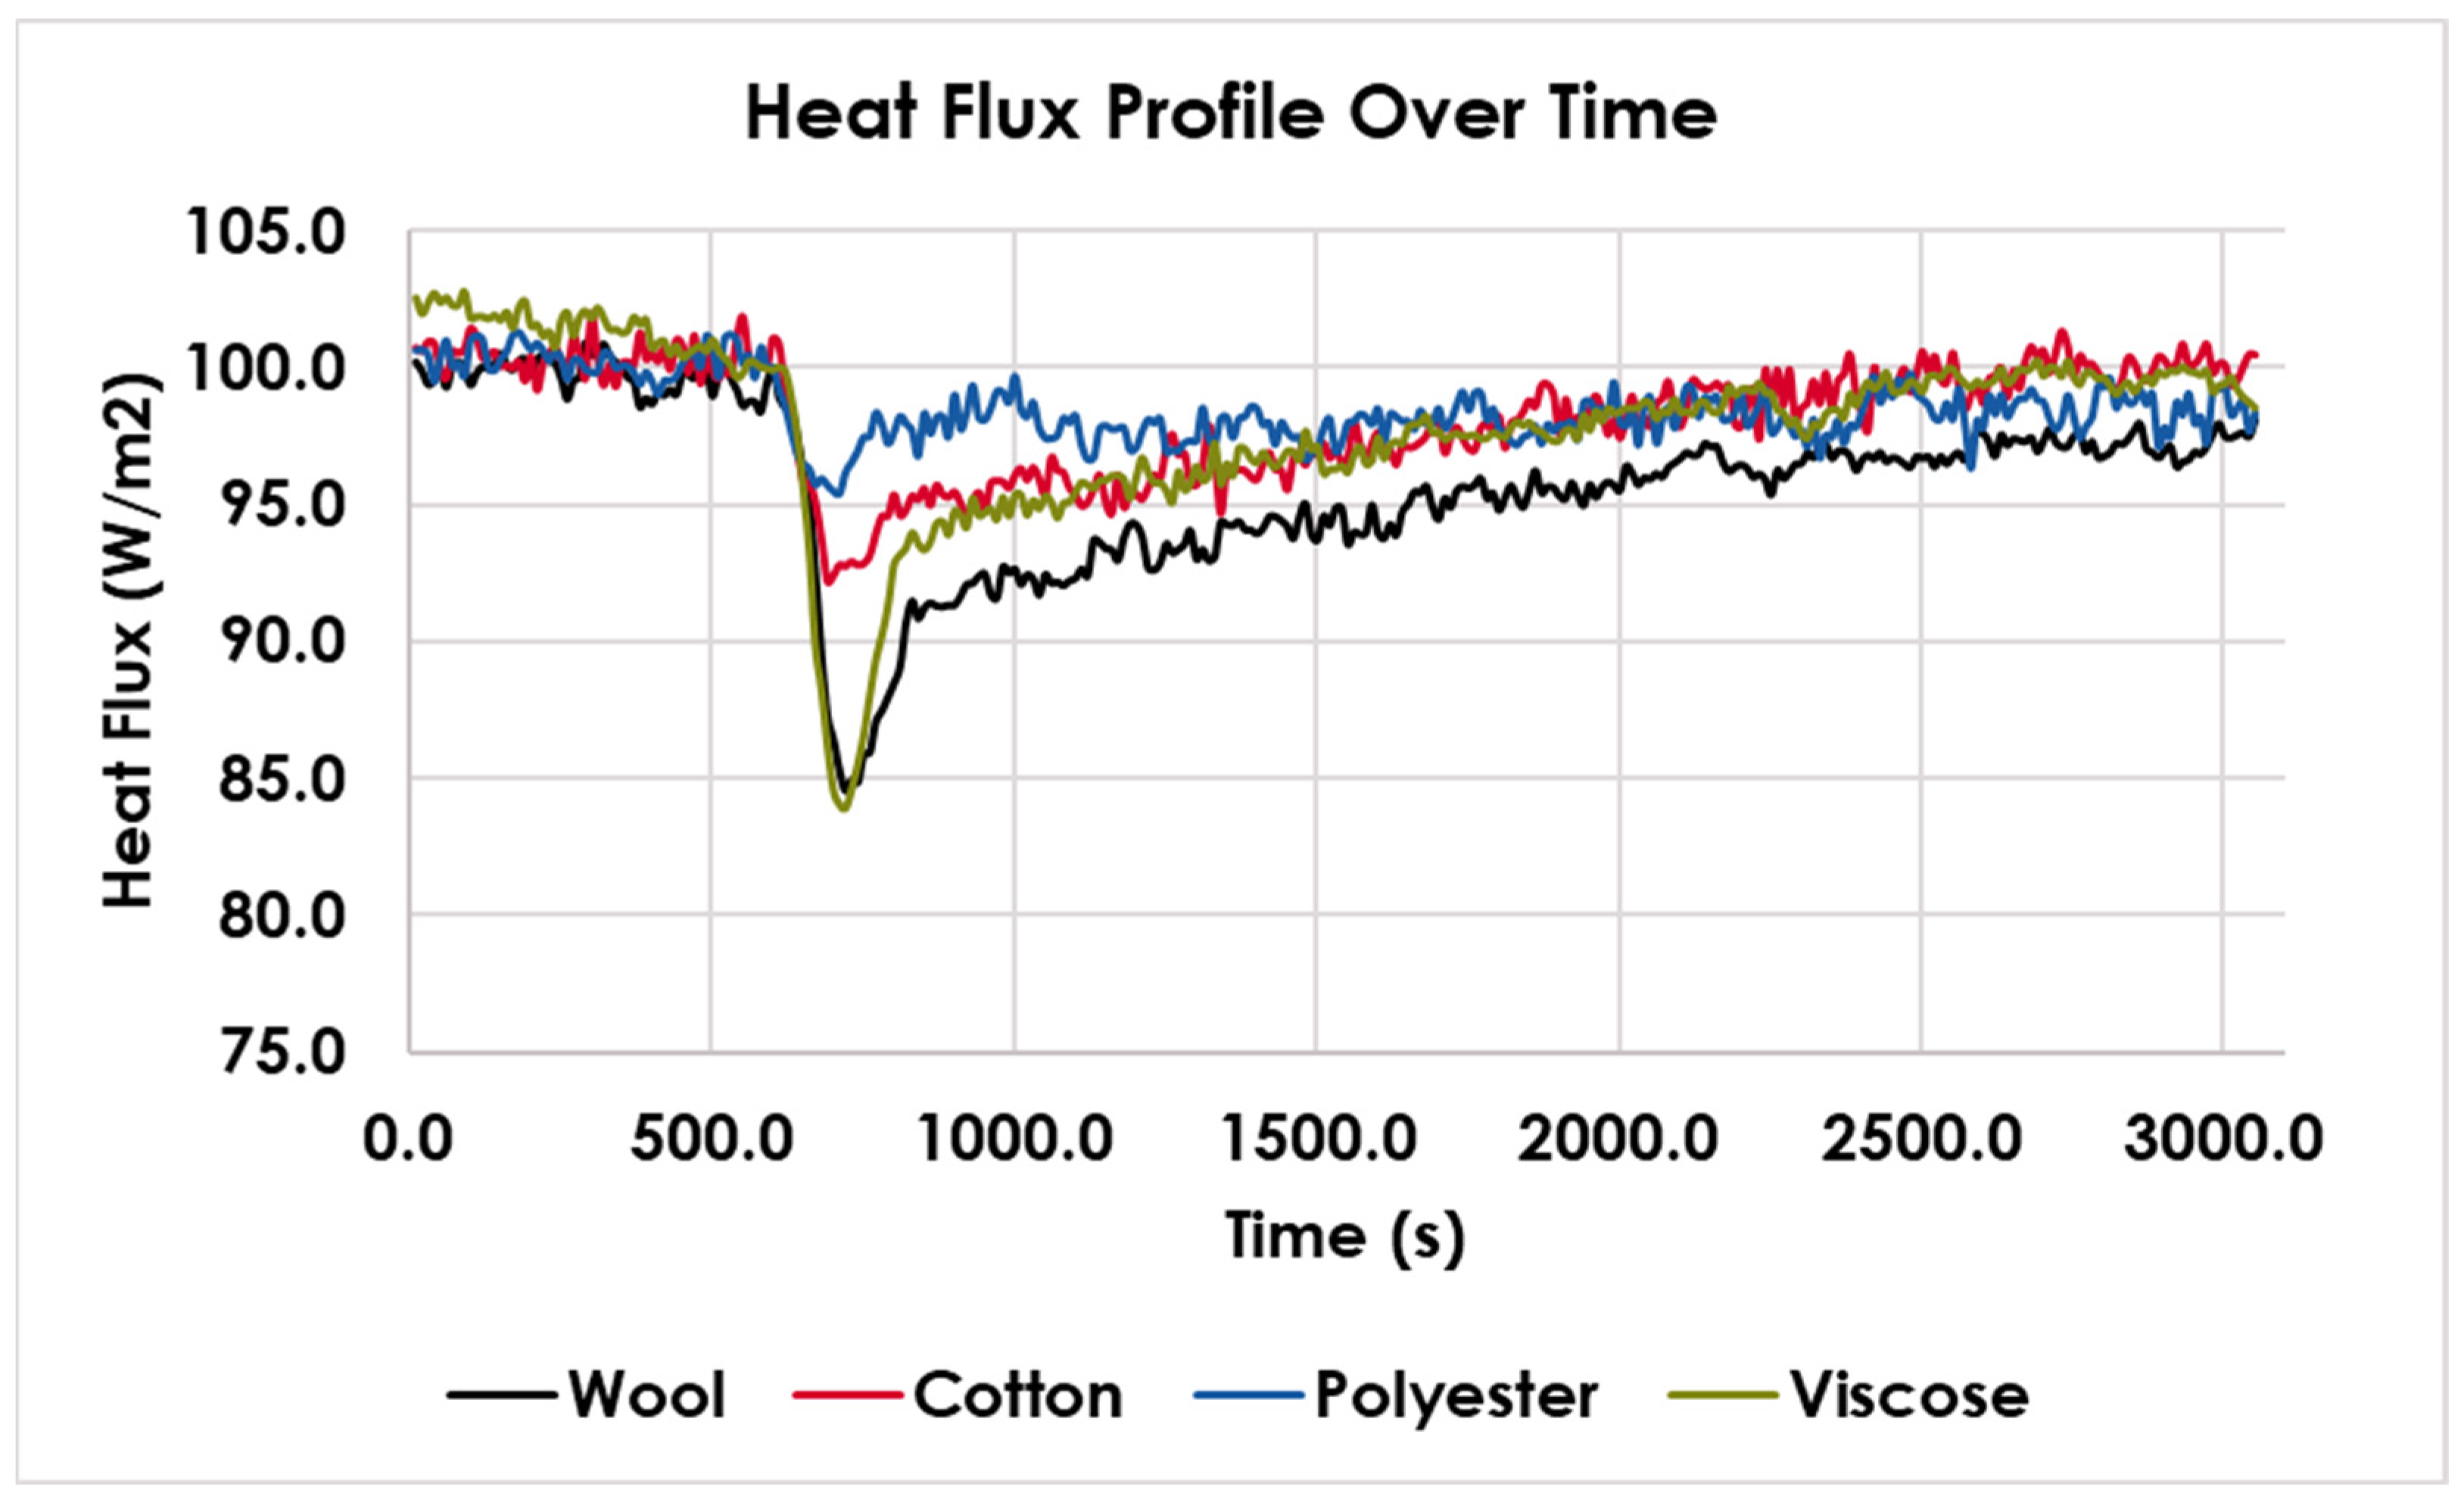
The change in the heat flux of the fabrics when ambient RH increased from 45% to 85% is shown in
Figure 9. Each curve of the fabric samples showed 10 min (600 s) heat flux at a stable state and 40.8 min (the 2450 s) after an increase in RH. For all fabrics, a decrease in the heat flux could be observed, which means that the fabrics generate heat when switching the RH from low to high. The curves had some noise and fluctuation, especially at the end of each trial, which was caused by the slow increase in RH. Wool fabrics had a relatively larger peak than polyester fabrics and cotton fabrics. Viscose had a peak pattern close to wool fabrics. To further analyze the curve, the peak area was calculated for each fiber type.
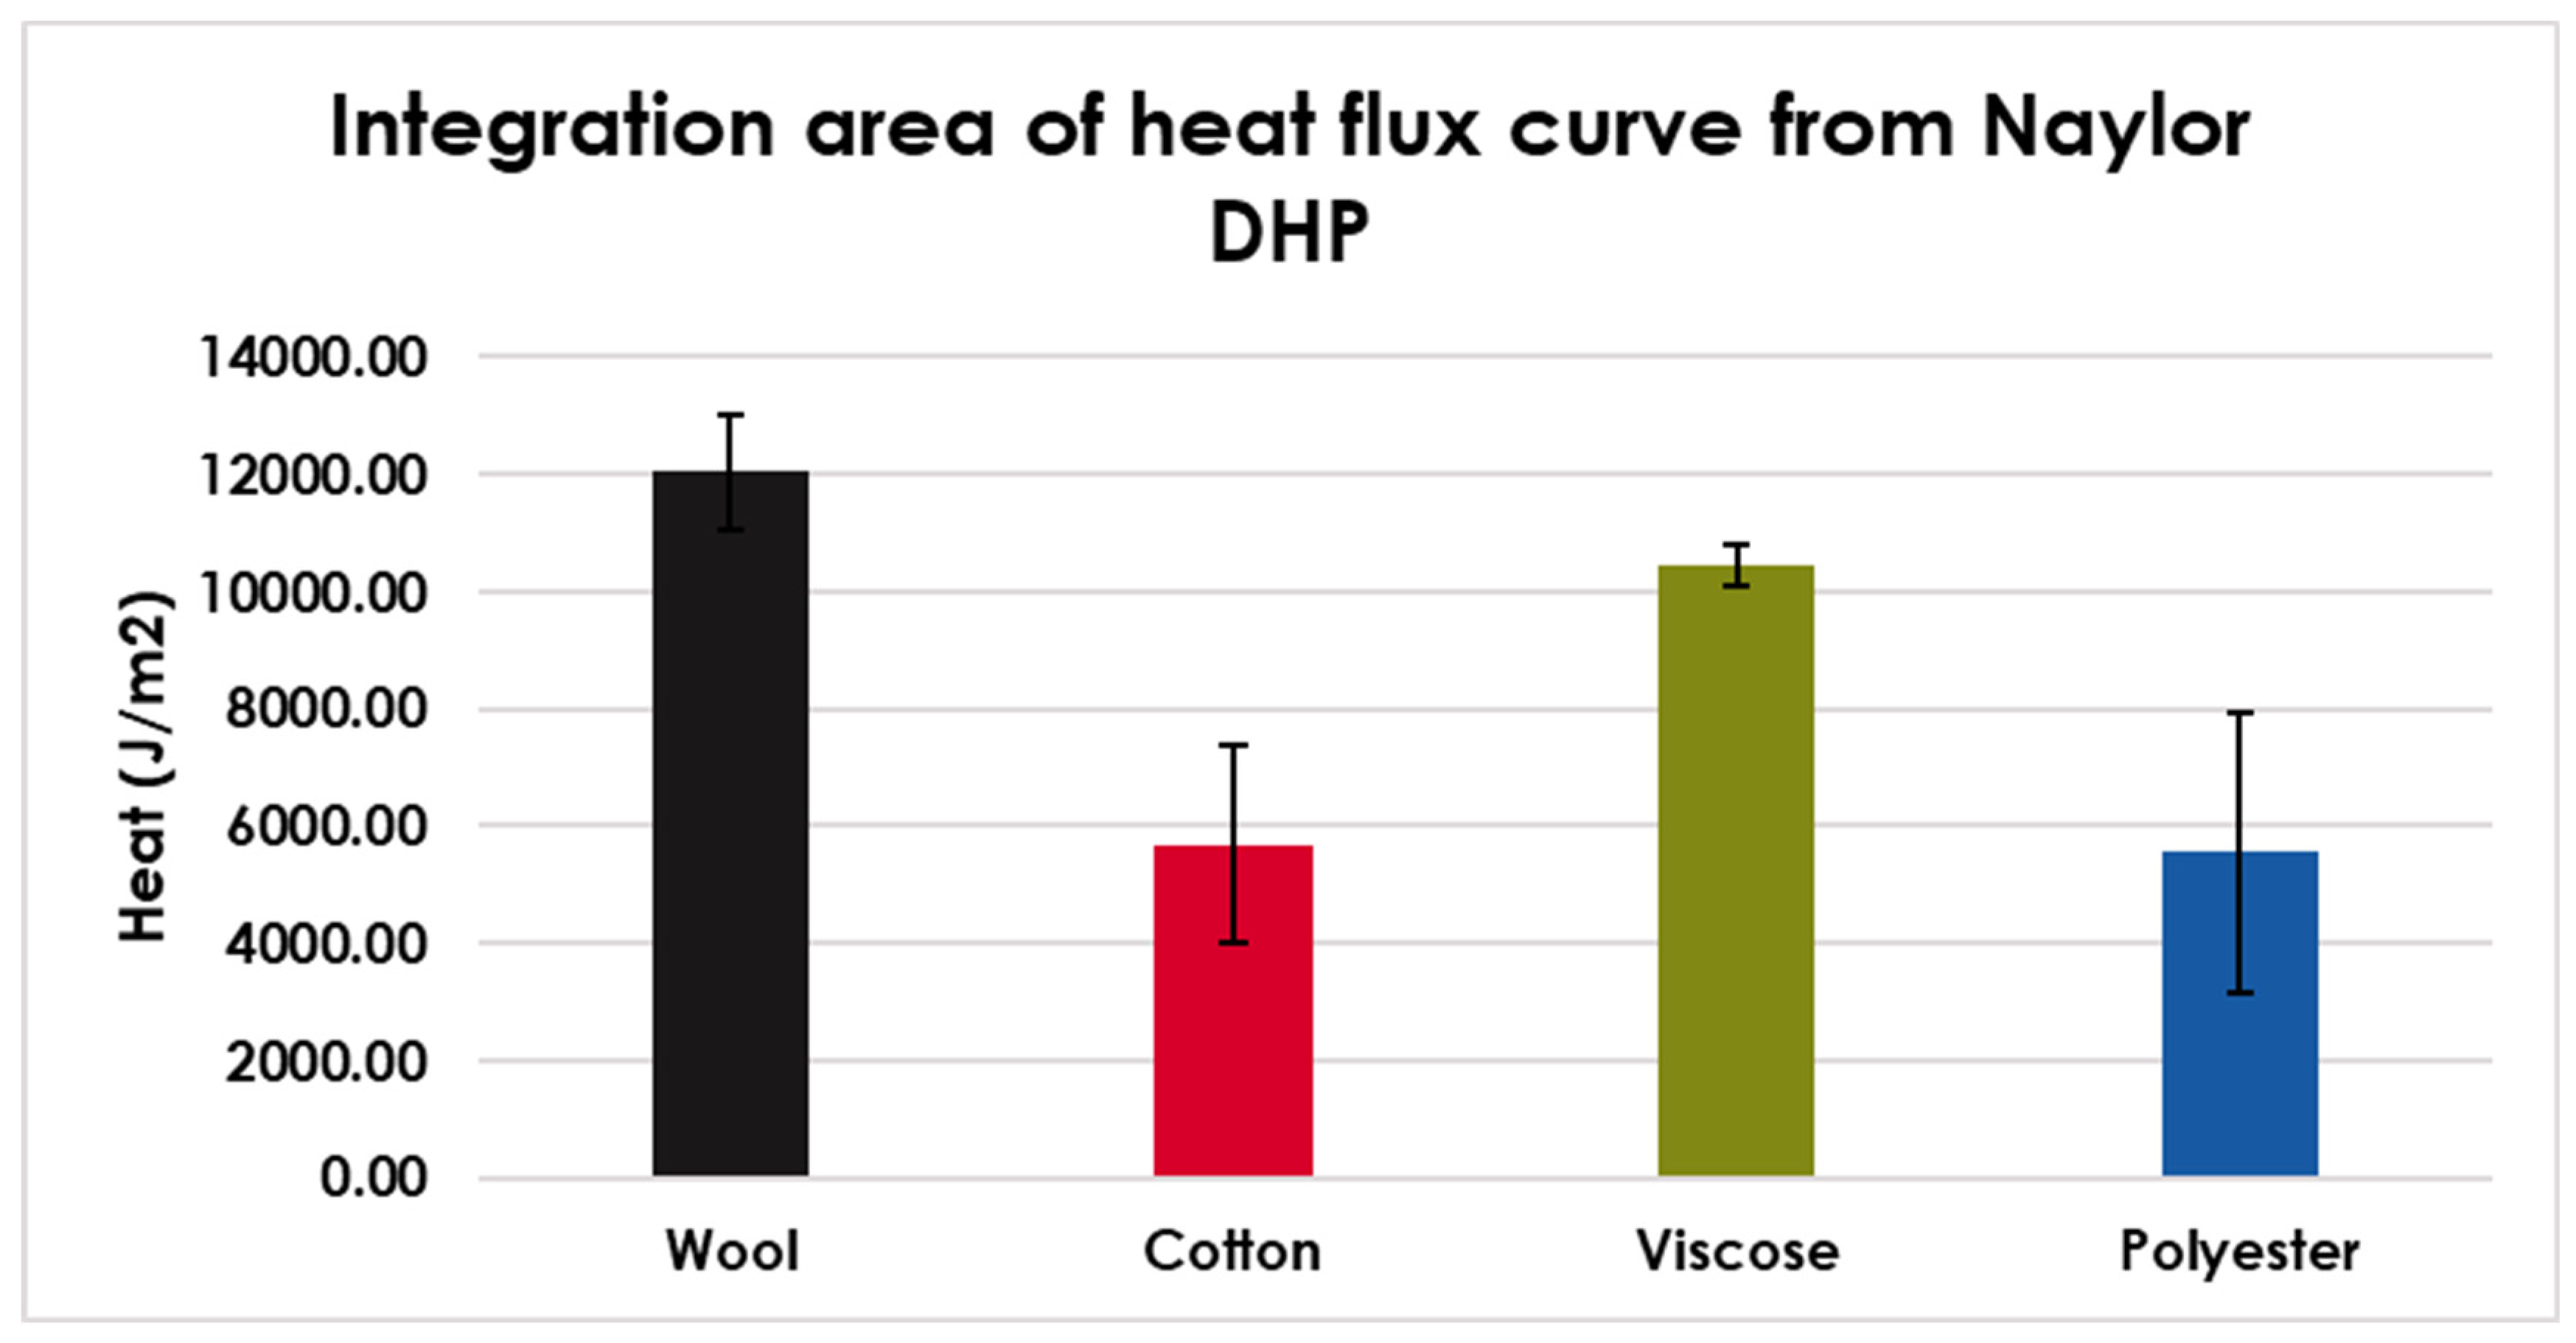
The integration of the heat flux peak over time is the heat generated by the fabrics.
Figure 10 shows the integration results of the heat flux curves, and detailed heat release data are shown in
Table 6. The average heat flux value for 10 min before switching RH was calculated as the baseline of steady state at 45% RH. The difference value between the baseline and each data point was determined and multiplied by the 10 s value as the data were recorded at every 10 s interval. The integration area obtained from the heat flux curve would be the heat release due to the humidity change. It is evident that wool and viscose had a higher heat release than cotton and polyester, and had significant differences.
3.5. Comparison of ISO 16533 Test, Dynamic Hot Plate Test, and Relationship with Moisture Regain Rate Test
Both test methods showed the exothermic phenomenon of textile materials when switching the RH from low to high. ISO 16533 used the temperature increase to interpret the exothermic phenomenon, while the DHP test method used heat flux (which can also be converted to generated heat). The temperature increase could only determine the highest temperature in a certain time period but was not able to determine the heat generated in the long term, as the temperature increases were very small after 60 min. Furthermore, ISO 16533 only measured the surface of a single point on the specimen, leading to a great variance (
Figure 7). The DHP method, on the other hand, measured the average heat release on a 60 ± 1 cm × 60 ± 1 cm scale and generated more heat with that much larger sample. However, ISO 16533 had an easy-to-build setup and was easily made and inexpensive. Furthermore, it was easier to control the RH at low temperatures and implement a rapid change in RH (‘step change’). The DHP method had higher equipment requirements. The increase in RH was much slower and not as well controlled at lower temperatures. It is envisioned that an additional, in-depth, mathematical analysis of the DHP data, with a slower humidity increase, may be able to separate the rate of change and convert it to data similar to the ISO16533 method.
The goal of ISO 16533 and DHP was to connect the known differences between static fiber properties (regain) and the dynamic exothermic properties of fabrics. As it is widely known and accepted from the literature, the regain for wool (water vapor uptake from “bone-dry” to 65% RH) is around 13–15 g/100 g dry fiber, whereas the regain for cotton is around 7–8 g/100 g dry fiber. These values could be considered static as they represent the steady state in these fabrics after equilibrating with the environment, which may take many hours, up to 24 h. Water vapor uptake is an exothermic effect; therefore, a larger water vapor uptake by wool, compared to cotton, should result in a significantly higher increase in temperature.
The ISO 16533 method exists as a standard and is relatively simple in its setup and procedure. Yet, there still seem to be some challenges in repeatability depending on container size and the effects of humidity changes. In addition, the current method suggests measuring temperature changes (peak temperature) only, which is shown to be a very poor estimate of exothermic effects. By determining the area under the curve, possibly with some data processing to reduce data noise and adjust for baseline drift, good results are obtained for the different fiber types. Thus, this method provides a direct measure of energy release that can be used to describe the potential for the heating and cooling of the wearer and predict the results for human physiological comfort.
However, the DHP method has the downside of using heat flux and plate temperature as controls, and thus requires advanced modeling to obtain reliable and accurate results. As an alternative, the possibility of running the hot plate tests in a “constant heat flux mode” can be suggested. Under these circumstances, the plate temperature is no longer constant, but the plate generates a constant heat flux, and the corresponding temperature changes will be measured. The downside of this method is that the plate is not equal to human skin, so the resulting temperatures cannot be directly considered equal to changes in skin temperature. However, the temperature changes are likely very strongly correlated, as the temperature change is a fundamental physics response, but the size of the response depends on the exact thermal material properties. As a consequence, such experiments might better reflect our human experimental data. Furthermore, as heat flux is fixed, any resulting transient change in plate temperature (and fabric temperature) is likely to be directly correlated to the exotherm energy released.
There seems to be another challenge with the hot plate data. The fabrics on the hot plate have a temperature between the plates and air temperature, usually around 26–27 °C on the outside and 30–31 °C on the inside of the fabric, thus an average temperature around 28–29 °C. As a consequence, the relative humidity of the fabric is different from the air. With the RH in the air changing from 45% to 85% at 20 °C, the change in RH at the same vapor pressure at 29 °C (fabric temperature) would change from 16.5% to 47.5%, thus exhibiting a much smaller increase in RH (30% change instead of 40% change). Furthermore, this would be in the flatter parts of the standardized regain curve; thus, the expected regain uptake in the experiment was much lower than the expected effect associated with an RH change from 45% to 85%. The actual fabric temperature and associated RH must be calculated to predict exothermic effects. This issue seems not to have been addressed by Naylor in their method and needs further study.
However, this would assume that the water vapor uptake process is instantaneous, and it can be expected from transport physics (diffusion, absorption, and forced convection) phenomena that the process is dynamic in reality (i.e., it will take time to absorb moisture). Thus, dynamic tests should be conducted to determine practically relevant differences between wool, viscose, cotton, and polyester as they happen with time after a change in humidity, as that is what a wearer would perceive, not just the static endpoints.
The fabric test methods described in this paper have not led to a clear and convincing test procedure that demonstrates the difference between hygroscopic fibers for practical applications. This seems to be due to the complex time dependencies and dynamics in this multistep adsorption process. Even with a ‘perfect’ step change in the RH of the environment, the water vapor uptake of the fabric samples, due to the regain effect, is not instantaneous but takes time. The consequence here is that water vapor uptake needs time; after that, temperature build-up and cooling-down are also processes that have specific time constants. More studies will be needed to develop a set of test methods that allow a good prediction of these effects and their relevance to human thermal comfort.


