
Analytical Methods for the Identification and Quantitative Determination of Wool and Fine Animal Fibers: A Review


Abstract
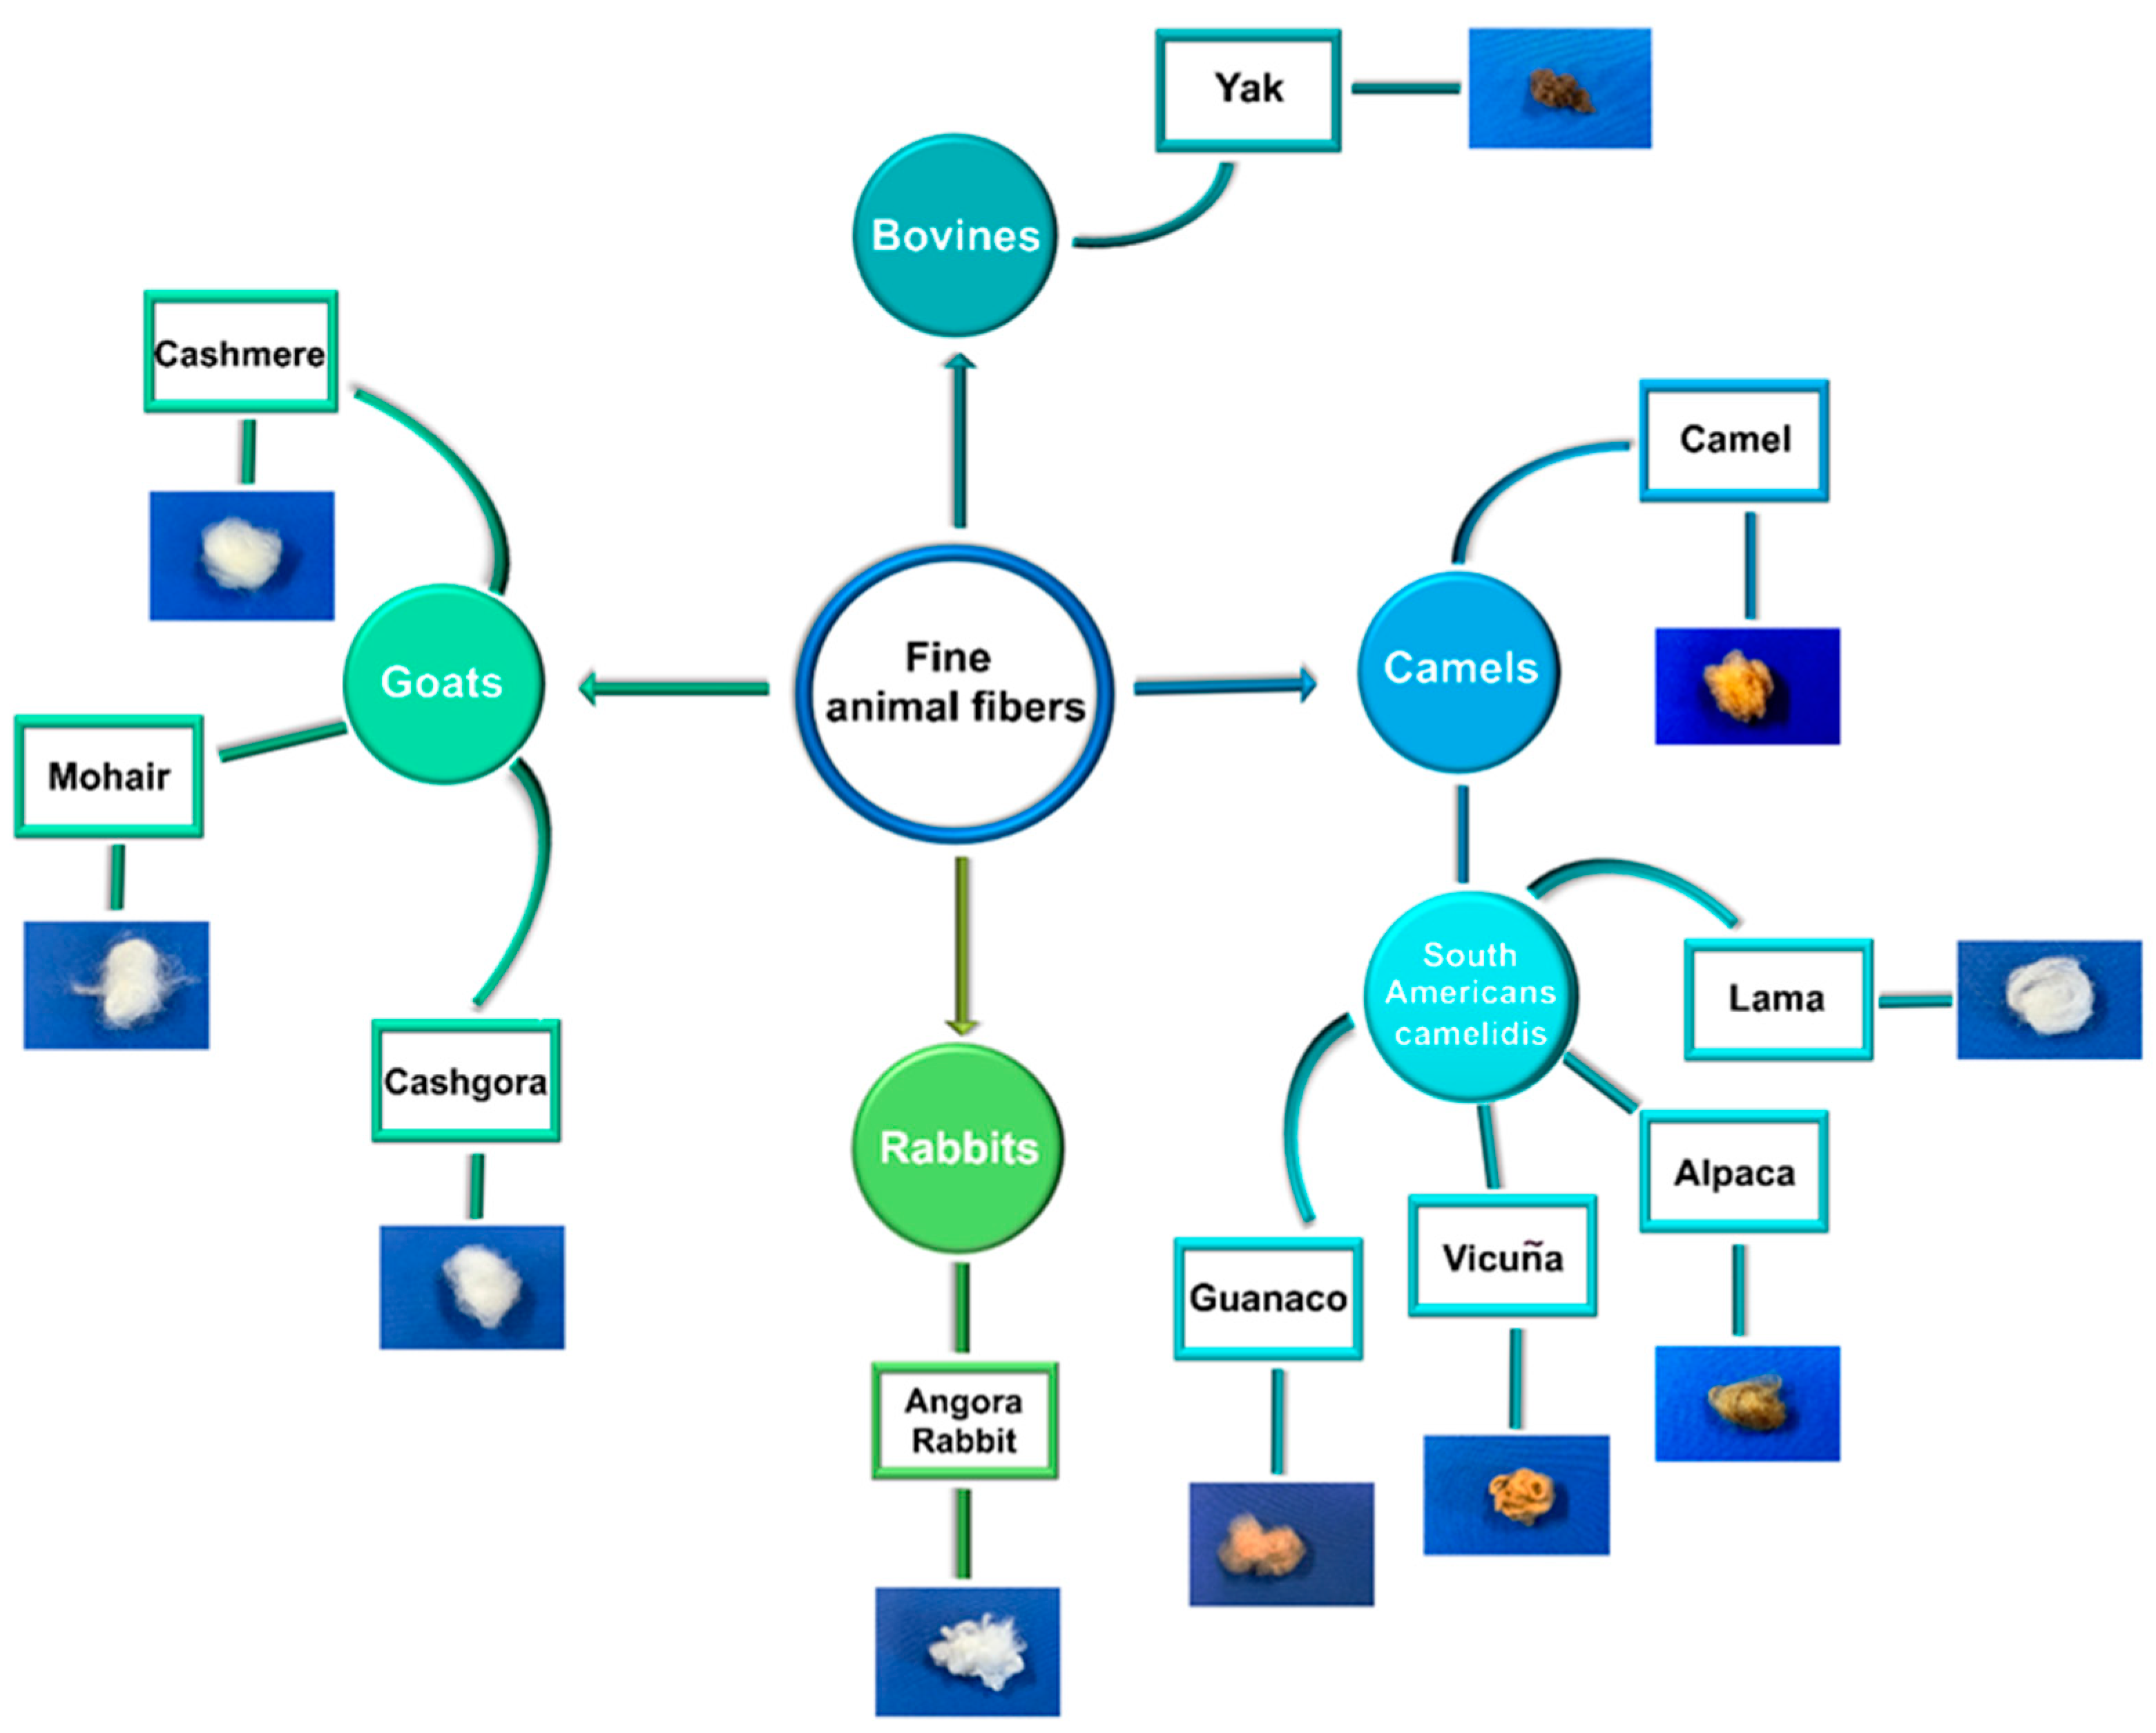
:1. Introduction
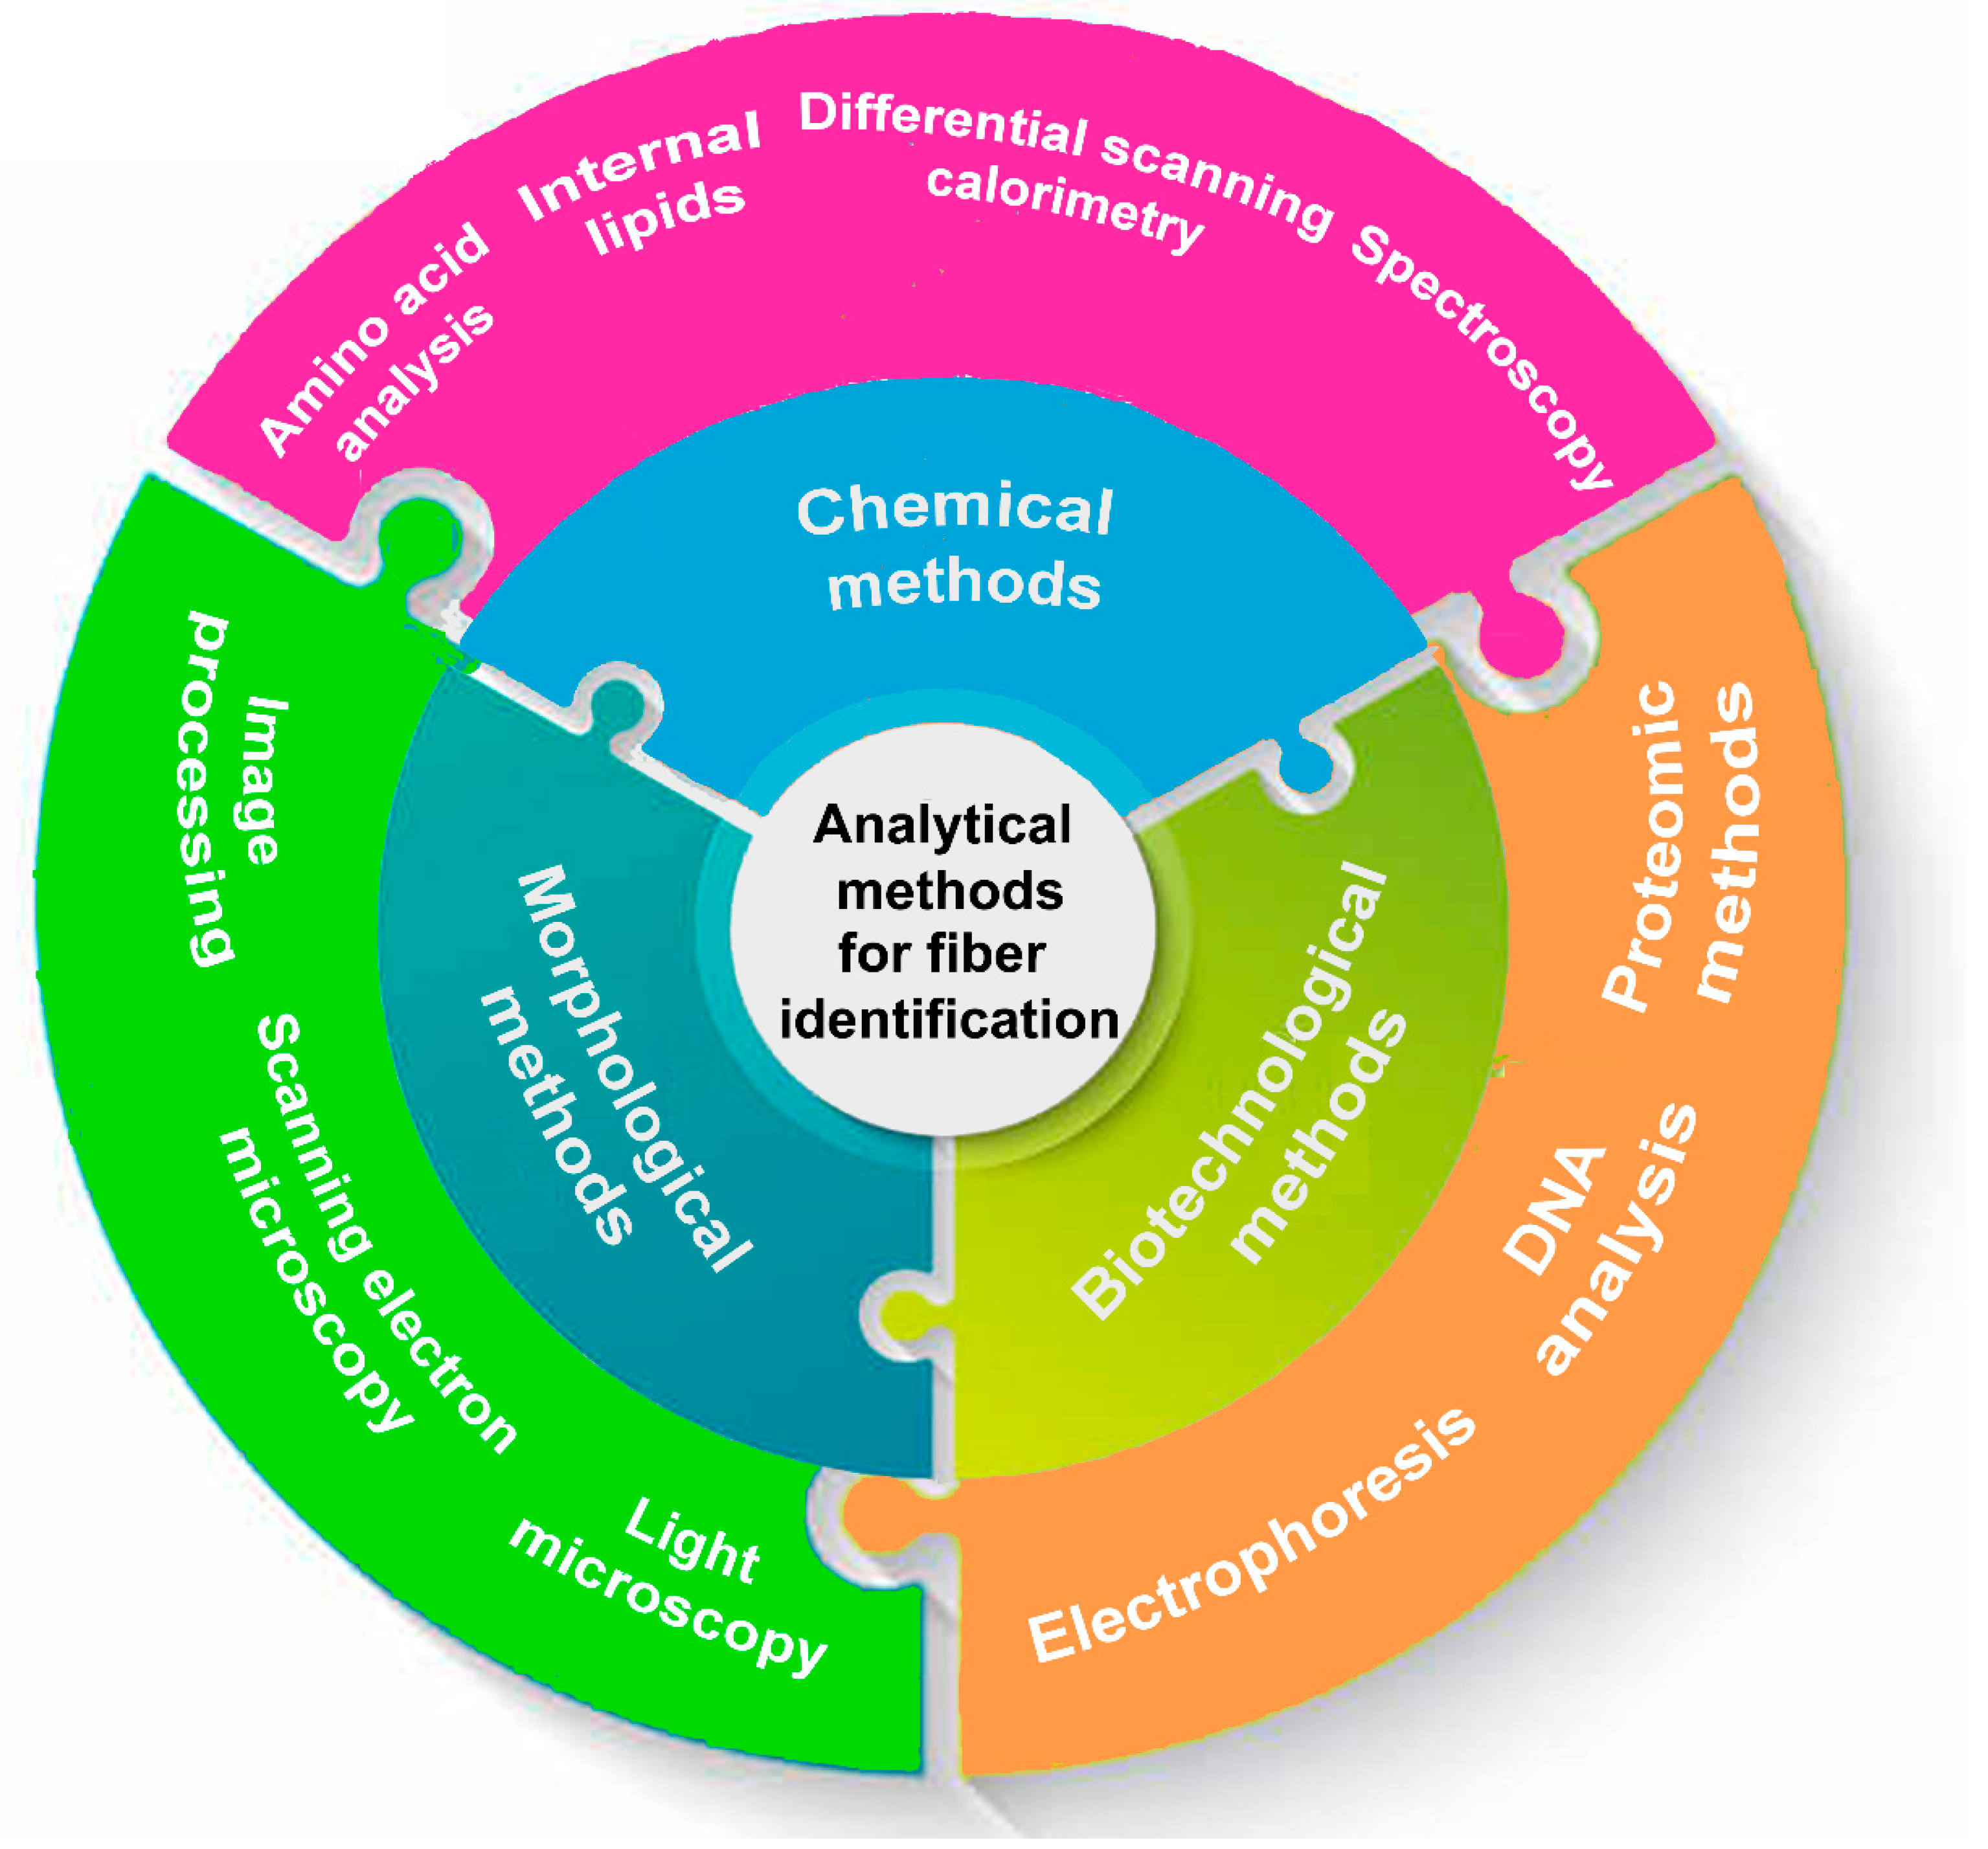
2. Analytical Methods
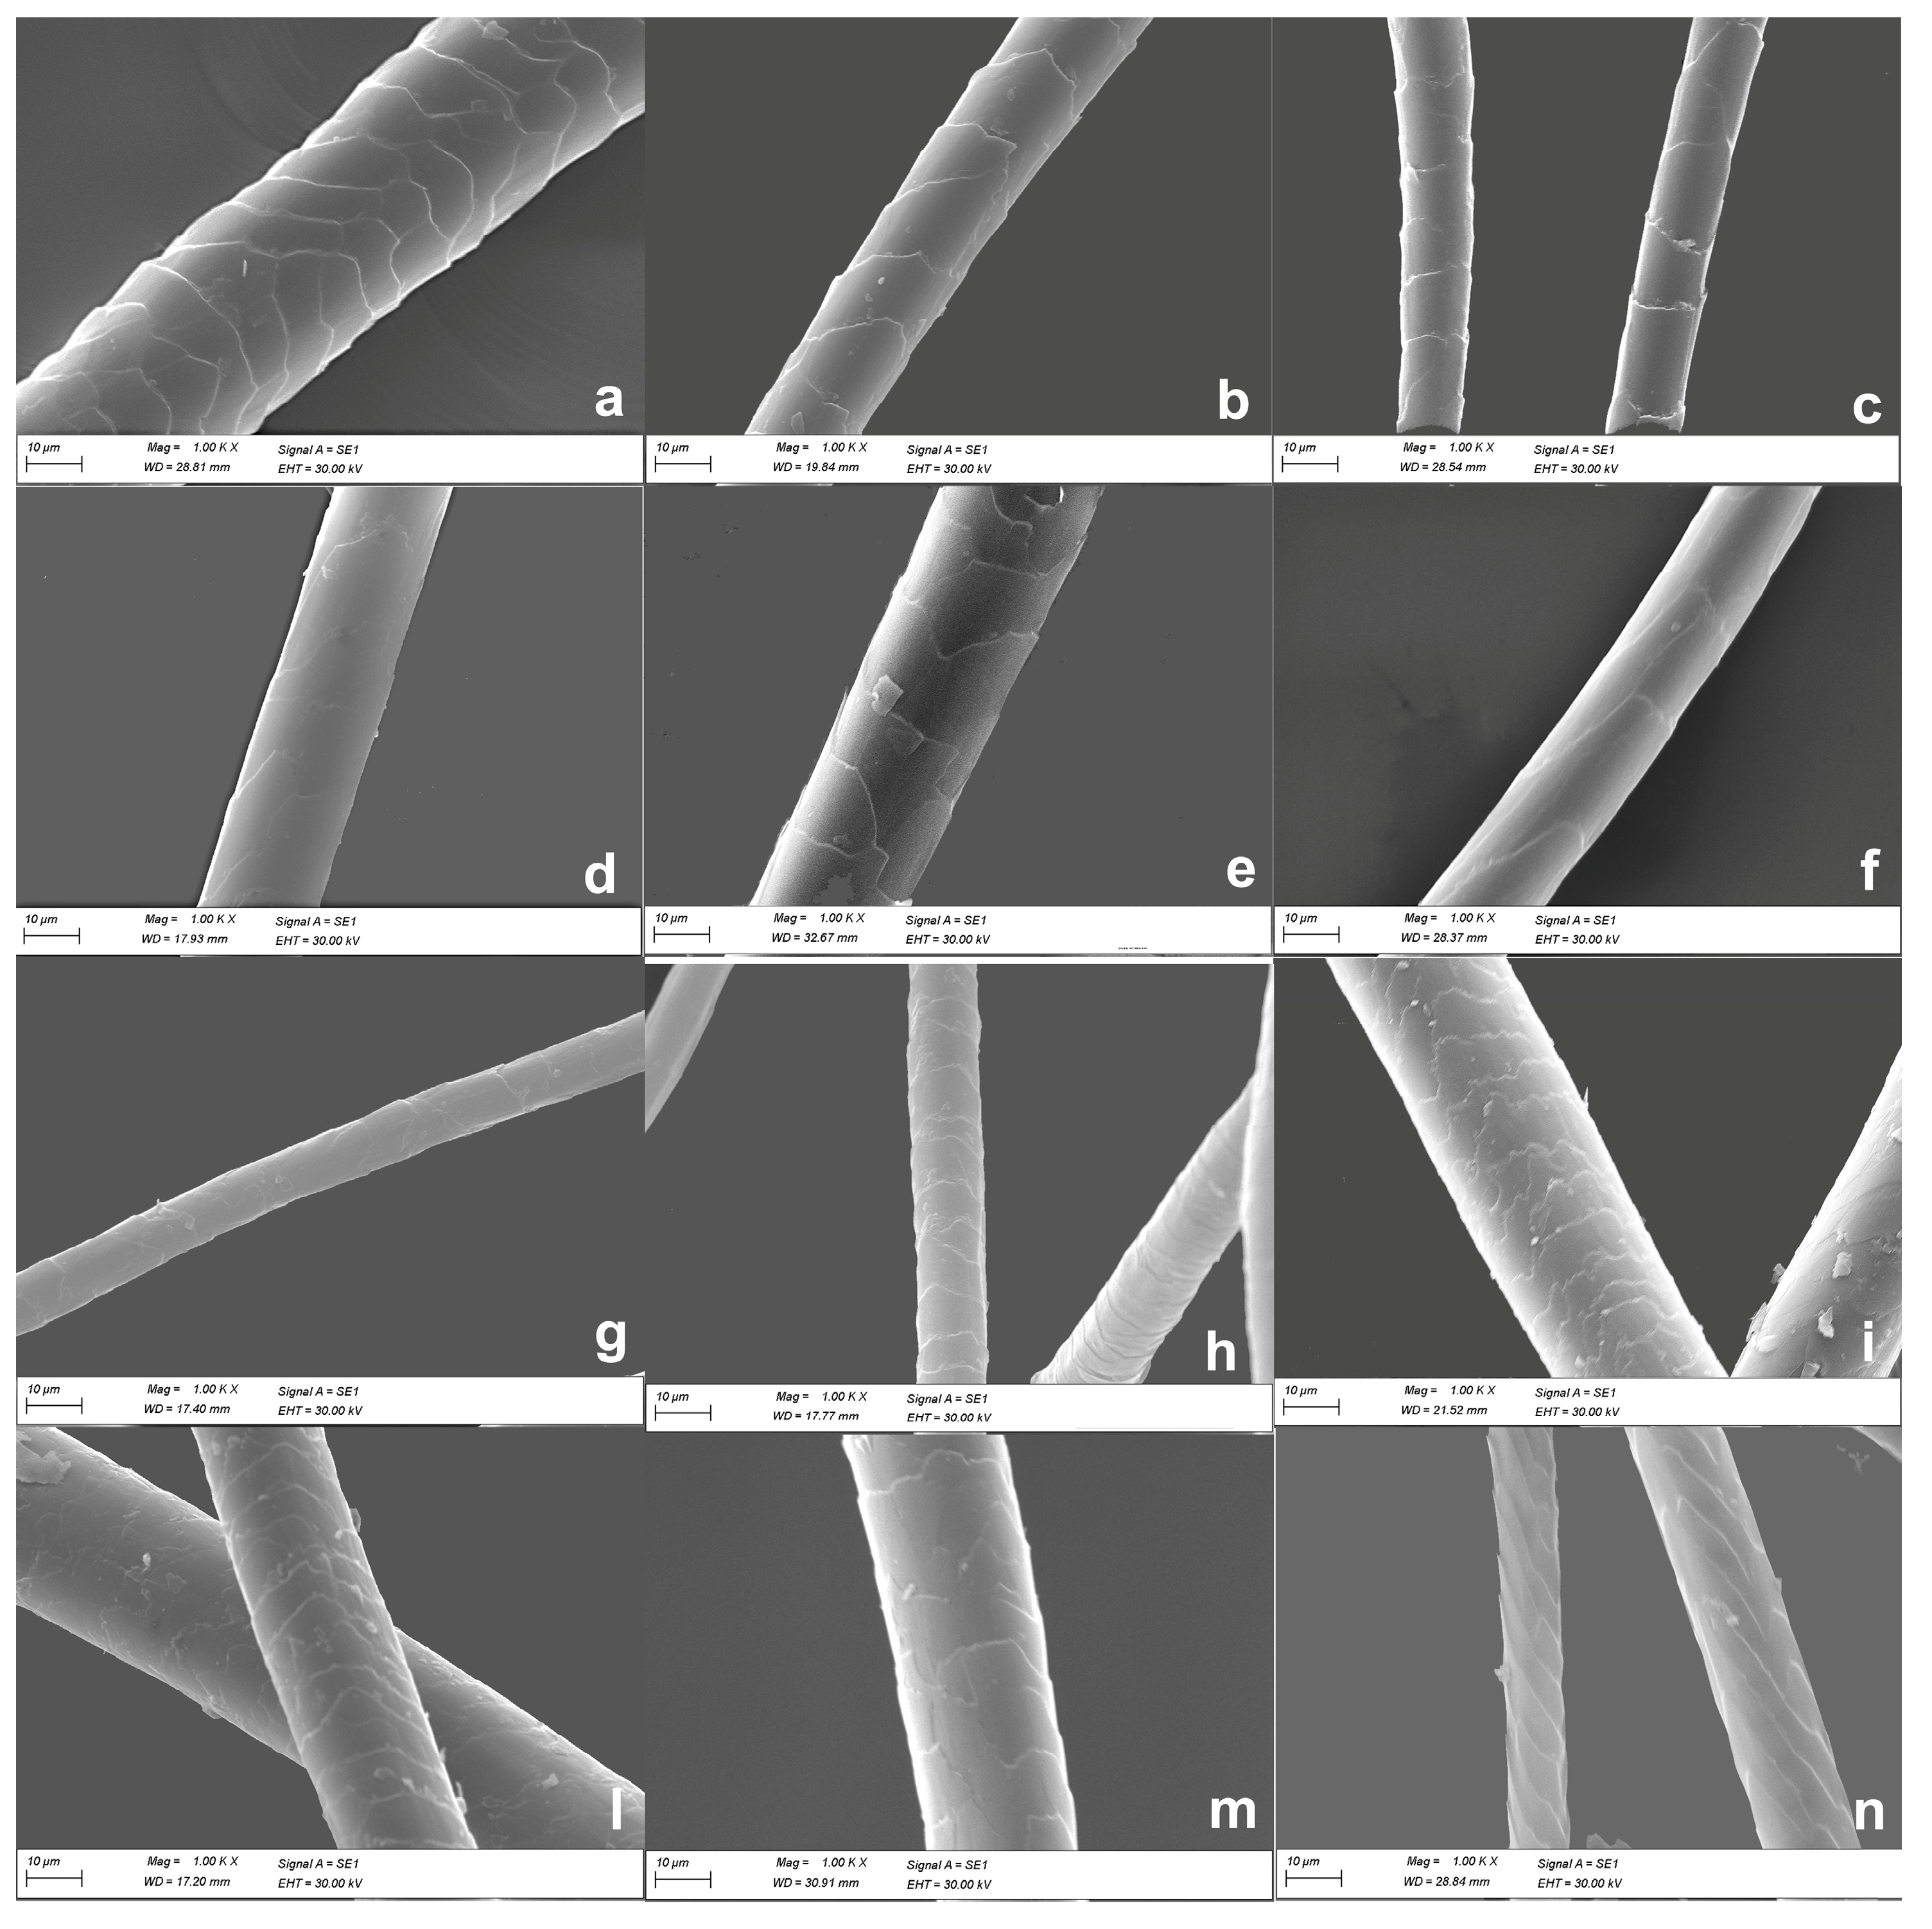
2.1. Morphological Methods to Identify Wool and Fine Animal Fibers
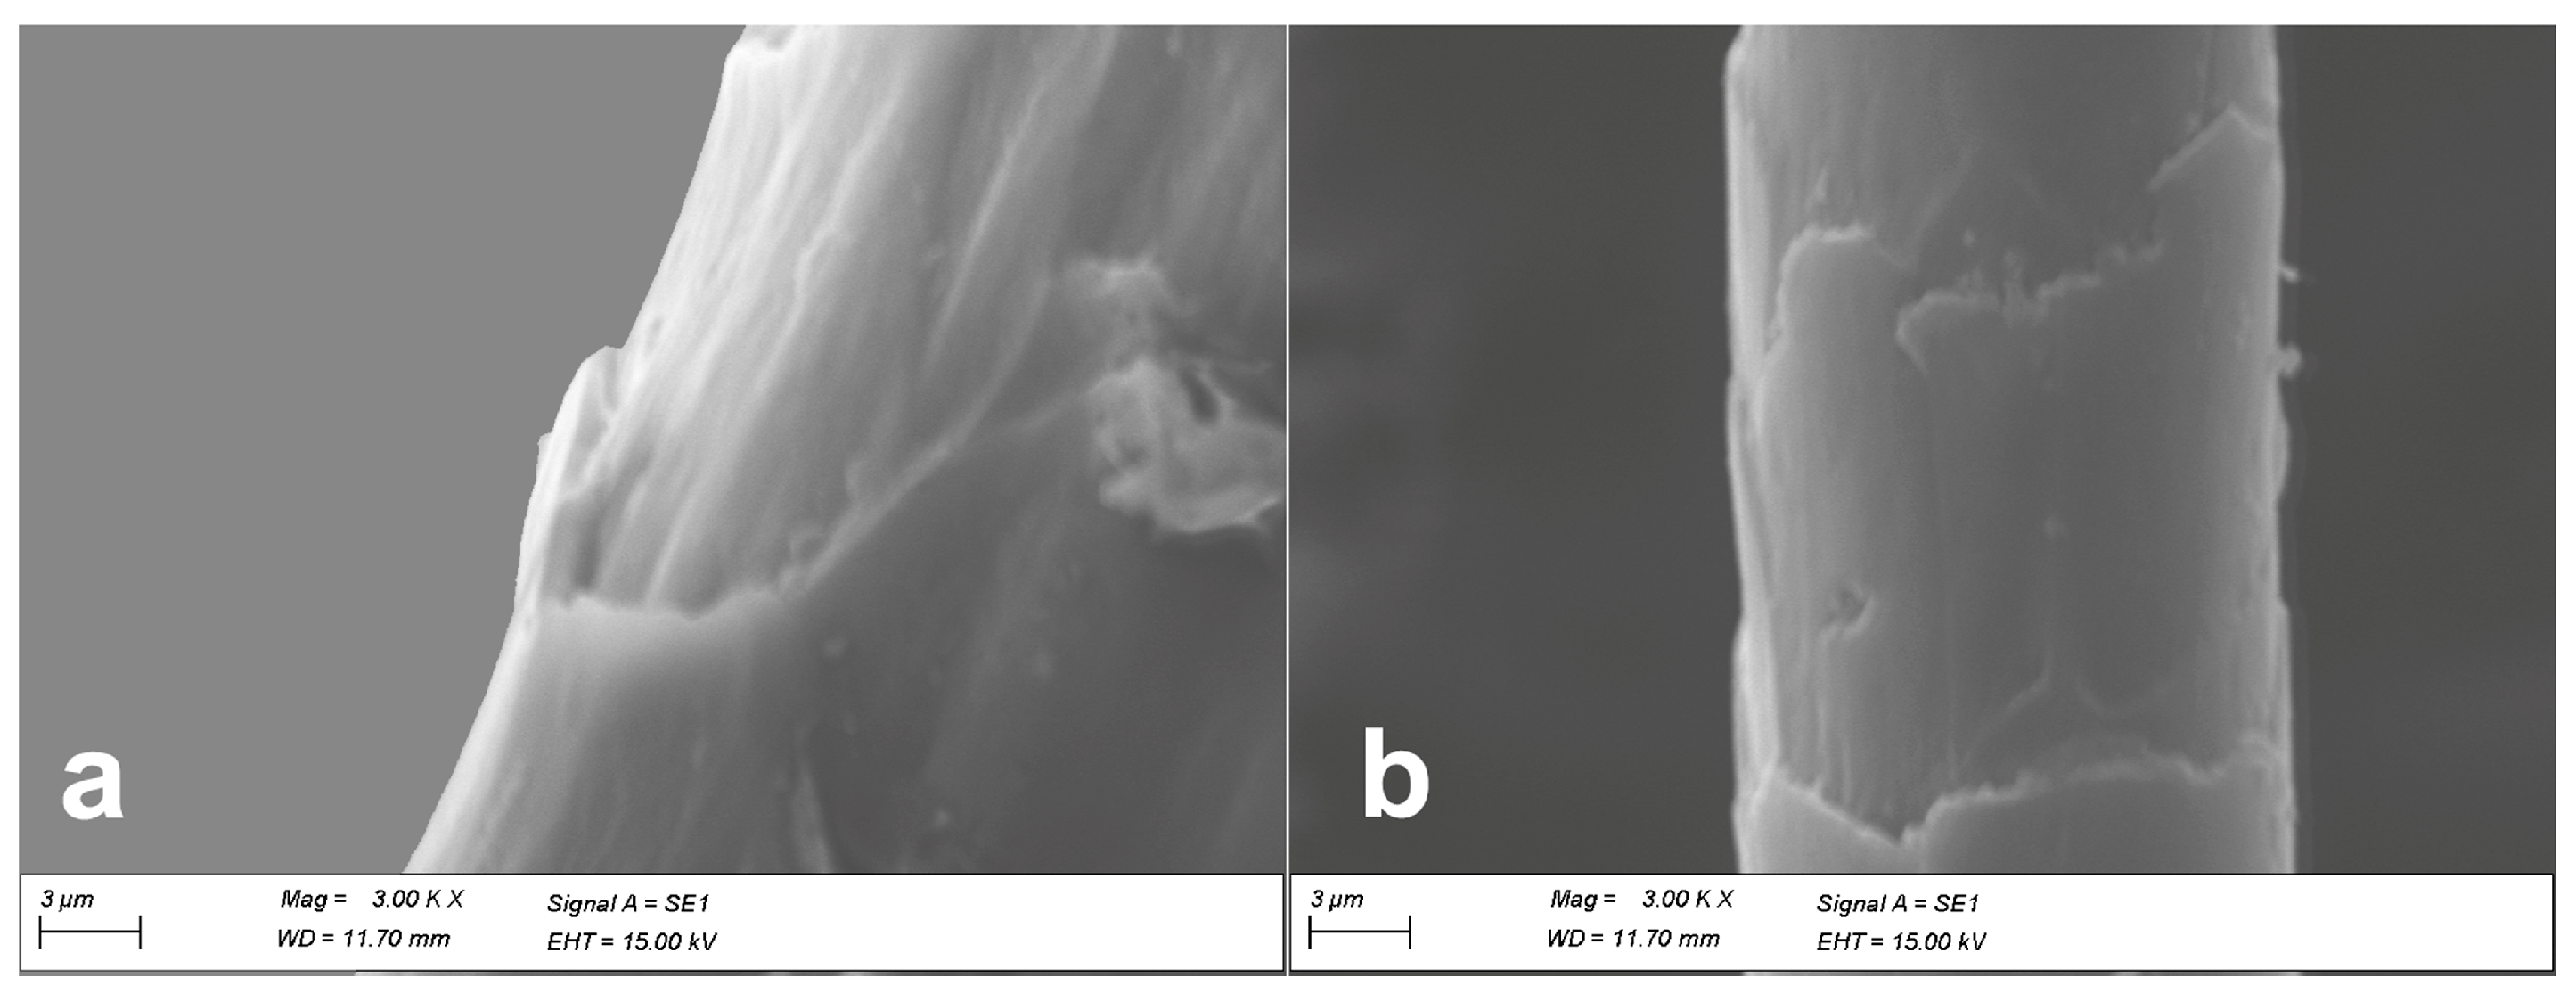
2.1.1. Light- and Scanning Electron Microscopy
2.1.2. Image Processing
2.2. Chemical Methods
2.2.1. Amino Acids and Internal Lipids Analysis
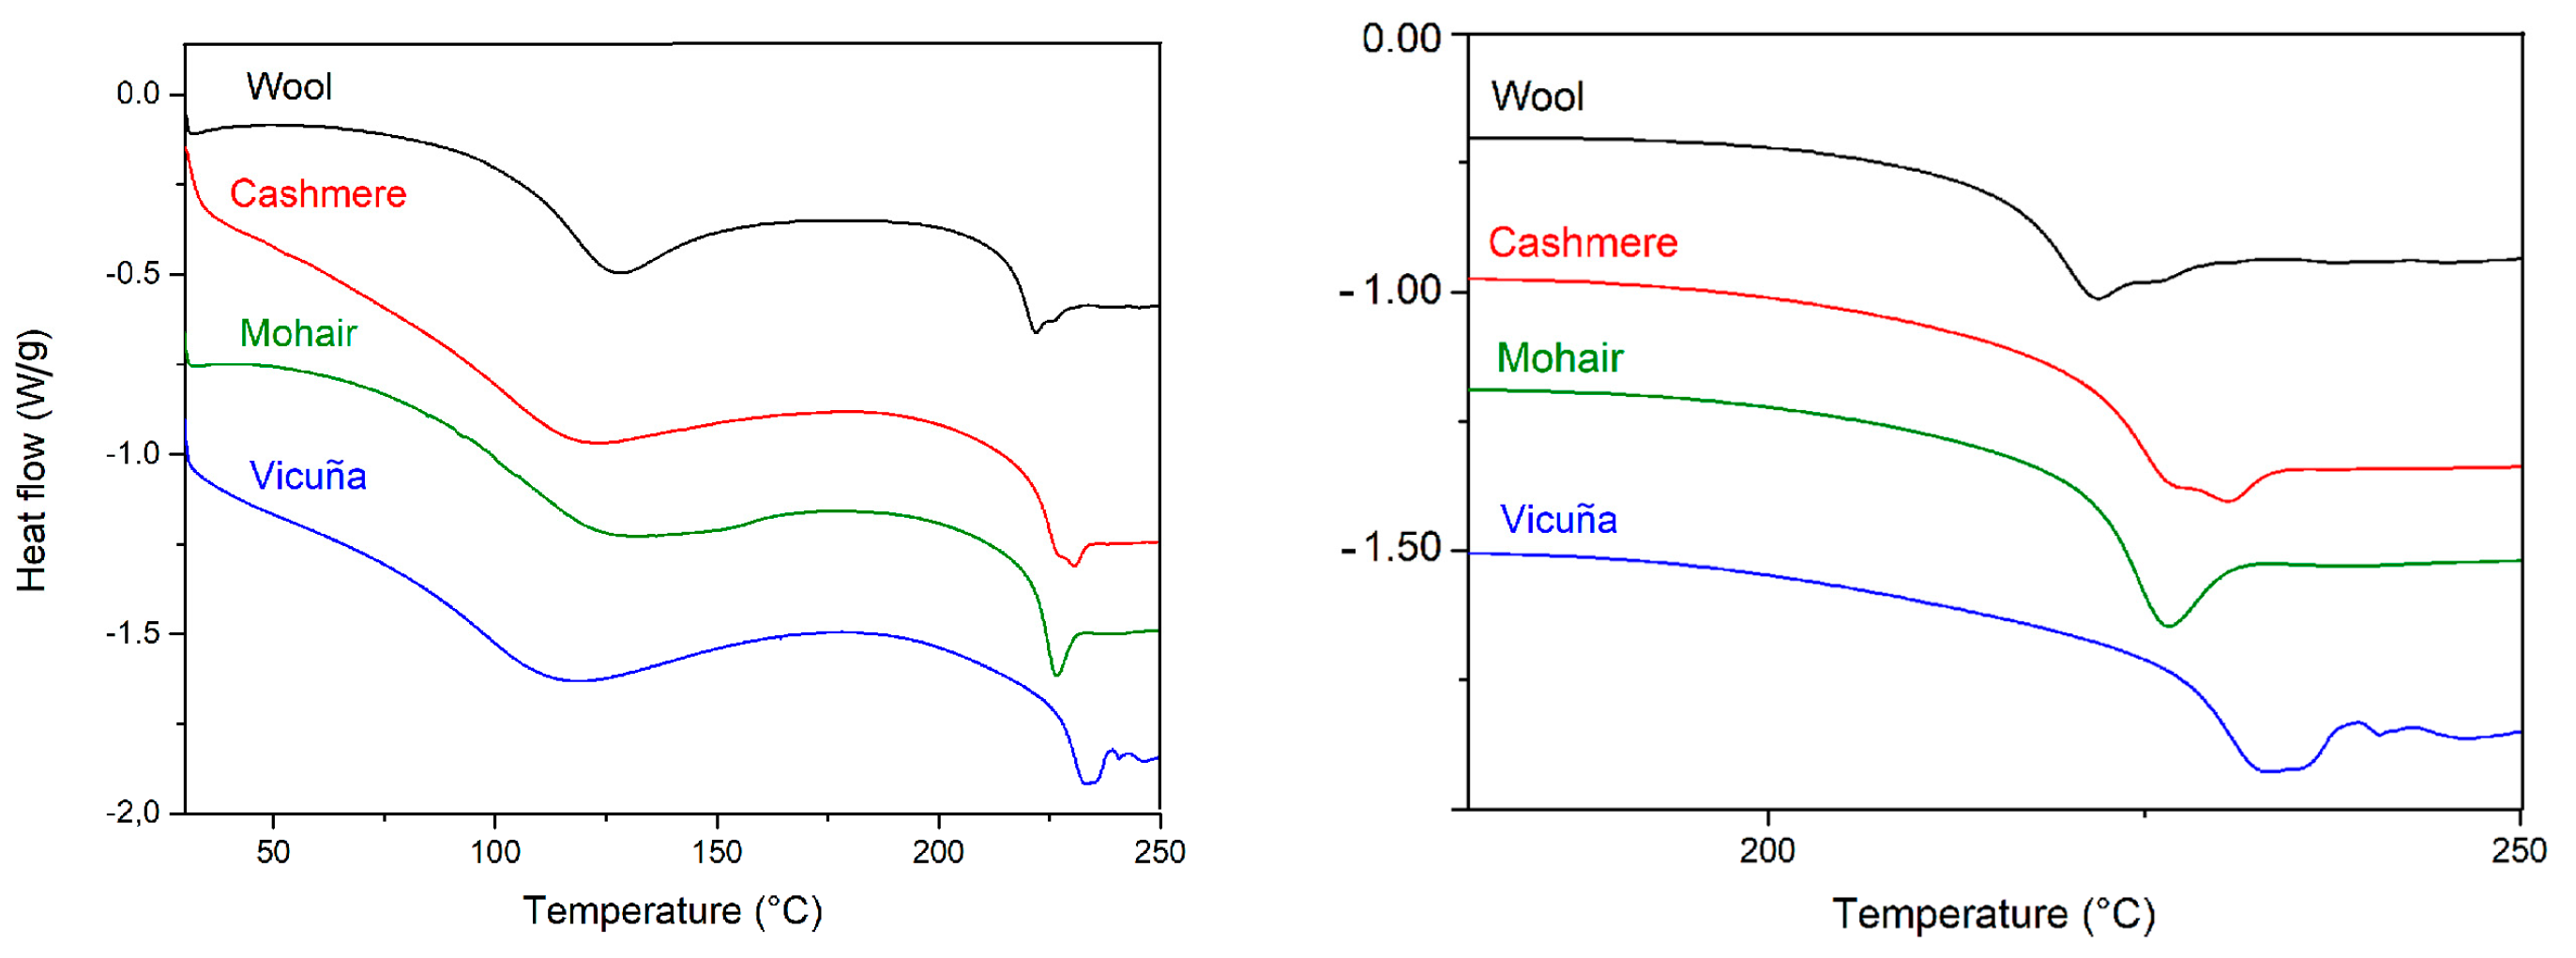
2.2.2. Thermal Analysis
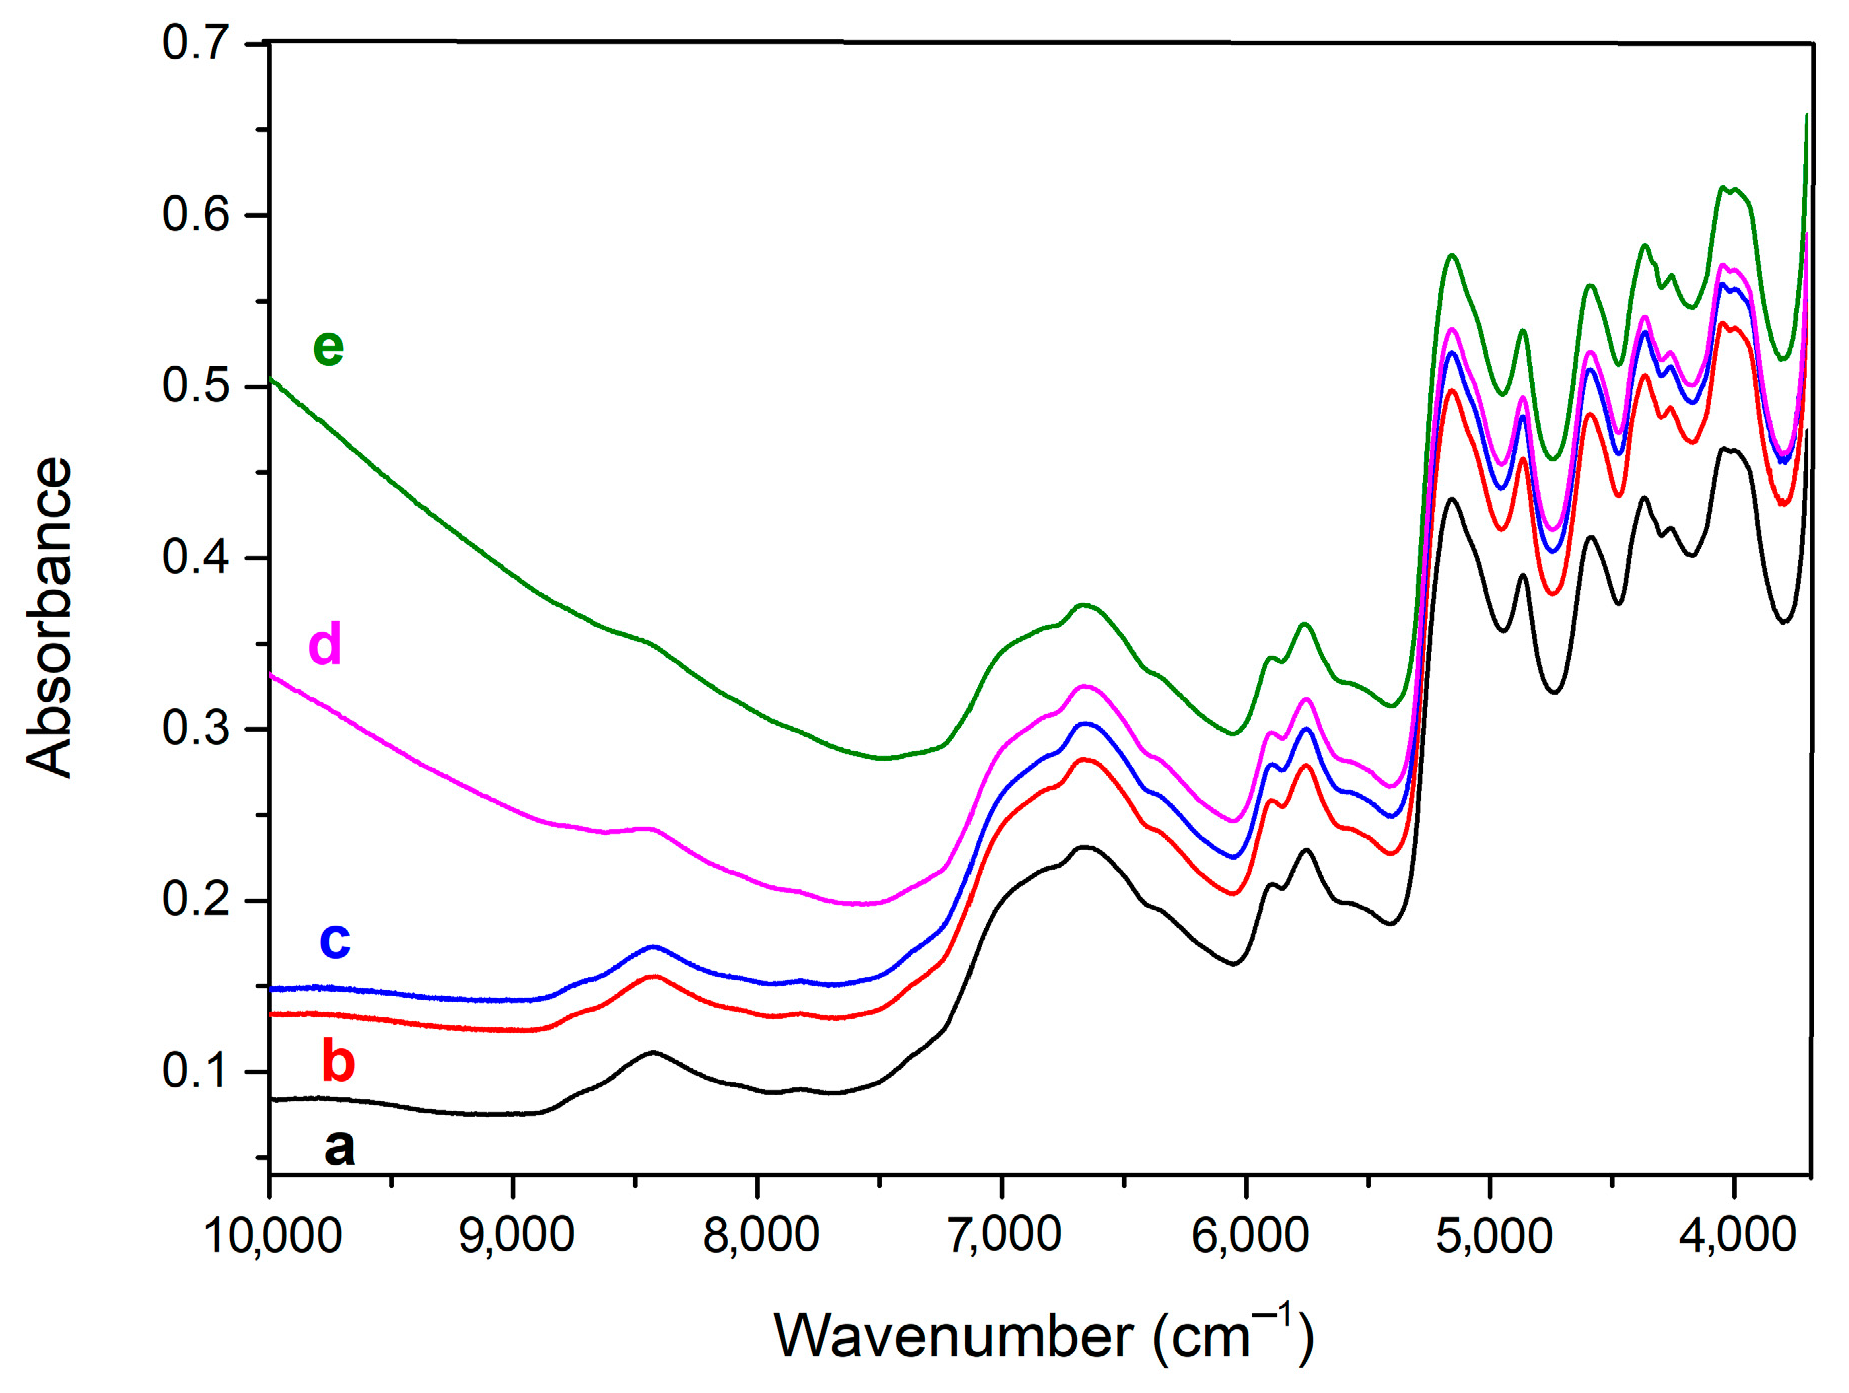
2.2.3. Spectroscopy
2.3. Biotechnological Methods
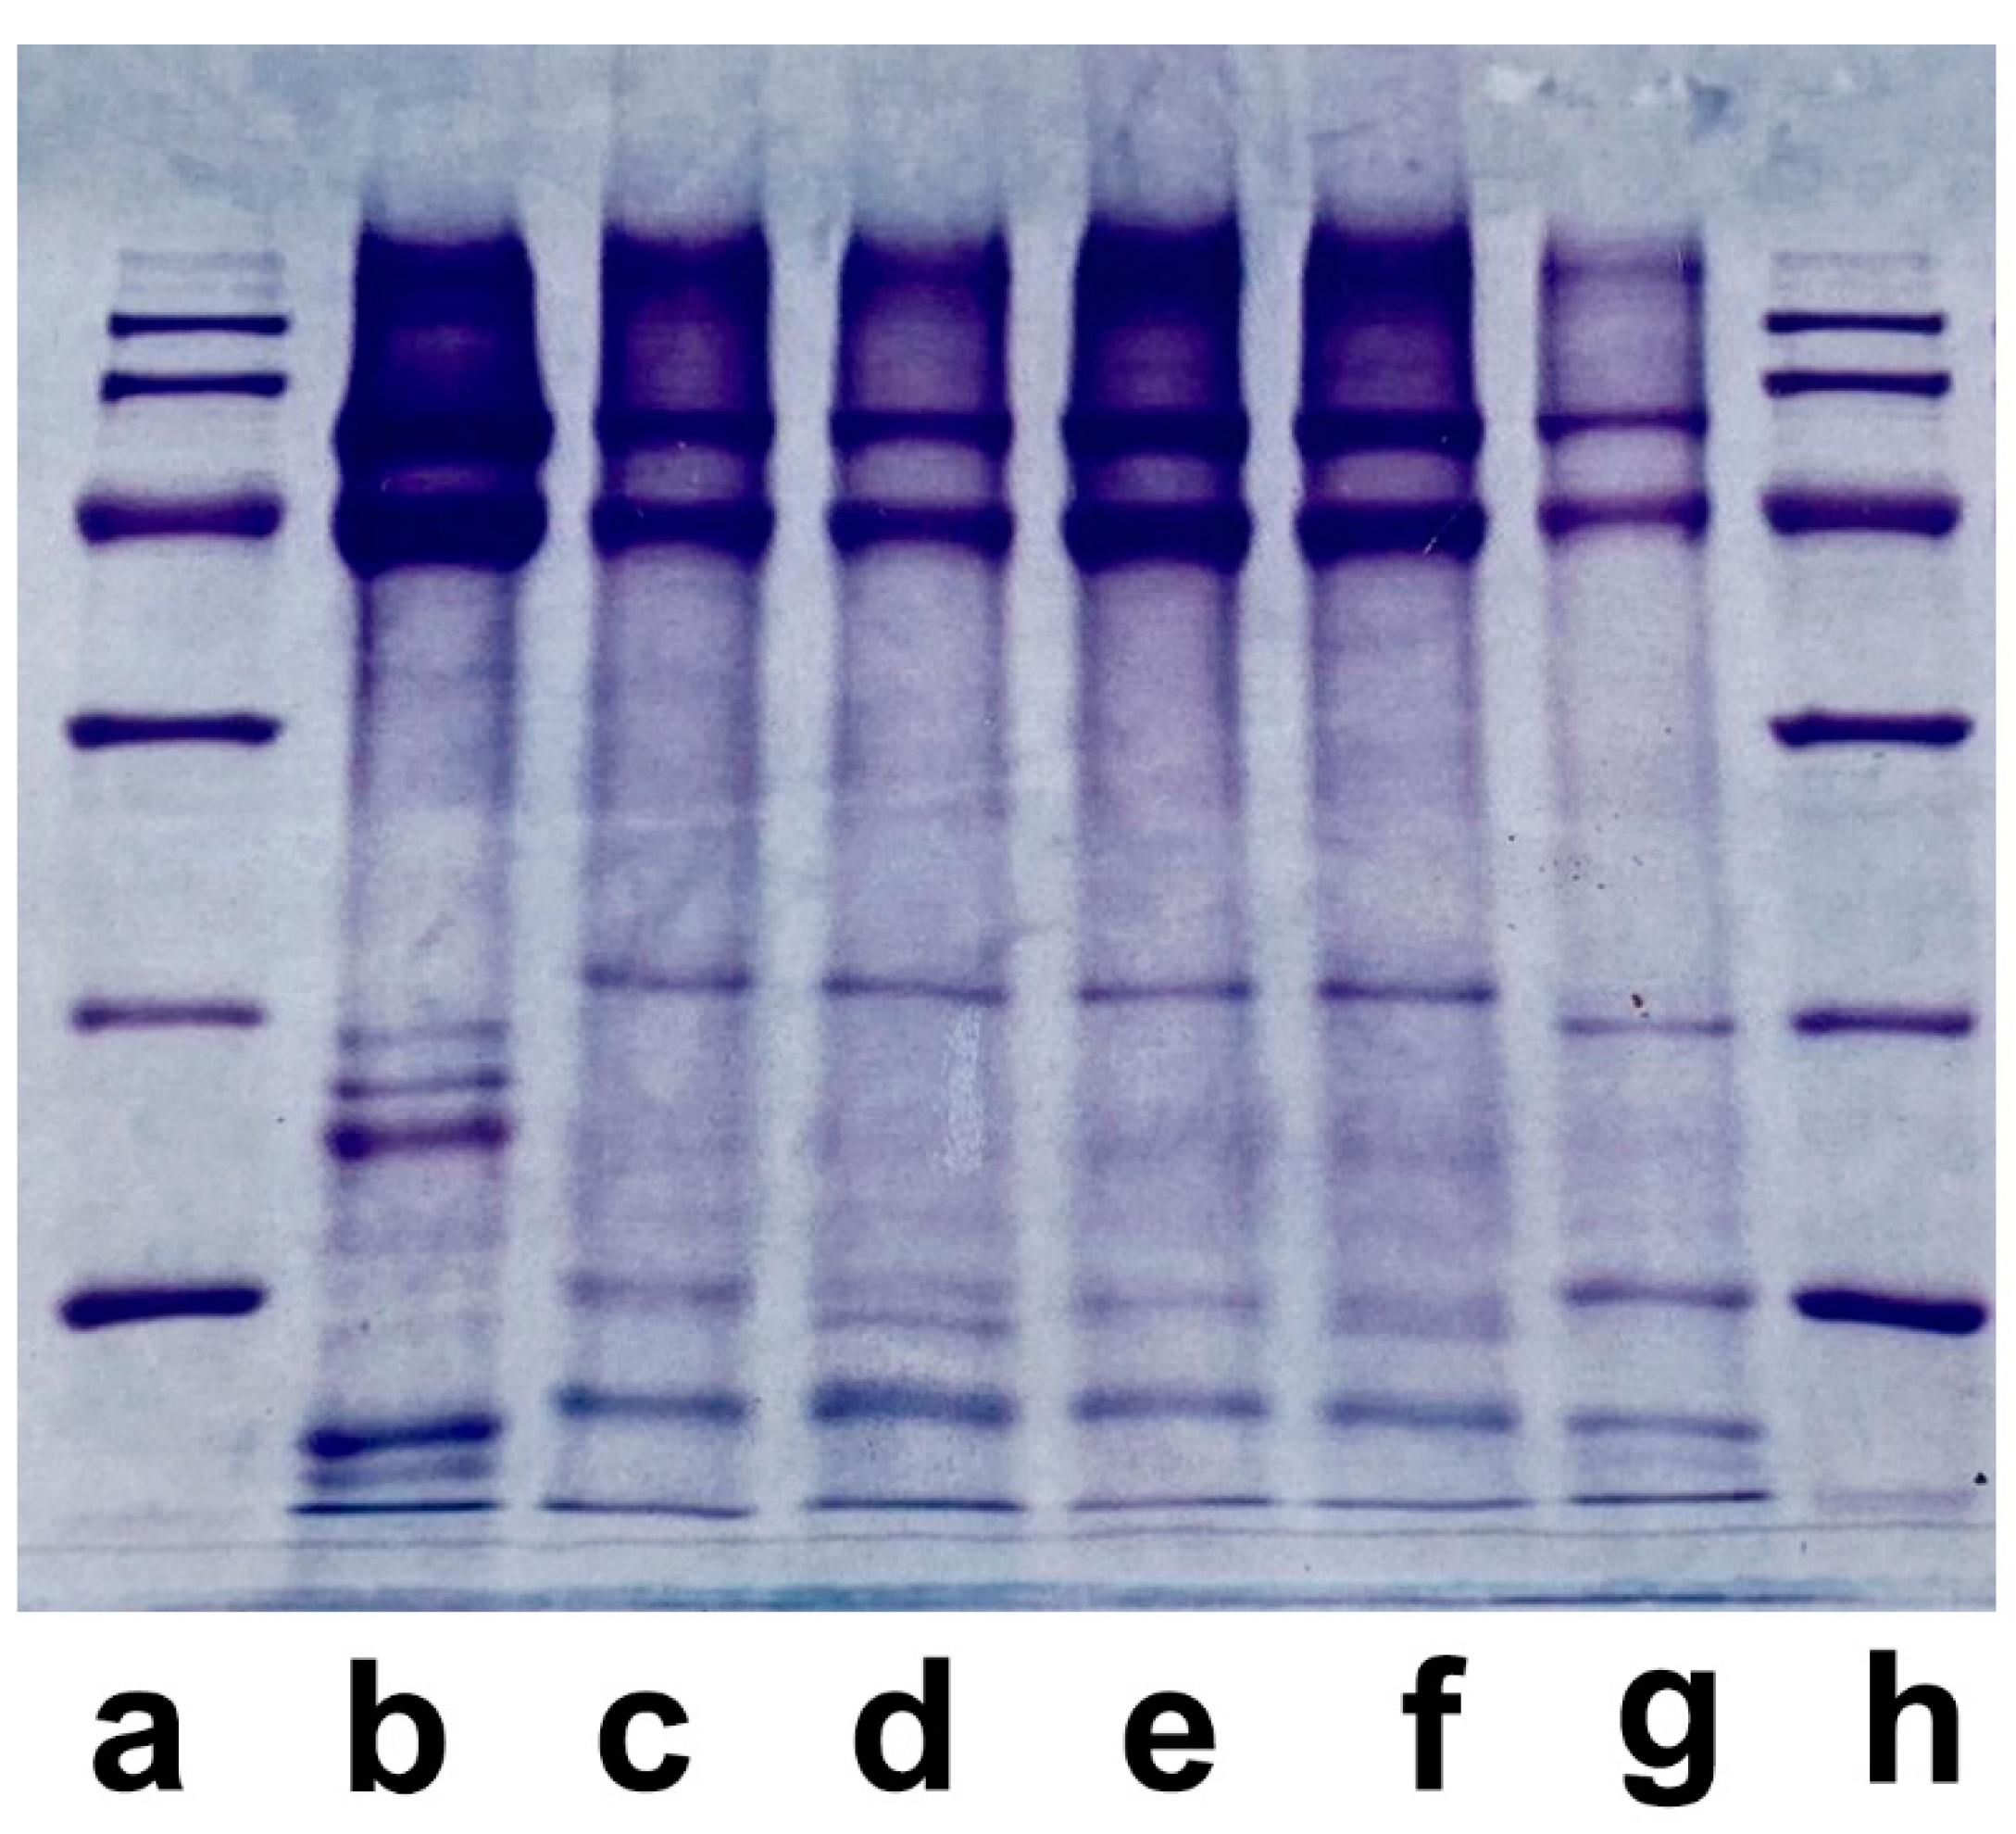
2.3.1. Electrophoresis
2.3.2. DNA Analysis
2.3.3. Proteomic Analysis
3. Comparison between the Principal Analytical Methods
4. Recommendations and Future Research Directions
5. Conclusions
Author Contributions
Funding
Data Availability Statement
Conflicts of Interest
References
- McGregor, B.A. Physical, Chemical, and Tensile Properties of Cashmere, Mohair, Alpaca, and Other Rare Animal Fibers. In Handbook of Properties of Textile and Technical Fibres, 2nd ed.; Bunsell, A.R., Ed.; Woodhead Publishing: Sawston, UK, 2018; pp. 105–136. ISBN 978-0-08-101272-7. [Google Scholar]
- Mann, G.S.; Azum, N.; Khan, A.; Rub, M.A.; Hassan, M.I.; Fatima, K.; Asiri, A.M. Green Composites Based on Animal Fiber and Their Applications for a Sustainable Future. Polymers 2023, 15, 601. [Google Scholar] [CrossRef]
- Gutierrez, G.; Pablo Gutiérrez, J. Challenges and Opportunities of Genetic Improvement in Alpacas and Llamas in Peru. In Proceedings of the World Congress on Genetics Applied to Livestock Production; Wageningen Academic Publishers: Wageningen, The Netherlands, 2019; Volume 11, p. 762. [Google Scholar]
- Waldron, S.; Brown, C.; Komarek, A.M. The Chinese Cashmere Industry: A Global Value Chain Analysis. Dev. Policy Rev. 2014, 32, 589–610. [Google Scholar] [CrossRef]
- Madkour, F.A.; Abdelsabour-Khalaf, M. Performance Scanning Electron Microscopic Investigations and Elemental Analysis of Hair of the Different Animal Species for Forensic Identification. Microsc. Res. Tech. 2022, 85, 2152–2161. [Google Scholar] [CrossRef]
- Sharma, C.; Sharma, S.; Gopal, S.; Rawat, G.; Singh, R. Rapid and Non-Destructive Differentiation of Shahtoosh from Pashmina/Cashmere Wool Using ATR FT-IR Spectroscopy. Sci. Justice 2022, 62, 349–357. [Google Scholar] [CrossRef]
- Azémard, C.; Zazzo, A.; Marie, A.; Lepetz, S.; Debaine-Francfort, C.; Idriss, A.; Zirah, S. Animal Fibre Use in the Keriya Valley (Xinjiang, China) during the Bronze and Iron Ages: A Proteomic Approach. J. Archaeol. Sci. 2019, 110, 104996. [Google Scholar] [CrossRef]
- Price, E.; Larrabure, D.; Gonzales, B.; McClure, P.; Espinoza, E. Forensic Identification of the Keratin Fibers of South American Camelids by Ambient Ionization Mass Spectrometry: Vicuña, Alpaca and Guanaco. Rapid Commun. Mass Spectrom. 2020, 34, e8916. [Google Scholar] [CrossRef]
- Elamri, A. Les Fibres Protéiniques. In Physico-Chimie Des Matériaux Textiles; OmniScriptum, S.R.L., Ed.; Presses Académiques Francophones: London, UK, 2023; pp. 1–64. ISBN 978-3-8381-4153-4. [Google Scholar]
- Fei, J.; Liu, M.; Zhang, S.; Chen, X.; Zhang, S. Technical Note: A Protein Analysis-Based Method for Identifying Shahtoosh. Forensic Sci. Int. 2022, 336, 111341. [Google Scholar] [CrossRef]
- Hill, W.G. Merino Improvement Programs in Australia. Proceedings of a National Symposium, Leura, New South Wales 1987. Supervising Editor, B.J. McGuirk. Australian Wool Corporation, Melbourne. 535 Pages. ISBN 0 642 115311. Genet. Res. 1989, 53, 72. [Google Scholar] [CrossRef]
- Mcgregor, B.A.; Butler, K.L. The Effects of Cashmere Attributes on the Efficiency of Dehairing and Dehaired Cashmere Length. Text. Res. J. 2008, 78, 486–496. [Google Scholar] [CrossRef]
- Zoccola, M.; Pozzo, P.D.; Bianchetto Songia, M.; Sanchez Nieto, A. SEM and Light Microscopy Investigation of Depigmented Fine Animal Fibres and Melanin Pigments Extracted from Fibres. In Proceedings of the 5th Multinational Congress on Electron Microscopy, Lecce, Italy, 20–25 September 2001; pp. 501–502. [Google Scholar]
- Available online: https://www.Cashmere.Org/Facts.Php (accessed on 26 April 2023).
- Wildman, A.B. The Identification of Animal Fibres. J. Forensic Sci. Soc. 1961, 1, 115–119. [Google Scholar] [CrossRef]
- Robert, R. Franck Silk, Mohair, Cashmere and Other Luxury Fibres. In Silk, Mohair, Cashmere and Other Luxury Fibres; Franck, R.R., Ed.; Woodhead Publishing Series in Textiles; Woodhead Publishing: Sawston, UK, 2001; p. ii. ISBN 978-1-85573-540-8. [Google Scholar]
- Gardetti, M.A.; Muthu, S.S. Handbook of Sustainable Luxury Textiles and Fashion Volume 2; Environmental Footprints and Eco-Design of Products and Processes; Springer: Singapore, 2016. [Google Scholar]
- Wheeler, J.C. South American Camelids—Past, Present and Future. J. Camelid Sci. 2012, 5, 1–24. [Google Scholar]
- Frank, E.N.; Hick, M.V.H.; Gauna, C.D.; Lamas, H.E.; Renieri, C.; Antonini, M. Phenotypic and Genetic Description of Fibre Traits in South American Domestic Camelids (Llamas and Alpacas). Small Rumin. Res. 2006, 61, 113–129. [Google Scholar] [CrossRef]
- Samanta, K.; Roy, A. Chemical Modification of Indian Yak Fibre for Development of Jute/Yak Fibres Blended Warm Textile. In Functional Textiles and Clothing; Springer: Berlin/Heidelberg, Germany, 2019; pp. 151–165. ISBN 978-981-13-7720-4. [Google Scholar]
- Perincek, S.; Bahtiyari, M.İ.; Körlü, A.E.; Duran, K. Ozone Treatment of Angora Rabbit Fiber. J. Clean. Prod. 2008, 16, 1900–1906. [Google Scholar] [CrossRef]
- Rajabinejad, H.; Zoccola, M.; Patrucco, A.; Montarsolo, A.; Rovero, G.; Tonin, C. Physicochemical Properties of Keratin Extracted from Wool by Various Methods. Text. Res. J. 2018, 88, 2415–2424. [Google Scholar] [CrossRef]
- Patrucco, A.; Zoccola, M.; Consonni, R.; Tonin, C. Wool Cortical Cell-Based Porous Films. Text. Res. J. 2013, 83, 1563–1573. [Google Scholar] [CrossRef]
- Zoccola, M.; Aluigi, A.; Patrucco, A.; Tonin, C. Extraction, Processing and Applications of Wool Keratin. In Keratin: Structure, Properties and Applications; Nova Science Publisher Inc.: New York, NY, USA, 2012; pp. 36–62. [Google Scholar]
- Cashmere Clothing Market Overview, Trends, Segmentation, Scenario, and Forecast Analysis to 2029. Available online: https://www.databridgemarketresearch.com/reports/global-cashmere-clothing-market (accessed on 18 April 2023).
- ISO 17751-1:2016; Textiles—Quantitative Analysis of Cashmere, Wool, Other Specialty Animal Fibers and Their Blends—Part 1: Light Microscopy Method. ISO: Geneva, Switzerland, 2016.
- ISO 17751-2:2016; Textiles—Quantitative Analysis of Cashmere, Wool, Other Specialty Animal Fibers and Their Blends—Part 2: Scanning Electron Microscopy Method. ISO: Geneva, Switzerland, 2016.
- Wortmann, F.J.; Wortmann, G. Scanning Electron Microscopy as a Tool for the Analysis of Wool/Speciality Fiber Blends; Universidade de Minho: Guimarães: Guimarães, Portugal, 1991. [Google Scholar]
- Greaves, P.H.; Saville, B.P. Microscopy of Textile Fibres, 1st ed.; Taylor & Francis Group: London, UK, 1995. [Google Scholar]
- Langley, K.D.; Kennedy, T.A. The Identification of Specialty Fibers. Text. Res. J. 1981, 51, 703–709. [Google Scholar] [CrossRef]
- Wortmann, F.-J.; Arns, W. Quantitative Fiber Mixture Analysis by Scanning Electron Microscopy: Part I: Blends of Mohair and Cashmere with Sheep’s Wool. Text. Res. J. 1986, 56, 442–446. [Google Scholar] [CrossRef]
- Wortmann, G.; Wortmann, F.J. Chemical Characterization of Fine Animal Hair. In Proceedings of the 1st International Symposium on Speciality Animal Fibers, Aachen, Germany, 26–27 October 1987; pp. 39–70. [Google Scholar]
- Vineis, C.; Aluigi, A.; Tonin, C. Outstanding Traits and Thermal Behaviour for the Identification of Speciality Animal Fibres. Text. Res. J. 2010, 81, 264–272. [Google Scholar] [CrossRef]
- Langley, K.D. Development of Precision and Bias Statement for Cashmere Quantitative Fiber Analysis. In Proceedings of the 4th International Cashmere Determination Technique Symposium, Erdos, China, 17–18 November 2008; China National Cashmere Products Engineering and Technical Centre and China Inner Mongolia Erdos Cashmere Group Corporation: Erdos, China, 2008; pp. 154–160. [Google Scholar]
- Rippon, J.A.; Evans, D.J. Improving the Properties of Natural Fibres by Chemical Treatments. In Handbook of Natural Fibres; Woodhead Publishing: Philadelphia, PA, USA, 2012; Volume 2, pp. 63–140. [Google Scholar]
- Sun, M.; Fei, J.; Cai, J.; Zhao, J. Application of DNA Analysis in Quantifying Cashmere and Wool Binary Blend. In Proceedings of the Key Engineering Materials; Trans Tech Publications Ltd.: Wollerau, Switzerland, 2015; Volume 671, pp. 378–384. [Google Scholar]
- Paolella, S.; Bencivenni, M.; Lambertini, F.; Prandi, B.; Faccini, A.; Tonetti, C.; Vineis, C.; Sforza, S. Identification and Quantification of Different Species in Animal Fibres by LC/ESI-MS Analysis of Keratin-Derived Proteolytic Peptides. J. Mass Spectrom. 2013, 48, 919–926. [Google Scholar] [CrossRef]
- McGregor, B.A.; Quispe Peña, E.C. Cuticle and Cortical Cell Morphology of Alpaca and Other Rare Animal Fibres. J. Text. Inst. 2018, 109, 767–774. [Google Scholar] [CrossRef]
- Tian, Z.; Hong, X.; Xu, X.; Ma, H. Identification of Kid Cashmere. Wool Text. J. 2020, 48, 83–88. [Google Scholar]
- Zhu, Y.; Zhao, L.; Chen, X.; Li, Y.; Wang, J. Identification of Cashmere and Wool Based on LBP and GLCM Texture Feature Selection. J. Eng. Fibers Fabr. 2023, 18, 15589250221146548. [Google Scholar] [CrossRef]
- Zhu, Y.; Jiayi, H.; Li, Y.; Li, W. Image Identification of Cashmere and Wool Fibers Based on the Improved Xception Network. J. King Saud Univ.—Comput. Inf. Sci. 2022, 34, 9301–9310. [Google Scholar] [CrossRef]
- Xuebao, F. Cashmere and Wool Classification Based on Sparse Dictionary Learning. J. Text. Res. 2022, 43, 28–32. [Google Scholar]
- Zhu, Y.; Zhao, L.; Chen, X.; Li, Y.; Wang, J. Animal Fiber Recognition Based on Feature Fusion of the Maximum Inter-Class Variance. Autex Res. J 2022. [Google Scholar] [CrossRef]
- Zang, L.; Xin, B.; Deng, N. Identification of Wool and Cashmere Fibers Based on Multiscale Geometric Analysis. J. Text. Inst. 2022, 113, 1001–1008. [Google Scholar] [CrossRef]
- Xing, W.; Liu, Y.; Xin, B.; Zang, L.; Deng, N. The Application of Deep and Transfer Learning for Identifying Cashmere and Wool Fibers. J. Nat. Fibers 2022, 19, 88–104. [Google Scholar] [CrossRef]
- Zhu, Y.; Duan, J.; Li, Y.; Wu, T. Image Classification Method of Cashmere and Wool Based on the Multi-Feature Selection and Random Forest Method. Text. Res. J. 2021, 92, 1012–1025. [Google Scholar] [CrossRef]
- Zang, L.; Xin, B.; Deng, N. Identification of Overlapped Wool/Cashmere Fibers Based on Multi-Focus Image Fusion and Convolutional Neural Network. J. Nat. Fibers 2021, 19, 6715–6726. [Google Scholar] [CrossRef]
- Yaolin, Z.; Wanwan, M.; Yunhong, L.; Tong, W. Identification of Cashmere and Wool Based on Matched Filter and Multi-Feature Fusion. Wool Text. J. 2021, 49, 64–69. [Google Scholar]
- Sun, C. Image Classification of Cashmere and Wool Fiber Based on LC-KSVD. In Journal of Physics: Conference Series, Proceedings of the 2021 2nd International Conference on Internet of Things, Artificial Intelligence and Mechanical Automation (IoTAIMA 2021), Hangzhou, China, 14–16 May 2021; IOP Publishing Ltd.: Bristol, UK, 2021; Volume 1948. [Google Scholar]
- Luo, J.; Lu, K.; Chen, Y.; Zhang, B. Automatic Identification of Cashmere and Wool Fibers Based on Microscopic Visual Features and Residual Network Model. Micron 2021, 143, 103023. [Google Scholar] [CrossRef]
- Zhu, Y.; Huang, J.; Wu, T.; Ren, X. Identification Method of Cashmere and Wool Based on Texture Features of GLCM and Gabor. J. Eng. Fibers Fabr. 2021, 16, 1558925021989179. [Google Scholar] [CrossRef]
- Xing, W.; Liu, Y.; Deng, N.; Xin, B.; Wang, W.; Chen, Y. Automatic Identification of Cashmere and Wool Fibers Based on the Morphological Features Analysis. Micron 2020, 128, 102768. [Google Scholar] [CrossRef] [PubMed]
- Yildiz, K. Identification of Wool and Mohair Fibres with Texture Feature Extraction and Deep Learning. IET Image Process. 2020, 14, 348–353. [Google Scholar] [CrossRef]
- Lu, K.; Luo, J.; Zhong, Y.; Chai, X. Identification of Wool and Cashmere SEM Images Based on SURF Features. J. Eng. Fibers Fabr. 2019, 14, 1558925019866121. [Google Scholar] [CrossRef] [Green Version]
- Xing, W.; Deng, N.; Xin, B.; Wang, Y.; Chen, Y.; Zhang, Z. An Image-Based Method for the Automatic Recognition of Cashmere and Wool Fibers. Measurement 2019, 141, 102–112. [Google Scholar] [CrossRef]
- Xing, W.; Deng, N.; Xin, B.; Chen, Y.; Zhang, Z. Investigation of a Novel Automatic Micro Image-Based Method for the Recognition of Animal Fibers Based on Wavelet and Markov Random Field. Micron 2019, 119, 88–97. [Google Scholar] [CrossRef]
- Xing, W.; Deng, N.; Xin, B.; Yu, C. Identification of Wool and Cashmere Based on Multi-Feature Fusionimage Analysis Technology. J. Text. Res. 2019, 15, 146–152. [Google Scholar] [CrossRef]
- Xing, W.; Deng, N.; Xin, B.; Liu, Y.; Chen, Y.; Zhang, Z. Identification of Extremely Similar Animal Fibers Based on Matched Filter and HOG-SVM. IEEE Access 2019, 7, 98603–98617. [Google Scholar] [CrossRef]
- Wang, H. Combining the Hough Transform with MLP for Identifying Cashmere and Wool Fibers. In ACM International Conference Proceeding Series, Proceedings of the 5th International Conference on Computer and Technology Applications, Istanbul, Turkey, 16–17 April 2019; Association for Computing Machinery: New York, NY, USA, 2019; Volume Part F148262, pp. 124–128. [Google Scholar]
- Wang, F.; Jin, X.; Luo, W. Intelligent Cashmere/Wool Classification with Convolutional Neural Network. In Proceedings of the Artificial Intelligence on Fashion and Textiles (AIFT) Conference, Hong Kong, China, 3–6 July 2018; Advances in Intelligent Systems and Computing. Springer: Berlin/Heidelberg, Germany, 2019; Volume 849, pp. 17–25. [Google Scholar]
- Xing, W.; Xin, B.; Deng, N.; Chen, Y.; Zhang, Z. A Novel Digital Analysis Method for Measuring and Identifying of Wool and Cashmere Fibers. Measurement 2019, 132, 11–21. [Google Scholar] [CrossRef]
- Lu, K.; Zhong, Y.; Li, D.; Chai, X.; Xie, H.; Yu, Z.; Naveed, T. Cashmere/Wool Identification Based on Bag-of-Words and Spatial Pyramid Match. Text. Res. J. 2018, 88, 2435–2444. [Google Scholar] [CrossRef]
- Wang, F.; Jin, X. The Application of Mixed-Level Model in Convolutional Neural Networks for Cashmere and Wool Identification. Int. J. Cloth. Sci. Technol. 2018, 30, 710–725. [Google Scholar] [CrossRef]
- Lu, K.; Chai, X.; Xie, H.; Yu, Z.; Zhong, Y. Identification of Cashmere/Wool Based on Pairwise Rotation Invariant Co-Occurrence Local Binary Pattern. In Proceedings of the 2017 International Conference on Computational Science and Computational Intelligence (CSCI 2017), Las Vegas, NV, USA, 14–16 December 2017; Institute of Electrical and Electronics Engineers Inc.: Piscataway, NJ, USA, 2018; pp. 463–467. [Google Scholar]
- Zhong, Y.; Lu, K.; Tian, J.; Zhu, H. Wool/Cashmere Identification Based on Projection Curves. Text. Res. J. 2017, 87, 1730–1741. [Google Scholar] [CrossRef]
- Yuan, S.; Lu, K.; Zhong, Y. Identification of Wool and Cashmere Based on Texture Analysis. In Proceedings of the Key Engineering Materials; Trans Tech Publications Ltd.: Wollerau, Switzerland, 2015; Volume 671, pp. 385–390. [Google Scholar]
- Chen, H.; Liu, Y.X. Research on Feature Extraction and Optimization of Cashmere and Wool Fiber Based on Digital Image. Appl. Mech. Mater. 2014, 667, 260–263. [Google Scholar] [CrossRef]
- Liu, Y.; Liu, Y.; Shang, S.; Yuan, Y.; Yang, W. Research on the Scale Density Extraction Technology of Cashmere and Wool. Appl. Mech. Mater. 2012, 217–219, 947–950. [Google Scholar] [CrossRef]
- Yang, Y.; Ji, Y. Study on Classification Technology of Wool and Cashmere Based on GA-SVM. Adv. Mater. Res. 2011, 332–334, 1198–1201. [Google Scholar] [CrossRef]
- Shi, X.-J.; Yu, W.-D. Intelligent Animal Fibre Classification with Artificial Neural Networks’. Int. J. Model. Identif. Control 2011, 12, 107–112. [Google Scholar] [CrossRef]
- Shang, S.Y.; Liu, Y.X.; Yi, H.Y.; Zhang, Y.W. The Research on Identification of Wool or Cashmere Fibre Based on Digital Image. In Proceedings of the Ninth International Conference on Machine Learning and Cybernetics, Qingdao, China, 11–14 July 2010. [Google Scholar]
- Zang, J.; Palmer, S.; Wang, X. Identification of Animal Fibers with Wavelet Texture Analysis. In Proceedings of the World Congress on Engineering, London, UK, 30 June–2 July 2010; pp. 742–747. [Google Scholar]
- Kun, Q.; Li, H.; Haijian, C.; Kejing, Y.; Shen, W.; Qian, K.; Cao, H.; Yu, K.; Shen, W. Measuring the Blend Ratio of Wool/Cashmere Yarns Based on Image Processing Technology. Fibres Text. East. Eur. 2010, 18, 35–38. [Google Scholar]
- Shi, X.J.; Yu, W.D. Identification of Animal Fiber Based on Scale Shape. In Proceedings of the 1st International Congress on Image and Signal Processing (CISP 2008), Hainan, China, 27–30 May 2008; Volume 3, pp. 573–577. [Google Scholar]
- Kong, L.; She, F.; Nahavandi, S.; Kouzani, A.Z. Feature Extraction for Animal Fiber Identification. In Proceedings of the Second International Conference on Image and Graphics, Heifei, China, 16–18 August 2002; International Society for Optics and Photonics: Bellingham, WA, USA, 2002; Volume 4875, pp. 699–704. [Google Scholar]
- She, F.H.; Chow, S.; Wang, B.; Kong, L.X. Identification and Classification of Animal Fibres Using Artificial Neural Networks. J. Text. Eng. 2001, 47, 35–38. [Google Scholar] [CrossRef] [Green Version]
- Robson, D. Animal Fiber Analysis Using Imaging Techniques Part II: Addition of Scale Height Data. Text. Res. J. 2000, 70, 116–120. [Google Scholar] [CrossRef]
- Robson, D. Animal Fiber Analysis Using Imaging Techniques Part I: Scale Pattern Data. Text. Res. J. 1997, 67, 747–752. [Google Scholar] [CrossRef]
- Kong, L.; She, F.; Nahavandi, S.; Kouzani, A. Fuzzy Pattern Recognition and Classification of Animal Fibers. In Proceedings of the Joint 9th IFSA World Congress and 20th NAFIPS International Conference, Vancouver, BC, Canada, 25–28 July 2001; pp. 1050–1055. [Google Scholar]
- Wool Market—Growth, Trends, and Forecasts (2023–2028). Available online: https://www.mordorintelligence.com/industry-reports/wool-market (accessed on 2 May 2023).
- Rippel, O.; Gülçelik, S.; Rahimi, K.; Kurniadi, J.; Herrmann, A.; Merhof, D. Animal Fiber Identification under the Open Set Condition. In Proceedings of the IEEE International Instrumentation and Measurement Technology Conference, Glasgow, Scotland, 17–20 May 2021. [Google Scholar]
- Anceschi, A.; Zoccola, M.; Mossotti, R.; Bhavsar, P.; Fontana, G.D.; Patrucco, A. Colorimetric Quantification of Virgin and Recycled Cashmere Fibers: Equilibrium, Kinetic, and Thermodynamic Studies. J. Nat. Fibers 2022, 19, 11064–11077. [Google Scholar] [CrossRef]
- Solazzo, C. Characterizing Historical Textiles and Clothing with Proteomics. Conserv. Patrim. 2019, 31, 97–114. [Google Scholar] [CrossRef] [Green Version]
- Maclaren, J.A.; Milligan, B. Wool Science. The Chemical Reactivity of the Wool Fibre; Science Press: Sydney, Australia, 1981. [Google Scholar]
- Villarroel, V. Wool Handbook; Von Bergen, W., Ed.; Interscience: New York, NY, USA, 1963; Volume 1, pp. 411–413. [Google Scholar]
- Tucker, D.J.; Hudson, A.H.F.; Ozolins, G.V.; Rivett, D.E.; Jones, L.N. Some Aspects of the Structure and Composition of Speciality Animal Fibres. In Proceedings of the 1st International Symposium on Speciality Animal Fibers, Aachen, Germany, 26–27 October 1997; pp. 71–103. [Google Scholar]
- Ferrero, F.; Mossotti, R.; Innocenti, R.; Coppa, F.; Periolatto, M. Enzyme-Aided Wool Dyeing: Influence of Internal Lipids. Fibers Polym. 2015, 16, 363–369. [Google Scholar] [CrossRef]
- Logan, R.I.; Rivett, D.E.; Tucker, D.J.; Hudson, A.H.F. Analysis of the Intercellular and Membrane Lipids of Wool and Other Animal Fibers. Text. Res. J. 1989, 59, 109–113. [Google Scholar] [CrossRef]
- Tucker, D.J.; Hudson, A.H.F.; Rivett, D.E.; Logan, R.I. The Chemistry of Speciality Animal Fibres. Schriftenreihe Des Dtsch. Wollforschungsinstitutes 1990, 106. [Google Scholar]
- Korner, A. Lipids in the Analysis of Fine Animal Fibres. In Proceedings of the 1st International Symposium on Speciality Animal Fibres, Aachen, Germany, 26–27 October 1987; pp. 104–127. [Google Scholar]
- Zoccola, M.; Aluigi, A.; Tonin, C. Characterisation of Keratin Biomass from Butchery and Wool Industry Wastes. J. Mol. Struct. 2009, 938, 35–40. [Google Scholar] [CrossRef]
- Wortmann, F.J.; Deutz, H.D. Characterizing Keratins Using High-pressure Differential Scanning Calorimetry (HPDSC). J. Appl. Polym. Sci. 1993, 48, 137–150. [Google Scholar] [CrossRef]
- Tonetti, C.; Varesano, A.; Vineis, C.; Mazzuchetti, G. Differential Scanning Calorimetry for the Identification of Animal Hair Fibres. J. Therm. Anal. Calorim. 2015, 119, 1445–1451. [Google Scholar] [CrossRef]
- Notayi, M.; Hunter, L.; Engelbrecht, J.A.; Botha, A.F.; Minnaar, E.G.; Lee, M.E.; Erasmus, R. The Application of Raman Spectroscopic Ratiometric Analysis for Distinguishing between Wool and Mohair. J. Nat. Fibers 2022, 19, 11536–11546. [Google Scholar] [CrossRef]
- Sun, X.; Yuan, H.; Song, C.; Li, X.; Hu, A.; Yu, S.; Ren, Z. A Novel Drying-Free Identification Method of Cashmere Textiles by NIR Spectroscopy Combined with an Adaptive Representation Learning Classification Method. Microchem. J. 2019, 149, 104018. [Google Scholar] [CrossRef]
- Zhou, J.; Yu, L.; Ding, Q.; Wang, R. Textile Fiber Identification Using Near-Infrared Spectroscopy and Pattern Recognition. Autex Res. J. 2019, 19, 201–209. [Google Scholar] [CrossRef] [Green Version]
- Chen, H.; Lin, Z.; Tan, C. Classification of Different Animal Fibers by near Infrared Spectroscopy and Chemometric Models. Microchem. J. 2019, 144, 489–494. [Google Scholar] [CrossRef]
- McGregor, B.A.; Liu, X.; Wang, X.G. Comparisons of the Fourier Transform Infrared Spectra of Cashmere, Guard Hair, Wool and Other Animal Fibres. J. Text. Inst. 2018, 109, 813–822. [Google Scholar] [CrossRef]
- Zhou, J.; Wang, R.; Wu, X.; Xu, B. Fiber-Content Measurement of Wool–Cashmere Blends Using Near-Infrared Spectroscopy. Appl. Spectrosc. 2017, 71, 2367–2376. [Google Scholar] [CrossRef]
- Wang, C.; Wu, X.; Ding, X. Non-Destructive Identification of Wool Blended Fabrics with near Infrared Spectroscopy Based on Support Vector Machine. Wool Text. J. 2016, 44, 1–5. [Google Scholar]
- Mao, M.-H.; Li, W.-S. Determination of Cashmere and Wool Contents in Textile by near Infrared Spectroscopy. Wool Text. J. 2014, 42, 41–43. [Google Scholar]
- Zoccola, M.; Lu, N.; Mossotti, R.; Innocenti, R.; Montarsolo, A. Identification of Wool, Cashmere, Yak, and Angora Rabbit Fibers and Quantitative Determination of Wool and Cashmere in Blend: A near Infrared Spectroscopy Study. Fibers Polym. 2013, 14, 1283–1289. [Google Scholar] [CrossRef]
- Yuan, H.; Chang, R.-X.; Tian, L.-L.; Song, C.-F.; Yuan, X.-Q.; Li, X.-Y. Study of Nondestructive and Fast Identification of Fabric Fibers Using Near Infrared Spectroscopy. Guang Pu Xue Yu Guang Pu Fen Xi 2010, 30, 1229–1233. [Google Scholar] [CrossRef]
- Lv, D.; Yu, C.; Zhao, G.-L. Study on Identification of Cashmere and Wool Using near Infrared Spectroscopy. J. Beijing Inst. Cloth. Technol. 2010, 30, 29–34. [Google Scholar]
- Ciukzak, W. Principles of Near- Infrared Spectroscopy. In Handbook of Near-Infrared Analysis; Burns, D.A., Ciurczak, E.W., Eds.; Marcel Dekker: New York, NY, USA, 1992; pp. 7–11. [Google Scholar]
- Zoccola, M.; Mossotti, R.; Innocenti, R.; Loria, D.I.; Rosso, S.; Zanetti, R. Near Infrared Spectroscopy as a Tool for the Determination of Eumelanin in Human Hair. Pigment. Cell Res. 2004, 17, 379–385. [Google Scholar] [CrossRef] [PubMed]
- Zoccola, M.; Mossotti, R.; Montarsolo, A.; Patrucco, A.; Innocenti, R. Near Infrared Spectroscopy in the Textile Industry. In Infrared Spectroscopy: Theory, Developments and Applications; Cozzolino, D., Ed.; Nova Science Publishers: Hauppauge, NY, USA, 2014; pp. 491–516. ISBN 978-1-62948-523-2. [Google Scholar]
- Wu, G.; He, Y. Identification of Varieties of Cashmere by Vis/NIR Spectroscopy Technology Based on PCA-SVM. In Proceedings of the 7th World Congress on Intelligent Control and Automation, Chongqing, China, 25–27 June 2008; pp. 1548–1552. [Google Scholar]
- Anceschi, A.; Zoccola, M.; Mossotti, R.; Bhavsar, P.; Dalla Fontana, G.; Patrucco, A. Identification and Quantitative Determination of Virgin and Recycled Cashmere: A Near-Infrared Spectroscopy Study. ACS Sustain. Chem. Eng. 2022, 10, 738–745. [Google Scholar] [CrossRef]
- Marshall, R.; Zahn, H.; Blankenburg, G. Possible Identification of Specialty Fibers by Electrophoresis. Text. Res. J. 1984, 54, 126–128. [Google Scholar] [CrossRef]
- Tucker, D.; Hudson, A.; Laudani, A.; Marshall, R.; Rivett, D. Variation in Goat Fibre Protein. Aust. J. Agric. Res. 1989, 40, 675–683. [Google Scholar] [CrossRef]
- Kalbé, J.; Kuropka, R.; Meyer-Stork, L.; Souther, S.L.; Höcher, H.; Bernt, H.; Riesner, D.; Henco, K. Isolation and Characterization of Hight Molecular Weigt DNA from Hair Shafts of Wool and Fine Animal Hairs Fibres. In Proceedings of the 1st International Symposium on Speciality Animal Fibers, Aachen, Germany, 26–27 October 1987; pp. 221–227. [Google Scholar]
- Hamlyn, P.F.; Bayliffe, A.; McCarty, B.J.; Nelson, G. Molecular Speciation of Animal Fibres. J. Soc. Dye. Colour. 1998, 114, 78–80. [Google Scholar] [CrossRef]
- Kerkhoff, K.; Cescutti, G.; Kruse, L.; Müssig, J. Development of a DNA-Analytical Method for the Identification of Animal Hair Fibers in Textiles. Text. Res. J. 2009, 79, 69–75. [Google Scholar] [CrossRef]
- Wang, M.; Ren, L.; Kong, P.; Zhao, H.-J.; Yan, H.-Y.; Yang, C.-G. Qualitative Analyzing Method Based on Real-Time Fluorescence Quantitative PCR for Identifying Rabbit Hair. Wool Text. J. 2015, 43, 55–58. [Google Scholar]
- Geng, Q.R. A Duplex Polymerase Chain Reaction Assay for the Identification of Goat Cashmere and Sheep Wool. Mitochondrial DNA A DNA Mapp. Seq. Anal. 2016, 27, 1808–1811. [Google Scholar] [CrossRef] [PubMed]
- Geng, R.Q. Species-Specific PCR for the Identification of Goat Cashmere and Sheep Wool. Mol. Cell. Probes 2015, 29, 39–42. [Google Scholar] [CrossRef] [PubMed]
- Tang, M.; Zhang, W.; Zhou, H.; Fei, J.; Yang, J.; Lu, W.; Zhang, S.; Ye, S.; Wang, X. A Real-Time PCR Method for Quantifying Mixed Cashmere and Wool Based on Hair Mitochondrial DNA. Text. Res. J. 2014, 84, 1612–1621. [Google Scholar] [CrossRef]
- Fei, J.; Yang, J.; Zhou, H.; Tang, M.; Lu, W.; Yan, A.; Hou, Y.; Zhang, S. A Novel Method for Identifying Shahtoosh. J. Forensic. Sci. 2014, 59, 723–728. [Google Scholar] [CrossRef]
- Fei, J.; Lu, W.M.; Duan, J.Y.; Yang, J.; Zhou, Z.P.; Yu, J. Study on Precision of a DNA Analysis Method for Quantifying Cashmere/Wool Mixture. Adv. Mater. Res. 2013, 821–822, 243–247. [Google Scholar] [CrossRef]
- Geng, R.Q.; Yuan, C.; Chen, Y.L. Identification of Goat Cashmere and Sheep Wool by PCR-RFLP Analysis of Mitochondrial 12S RRNA Gene. Mitochondrial DNA 2012, 23, 466–470. [Google Scholar] [CrossRef]
- Ji, W.; Bai, L.; Ji, M.; Yang, X. A Method for Quantifying Mixed Goat Cashmere and Sheep Wool. Forensic Sci. Int. 2011, 208, 139–142. [Google Scholar] [CrossRef] [PubMed]
- Nelson, G.; Hamlyn, P.F.; Holden, L. A Species-Specific DNA Probe for Goat Fiber Identification. Text. Res. J. 1992, 62, 590–595. [Google Scholar] [CrossRef]
- ISO 18074:2015; Textiles—Identification of Some Animal Fibers by DNA Analysis Method—Cashmere, Wool, Yak and Their Blends. ISO: Geneva, Switzerland, 2015.
- Azémard, C.; Dufour, E.; Zazzo, A.; Wheeler, J.C.; Goepfert, N.; Marie, A.; Zirah, S. Untangling the Fibre Ball: Proteomic Characterization of South American Camelid Hair Fibres by Untargeted Multivariate Analysis and Molecular Networking. J. Proteom. 2021, 231, 104040. [Google Scholar] [CrossRef]
- Vineis, C.; Tonetti, C.; Sanchez Ramirez, D.O.; Carletto, R.A.; Varesano, A. Validation of UPLC/ESI-MS Method Used for the Identification and Quantification of Wool, Cashmere and Yak Fibres. J. Text. Inst. 2017, 108, 2180–2183. [Google Scholar] [CrossRef]
- Kim, Y.; Kim, T.; Choi, H.M. Qualitative Identification of Cashmere and Yak Fibers by Protein Fingerprint Analysis Using Matrix-Assisted Laser Desorption/Ionization Time-of-Flight Mass Spectrometry. Ind. Eng. Chem. Res. 2013, 52, 5563–5571. [Google Scholar] [CrossRef]
- Hollemeyer, K.; Altmeyer, W.; Heinzle, E. Identification and Quantification of Feathers, down, and Hair of Avian and Mammalian Origin Using Matrix-Assisted Laser Desorption/Ionization Time-of-Flight Mass Spectrometry. Anal. Chem. 2002, 74, 5960–5968. [Google Scholar] [CrossRef]
- Li, S.; Zhang, Y.; Wang, J.; Yang, Y.; Miao, C.; Guo, Y.; Zhang, Z.; Cao, Q.; Shui, W. Combining Untargeted and Targeted Proteomic Strategies for Discrimination and Quantification of Cashmere Fibers. PLoS ONE 2016, 11, e0147044. [Google Scholar] [CrossRef] [PubMed]
- Miao, C.; Yang, Y.; Li, S.; Guo, Y.; Shui, W.; Cao, Q. Discrimination and Quantification of Homologous Keratins from Goat and Sheep with Dual Protease Digestion and PRM Assays. J. Proteom. 2018, 186, 38–46. [Google Scholar] [CrossRef] [PubMed]
- Ohashi, S.; Demura, Y.; Sano, M. Identification of Cashmere Fiber by Using SDS-PAGE and Maldi-Tof Mass Spectrometry. J. Fiber Sci. Technol. 2012, 68, 276–281. [Google Scholar] [CrossRef] [Green Version]
- Ohashi, S.; Demura, Y.; Sano, M.; Yoshioka, Y. Quantitative Analysis of Cashmere and Other Animal Hair Fibers in Textiles Using MALDI-TOF Mass Spectrometry. J. Fiber Sci. Technol. 2014, 70, 114–120. [Google Scholar] [CrossRef] [Green Version]
- Gong, Y.; Zhang, J.; Zhou, Y.; Wang, Y. Study of the Principle of Time of Flight Mass Spectrometry for the Identification of Cashmere and Wool Fiber Protein. Wool Text. J. 2016, 44, 21–24. [Google Scholar]
- Izuchi, Y.; Tokuhara, M.; Takashima, T.; Kuramoto, K. Peptide Profiling Using Matrix-Assisted Laser Desorption/Ionization-Time-of-Flight Mass Spectrometry for Identification of Animal Fibers. Mass Spectrom. 2013, 2, A0023. [Google Scholar] [CrossRef] [Green Version]
- Bonifazi, G.; Gasbarrone, R.; Palmieri, R.; Serranti, S. End-of-Life Textile Recognition in a Circular Economy Perspective: A Methodological Approach Based on Near Infrared Spectroscopy. Sustainability 2022, 14, 10249. [Google Scholar] [CrossRef]


| Fiber | Main Breeding Countries | Coat or Undercoat | Fineness | Natural Color | Reference |
|---|---|---|---|---|---|
| cashmere | China, Mongolia, Afghanistan and Iran | undercoat | 15–19 μm | white, gray and brown | [14] |
| mohair | South Africa and the U.S.A. | coat | 25–55 μm | white and glossy | [15] |
| cashgora | Australia and New Zealand | coat | 18 to 23 μm | white | [16] |
| camel | China, Mongolia, Iran, Afghanistan, Russia, New Zealand and Australia | undercoat | 5–20 μm | golden tan | [14] |
| lama | South America | coat | 10–44 μm | various colors, sometimes brown | [17,18,19] |
| alpaca | South America | coat | 20–40 μm | Grey, fawn white, black, café, etc. | [17,18,19] |
| vicuña | Perù, Bolivia and Argentina | undercoat | 13–14 μm | from golden to cinnamon | [17,18] |
| guanaco | South America | undercoat | 16.5–24 µm | light brown | [17,18] |
| yak | China, Afghanistan, Nepal, and other Asian countries | undercoat | 15–20 μm | dark brown | [20] |
| angora | China | coat | 14–16 µm | white | [21] |
| Fiber | Cuticular Cells Thickness | Cuticular Cells Morphology | Medulla | Pigments | Reference |
|---|---|---|---|---|---|
| wool | ≥0.6 µm | cuticular cells quite close along the fiber axis | absent in fine wool | usually absent | [29,30,31] |
| cashmere | ≤0.5 µm | distant and smooth cuticular cells margins | usually absent | sparsely distributed when present | [13,28,32] |
| mohair | ≤0.5 µm | distant cuticular cells margins | absent | absent | [31] |
| cashgora | ≤0.5 µm | distant cuticular cells margins | absent | absent | [33] |
| camel | ≤0.5 µm | high cuticular cell margins slope | usually absent | present | [15] |
| lama | ≤0.5 µm | smooth cuticular cells margins | fragmental medulla | present | [15] |
| alpaca | ≤0.5 µm | smooth cuticular cells margins | fragmental medulla | present | [15] |
| vicuña | ≤0.5 µm | smooth cuticular cells margins | fragmental medulla | present | [15] |
| guanaco | ≤0.5 µm | smooth cuticular cells margins | fragmental medulla | present | [15] |
| yak | ≤0.5 µm | distant and smooth cuticular cells margins | usually absent | distributed in string | [33] |
| angora | ≤0.5 µm | chevron cuticular cells patterns | Ladder type of medulla | absent | [15] |
| Animal Fibers | Accuracy (%) | Fiber Processing Stage | Imaging Type | Techniques | References | Year |
|---|---|---|---|---|---|---|
| wool, cashmere | 94.39 | fiber | SEM | Local binary pattern, gray level co-occurrence matrix algorithm | [40] | 2023 |
| wool, cashmere | 98.95 | fiber | SEM | Improved Xception network | [41] | 2022 |
| wool, cashmere | up to 91 | fiber | SEM and LM | Local binary pattern, Sparse dictionary learning | [42] | 2022 |
| wool, cashmere | 95.2 | fiber | SEM | Feature fusion method, multi-scale decomposition of wavelet analysis, maximum inter-class variance, SVM | [43] | 2022 |
| wool, cashmere | 96.67 | fiber | LM | Texture feature selection method-local binary pattern, the gray level co-occurrence matrix algorithm; SVM | [44] | 2022 |
| wool, cashmere, yellow wool, goat hair | 99.15 | fiber | LM | CCN and deep learning-AlexNet, VGG-16, VGG-19, GoogLeNet | [45] | 2022 |
| wool, cashmere | 90 | fiber | SEM | Gray-gradient co-occurrence matrix model; feature selection algorithm; random forest model | [46] | 2021 |
| wool, cashmere | 98.7 | fiber | LM | Multi-focus image fusion and CNN | [47] | 2021 |
| wool, cashmere | 97.1 | fiber | SEM | GLCM, HOG | [48] | 2021 |
| wool, cashmere | up to 90 | fiber | LM | LC-KSVD algorithm—A label-consistent clustering singular value decomposition | [49] | 2021 |
| wool, cashmere | 97.1 | fiber | LM | CNN | [50] | 2021 |
| wool, cashmere | 93.33 | fiber | SEM | GLCM and Gabor wavelet transform | [51] | 2021 |
| wool, cashmere | 94.2 | fiber | LM | Image processing: Hessian matrix, Frangi filter edge detection; Bayesian classification model | [52] | 2020 |
| wool, mohair | 99.8 | fiber | LM | Image processing: feature extraction process; CNN | [53] | 2020 |
| wool, cashmere and wool cashmere blends | recognition highter than 93 | fiber | SEM | Image processing: original image, image binarization, dilation, filling margin, removing noise and removing background; SURF feature extraction | [54] | 2019 |
| wool, cashmere | 94.29 | fiber | LM | Image processing: GLCM algorithm, interactive measurement algorithm and k-means clustering algorithm | [55] | 2019 |
| wool, cashmere | 90.07 | fiber | LM | Image processing: morphological processing algorithm, contrast stretching algorithm, Otsu algorithm; Analysis: wavelet multi-scale analysis, texture feature extraction, SVM | [56] | 2019 |
| wool, cashmere | 95.25 | fiber | LM | Image processing: co-occurrence matrix algorithm, central axis algorithm; multidimentional and clustering analysis: K-means algorithm | [57] | 2019 |
| wool, cashmere | 92.5 | fiber | LM | image processing: HOG descriptor; SVM | [58] | 2019 |
| wool, cashmere | 96 | fiber | SEM | Image processing: Hough Transform and Feature Extraction; MLP | [59] | 2019 |
| wool, cashmere and wool cashmere blends | around 90 | fiber | LM | CNN method with RPS | [60] | 2019 |
| wool, cashmere and wool cashmere blends | 97.47 | fiber | LM | Image preprocessing: contrast stretching algorithm, digital analysis methods: fractal algorithm, parallel-line algorithm and K-means clustering algorithm | [61] | 2019 |
| wool, cashmere and wool cashmere blends | more than 90 | fiber from top | LM | Image preprocessing: highpass filtering, contrast stretching, binarizing, removing small connected components, filling margin, segmenting from the background; bag of word model; SVM | [62] | 2018 |
| wool, cashmereand wool cashmere blends | up to 95.2 | fiber | LM | CNN and fine-grained method | [63] | 2018 |
| wool, cashmere | 90 | fiber | LM | Image analysis: pairwise rotation Invariant co-occurrence local binary patterns; SVM | [64] | 2018 |
| wool cashmere blends | around 90 | fiber from top | LM | Image processing: projection curve; neural network with MLP, SVM, and KRR/classification; data training and testing, RQA, DGD, and DWT | [65] | 2017 |
| wool, cashmere | 81.17 | fiber | LM | Image processing: Tamura texture feature method; BP neural network | [66] | 2015 |
| wool, cashmere | 87.35 | fiber | LM | Digital image, SVM | [67] | 2014 |
| wool, cashmere | above 83 | fiber | SEM | Extraction scale density, SVM and image processing using filtering method and high frequency emphasized filter | [68] | 2012 |
| wool, cashmere | over 92 | fiber | xxxxxxx | GA- SVM | [69] | 2011 |
| wool, cashmere | higher than 93 | fiber | LM | Image processing and LVQ model, ANN | [70] | 2011 |
| wool, cashmere and stretch wool, cashmere | 99 and 81.06 | fiber | xxxxxxx | Digital image processing: character parameter extract using sub-measurement to measure the diameter set up the Bayesian model | [71] | 2010 |
| wool, cashmere | xxxxxxx | fiber | SEM | Image analysis: 2DDTCWT texture analysis | [72] | 2010 |
| wool, cashmere blends | xxxxxxx | yarn | LM | Image processing: SVM | [73] | 2010 |
| wool, cashmere | until 98.75 | fiber | LM | Image processing and LVQ model neural network classifier based on scale pattern | [74] | 2008 |
| wool, mohair | xxxxxxx | fiber | LM | Image processing: Model I: feature extraction with image processing, Model II: feature extraction with MLP and unsupervised ANN | [75] | 2002 |
| wool, mohair | 88 | fiber | LM | Image processing: filtering, contrast stretching, thresholding, interactive operations, rotating, and morphological operations. ANN | [76] | 2001 |
| wool, cashmere | until 97.5 | fiber | SEM | Image analysis, scale pattern data: automatic image scanning by means of a boundary tracking algorithm; transforming the image data from the spatial domain to the frequency domain and analyzing the resultant power spectral image | [77] | 2000 |
| wool, cashmere | xxxxxxx | fiber | SEM | Semi-automated imaging techniques for characteristic scale pattern data | [78] | 1997 |
| Fibers | Analytical Method | Identification or Quantification | Accuracy | Fiber Processing Stage | References | Year |
|---|---|---|---|---|---|---|
| wool, mohair | Raman spectroscopy and ratiometric analysis | identification | xxxxxxx | fiber | [94] | 2022 |
| shahtoosh, cashmere, angora rabbit | FTIR and chemometry | identification | 100% | xxxxxxx | [6] | 2022 |
| wool, cashmere, wool/cashmere blend | NIR spectroscopy | identification | 93.33% for cashmere and 96.60 for cashmere wool blend | textiles from market | [95] | 2019 |
| cotton, Tencel, wool, cashmere, PET, PLA, PP | NIR spectroscopy | identification | 100% identification | fiber sliver by carding | [96] | 2019 |
| wool, cashmere, rabbit, camel | NIR spectroscopy | identification | 100% sensitivity and 100% specificity | fiber | [97] | 2019 |
| wool, cashmere, qiviut, bison, vicuña | FTIR | identification | xxxxxxx | fiber | [98] | 2018 |
| wool cashmere blends | NIR spectroscopy | quantification | SEP of cashmere content 0.5% | fiber | [99] | 2017 |
| wool/cotton, wool/mohair, wool/spandex, wool/silk and wool/cashmere blends | NIR spectroscopy | blend identification | from 100% to 85% | fabric | [100] | 2016 |
| wool cashmere blend | NIR spectroscopy | quantification | RMSEP: 2.8% | fiber | [101] | 2014 |
| wool, cashmere, yak, angora rabbit and wool–cashmere blends | NIR spectroscopy | identification and quantification | percentages of recognition and rejection of 98–100%. SEP: 13.10 for wool/cashmere blend | combed sliver | [102] | 2013 |
| wool, cashmere, PET, PA, PU, silk, flax, linen, cotton, viscose, cotton-flax blending, PET-cotton blending, and wool–cashmere blending | NIR spectroscopy | identification | 100% discrimination between wool and cashmere | fiber, yarn, fabric | [103] | 2010 |
| wool, cashmere and wool/cashmere blend | NIR spectroscopy | identification and quantification | SEP: 1.2061 | fiber | [104] | 2010 |
| Animal Fiber | Identification or Quantification | Accuracy | Fiber Processing Stage | References | Year |
|---|---|---|---|---|---|
| wool/cashmere blend | quantification | results of DNA analysis and LM in fabrics were quite close | fiber, yarn, dyed and finished fabrics | [36] | 2015 |
| rabbit, wool, cashmere, yak, alpaca, duck down | identification of rabbit | good accuracy | fiber | [115] | 2015 |
| wool/cashmere blend | identification | minimum amount of wool detectable in cashmere 9.09% | fiber | [116] | 2015 |
| wool, cashmere | identification | minimum amount of wool detectable in cashmere 11.1% | fiber | [117] | 2015 |
| wool, cashmere | quantification in blend | xxxxxxx | fiber and fabric | [118] | 2014 |
| shahtoosh, cashmere | identification | minimum amount of shahtoosh detectable in cashmere: 1% | fiber and processed product | [119] | 2014 |
| wool, cashmere and wool/cashmere blend | identification and quantification in blend | more precise and accurate than traditional microscopic examination | fabric | [120] | 2013 |
| wool, cashmere | identification and quantification in blend | minimum amount of wool detectable in cashmere and vice versa: 11.1% | fiber | [121] | 2012 |
| wool, cashmere and wool/cashmere blend | identification and quantification in blend | minimum amount of wool detectable in cashmere: 1% | fiber | [122] | 2011 |
| cashmere/cashgora, fine wool, yak and camel | identification and quantification in blend | detection limit of about 3% for fine wool/cashmere and yak/cashmere blend | untreated and treated (dyed, bleached) samples | [114] | 2009 |
| wool and goat (cashmere, cashgora, mohair) | distinguishing between sheep and goat fiber | xxxxxxxx | fiber | [123] | 1992 |
| Animal Fibers | Protein Extraction | Peptide Production | Analytical Method | Identification or Quantification | Accuracy | Fiber Processing Stage | References | Year |
|---|---|---|---|---|---|---|---|---|
| cashmere, shahtoosh | DTT | sds page and trypsin | Maldi TOF-MS | quantification | minimum amount of shahtoosh detectable in cashmere: 5% | raw fiber and fabric | [10] | 2022 |
| vicuña, alpaca, guanaco, lama | DTT | trypsin | UHPLC MS/MS and chemometry | Identification of guanaco, vicuña, alpaca | 100% discrimination guanaco, vicuña, alpaca | fiber and ancient textiles | [125] | 2021 |
| wool, goat, cattle, camel, human hair | DTT | trypsin | UHPLC-MS ESI-Q-TOF | species-specific marker list improvement | xxxxxxx | ancient raw fibers and ancient textiles | [7] | 2019 |
| wool, cashmere | DTT | trypsin, trypsin–chymotrypsin, trypsin- GLU-C | NanoLC MS/MS | selection of species unique peptides | xxxxxxx | raw fibers and commercial textiles (for verification) | [130] | 2018 |
| wool, cashmere, yak | DTT | trypsin | UPLC/ESI-MS | quantification | average errors from −3%/−6% to 3%/7% depending on the fiber | fiber, sliver, yarn, fabric | [126] | 2017 |
| wool, cashmere | DTT | trypsin | MALDI-TOF MS | marker identification | xxxxxxx | fiber | [133] | 2016 |
| wool, cashmere, yak | DTT | trypsin | nanoLC MS/MS triple TOF | marker identification, fiber identification and quantification | cashmere percentages are in good agreement with LM results | fiber and fabric | [129] | 2016 |
| wool, cashmere, yak | DTT | sds page and trypsin | MALDI TOF/MS MS | quantification in blend | very good linearity between the compositionand the peak area ratio | fiber and textile | [132] | 2014 |
| cashmere, wool, mohair, yak, camel, angora, alpaca | DTT | trypsin | MALDI-TOF MS and chemometric | identification | RMSE 0.365 for pure fiberRMSE 0.471 for blend | untreated and treated fibers and 50/50 blend | [134] | 2013 |
| cashmere, yak | mercaptoethanol | trypsin | MALDI TOF MS | identification | xxxxxxx | fiber and fabric | [127] | 2013 |
| wool, cashmere, yak | DTT | trypsin | UPLC/ESI MSUPLC/ESI MS MS | identification and quantification in blend | limit of detection: 5% | raw, bleached, depigmented, dyed fiber | [37] | 2013 |
| wool, cashmere, yak | DTT | sds page and trypsin | MALDI-TOF MS | specific marker identification for keratin I | xxxxxxx | fiber | [131] | 2012 |
| wool, yak, human, rabbit, dog, mohair, mink, fox | mercaptoethanol | trypsin | MALDI-TOF MS | identification and quantification | xxxxxxx | raw, dyed, bleached fibers | [128] | 2002 |
| Methods | Instrument Depreciation Cost | Chemicals and Consumables Cost | Analysis Times | Pros | Cons |
|---|---|---|---|---|---|
| LM and SEM | not high for LM, high for SEM | not high | long | consolidated analysis | lack objectivity; need of operators with a high degree of skill and experience; problems with fibers morphologically very similar or damaged |
| Image processing | not high | not high | short after an initial time-consuming calibration | high accuracy of fiber identification | most of the studies are limited to wool–cashmere classification and raw fibers; calibration using damaged fibers or fibers with very similar morphology |
| NIR spectroscopy | not high | not high | short after an initial time-consuming calibration | non-destructive analysis; availability of portable instruments; possibility to take measurements directly on the production line | discordant results in blend quantification |
| Proteomic analysis | high | high | long | results not influenced by very similar or altered surface fiber morphology | problems with fiber identification in very close or expensively hybridized species |
Disclaimer/Publisher’s Note: The statements, opinions and data contained in all publications are solely those of the individual author(s) and contributor(s) and not of MDPI and/or the editor(s). MDPI and/or the editor(s) disclaim responsibility for any injury to people or property resulting from any ideas, methods, instructions or products referred to in the content. |
© 2023 by the authors. Licensee MDPI, Basel, Switzerland. This article is an open access article distributed under the terms and conditions of the Creative Commons Attribution (CC BY) license (https://creativecommons.org/licenses/by/4.0/).
Share and Cite
Zoccola, M.; Bhavsar, P.; Anceschi, A.; Patrucco, A. Analytical Methods for the Identification and Quantitative Determination of Wool and Fine Animal Fibers: A Review. Fibers 2023, 11, 67. https://doi.org/10.3390/fib11080067
Zoccola M, Bhavsar P, Anceschi A, Patrucco A. Analytical Methods for the Identification and Quantitative Determination of Wool and Fine Animal Fibers: A Review. Fibers. 2023; 11(8):67. https://doi.org/10.3390/fib11080067
Chicago/Turabian StyleZoccola, Marina, Parag Bhavsar, Anastasia Anceschi, and Alessia Patrucco. 2023. "Analytical Methods for the Identification and Quantitative Determination of Wool and Fine Animal Fibers: A Review" Fibers 11, no. 8: 67. https://doi.org/10.3390/fib11080067
APA StyleZoccola, M., Bhavsar, P., Anceschi, A., & Patrucco, A. (2023). Analytical Methods for the Identification and Quantitative Determination of Wool and Fine Animal Fibers: A Review. Fibers, 11(8), 67. https://doi.org/10.3390/fib11080067