Article

Accelerated Zero-Stress Hydrothermal Aging of Dry E-Glass Fibers and Service Life Prediction Using Arrhenius Model

1
Department of Mechanical Engineering, University of Alberta, Edmonton, AB T6G 1H9, Canada
2
Flexpipe, Mattr Infrastructure Technologies, Calgary, AB T2C 0A9, Canada
*
Author to whom correspondence should be addressed.
Fibers 2023, 11(8), 70; https://doi.org/10.3390/fib11080070
Submission received: 29 May 2023 / Revised: 1 August 2023 / Accepted: 7 August 2023 / Published: 15 August 2023

Abstract

:
Comprehending the degradation of glass fibers is crucial for service applications involving dry and wet conditions, especially when prolonged contact with water above room temperature is present. Depending on the polymer material, both thermosetting and thermoplastic matrices can permit the ingress of moisture. Therefore, fiber reinforcements embedded in the polymer matrix may experience moisture exposure. Additionally, some structural applications use fiber devoid of any matrix (dry fibers), in which water exposure must be avoided. In all of these cases, moisture may, therefore, have a significant impact on the reinforcing elements and the rate of degradation. The present work focuses on the effects of hydrothermal aging on the mechanical durability of long E-glass fibers by immersion in water at 60 °C, 71 °C, and 82 °C. A service life forecast model was created utilizing the Arrhenius technique, and a master curve of strength variation with exposure time was created for E-glass fibers at 60 °C. Using this modeling approach, it is possible to approximate the amount of time it will take to attain a given degradation level over a specified range of temperatures. Scanning electron microscopy was used to evaluate morphological changes in fiber surfaces due to hydrothermal exposure, while Fourier transform infrared spectroscopy and mass dissolution studies were used to elucidate the mechanism of the strength loss.

1. Introduction

The utilization of fiber-reinforced polymer composites (FRPC) has rapidly increased over the past few decades because of their attractive mechanical properties (strength, stiffness), comparatively low volumetric mass density, and excellent corrosion resistance compared to traditional engineering materials like steel and aluminum [1]. Due to its extraordinarily high performance-to-price ratio, more than 95% of the reinforcement used in the composite industry is made of glass fiber (GF) [2]. Different types of glass fibers (GFs) are commercially available. The most common are E, ECR, R, and S-glass, which are listed here in ascending order of mechanical strength [3]. Boron oxide and fluorides are added as a melting agent to ease the melting process in the E-glass formulation. Current environmental regulations in the United States and Europe prohibit the discharge of boron into the atmosphere. As per new regulations, the composition of E-glass containing low boron levels is SiO2 (59–60%), Al2O3 (12–13%), CaO (22–23%), MgO (3–4%) ZrO2 (0.5–1.5%), NaO (0.6–0.9%), K2O (0–0.2%), Fe2O3 (0.2%) and F (0.1%) [4]. One crucial element that affects the performance of glass fibers is sizing: an organofunctional silane-containing coating on the fiber surface that promotes fiber adherence to the matrix [5]. Sizing has been shown to increase the interphase strength and strength retentions of composites subjected to hydrothermal aging conditions [2,6]. Exposure to moist and humid circumstances can accelerate the aging process of composite materials, negatively impacting mechanical properties, and thus, shortening their service life. Environmental aging coupled with elevated temperature constitutes a severe case of accelerated aging [7,8,9,10,11]. Notably, different composite constituents are impacted by environmental aging in different ways. As a result, it is crucial to comprehend for each constituent the kinetics and mechanisms of environmental aging to ensure the composite’s environmental durability. A comprehensive understanding of aging effects is still missing when composites are utilized with prolonged exposure to elevated temperatures, water, and hydrocarbons. Data for service time assessments must currently be obtained via expensive and time-consuming test procedures [12].
Interest in the environmental aging of FRPCs is significant, with many studies focusing on composites with E-glass as the reinforcement phase [7,9,10,11,13]. Davalos et al. [7] performed a durability study on GF-reinforced polymer (GFRP) bars exposed to tap water. They stated that the degradation of the fiber/matrix interphase was the primary mechanism for reduced GFRP bar performance. The authors also emphasized that fiber corrosion due to prolonged exposure could dominate the degrading process. In a similar study by Idrisi et al. [9], the resilience of the E-glass/epoxy composite was tested in a saltwater environment. The leading causes for a loss in tensile strength were found to be the breakdown of chemical bonds between the fiber and resin caused by chemical corrosion and poor interlocking between fibers and the resin caused by resin swelling owing to water absorption, particularly at a 90 °C immersion. Later, Noamen et al. [10] conducted hydrothermal aging studies of GF-epoxy and carbon fiber–epoxy laminated composites exposed to temperatures of 24 °C, 70 °C, and 90 °C. The water absorption was found to obey Fickian behavior in all the tested laminates. Moreover, GF–epoxy composites were reported to have a higher diffusion coefficient due to their polarity and hydrophilicity. Matrix plasticization brought on by moisture and temperature resulted in the loss of mechanical characteristics. Bobbaa et al. [11] performed axial compression and internal pressure burst tests on E-glass and S-glass fiber–epoxy reinforced composite pipes created by filament winding after they were subjected to hydrothermal aging at 90 °C. The burst pressure and compression behavior of the conditioned specimens were significantly reduced because of environmental aging. As the aging duration increased, the degradation of the matrix and fiber/matrix connection increased as the moisture entered through the pipe’s outer surface and into the resin matrix. The result was a reduced load-carrying capacity of the E-glass and S-glass fiber/epoxy composite pipes. Recently, Borges et al. [13] investigated the water uptake behavior for PBT-GF30 (polybutylene terephthalate with 30% short glass fibers) and fiber-free PBT in conjunction with the effect on the material’s mechanical properties. They found that PBT absorbed more water than PBTGF30, albeit at a higher rate. The water diffusion was also shown to obey Fickian behavior. Polymeric chain relaxation was ascertained because of water ingress, resulting in mechanical properties loss. Chemical changes in the PBT were elucidated by the material’s FTIR profile changing from 80 °C to 85 °C. In recent work, Shao et al. [14] discovered that the polyester matrix GFRP did not exhibit symptoms of water-absorption saturation after 260 days submerged in water at 23 °C despite a 17.5% reduction in tensile strength. The tensile strength of the GFRP declined by 56.3% at 70 °C, and its water absorption increased and then reduced, even reaching negative values. However, GFRP Young’s modulus was practically constant at the two temperatures. Similar results were reported by Grammatikos et al. [15], who concluded that because of the increase in temperature, there was an increase in moisture absorption and water diffusion, and the complete process of water diffusion did not reach saturation. In a recent study, Ghabezi et al. [16] investigated the changes in mechanical properties of glass/epoxy and carbon/epoxy composite specimens after immersion in an accelerated marine environment (artificial seawater, with 3.5% salinity at room temperature and 60 °C). They observed a change in composite laminates’ microstructure and mechanical properties (microcracks and debonding between matrix and fiber), indicating the degrading phenomenon. Additionally, reductions in tensile and shear strengths of glass/epoxy samples were much higher than those of carbon/epoxy specimens. In contrast, carbon/epoxy composites showed a higher reduction in flexural strength values than glass/epoxy samples. The findings showed that in composite materials, deterioration mechanisms persist even after reaching the saturation threshold. They concluded that the impact of chemical-based degradation (such as the reaction between water and epoxy or chain scission) on the loss of mechanical properties of composite samples was greater than the impact of mechanical-based damage, such as stress induced by water absorption or the capillary and osmosis phenomenon. In a related study, Guo et al. [17] investigated the hygrothermal properties of pultruded carbon, glass, and carbon/glass hybrid fiber reinforced polymer (C/GFRP) composites by immersing them in deionized water for up to 135 days at 40 °C, 60 °C, and 80 °C. They stated that the water uptake behavior of all three composite plates followed an initial Fickian diffusion behavior and a long-term degradation behavior. When submerged in deionized water, the thermal and mechanical properties of C/GFRP were degraded by up to 29.5% for the short beam shear strength (SBSS), 25.8% for the three-point bending strength, and 43.1% for the glass transition temperature, respectively. The diffusion of water molecules resulted in the reversible effect of resin plasticization and the irreversible effect of resin relaxation leading to property deterioration. Furthermore, the degradation of SBSS was accelerated by the irreversible fiber/resin interface debonding. Recently, Messana et al. [18] investigated the effect of hydrothermal aging on the chemical, mechanical, and thermal properties of woven carbon fiber and glass fiber with traditional epoxy resin and advanced thermoplastic polyphenylene sulfide (PPS). It was observed that the epoxy-based composites exhibited a property gain by an increase in cross-link density and property loss due to matrix plasticization. In the PPS composites, the matrix was chemically stable, and strength reduction occurred due to damage occurring in the fiber matrix interphase. Fang et al. [19] investigated the performance of carbon fiber-reinforced polycarbonate (CF/PC) composites exposed to deionized water at 80 °C and measured the changes in the storage modulus and erosion angle. The maximum erosion angle of composites was observed to deviate due to hydrothermal aging, showing that the composites underwent a transformation from ductile to brittle behavior. Furthermore, using a scanning electron microscope, cracks and cavities caused by water absorption were visible, suggesting that hydrothermal aging causes CF/PC composites to plasticize and degrade, which lowers their corrosion resistance. Dong et al. [20] investigated the durability of glass fiber-reinforced polypropylene (GF/PP) unidirectional sheets by exposing them to distilled water and a combination of seawater, sea sand, and concrete for up to 6 months at 45 °C at 25 °C and 60 °C and evaluated changes in their mechanical properties. The results demonstrated that the GF/PP sheet was extremely susceptible to immersion in seawater at high temperatures, leading to an unusually elevated water uptake of 3.4% at 60 °C. Following a six-month immersion in seawater at 25 °C and 60 °C, the longitudinal tensile strength retention was 22.7% and 3.3%, respectively. The GF/PP sheet showed significantly better property retention while submerged in water; for instance, at 60 °C for six months, the longitudinal and transverse tensile strength retentions were 79.3% and 84.0%, respectively. The GF/PP sheet absorbed 0.69% of the saturated water in water at 60 °C. A poor glass fiber/polypropylene interface, the sheet’s relatively thin thickness, and the glass fiber’s low resistance to seawater were factors that led to the decreased mechanical properties of the GF/PP sheet. It should be noted that the preceding studies primarily focused on the polymeric matrix, and the fiber–matrix interphase, yet changes to the fiber phase were not given in-depth attention.
Some research on GFRP has shown that in long-term exposure, hydrolytic deterioration is primarily due to degradation occurring in the matrix–fiber interphase and fiber dissolution processes [1,3,7,11,21]. Further studies on the direct exposure of GFs to various aging solutions have ensued because of these discoveries. Models based on mass dissolution have primarily been used to explain the strength loss of glass fibers exposed to adverse environmental conditions [1,21,22,23]. In their research, Krauklis et al. [21] created a model to estimate the mass dissolution of fibers exposed to water at 60 °C using zero-order kinetics. Na, K, Ca, Mg, Fe, Al, Si, and Cl were among the elements released during degradation, and constant rates for the total mass loss and each ion release were found. Compared with other elements, Si was shown to have the highest contribution to mass loss (56.1%). Moreover, Jones and Stewart [24] examined the corrosion of E-glass fibers in sulfuric acid at various temperatures and concentrations. They found that the pace of corrosion does not primarily depend on the quantity of sulfuric acid because precipitation, not complex ion formation, made it easier to remove ions from the GF. Additionally, an increase in temperature accelerated the corrosion rate, which was described by Arrhenius-based activation energy models. In another study by Wei et al. [25], basalt and glass fibers exposed to sodium hydroxide and hydrochloric acid solutions showed a noticeable loss in strength. The attack of the hydroxyl ion on the SiO2 framework, shared by glass and basalt, caused a loss in strength. In a thermal aging study performed by Feih et al. [26], the strength loss of two types of GF (E-glass and Advantex, an E-glass substitute free of boron) were investigated at temperatures up to 650 °C and heating durations up to 2 h. It was established that the glass’s mirror constant, which reflected the network structure, remained constant during heat treatment and the decrease in strength was caused by greater surface imperfections that remained after heat treatment.
In the case of composite pipes or tanks, one of the main reasons for failure is the permeation of corrosive fluids either internally through a liner or resin-rich liner or externally through a cover or jacket, causing an attack on the reinforcement layer. Several studies on aging E-glass exposed to harmful chemicals and acids have been conducted, and most of the research has been concentrated on this mode of corrosive fluid penetration [21,22,23,24]. The eventual ingress of the corrosive fluid beyond a polymeric barrier and the fluid’s attack on the GF itself can lead to failure in corrosion-resistant pipes and underground tanks. Motivated by these observations, the present work focuses on two main aspects related to GFs. First, several applications exist in which dry GFs (i.e., without being impregnated with a polymer matrix) are the main load-bearing element [27], or GFs are embedded in a thermoplastic matrix, which, depending on the polymer materials, can be susceptible to water exposure. In such situations, possible significant fluctuations in fiber performance must be considered for design factors. Therefore, accounting for changes to a composite structure’s physical and mechanical properties requires a thorough understanding of the strength degradation of dry GFs when subjected to hydrothermal conditions, as well as the mechanisms causing strength loss. Second, this work also seeks to build a foundation for the multiscale examination of FRPC degradation by focusing on understanding the change in fiber strength when exposed to water at different temperatures. Structures made of composite materials are often overdesigned due to insufficient data for individual components. By examining the performance of the fibers and matrix independently and then extrapolating pertinent attributes of the composite laminate from constituent behavior, a multiscale method can be derived that has the potential to alleviate the need for comprehensive testing campaigns. It has been acknowledged that a complete set of attributes is required for a thorough design; nevertheless, exploring a multiscale approach is still attractive due to its benefits upon implementation. In summary, this study aims to pinpoint environmental factors that cause GFs to age prematurely, analyze the effects that aging has on mechanical properties, and anticipate changes in mechanical properties using an Arrhenius modeling approach.

2. Materials and Methods

2.1. Arrhenius Model and Time-Temperature Superposition Approach

When temperature is the main accelerating factor in aging for composites, the Arrhenius model has frequently been employed to determine service life [7,8,28,29]. For materials below their glass transition temperatures, the Arrhenius model was shown to rather accurately predict the effects of temperature in accelerated aging experiments. The underlying assumption is that there is a single dominating degradation mechanism that does not change throughout exposure and that the degradation rate accelerates as exposure temperature increases. The general form of the Arrhenius model is given as:
k = A · e x p E a R ¯ T ,   or ,   ln k = E a R ¯ T + ln A  
where k is the reaction rate constant or degradation rate constant, A is a constant related to the material and aging environment, Ea is the activation energy, R ¯ is the universal gas constant, and T is the absolute temperature. Recognizing that the reaction rate constant is inversely related to time, k in the Arrhenius equation is frequently used for computing the time it takes to attain a material’s particular strength loss [30]. Using ultimate mechanical properties and their retention, such as tensile strength, interfacial shear strength, creep strength, and fatigue strength, the Arrhenius relationship is therefore frequently used to forecast the lifetime of polymers and composites [28]. The prediction procedure involves the following three main steps [30,31,32]:
  • Step 1: Plotting the property values at a specific temperature against time and fitting a curve through the points that reflect the degradation pattern.
  • Step 2: Determining the retention levels, also known as lifetime points, represent the time required for a material to reach a given degree of property degradation. These are directly obtained from the fitted curve.
  • Step 3: Plotting the logarithm retention time (hours) versus the inverse of temperature (1/T). The model is established via a linear fit with a regression coefficient (R2) value of at least 0.8.
A related and commonly used method for durability prediction is the time–temperature superposition (TTS) approach. It involves calculating a shift factor for two temperatures. The TTS theory states that the qualities of a material achieved after a brief exposure to a higher temperature are equal to those obtained after a longer exposure to a lower temperature [30,31,33]. For two temperatures T1 and T2, T1 < T2 is given by:
T S F = t 1 t 2 = A exp E a R ¯ T 2 / A exp E a R ¯ T 1
where TSF is the time shift factor. This process involves selecting a reference temperature and calculating the shift factor for the other temperatures. Then, the natural logarithm of the shift factor is plotted against the inverse of temperature (1/T). Thus, the agreement with the Arrhenius model is established via a linear fit with a regression coefficient (R2) value of at least 0.8 [31,32].

2.2. Material and Specimen Preparation

E-glass fiber material (E6DR-735-306B, Jushi, Tongxiang, Zhejiang, China) was used in this study, as it is commercially available and frequently used in the industry. The sizing on the GFs was silane-based. The sizing, the exact composition of which is proprietary, was compatible with thermoplastic composites and suitable for the fabrication of pipes and vessels using filament winding techniques. Each roving had a nominal filament diameter of 12 µm with a linear density of 0.735 g/m [34].
For conditioning, GFs were exposed to tap water for a maximum duration of 840 h (5 weeks) at 60 °C and 71 °C and 672 h (4 weeks) at 82 °C. The selected temperatures correspond to a broad set of applications in the industry, where the maximum temperature exposure is typically limited by the polymer constituents (such as by their melting or glass transition temperature). Aging was limited to the above durations based on the severe degradation effects that were observed. The pH of the tap water assessed in this study was assumed to be within a narrow range, with an average of 7.9 for all aging tests. GFs of a fixed length of 2.5 m (100 inches) were selected and submerged in a beaker with a volume of 4 L, as shown in Figure 1. Only the gauge section length of the fibers was submerged in tap water to ensure that fiber breakage was restricted to the sample gauge length. Then, the beaker was covered using aluminum foil and placed in the oven (see Figure 1). Calibrated thermocouples were used to measure the water temperature inside the beaker. Heated water was added periodically to compensate for evaporative losses.

2.3. Experimental Methods

2.3.1. Test Setup for Fiber Breaking Force Measurement

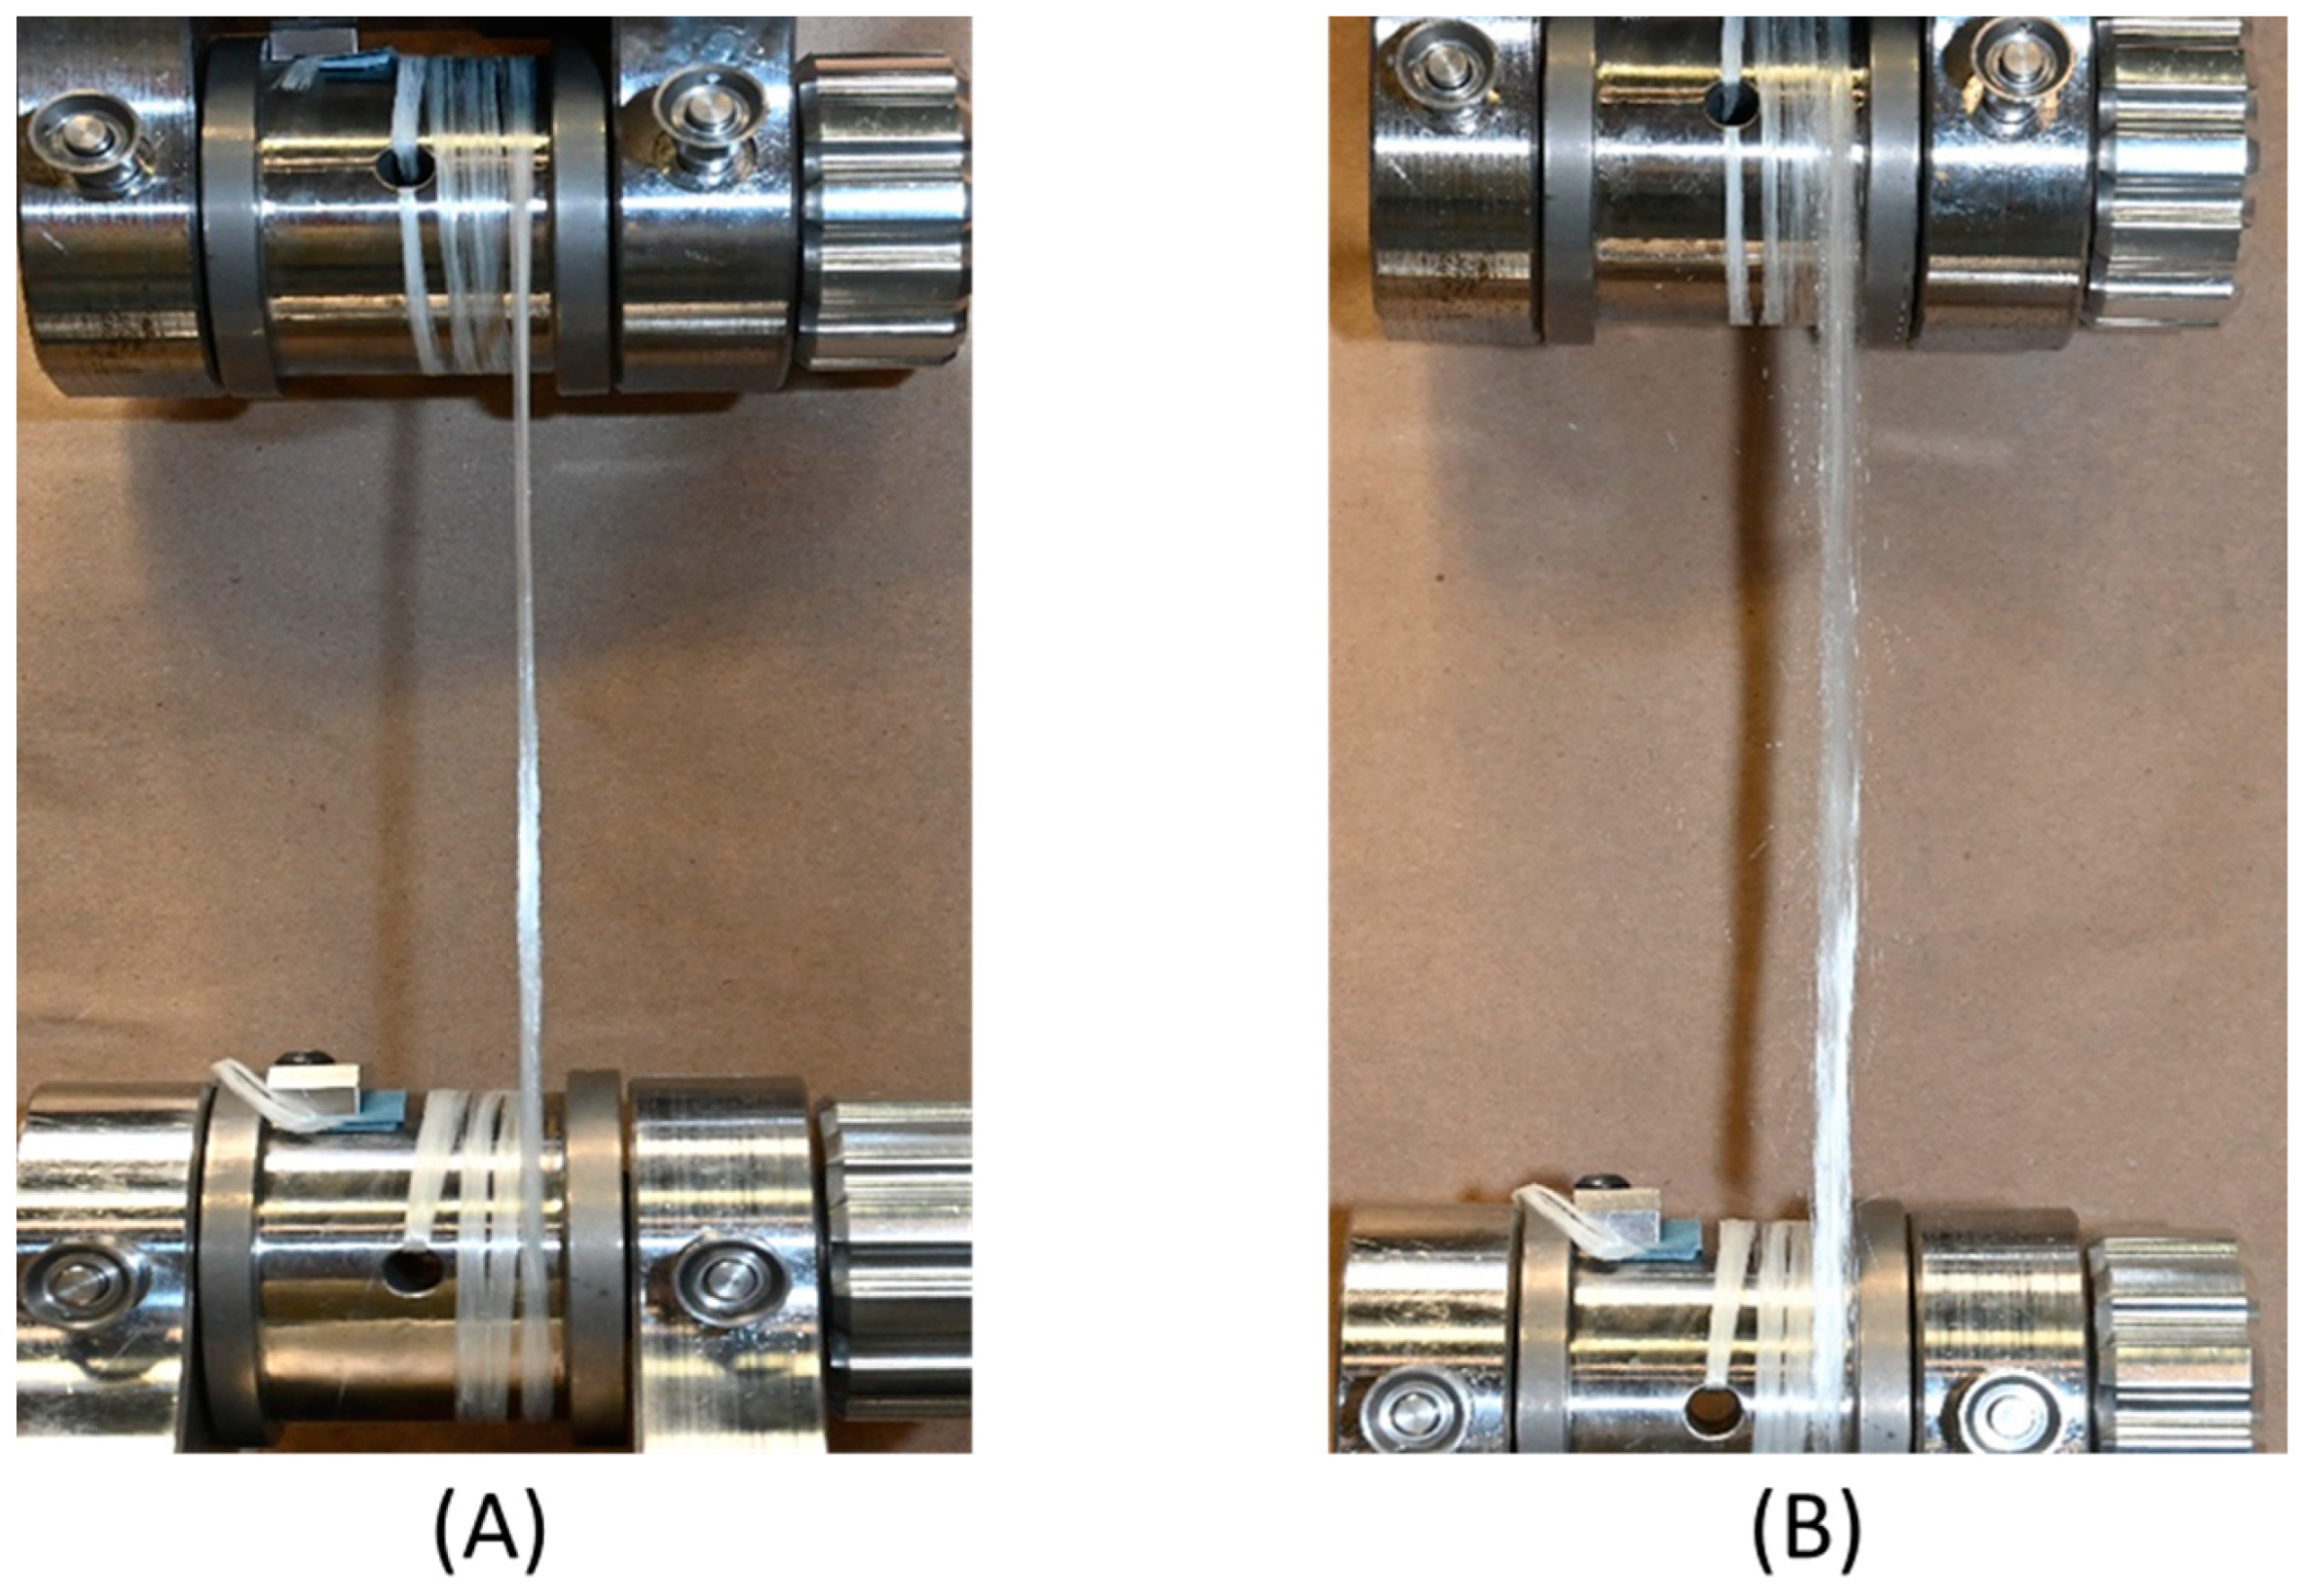
Fiber tensile tests were conducted in the air at room temperature (23 °C) using a universal testing machine (type 810, MTS Systems, Eden Prairie, MN, USA) with special Capstan grips made for fiber testing (see Figure 2). All tests were performed with a displacement rate of 50 mm/min and a gauge length of approximately 250 mm. At least ten specimens were tested for each aging duration for ‘dry’ and ‘wet’ test conditions. In ‘wet’ testing, samples taken straight from the oven were tested without drying. In contrast, samples for ‘dry’ testing were left to dry at room temperature for at least 24 h before testing. A large reduction in the testing load was considered indicative of specimen failure, and the maximum load from the load–displacement curve was taken as the breaking load. Figure 2B depicts fiber failure upon reaching the maximum load, i.e., the fiber strands became fuzzy, resembling Mohair yarn after failure. Notably, some filaments remained in various states of tension even after specimen failure. All the tests were conducted by adopting standards ASTM D 2256M-10 and ASTM D2343-17 [35,36].

2.3.2. Mass Dissolution Experiments

To understand which elements are released during the aging process, mass dissolution studies were performed on glass fibers aged for a duration of 168 h (1 week) at 60 °C and 82 °C. Seven strands of fibers of 75 mm in length each and an average mass of 0.4 g were selected. These strand sections were immersed in plastic tubes filled with 50 mL of deionized water. To capture any elements that could be released by the conditioning tubes, reference water samples without fibers were exposed simultaneously to the aging conditions that the fibers experienced. The concentration of dissolved ions in water was measured using a spectrometer of type iCAP6300 Duo/ICP-OES (Thermo Fisher Scientific, Waltham, MA, USA).

2.3.3. Fourier Transform Infrared Spectroscopy

Fourier transform infrared spectroscopy (FTIR) of the pristine and conditioned fibers was completed using a Nicolet Is50 FTIR spectrometer (Thermo Fisher Scientific). In this method, an infrared spectrum was created based on the absorption of electromagnetic radiation at frequencies corresponding to the vibration in sets of chemical bonds within a molecule. The aged samples were dried at room temperature for 24 h and stored in a controlled environment before performing the FTIR tests. Samples were examined in an attenuated total reflectance (ATR) mode with a diamond detector in the range of 400–4000 cm−1 with a resolution of 4 cm−1/min.

2.3.4. Scanning Electron Microscopy

Scanning Electron Microscopy (SEM) was conducted with an S-4800 instrument (Hitachi, Tokyo, Japan) to examine the surface morphology of unaged and hydrothermally aged fibers. Before imaging, the samples were coated with a gold layer using gold sputter coating equipment (Desk II, Denton, Moorestown, NJ, USA). An acceleration voltage of 10 KV and an emission current of 10 µA were applied. SEM images were captured at two different magnification levels.

3. Results and Discussion

3.1. Variation in Fiber Strength

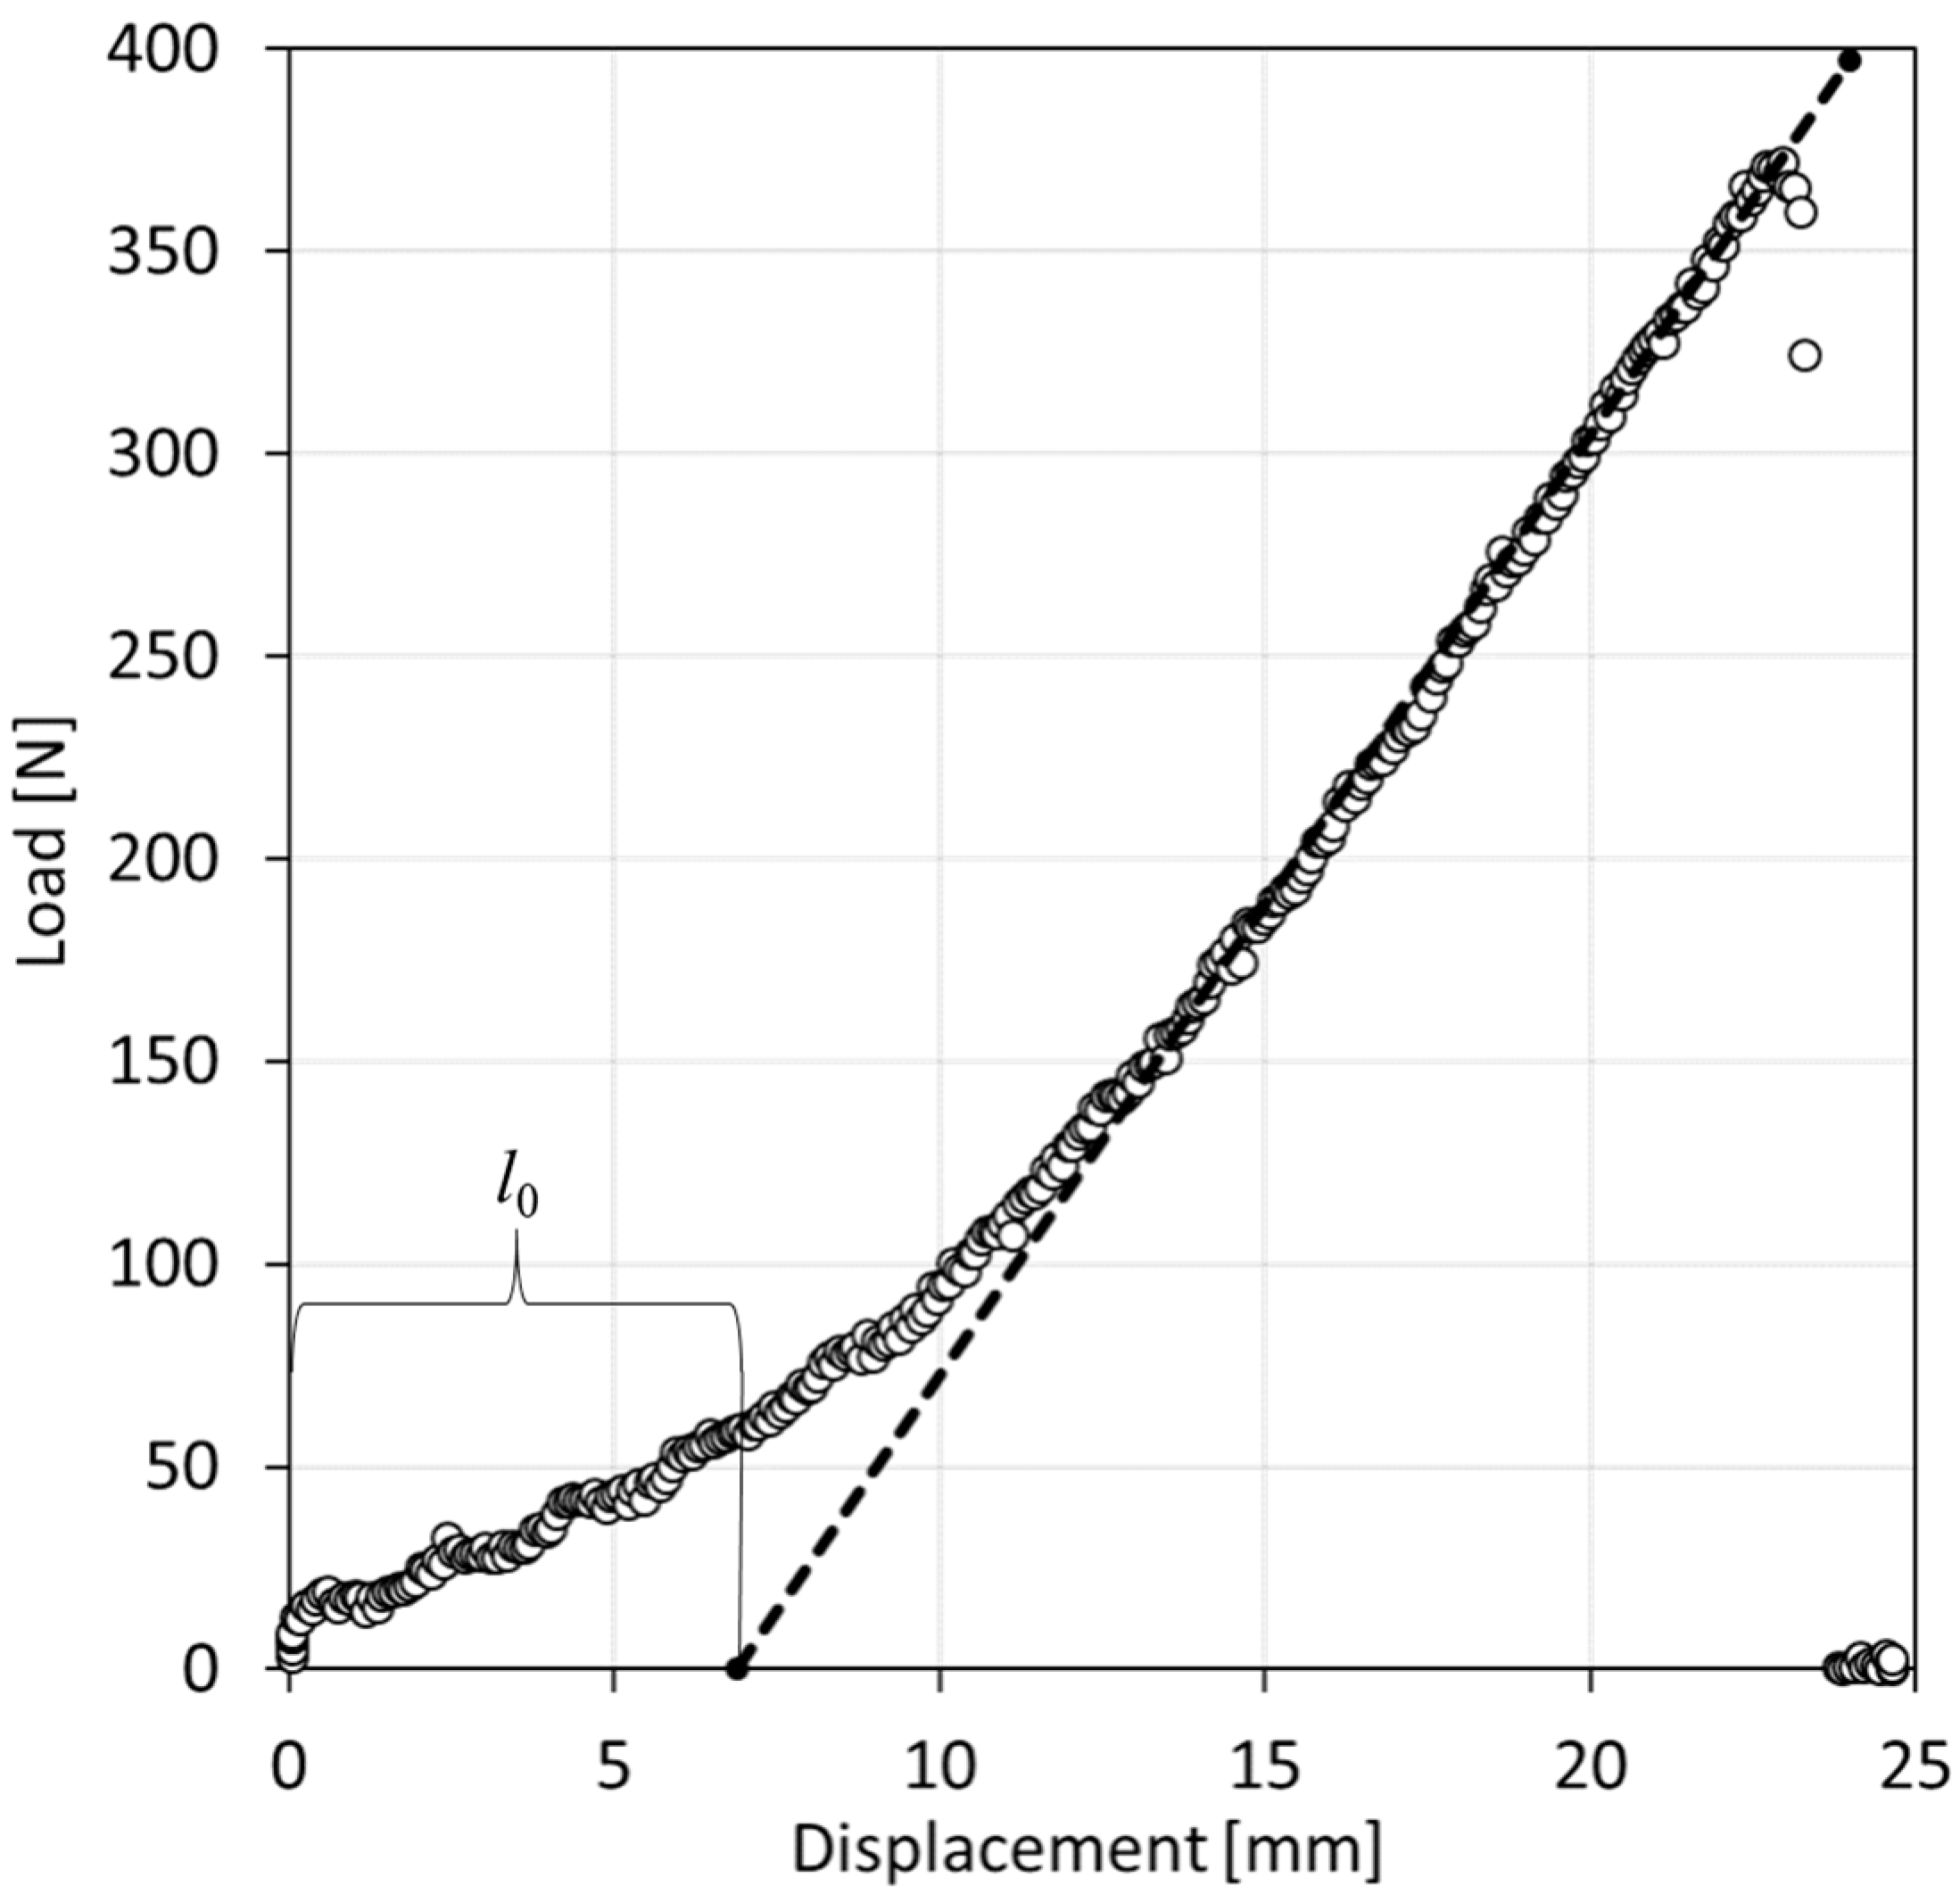
The tensile strength of GFs varies statistically, and therefore, strength is often quantified in conjunction with Weibull statistics [37]. Obtaining relevant statistics requires the bulk testing of fibers in the range of 40–100 separate fibers for each condition. The Weibull parameters of individual fibers can also be back-calculated, provided the load–displacement curves are correctly measured. This study examined the relative change in fiber strength following various exposure durations to water at 60 °C, 71 °C, and 82 °C. Measuring the peak load of a single fiber bundle test was sufficient to examine the strength changes, presuming that Weibull and Young’s moduli remained constant and that exposure to water solely affected the fibers’ characteristic strength [38]. The variations in fiber strength could be expressed as breaking tenacity (cN/Tex), which is the maximum load (in N) divided by the linear density (in Tex = g/km) of glass fibers, or tensile strength, which is the breaking load divided by the fiber cross-sectional area. The load–displacement plot for a pristine GF sample tested at room temperature is depicted in Figure 3. The dashed line indicates the linear section of the load–displacement curve, which displays a Hookean region. Any slack in the fiber is denoted as l0, see Figure 3, and its corresponding displacement does not accurately reflect the behavior of the fiber because strands typically slip and tighten on the grips when loaded. However, since the maximum load is the only property of relevance, as it serves as the basis for calculating fiber strength, the effect of fiber slack received little consideration. In this study, strength retention or reduction was used to compare the variation in the mechanical performance of fibers with different aging durations and temperatures. Therefore, tenacity and tensile strength became equivalent data. It should be noted that the initial strength of GFs was slightly lower than that given in the manufacturer data sheet [34]. The reasons for these differences could be due to differences in the test methods and conditions, such as fiber-to-fiber friction and misalignment or twist in the fibers during testing. However, since this paper mainly focuses on understanding the relative changes in strength due to aging, a lower strength compared to manufacturer specifications was immaterial for the outcome of this study.
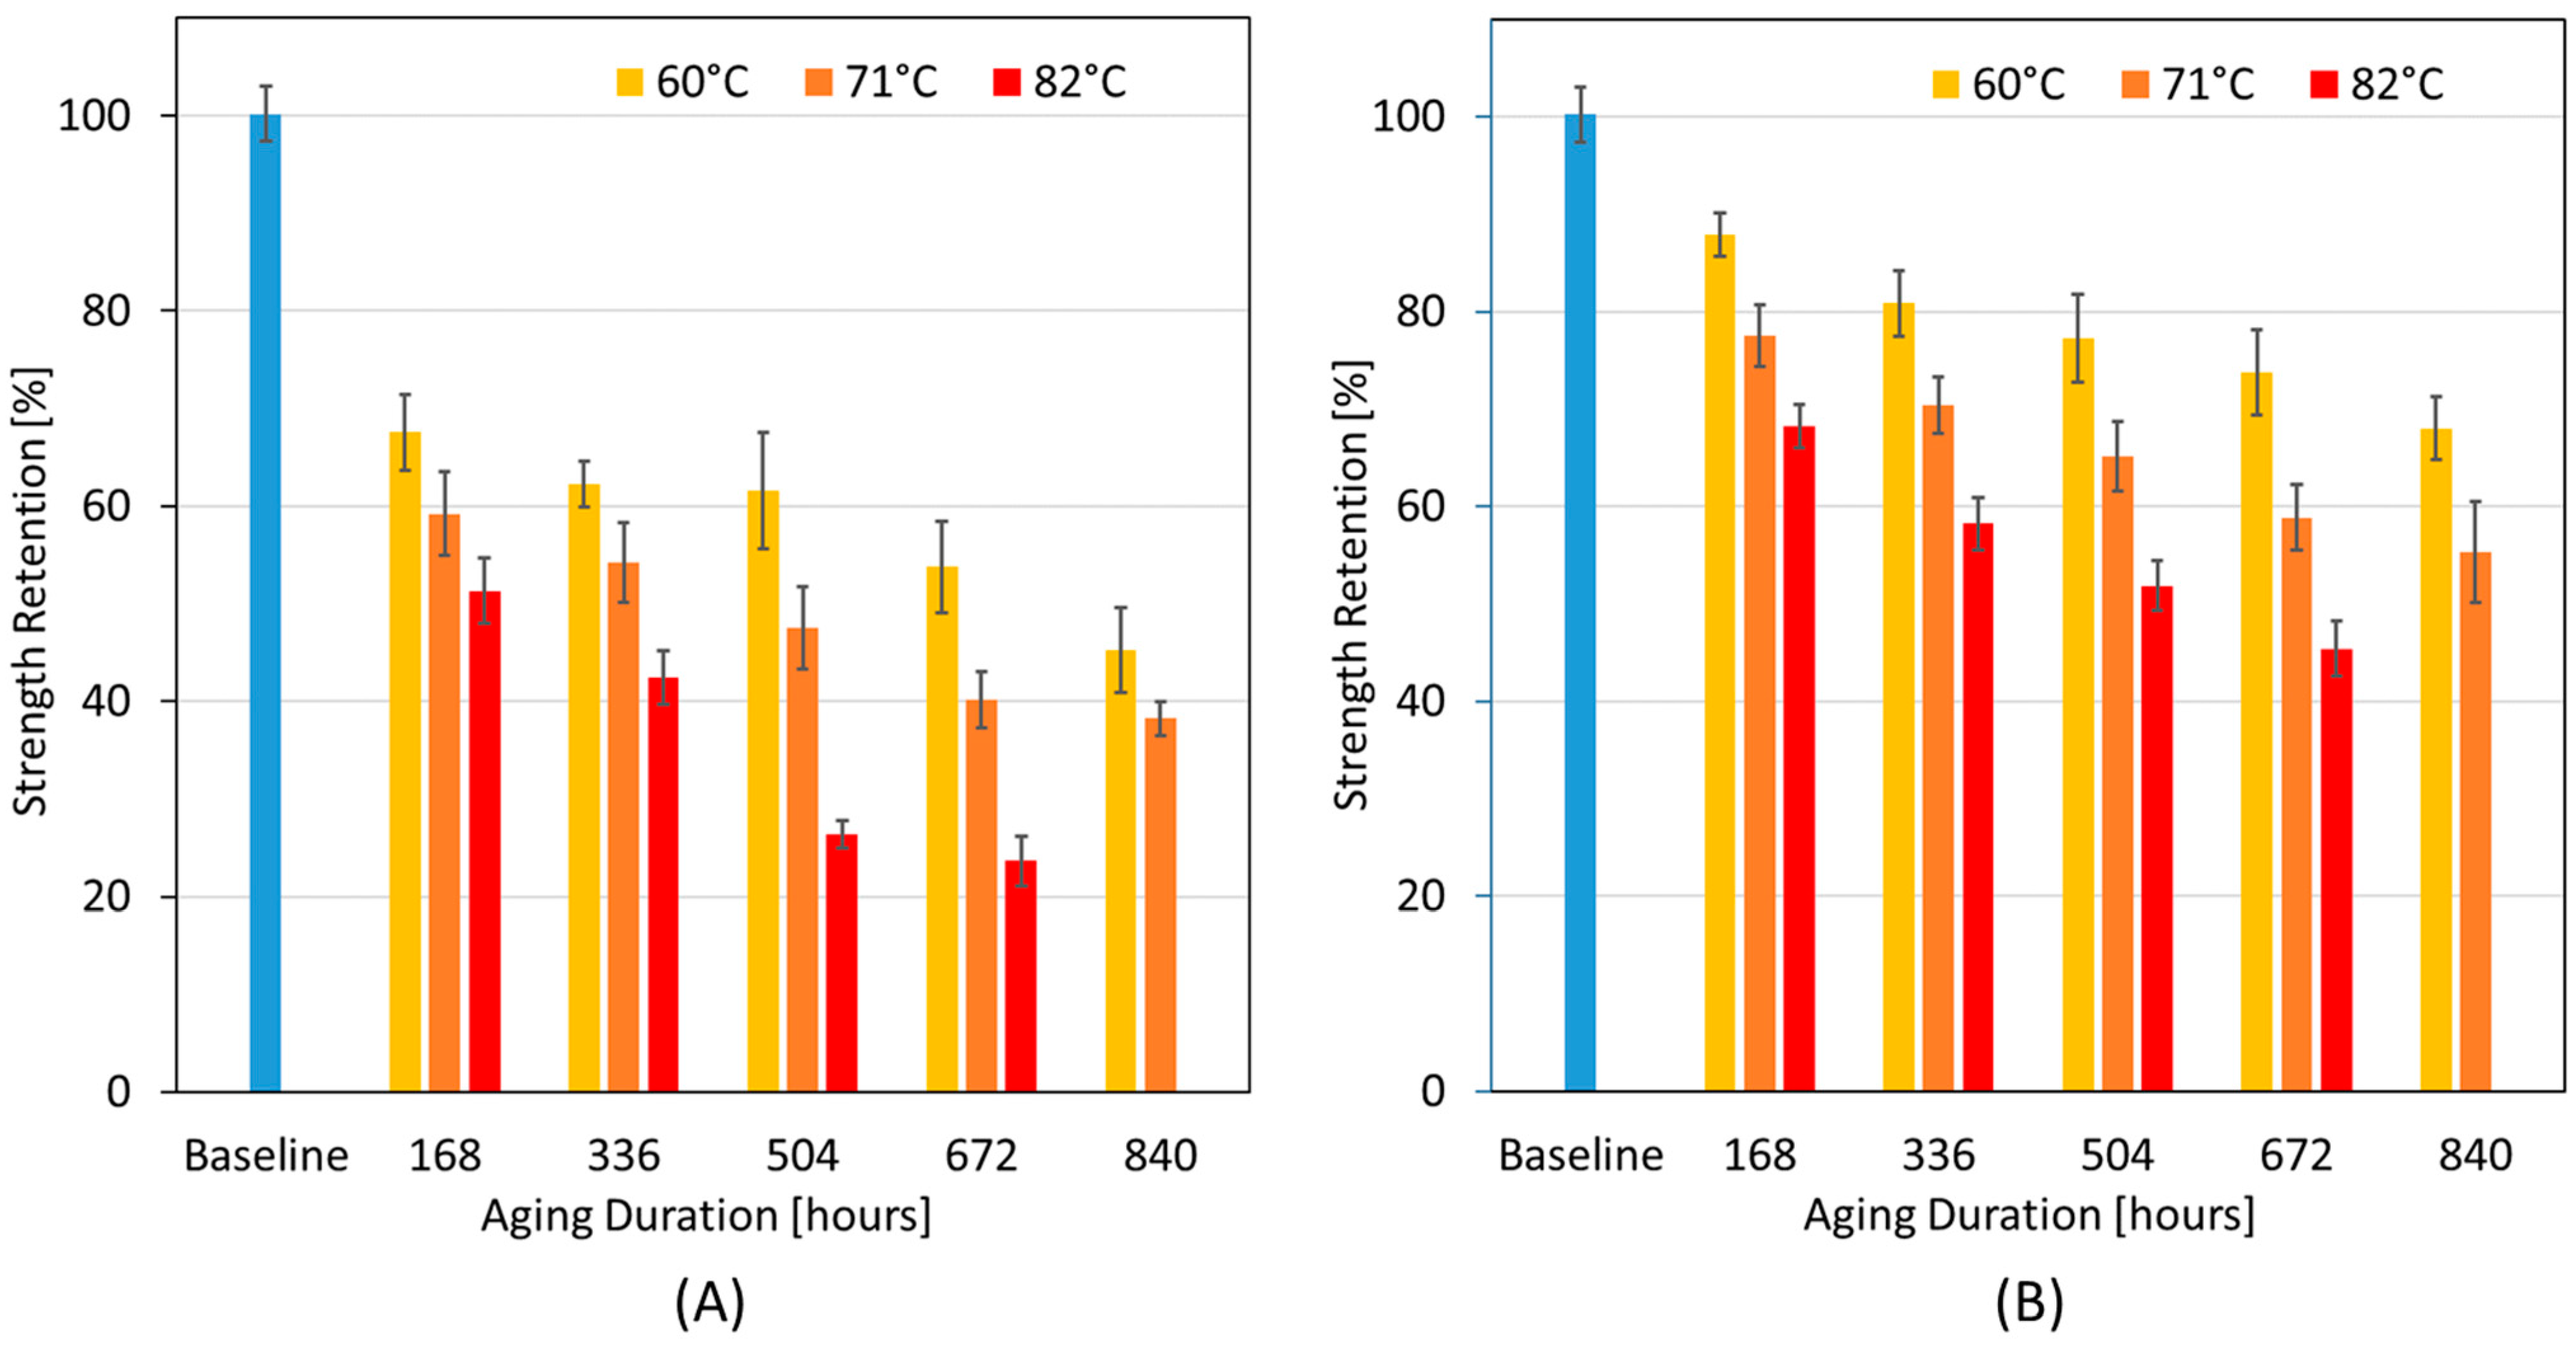
A large difference in the strength values was ascertained between fibers tested when ‘wet’ and ‘dry’, see Figure 4A and Figure 4B, respectively. Error bars in these graphs denote one standard deviation from the mean value. Data labeled ‘Baseline’ refer to samples that were tested as received from the manufacturer, that is, without aging. Wet samples exhibited significantly lower strength than dry samples for all aging durations and temperatures. The lowest strength values were observed for fibers aged at 82 °C for 672 h (4 weeks), with an almost 77% reduction in strength for fibers tested in wet conditions and a 55% drop in strength for dried fibers. The present authors postulate that when fibers are tested in wet conditions, the water between the filaments acts like a lubricant which counteracts any load sharing from weak or broken to stronger filaments. Conversely, there is more friction in dry fibers, thus promoting load-sharing mechanisms between filaments and, thus, greater fiber strength, which is similar to filaments embedded in a polymer matrix, but to a much lesser extent. An alternative postulate is that fiber degradation can be reversible upon drying to some extent. However, as shown later in this text, evidence for fiber damage was observed in microscopic analysis. Still, further research into degradation effects is warranted. The strength values dropped by 62% and 55% (tested wet) and 45% and 32% (tested dry) for fibers aged at 71 °C and 60 °C for 840 h (5 weeks), respectively. Similarly, when the drop in strength values was compared for fibers aged at 82 °C, 71 °C, and 60 °C for 168 h (1 week), the reductions were 49%, 41%, 33% (wet), and 32%, 23%, and 12% (dry), respectively. These data demonstrate the severity that a hydrothermal attack can have on GFs, as fibers suffered significant reductions in strength even after just 1 week of exposure to elevated temperatures. Presumably, strength reductions were chiefly caused by the attack of water on the Si-O-Si framework, which serves as the backbone for GFs and will be discussed in detail later in this paper.

3.2. Prediction of Long-Term Behavior and Service Life of Glass Fibers

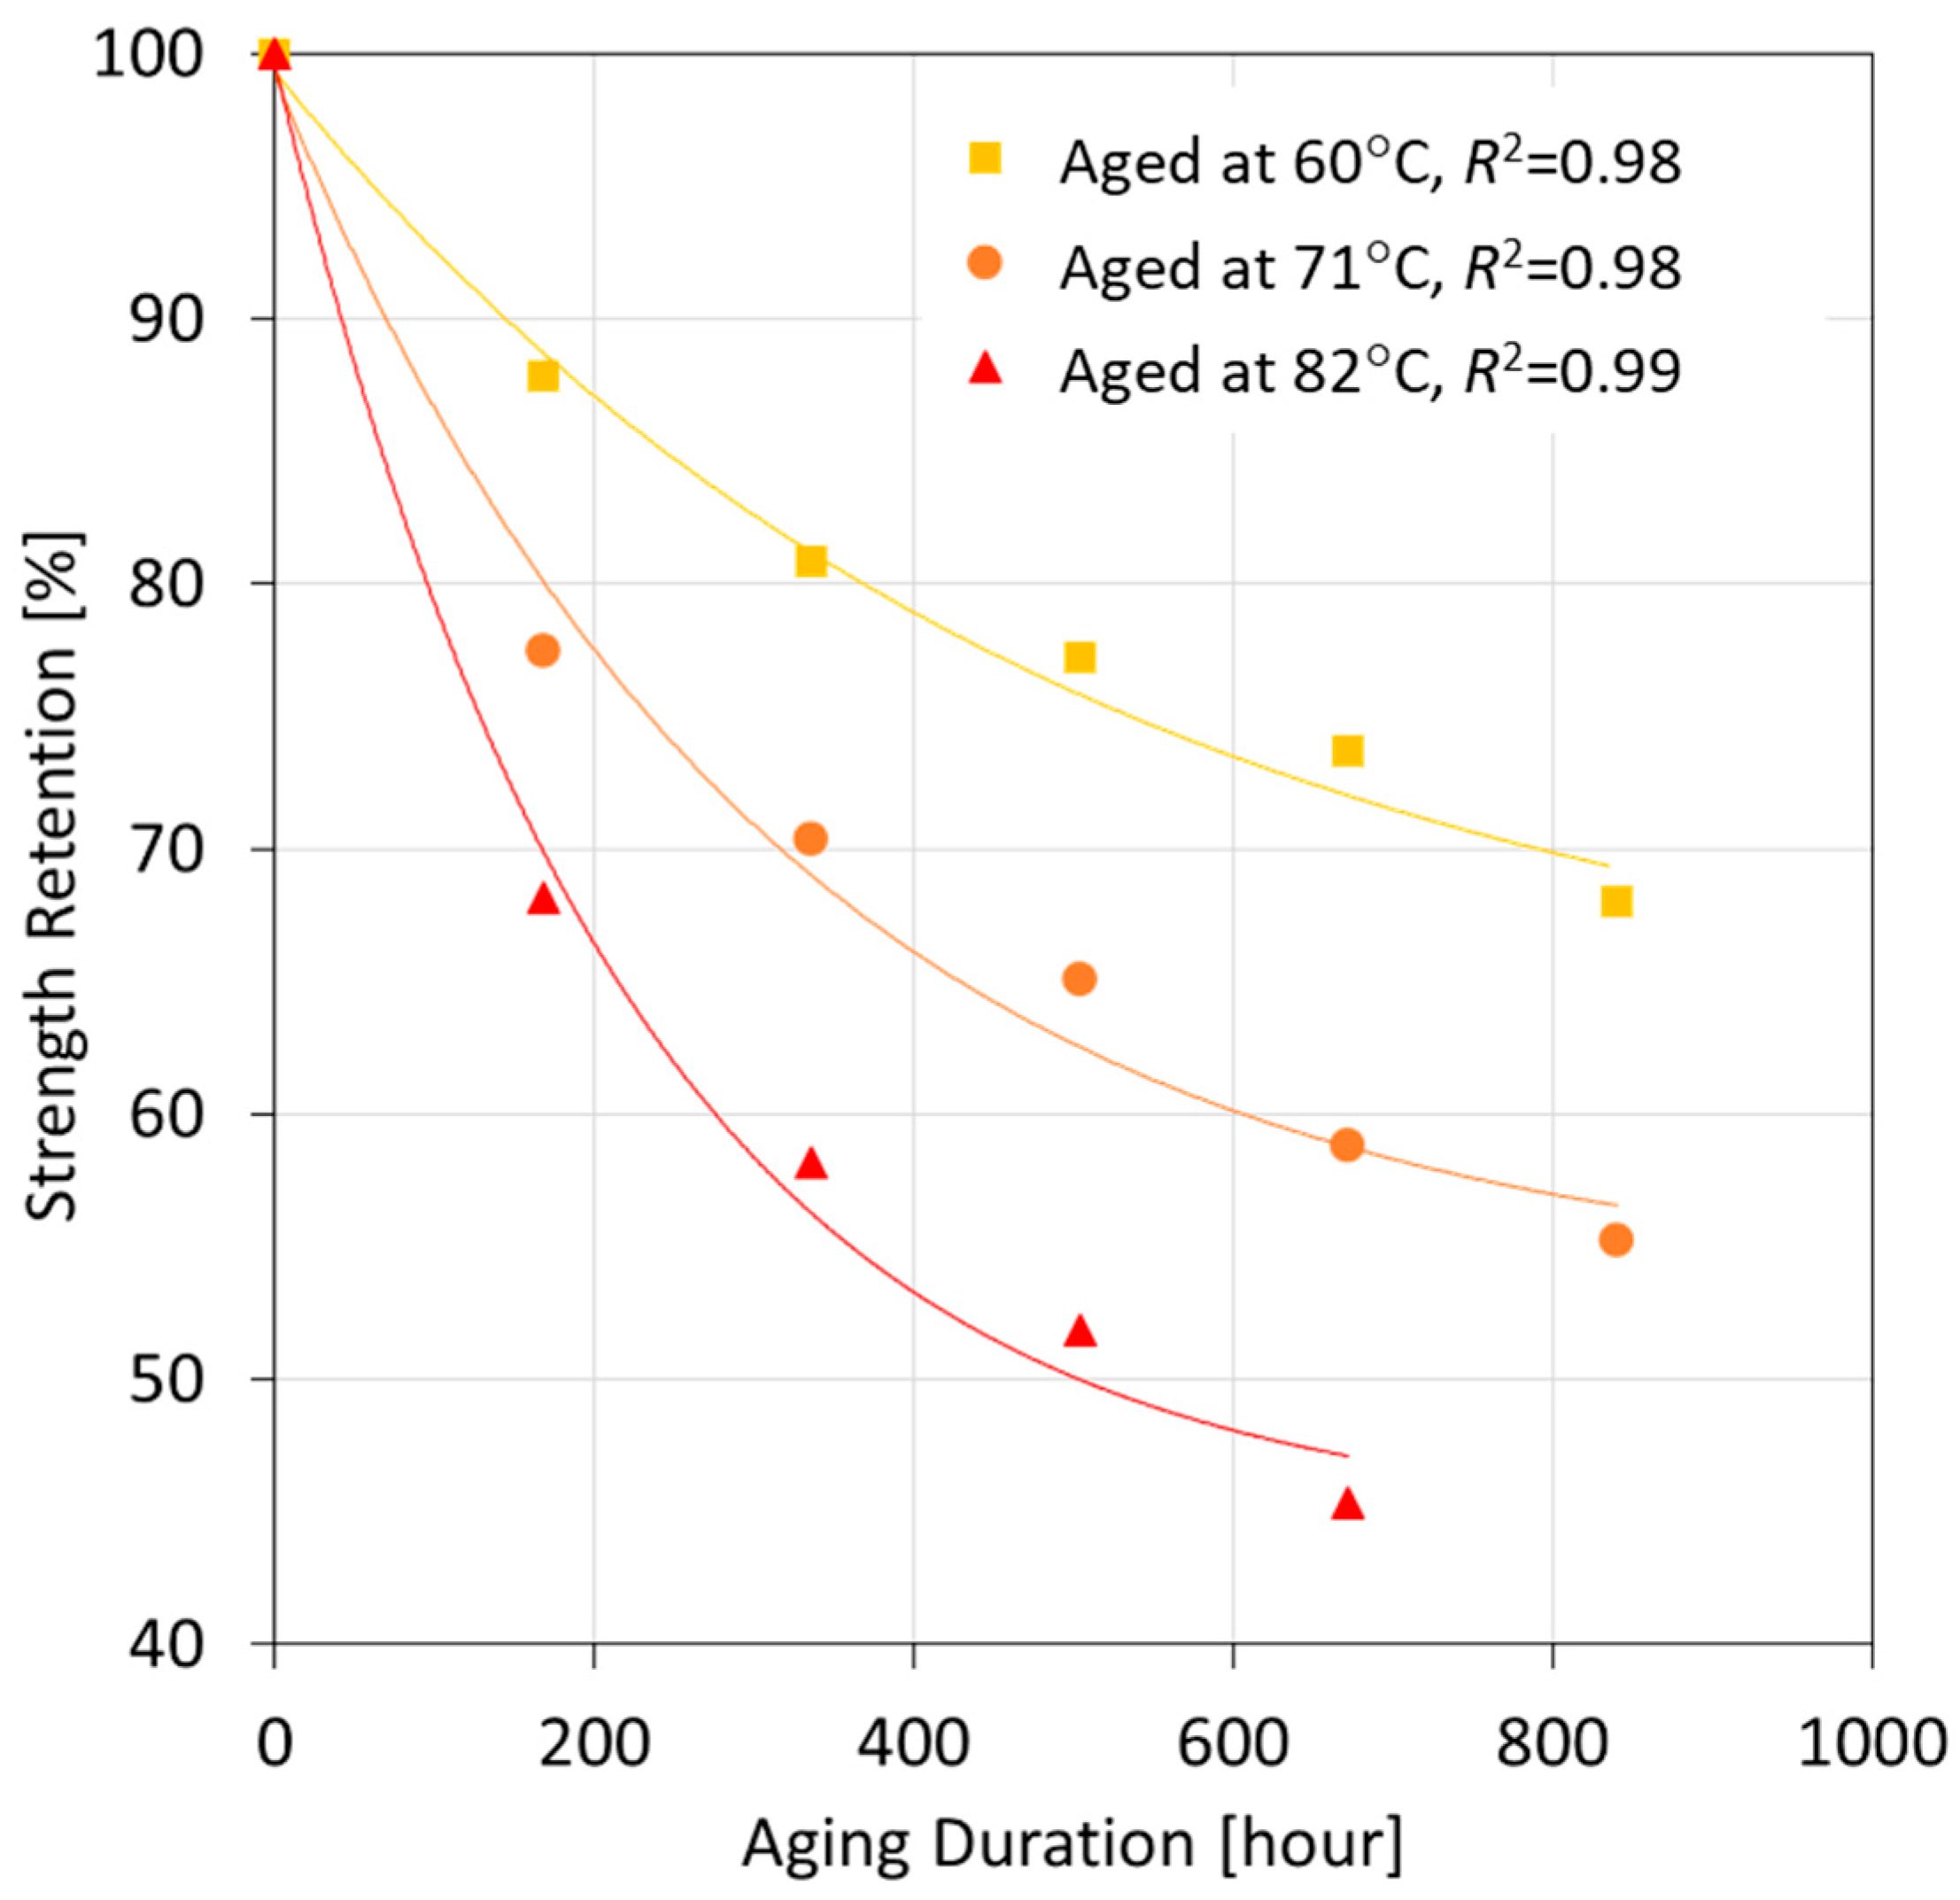
The basis of the herein adopted prediction methodology is the basic Arrhenius relation and the time–temperature superposition approach. Corresponding analysis steps and references were already given in Section 2. The data for fibers tested in a dry condition were used for the analysis. The Arrhenius method is sometimes also referred to as the predetermined life approach, where the first step involves the representation of the strength retention values by a fitted curve with a high R2 value (>0.8). Equation (3) describes the relation in this model between the performance retention, Y, and degradation time, t. This model is commonly used to represent the retention values at different temperatures for composite materials exposed to hydrothermal aging conditions [32]. While it is shown that this model yielded good agreement for the given test conditions, the authors do not claim the universal validity of this model for fiber aging predictions, and further research in this context is recommended.
Y = A 1 e x p t τ + Y 0
where Y represents the retention in mechanical properties, t is the exposure time, and τ, A1, and Y0 are regression fitting parameters. The values for the regression coefficients are given in Table 1, and the tensile strength retention is shown in Figure 5 as a function of time for the different temperatures. An E a / R ¯ value giving the best regression coefficient for all three retention levels was selected and applied accordingly. Notably, the different regression curves exhibited R2 values of at least 0.98, which corroborates with the Arrhenius approach and its presumption that the material exhibits the same degradation mechanism for the different aging temperatures.
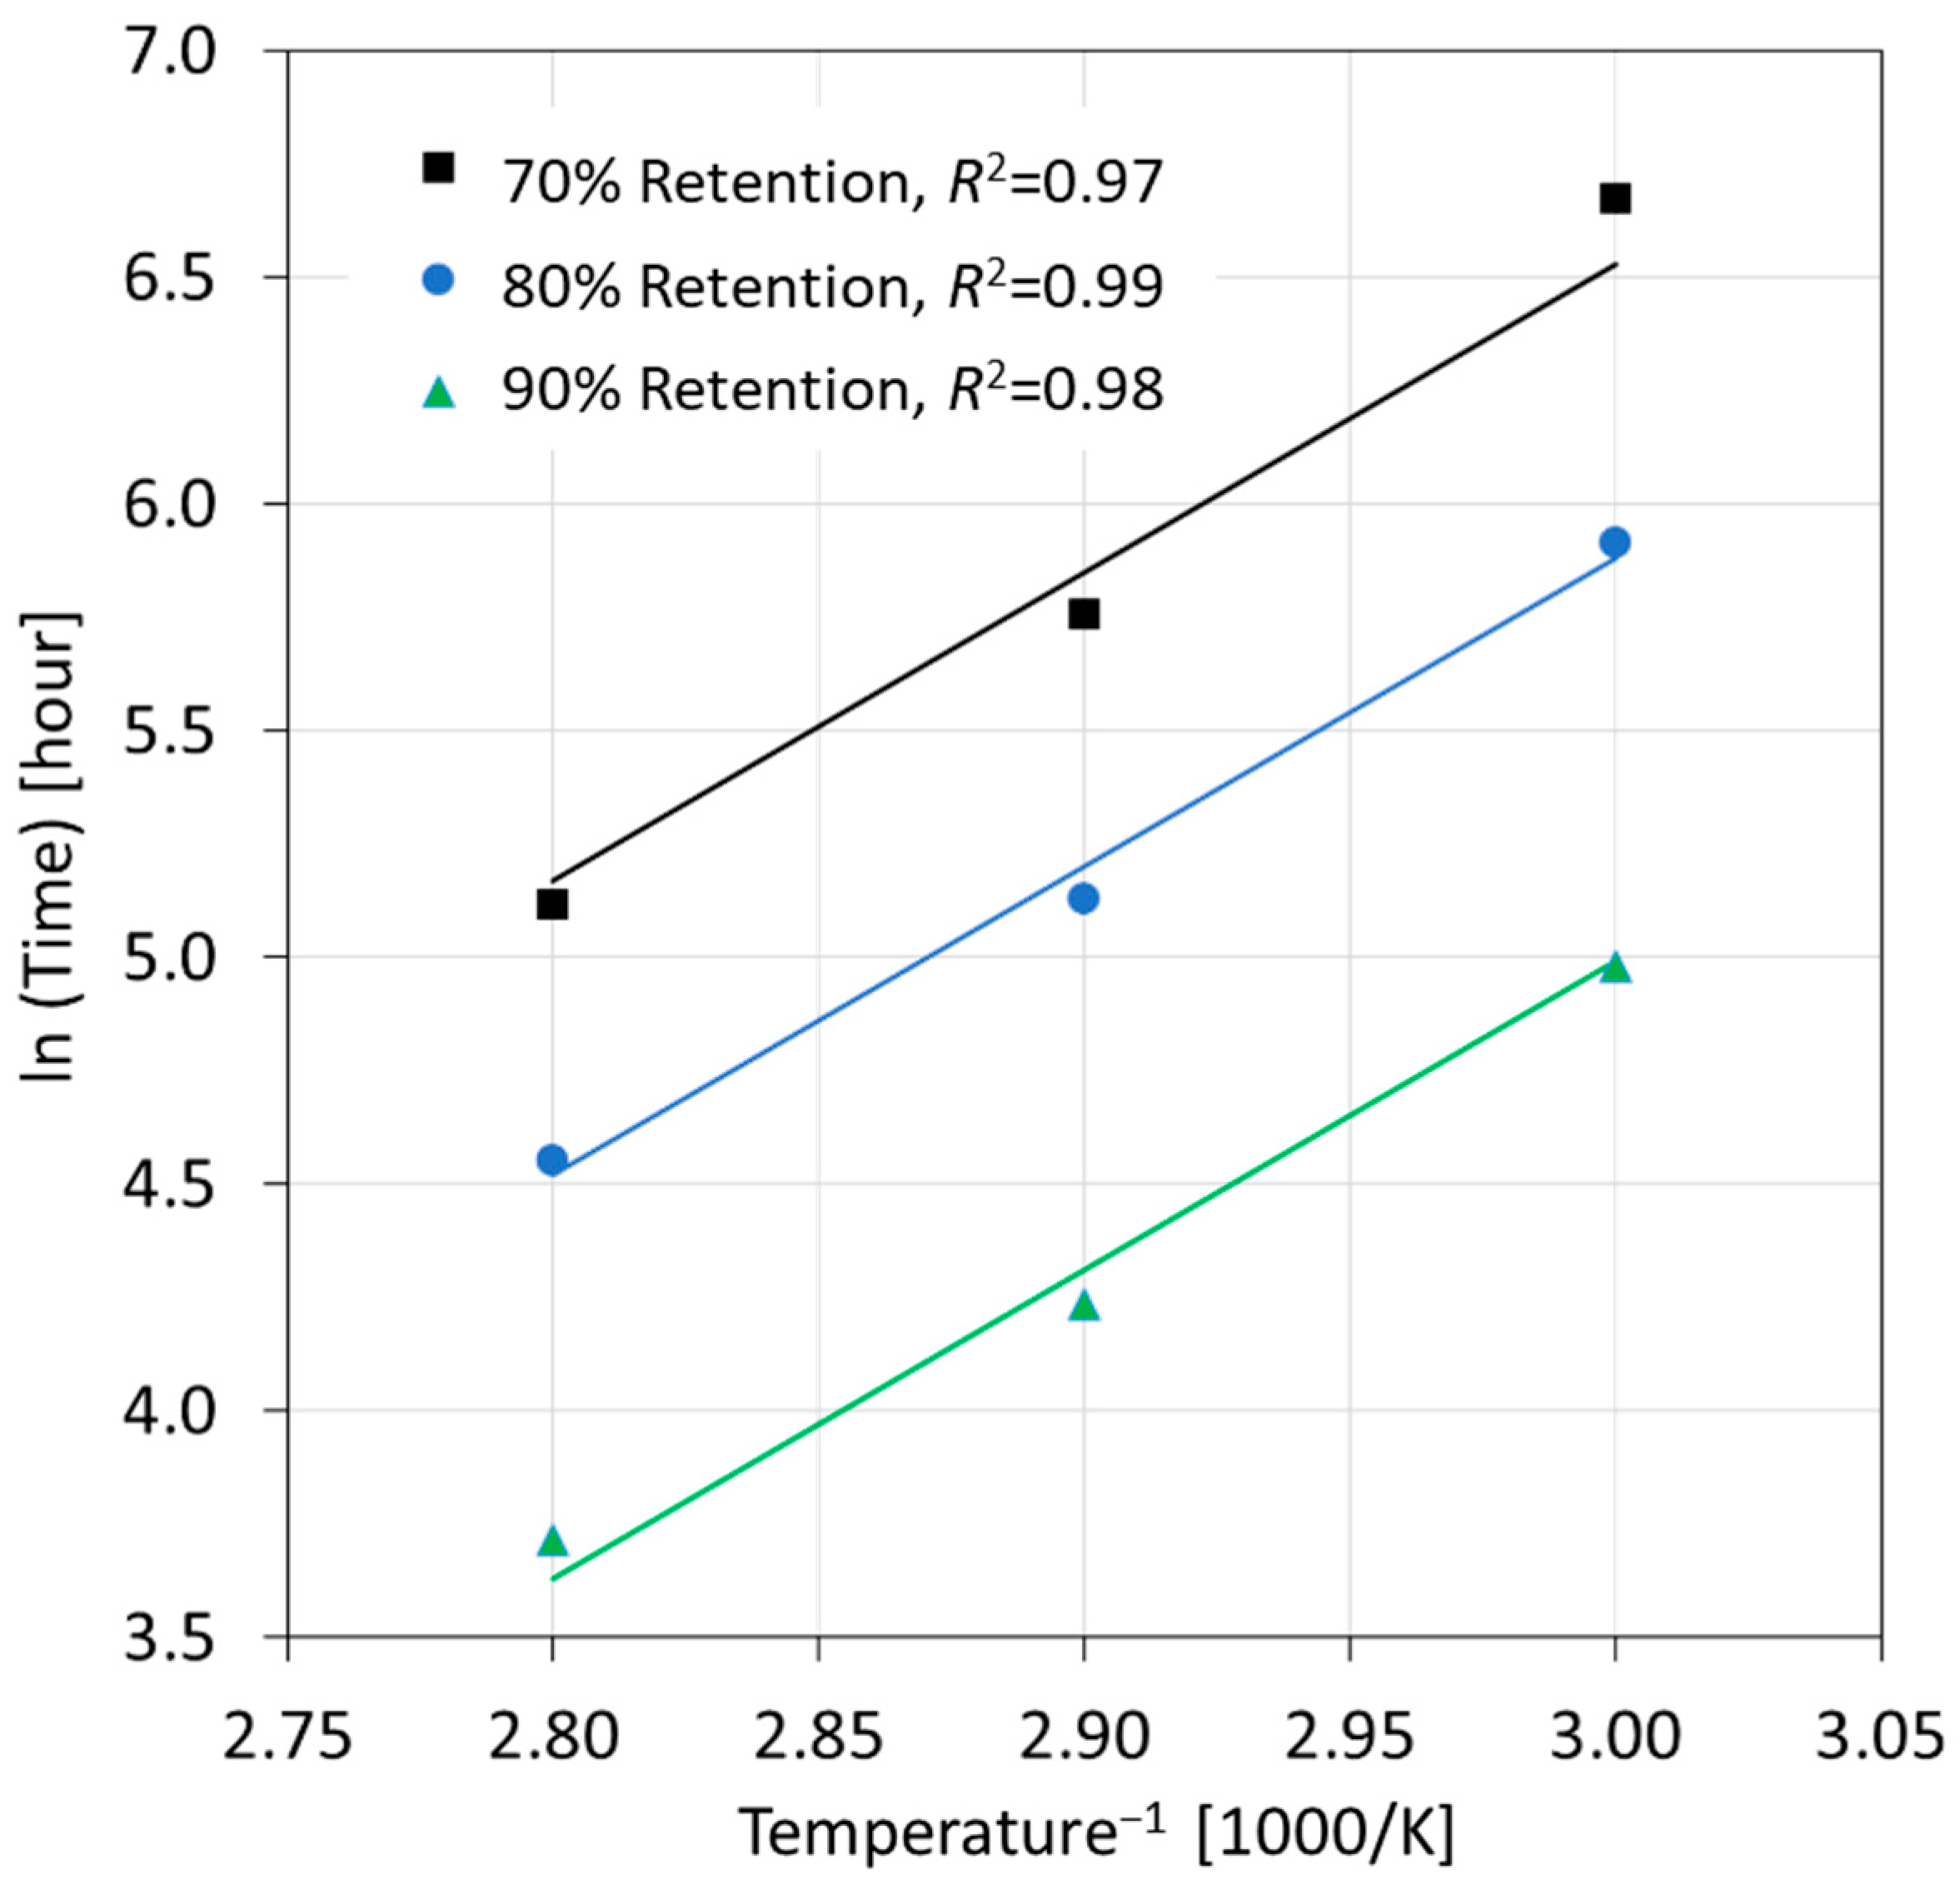
The next step in the analysis involved plotting the logarithm of time to reach the retention values versus 1000/T, where T is the temperature given in units of Kelvin. Strength retention levels of 70%, 80%, and 90% were selected for this study. In the technical literature, a retention value of 50% has been proposed for composite materials [30,31]. However, for both dry fibers and fibers inside a matrix, the present authors considered a loss in properties even by only 10 to 30% as significant; hence, this was justification for selecting the above-mentioned retention levels. The Arrhenius plots for different retention values are displayed in Figure 6. The fitted straight lines for the different retention levels are parallel and have R2 values very close to unity, proving the validity of the accelerated deterioration test and the applicability of this model to forecast the loss of GF tensile strength. The activation energy for E-glass was reported to be in the range of 55 to 79 KJ/mol in alkaline solutions [3,23]. In the present study, an activation energy of 56.6 kJ/mol was calculated from the slope of the plots (for convenience, E a / R ¯ data is given in Table 1), which is within the range found in the technical literature. As such, using the Arrhenius model to estimate the useful life of GFs under hydrothermal aging conditions proved effective. For example, if extrapolating the curves to room temperature (23 °C), the aging time to reach retention levels 70%, 80%, and 90% were predicted as 372 days, 193 days, and 79 days, respectively.
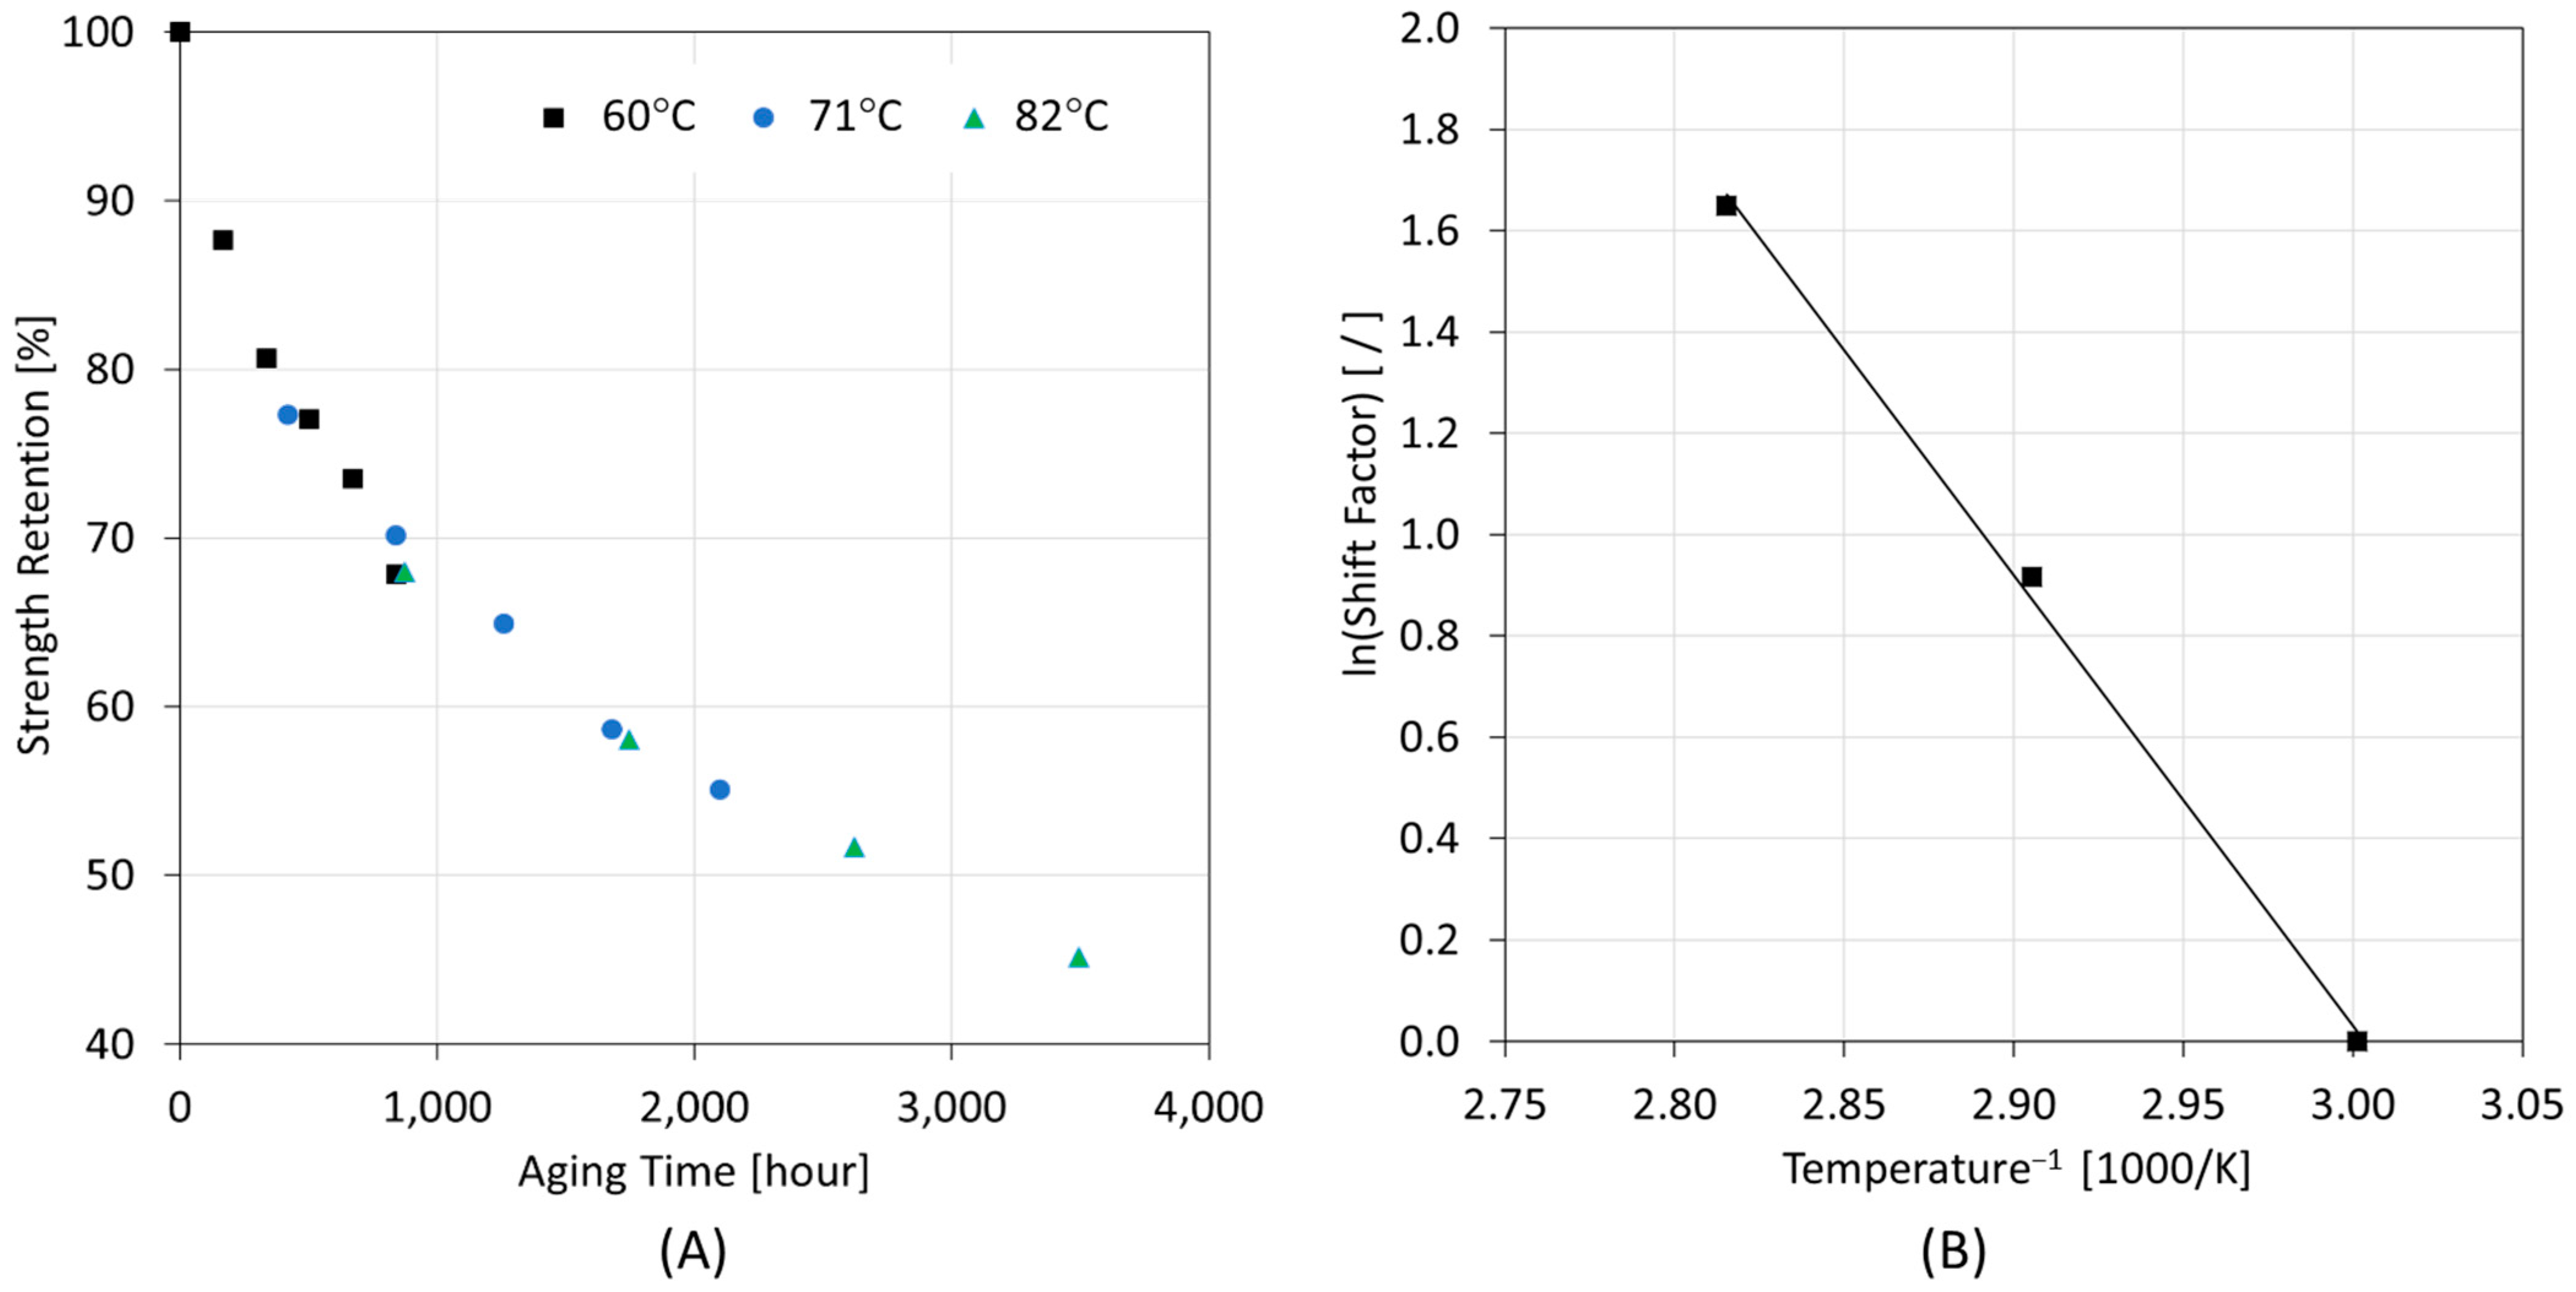
Referring to Equation (2), the shift factors were determined by inspection, adopting an approach similar to other work [33] and taking the reference temperature as 60 °C. Invoking the TTS principle in conjunction with Arrhenius’s theory, the effect of temperature on the tensile strength of GFs could be described. The exposure times were multiplied with their corresponding shift factors at each temperature and plotted, as shown in Figure 7A. Finally, a linear relationship was observed (with R2 = 0.99) when the logarithm of the shift factors was plotted against the inverse of the absolute temperature, as shown in Figure 7B. These findings indicate that, within the investigated temperature range, the Arrhenius model could adequately represent the effects that temperature has on hydrothermal aging and, thus, on the tensile strength of the studied GF material. This theory employed herein is therefore shown to be effective for predicting property loss at other aging temperatures of interest.

3.3. Elements Released during Degradation and Corresponding Chemical Reactions

The mass dissolution experiments on GFs aged at 60 °C and 82 °C for a duration of 168 h (1 week) indicated that the following elements were released, arranged in the order of the decreasing concentration in the solution: Si, Ca, Al, Na, Mg, K, S, Fe. Corresponding data are shown in Table 2. All detected elements were present in the chemical composition of GF, except for sulfur, whose origin was unclear. It was speculated that S originated from external contamination or was a residue from the GF fabrication process. An increasing trend in concentration with temperature was ascertained for all the elements except for Fe and K, which had approximately the same concentration values at 60 °C and 82 °C. Noticeably, the amount of Si released after aging the fibers for 168 h at 82 °C was almost 75% higher than that at 60 °C for the same duration. This detected release of elements was in agreement with previous studies [21,23,39]. Corresponding chemical reactions are depicted in Equations (4)–(10). These observations support the hypothesis that, due to hydrothermal aging, GFs incurred damage to the Si-O-Si framework, which caused the significant release of Si ions and other elements.
S i O S i + O H   S i O H + S i O  
S i O   + H 2 O   S i O H + O H
S i O K + H 2 O S i O H + O H + K +
S i O A l = + H 2 O S i O H + = A l O H
( S i O ) 2 M g + H 2 O 2 S i O H + 2 O H + M g 2 +
( S i O ) 2 C a + H 2 O 2 S i O H + 2 O H + C a 2 +
S i O N a + H 2 O     S i O H + O H + N a +

3.4. Results from FTIR Analysis

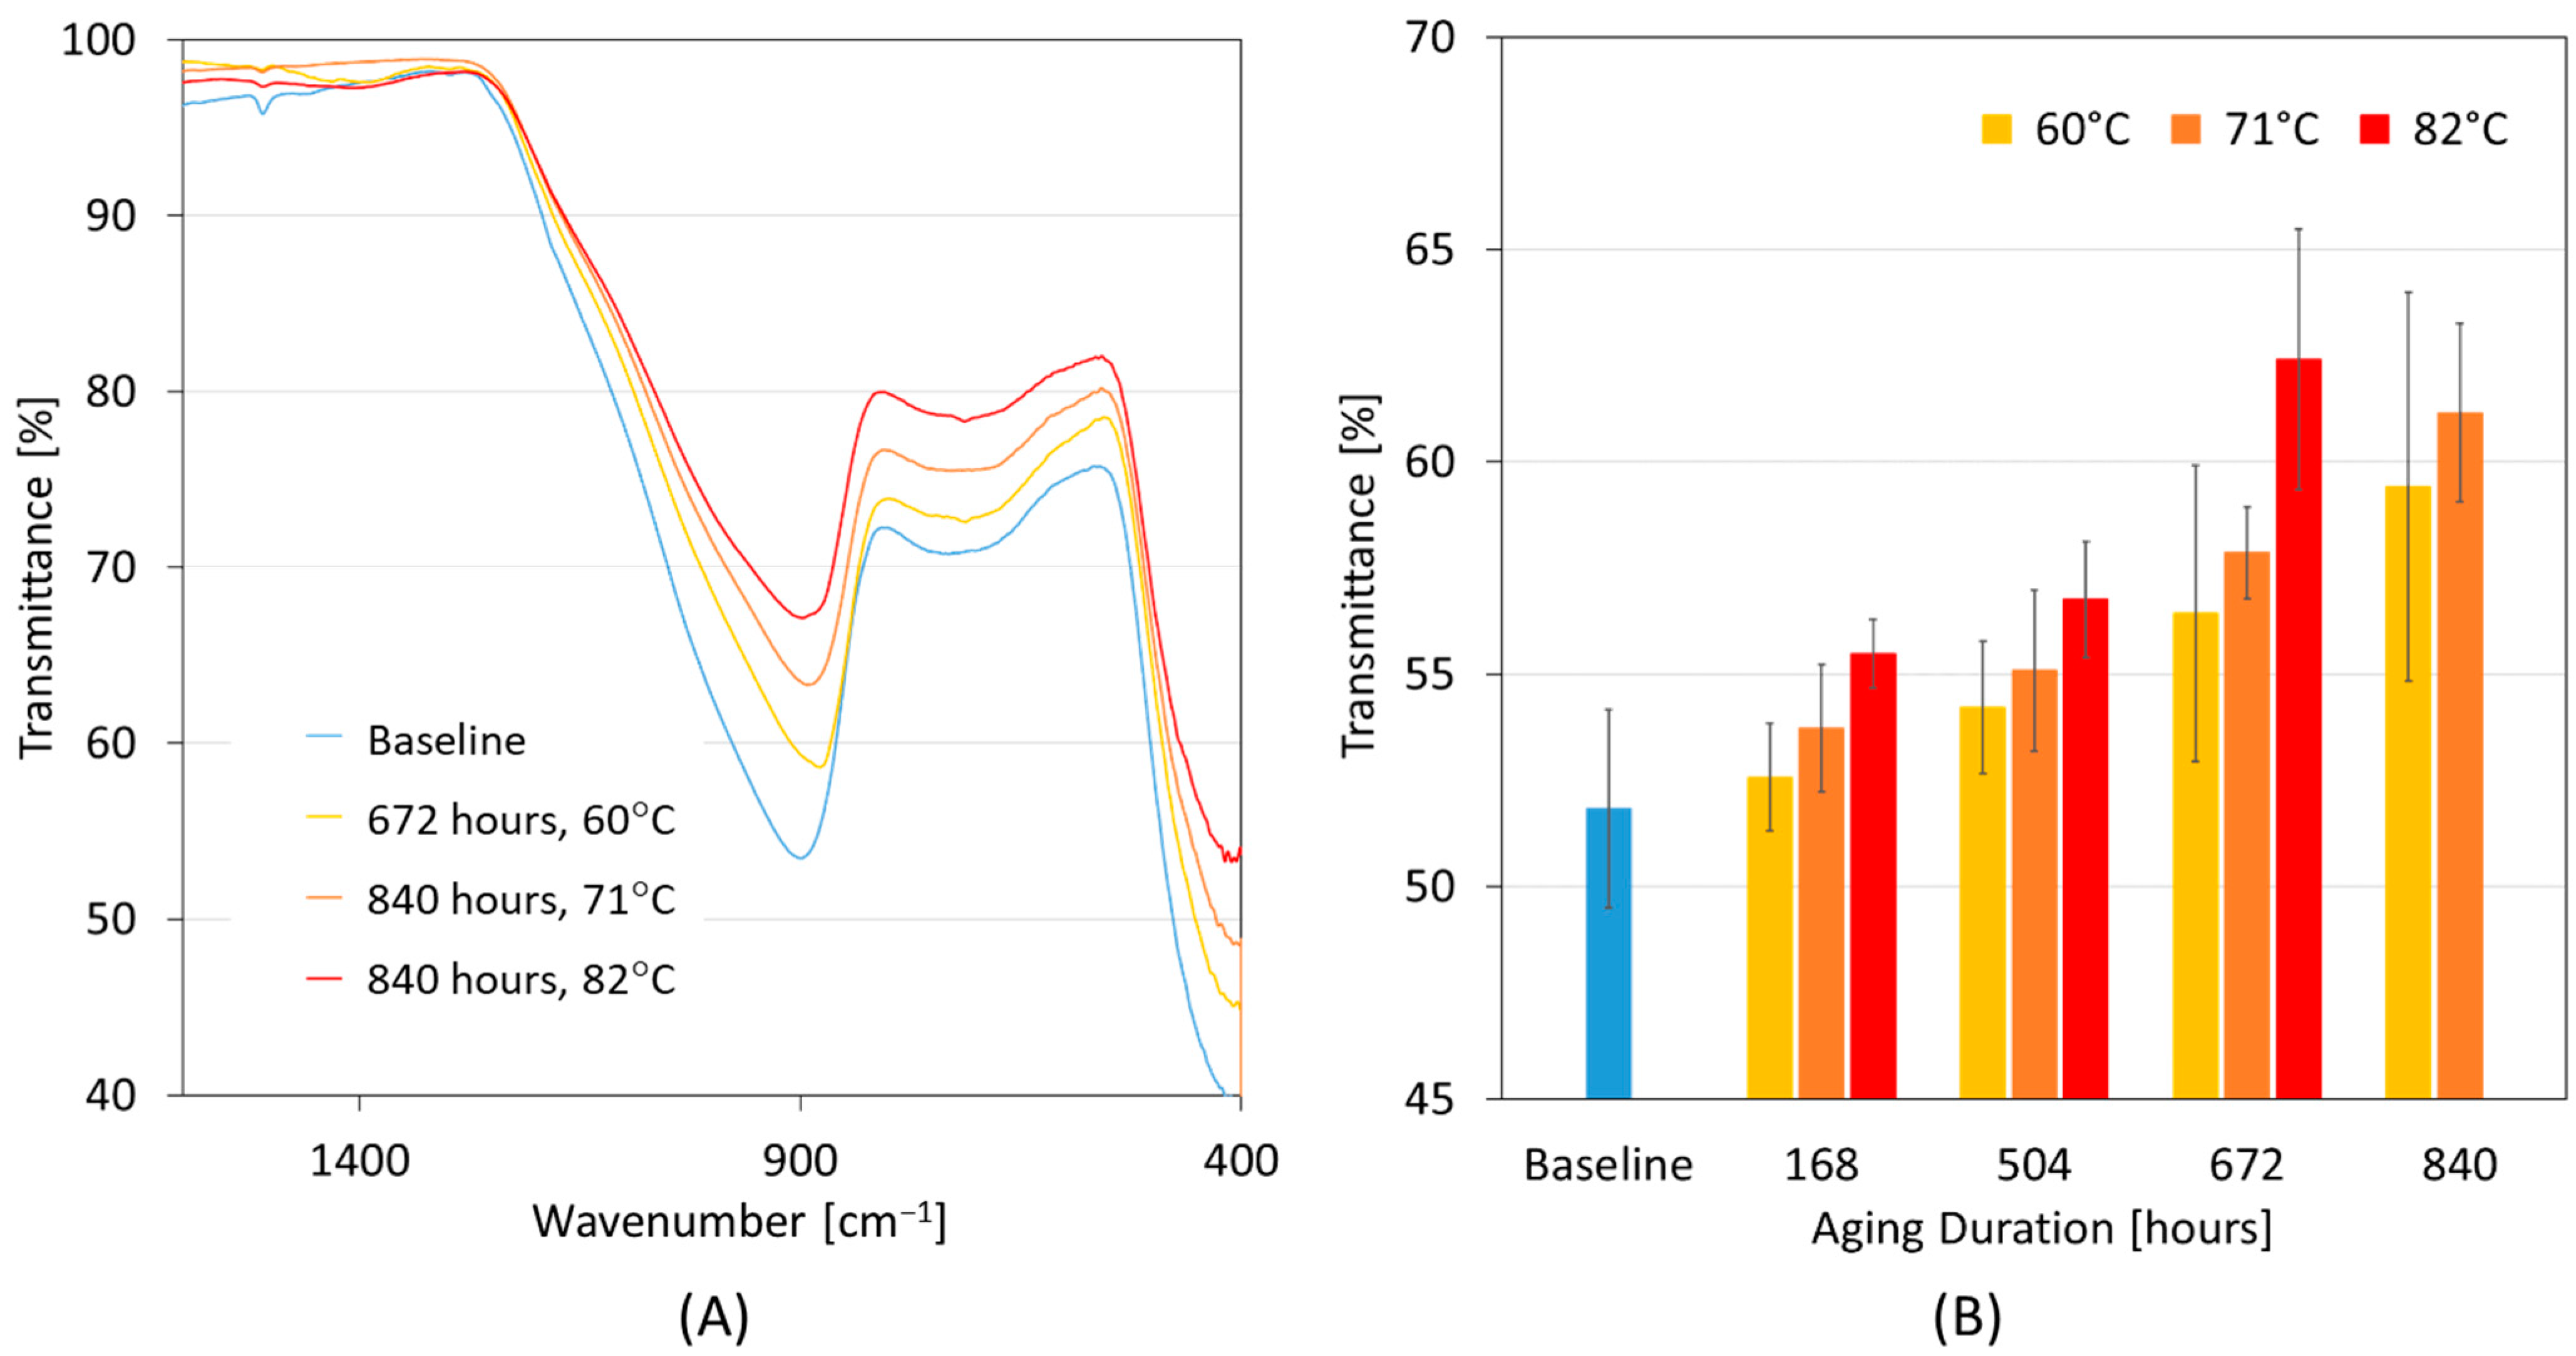
The transmittance spectrum obtained from the FTIR analysis is depicted in Figure 8A, where broad peaks at wavenumbers of around 685 cm−1 and 900 cm−1 could be attributed to Si-O bending and Si-O-Si stretching vibrations, respectively [40,41]. According to the Beer–Lambert law, peak intensity or peak height can be attributed to a species concentration within the specimen [42]. A chemical bond’s vibration is influenced by its surroundings. A sample can absorb radiations from a range of IR wavenumbers as if chemically exposed to more varied wavenumbers. Because of the extremely short-range order in glass, broad bands were seen instead of sharp peaks at 685 cm−1 and 900 cm−1 for the tested GFs. As seen from the spectrum, no new bands originated between wavenumbers from 400 cm−1 to 1800 cm−1. Instead, there was a decrease in the peak intensities of baseline peaks compared with aged samples. There was a sharp decrease in the intensity of peaks around 685 cm−1 and 900 cm−1, with the lowest intensity being for GF samples aged 672 h (4 weeks) at 82 °C, followed by samples aged 840 h (5 weeks) at 71 °C and 60 °C, respectively.
Figure 8B shows the variation in transmittance values corresponding to the Si-O-Si peaks occurring at around a wavenumber of 900 cm−1. There was a steady increase in the transmittance values as the temperature and aging duration increased, which implied a reduction in peak intensity and absorbance values. Samples aged for 672 h (4 weeks) at 82 °C had the highest increase in their transmittance values (20%), i.e., the highest peak intensity reduction. Similarly, samples aged for 840 h (5 weeks) at 71 °C and 60 °C showed an increase in their transmittance values of 18% and 14%, respectively, implicating a corresponding reduction in intensity values. Here, emphasis was given to the reduction across aging durations and within aging temperatures rather than pointing out the absolute values of variation, which might not be true in all cases. The observed intensity reductions confirmed the hydrothermal attack on the Si-O-Si framework, which forms the backbone of GFs, either weakening the bond or breaking the bonds leading to the release of ions by the reactions highlighted in the previous section. The FTIR analysis, therefore, provided further corroboration that rising tensile strength reductions in GFs caused by prolonged and more severe hydrothermal aging were the result of progressive damage to the Si-O-Si framework in the GFs.

3.5. Morphological Analysis

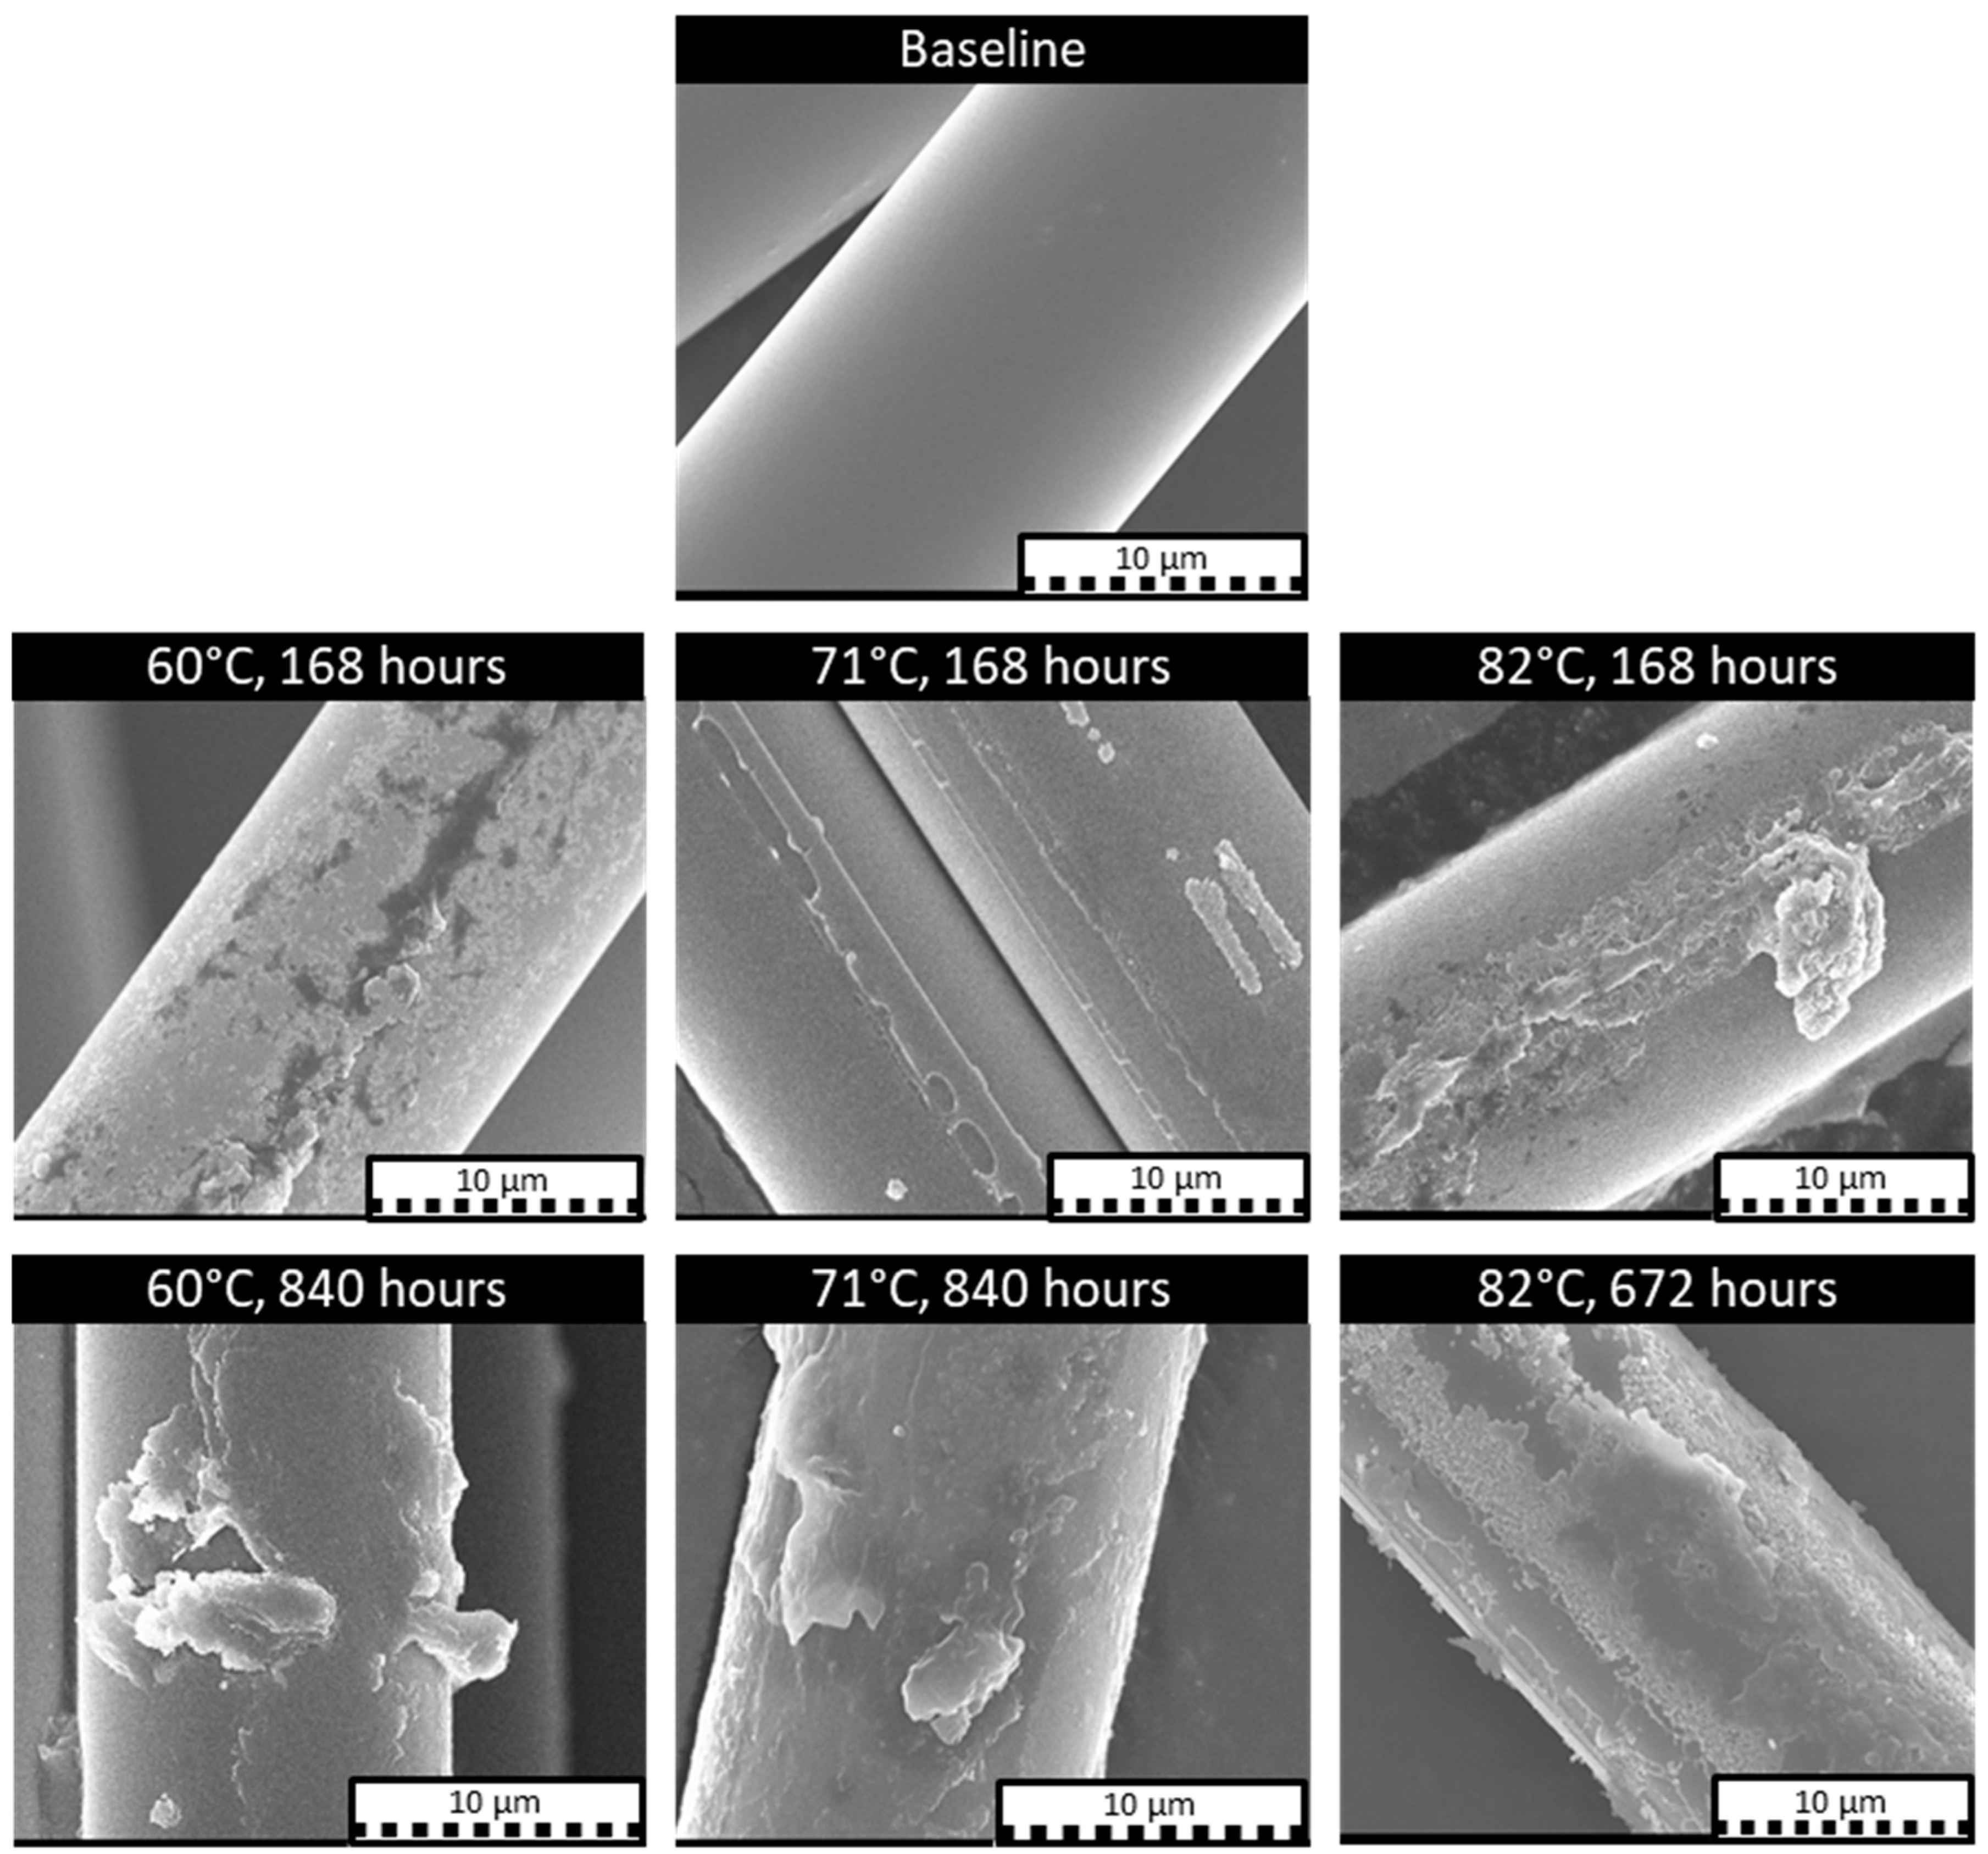
SEM images of glass fibers are shown in Figure 9, which shows the top row for the surface of a pristine fiber, in the middle row the surface of fibers aged at 60 °C, 71 °C and 82 °C for 168 h (1 week), and in the bottom row the surfaces of samples aged for 840 h (5 weeks) at 60 °C and 71 °C (left) and 672 h (4 weeks) at 82 °C (right). Notably, fibers aged for 4 weeks at 82 °C exhibited significant surface deterioration compared with the pristine fibers, which had a smooth surface without noticeable imperfections. For fibers subjected to aging, in addition to surface roughening, certain deposits could be observed on the fiber surface. Presumably, these deposits originated from fiber sizing when broken down in the tap water or from chemical reactions leading to mass loss, as discussed in Section 3.3, and as released elements may have formed a new chemical compound on the fiber surface. The effect of hydrothermal aging was less severe for fibers aged for 1 week at 60 °C, 71 °C, and 82 °C when compared to the fiber aged for longer durations at similar temperatures. Additionally, the level of degradation was seen to increase with aging temperatures. The SEM images in Figure 9 provide an insight into the damage progression, starting on the fiber surface and progressing deeper into the material with aging duration. Notably, some patches of the fiber material appeared to have flaked off. Similarities could be ascertained when comparing present SEM images with those reported in the technical literature for GFs exposed to an alkaline solution [25]. Recalling the pronounced loss in mechanical properties after aging at 82 °C compared to fibers aged at 71 °C and 60 °C, it stands to reason that chemical degradation was more aggressive at 82 °C and affected a greater portion of the GF material. The SEM images of aged fiber revealed structural damage occurring to the fiber surface, resulting not only in material degradation but also stress risers and friction points, with the latter two further contributing to premature filament failures under tensile loading.

4. Conclusions

The mechanical testing of E-glass fiber samples was performed to study the effects of hydrothermal aging at three elevated temperatures. Fiber samples were tested either after drying or in a wet state. After aging in tap water, the fiber materials generally exhibited a loss in breaking strength, with fibers tested in wet conditions showing the most significant decline in strength. The residual tensile strength declined as immersion time and aging temperature increased, yet the rate of decline slowed down with time. Results from mass dissolution and FTIR measurements indicated that hydrothermal exposure caused an attack on the Si-O-Si framework in the E-glass material, coupled with the loss of sizing, caused substantial reductions in tensile strength. This conclusion was further supported by the SEM imaging, which showed significant damage occurring to the fiber surface and a loss of material.
An analytical model based on the Arrhenius theory was adopted to predict the tensile strength retention of E-glass fibers upon aging. The Arrhenius model was validated using experimental data, proving its broad applicability. The activation energy calculated using the Arrhenius model was 56.6 KJ, which agrees with values found in the technical literature. Based on the developed model, the time to reach retention levels of 70%, 80%, and 90% at room temperature (23 °C) were calculated as 372 days, 193 days, and 79 days, respectively. A master curve was created using a time–temperature superposition approach for a reference temperature of 60 °C. The modeling approach proved to be consistent with experimental data and yielded reasonable results. Still, additional research should be completed to explore the model’s validity over extended periods of time and gain greater confidence in the model parameters.
Although only E-glass was the focus of the present testing campaign and modeling effort, the general strategy was thought to hold for all types of glass fibers and possibly similar materials like basalt fibers. These findings offer novel insights regarding the significant decline in the mechanical performance of E-glass fibers when subjected to a combination of water and temperature. Upon completing additional studies into the aging of technical fibers, the created tools could form a tool to forecast and track the long-term performance of fibers in engineering applications. Additionally, it is of interest to explore whether findings from this study could form the foundation for a multiscale approach when predicting the performance of fiber-reinforced polymer matrix composites, which may involve examining the performance of fibers, the matrix, and their interface conditions independently and then extrapolating attributes of the composite material from the constituents’ behavior.

Author Contributions

Conceptualization, J.S., J.P.M. and H.N.; methodology, software, validation, J.S., H.N. and J.P.M.; formal analysis, investigation, data curation, J.S.; resources, H.N. and P.M.; writing—original draft preparation, J.S., J.P.M. and H.N.; writing—review and editing, J.S., J.P.M., H.N. and P.M.; visualization, J.S. and P.M.; supervision, J.P.M., H.N. and P.M.; project administration, H.N. and P.M.; funding acquisition, P.M. All authors have read and agreed to the published version of the manuscript.

Funding

This research and the APC was jointly funded by Shawcor Ltd. and the Natural Sciences and Engineering Research Council of Canada through an Alliance Grant with grant number ALLRP 568487-21.

Data Availability Statement

Data supporting the findings of this study are available within the article and upon request from the corresponding author.

Acknowledgments

The authors would like to thank Mitul Patel for his assistance in performing mechanical testing. Additionally, the authors would like to acknowledge the services provided by the NanoFAB facility at the University of Alberta for conducting the FTIR and SEM tests.

Conflicts of Interest

The authors declare no conflict of interest.

References

  1. Krauklis, A.E.; Gagani, A.I.; Echtermeyer, A.T.J.C. Long-term hydrolytic degradation of the sizing-rich composite interphase. Coatings 2019, 9, 263. [Google Scholar] [CrossRef] [Green Version]
  2. Thomason, J.L. Glass fibre sizing: A review. Compos. Part A Appl. Sci. 2019, 127, 105619. [Google Scholar] [CrossRef]
  3. Krauklis, A.E.; Gagani, A.I.; Vegere, K.; Kalnina, I.; Klavins, M.; Echtermeyer, A.T. Dissolution kinetics of R-glass fibres: Influence of water acidity, temperature, and stress corrosion. Fibers 2019, 7, 22. [Google Scholar] [CrossRef] [Green Version]
  4. Mahltig, B.; Kyosev, Y. Inorganic and Composite Fibers: Production, Properties, and Applications; Woodhead Publishing: Duxford, UK, 2018; ISBN 978-0-08-102229-0. [Google Scholar]
  5. Feih, S.; Wei, J.; Kingshott, P.; Sørensen, B.F. The influence of fibre sizing on the strength and fracture toughness of glass fibre composites. Compos. Part A Appl. Sci. 2005, 36, 245–255. [Google Scholar] [CrossRef]
  6. Ishak, Z.M.; Arifin, A.; Senawi, R. Effects of hygrothermal aging and a silane coupling agent on the tensile properties of injection molded short glass fiber reinforced poly (butylene terephthalate) composites. Eur. Polym. J. 2001, 37, 1635–1647. [Google Scholar] [CrossRef]
  7. Davalos, J.F.; Chen, Y.; Ray, I. Long-term durability prediction models for GFRP bars in concrete environment. J. Compos. Mater. 2012, 46, 1899–1914. [Google Scholar] [CrossRef]
  8. Silva, M.A.; da Fonseca, B.S.; Biscaia, H. On estimates of durability of FRP based on accelerated tests. Compos. Struct. 2014, 116, 377–387. [Google Scholar] [CrossRef]
  9. Idrisi, A.H.; Mourad, A.-H.I.; Abdel-Magid, B.M.; Shivamurty, B. Investigation on the durability of E-Glass/Epoxy composite exposed to seawater at elevated temperature. Polymers 2021, 13, 2182. [Google Scholar] [CrossRef] [PubMed]
  10. Guermazi, N.; Tarjem, A.B.; Ksouri, I.; Ayedi, H.F. On the durability of FRP composites for aircraft structures in hygrothermal conditioning. Compos. Part B Eng. 2016, 85, 294–304. [Google Scholar] [CrossRef]
  11. Bobbaa, S.; Lemana, Z.; Zainudina, E.; Sapuana, S. The influence of hydrothermal aging on E-glass and S-glass fiber/epoxyreinforced composite pipes. J. Mater. Environ. Sci. 2019, 10, 790–804. [Google Scholar]
  12. Echtermeyer, A.T.; Krauklis, A.E.; Gagani, A.I.; Sæter, E. Zero stress aging of glass and carbon fibers in water and oil—Strength reduction explained by dissolution kinetics. Fibers 2019, 7, 107. [Google Scholar] [CrossRef] [Green Version]
  13. Borges, C.S.; Akhavan-Safar, A.; Marques, E.A.; Carbas, R.J.; Ueffing, C.; Weißgraeber, P.; da Silva, L.F. Effect of water ingress on the mechanical and chemical properties of polybutylene terephthalate reinforced with glass fibers. Materials 2021, 14, 1261. [Google Scholar] [CrossRef]
  14. Shao, Y.; Kouadio, S. Durability of Fiberglass Composite Sheet Piles in Water. J. Compos. Constr. 2022, 6, 280–287. [Google Scholar] [CrossRef] [Green Version]
  15. Grammatikos, S.A.; Evernden, M.; Mitchels, J.; Zafari, B.; Mottram, J.T.; Papanicolaou, G.C. On the response to hygrothermal aging of pultruded FRPs used in the civil engineering sector. Mater. Des. 2016, 96, 283–295. [Google Scholar] [CrossRef] [Green Version]
  16. Ghabezi, P.; Harrison, N.M. Hygrothermal deterioration in carbon/epoxy and glass/epoxy composite laminates aged in marine-based environment (degradation mechanism, mechanical and physicochemical properties). J. Mater. Sci. 2022, 57, 4239–4254. [Google Scholar] [CrossRef]
  17. Guo, R.; Xian, G.; Li, F.; Li, C.; Hong, B. Hygrothermal resistance of pultruded carbon, glass and carbon/glass hybrid fiber reinforced epoxy composites. Constr. Build. Mater. 2022, 315, 125710. [Google Scholar] [CrossRef]
  18. Messana, A.; Airale, A.G.; Ferraris, A.; Sisca, L.; Carello, M. Correlation between thermo-mechanical properties and chemical composition of aged thermoplastic and thermosetting fiber reinforced plastic materials. Materwiss. Werksttech. 2017, 48, 447–455. [Google Scholar] [CrossRef]
  19. Fang, M.; Zhang, N.; Huang, M.; Lu, B.; Lamnawar, K.; Liu, C.; Shen, C. Effects of hydrothermal aging of carbon fiber reinforced polycarbonate composites on mechanical performance and sand erosion resistance. Polymers 2020, 12, 2453. [Google Scholar] [CrossRef]
  20. Dong, S.; Zhou, P.; Guo, R.; Li, C.; Xian, G. Durability study of glass fiber reinforced polypropylene sheet under simulated seawater sea sand concrete environment. J. Mater. Res. Technol. 2022, 20, 1079–1092. [Google Scholar] [CrossRef]
  21. Krauklis, A.E.; Echtermeyer, A.T. Long-term dissolution of glass fibers in water described by dissolving cylinder zero-order kinetic model: Mass loss and radius reduction. Open Chem. 2018, 16, 1189–1199. [Google Scholar] [CrossRef]
  22. Bashir, S.; Yang, L.; Liggat, J.; Thomason, J. Kinetics of dissolution of glass fibre in hot alkaline solution. J. Mater. Sci. 2018, 53, 1710–1722. [Google Scholar] [CrossRef] [Green Version]
  23. Mišíková, L.; Liška, M.; Galuskova, D. Corrosion of E-glass fibers in distilled water. Ceram. Silik. 2007, 51, 131–135. [Google Scholar]
  24. Jones, R.; Stewart, J. The kinetics of corrosion of e-glass fibres in sulphuric acid. J. Non-Cryst. Solids 2010, 356, 2433–2436. [Google Scholar] [CrossRef]
  25. Wei, B.; Cao, H.; Song, S. Tensile behavior contrast of basalt and glass fibers after chemical treatment. Mater. Des. 2010, 31, 4244–4250. [Google Scholar] [CrossRef]
  26. Feih, S.; Manatpon, K.; Mathys, Z.; Gibson, A.; Mouritz, A. Strength degradation of glass fibers at high temperatures. J. Mater. Sci. 2009, 44, 392–400. [Google Scholar] [CrossRef]
  27. Shawcor Composite Linepipe. Available online: https://www.shawcor.com/composite-systems/composite-linepipe (accessed on 22 January 2022).
  28. Starkova, O.; Gagani, A.I.; Karl, C.W.; Rocha, I.B.; Burlakovs, J.; Krauklis, A.E. Modelling of environmental ageing of polymers and polymer composites—Durability prediction methods. Polymers 2022, 14, 907. [Google Scholar] [CrossRef]
  29. Zhou, J.; Chen, X.; Chen, S. Durability and service life prediction of GFRP bars embedded in concrete under acid environment. Nucl. Eng. Des. 2011, 241, 4095–4102. [Google Scholar] [CrossRef]
  30. ISO 11346; Rubber, Vulcanized or Thermoplastic—Estimation of Lifetime and Maximum Temperature of Use. International Organization for Standardization: Geneva, Switzerland, 2014.
  31. Bank, L.C.; Gentry, T.R.; Thompson, B.P.; Russell, J.S. Model specification for composites for civil engineering structures. Transp. Res. Rec. 2002, 1814, 227–236. [Google Scholar] [CrossRef]
  32. Zhu, J.; Deng, Y.; Chen, P.; Wang, G.; Min, H.; Fang, W. Prediction of long-term tensile properties of glass fiber reinforced composites under acid-base and salt environments. Polymers 2022, 14, 3031. [Google Scholar] [CrossRef]
  33. Hoque, M.S.; Saha, A.; Chung, H.J.; Dolez, P.I. Hydrothermal aging of fire-protective fabrics. J. Appl. Polym. Sci. 2022, 139, e52666. [Google Scholar] [CrossRef]
  34. Jushi Fiberglass Products for Pipes. Available online: https://www.jushi.com/en/product/product-introduction-151.html (accessed on 22 January 2022).
  35. ASTM D2256M-10; Standard Test Method for Tensile Properties of Yarns by the Single-Strand Method. ASTM International: West Conshohocken, PA, USA, 2015.
  36. ASTM D2343-17; Standard Test Method for Tensile Properties of Glass Fiber Strands, Yarns, and Rovings Used in Reinforced Plastics. ASTM International: West Conshohocken, PA, USA, 2009.
  37. Weibull, W. A statistical distribution function of wide applicability. J. Appl. Mech. 1951, 18, 293–297. [Google Scholar] [CrossRef]
  38. Lara-Curzio, E. Oxidation induced stress-rupture of fiber bundles. J. Eng. Mater. Technol. 1998, 120, 105–109. [Google Scholar] [CrossRef] [Green Version]
  39. Grambow, B.; Müller, R. First-order dissolution rate law and the role of surface layers in glass performance assessment. J. Nucl. Mater. 2001, 298, 112–124. [Google Scholar] [CrossRef]
  40. Rani, M.; Choudhary, P.; Krishnan, V.; Zafar, S. Development of sustainable microwave-based approach to recover glass fibers for wind turbine blades composite waste. Resour. Conserv. Recycl. 2022, 179, 106107. [Google Scholar] [CrossRef]
  41. Ahmadi, A.; Ramezanzadeh, B.; Mahdavian, M. Hybrid silane coating reinforced with silanized graphene oxide nanosheets with improved corrosion protective performance. RSC Adv. 2016, 6, 54102–54112. [Google Scholar] [CrossRef]
  42. Abidi, N. Introduction to FTIR Microspectroscopy. In FTIR Microspectroscopy; Springer: Cham, Switzerland, 2021; pp. 1–8. ISBN 978-3-030-84424-0. [Google Scholar]
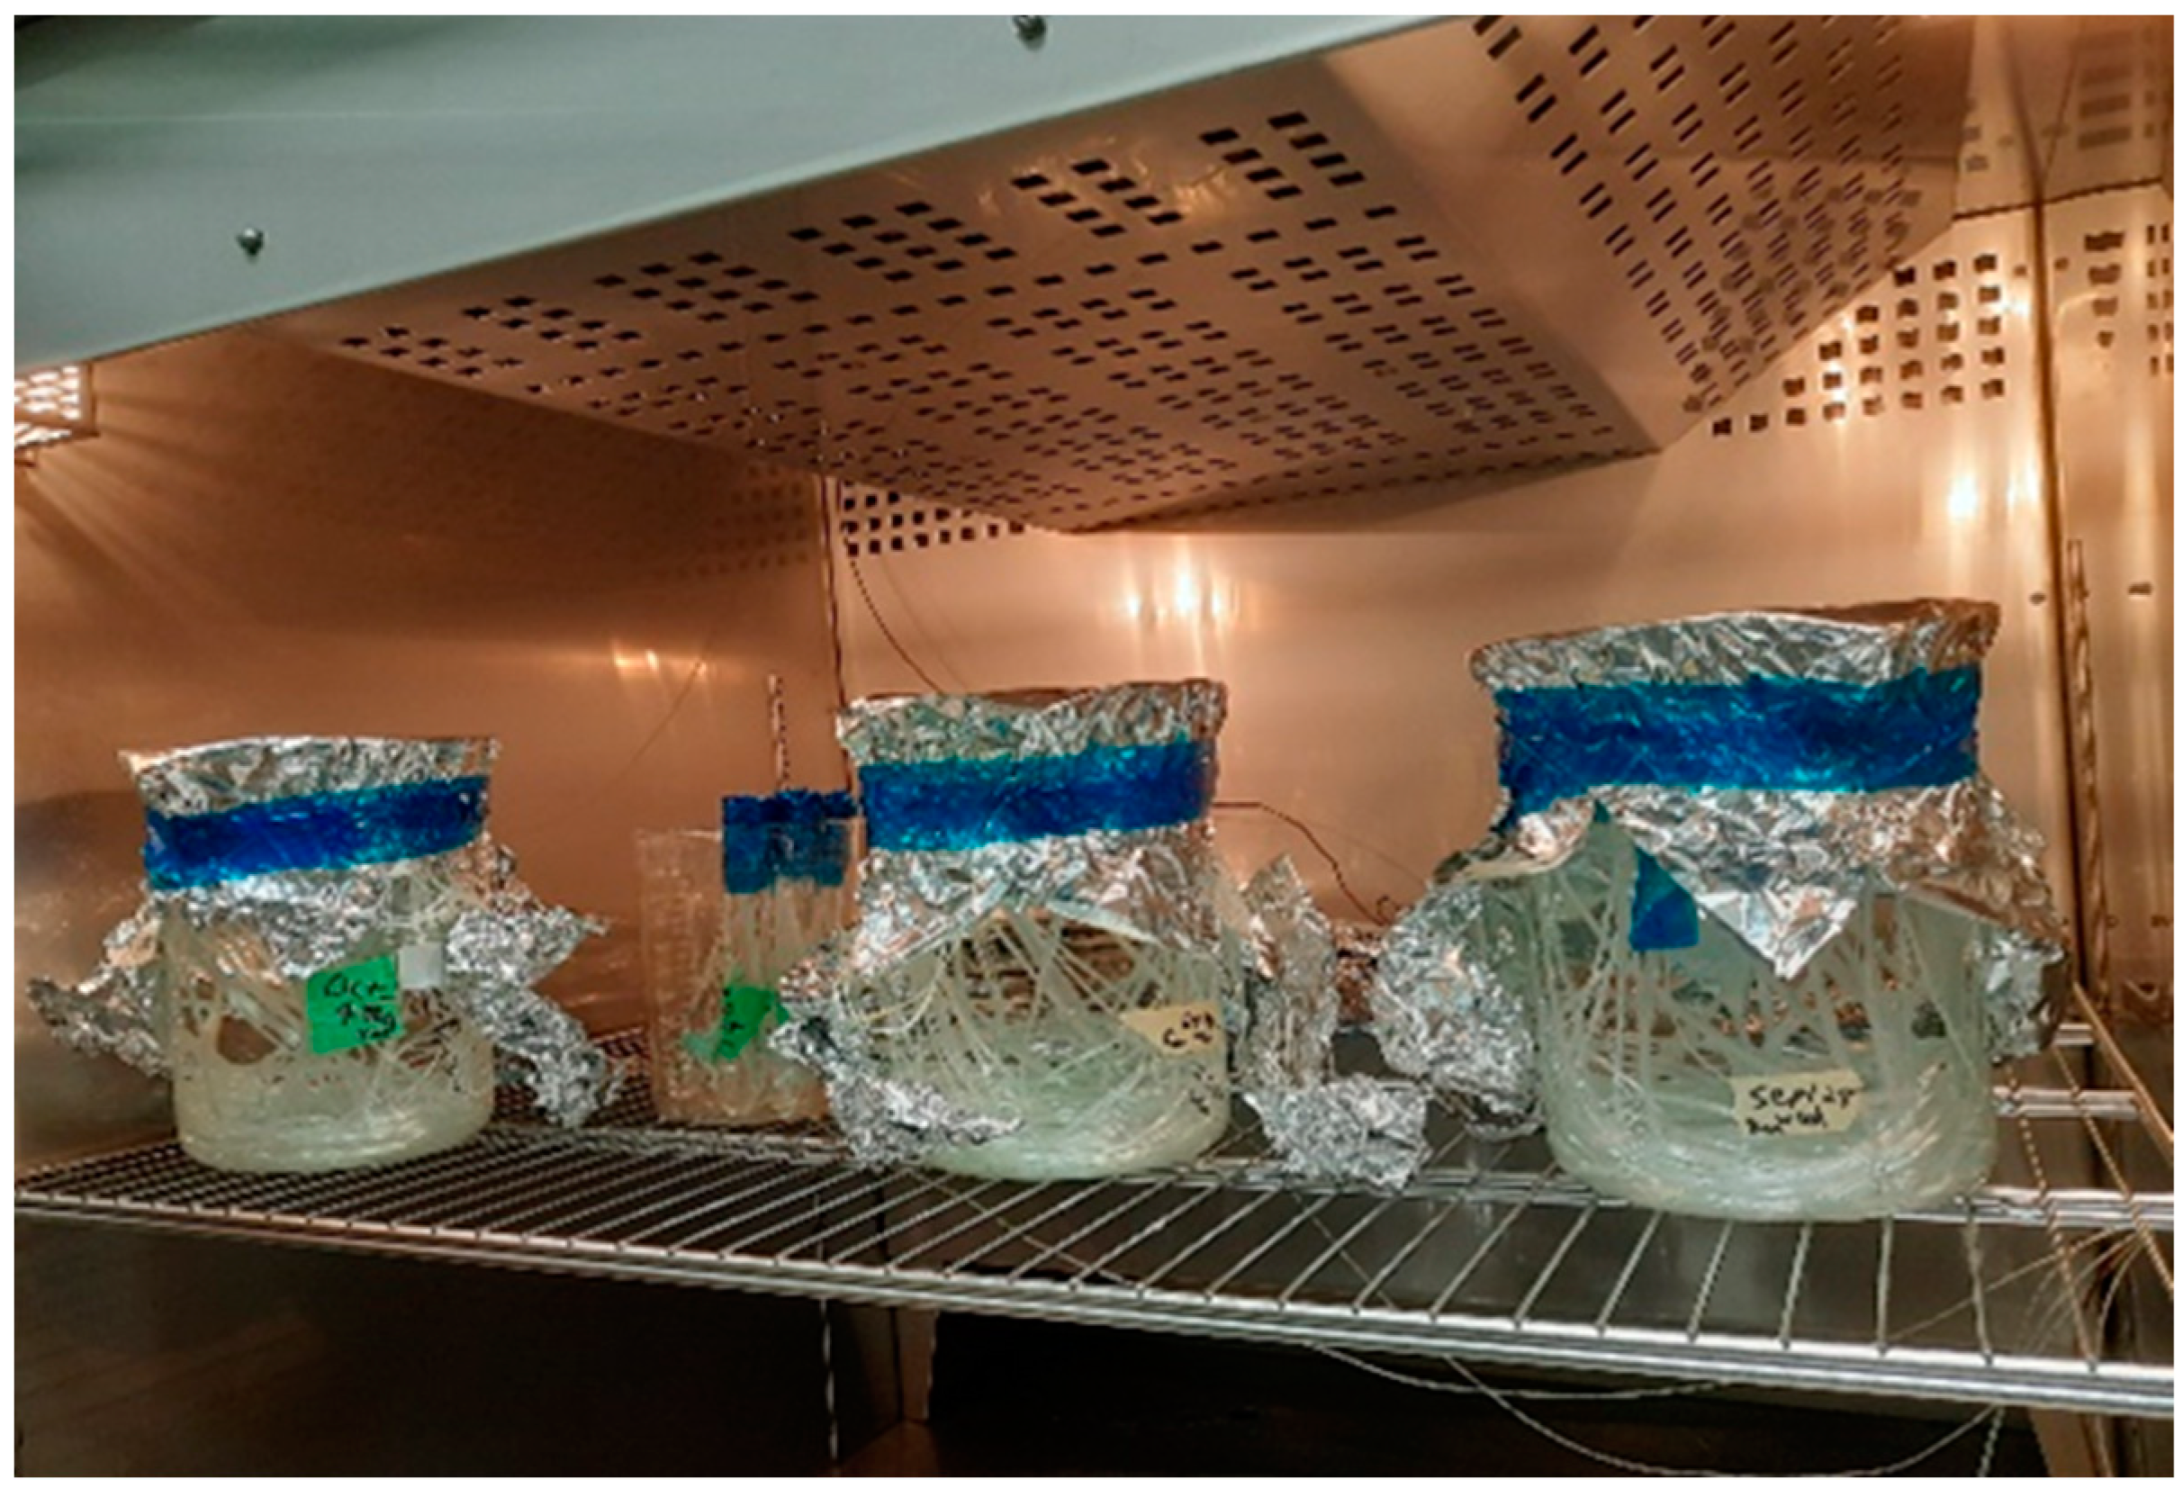
Figure 1. Aging of fiber samples inside oven.
Fibers 11 00070 g001
Figure 2. Mechanical testing of glass fibers using Capstan grips: (A) Before testing and (B) Post failure.
Fibers 11 00070 g002
Figure 3. Load versus displacement plot from tensile test of a GF sample.
Fibers 11 00070 g003
Figure 4. Strength retentions after exposure at 60 °C, 71 °C, and 82 °C: (A) Samples tested ‘wet’, and (B) Samples tested ‘dry’.
Fibers 11 00070 g004
Figure 5. Tensile strength retention versus aging duration for fibers tested dry. Solid lines are fitted curves according to Equation (3) and regression coefficients in Table 1.
Fibers 11 00070 g005
Figure 6. Arrhenius plots of calculated hydrothermal lives for different strength retention levels.
Fibers 11 00070 g006
Figure 7. (A) TTS master curve at 60 °C for glass fibers; (B) Arrhenius plot of shift factors.
Fibers 11 00070 g007
Figure 8. (A) FTIR spectrum for pristine and aged glass fibers, and (B) Intensity variations of Si-O-Si peaks at wavenumber 900 cm−1.
Fibers 11 00070 g008
Figure 9. SEM images showing glass fiber surfaces before and after aging. Baseline of pristine fiber (top row); aged at 60 °C, 71 °C and 82 °C for 1 week (middle row); and for 5 weeks at 60 °C and 71 °C and 4 weeks at 82 °C (bottom row).
Fibers 11 00070 g009
Table 1. Regression coefficients according to Equation (3) for fitted curves in Figure 5 based on test data from fibers tested ‘dry’, and E a / R ¯ values relating to the Arrhenius plot slopes in Figure 6.
Aging Temperature [°C]A1 [N]τ [Hour]Y0 [N] E a / R ¯
6036.81493.8062.616802.0
7145.65311.5253.486802.0
8254.93216.1044.666802.0
Table 2. Mass of elements released from glass fiber samples aged in water at 60 °C and 82 °C for 168 h (1 week).
ElementSiCaAlNaMgKSFe
Concentration at 60 °C [mg/L]9.436.5071.9380.2840.2190.140.0560.002
Concentration at 82 °C [mg/L]16.5519.0563.1280.420.3410.1330.0780.002
Disclaimer/Publisher’s Note: The statements, opinions and data contained in all publications are solely those of the individual author(s) and contributor(s) and not of MDPI and/or the editor(s). MDPI and/or the editor(s) disclaim responsibility for any injury to people or property resulting from any ideas, methods, instructions or products referred to in the content.