
Influence of Fiber Dimensions on Bridging Performance of Polyvinyl Alcohol Fiber-Reinforced Cementitious Composite (PVA-FRCC)

 , ,
, ,  ,
,
Abstract
1. Introduction
2. Experimental Program
2.1. Used Materials
2.2. Bending Test of Notched Specimens
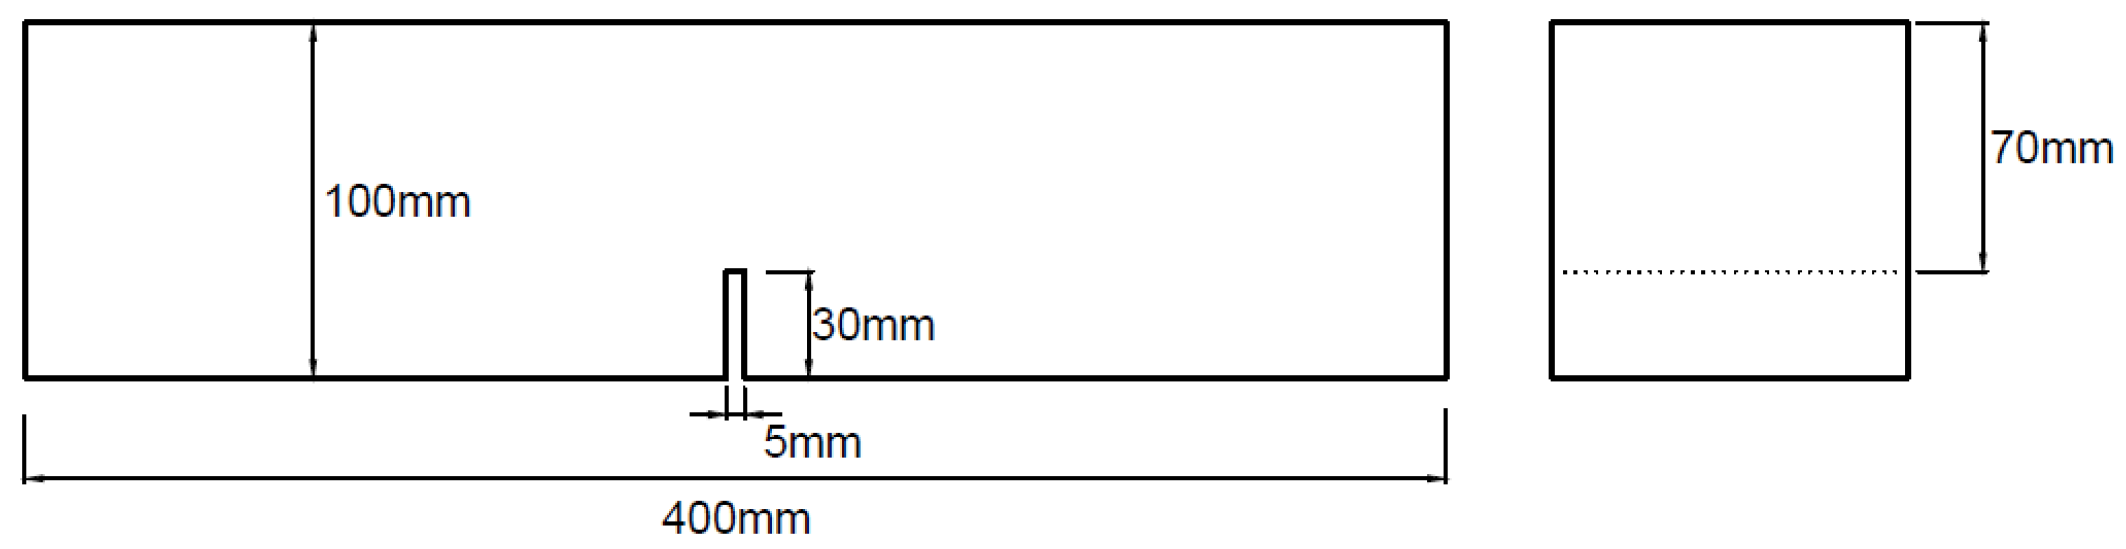
2.2.1. Specimens
2.2.2. Loading and Measurements
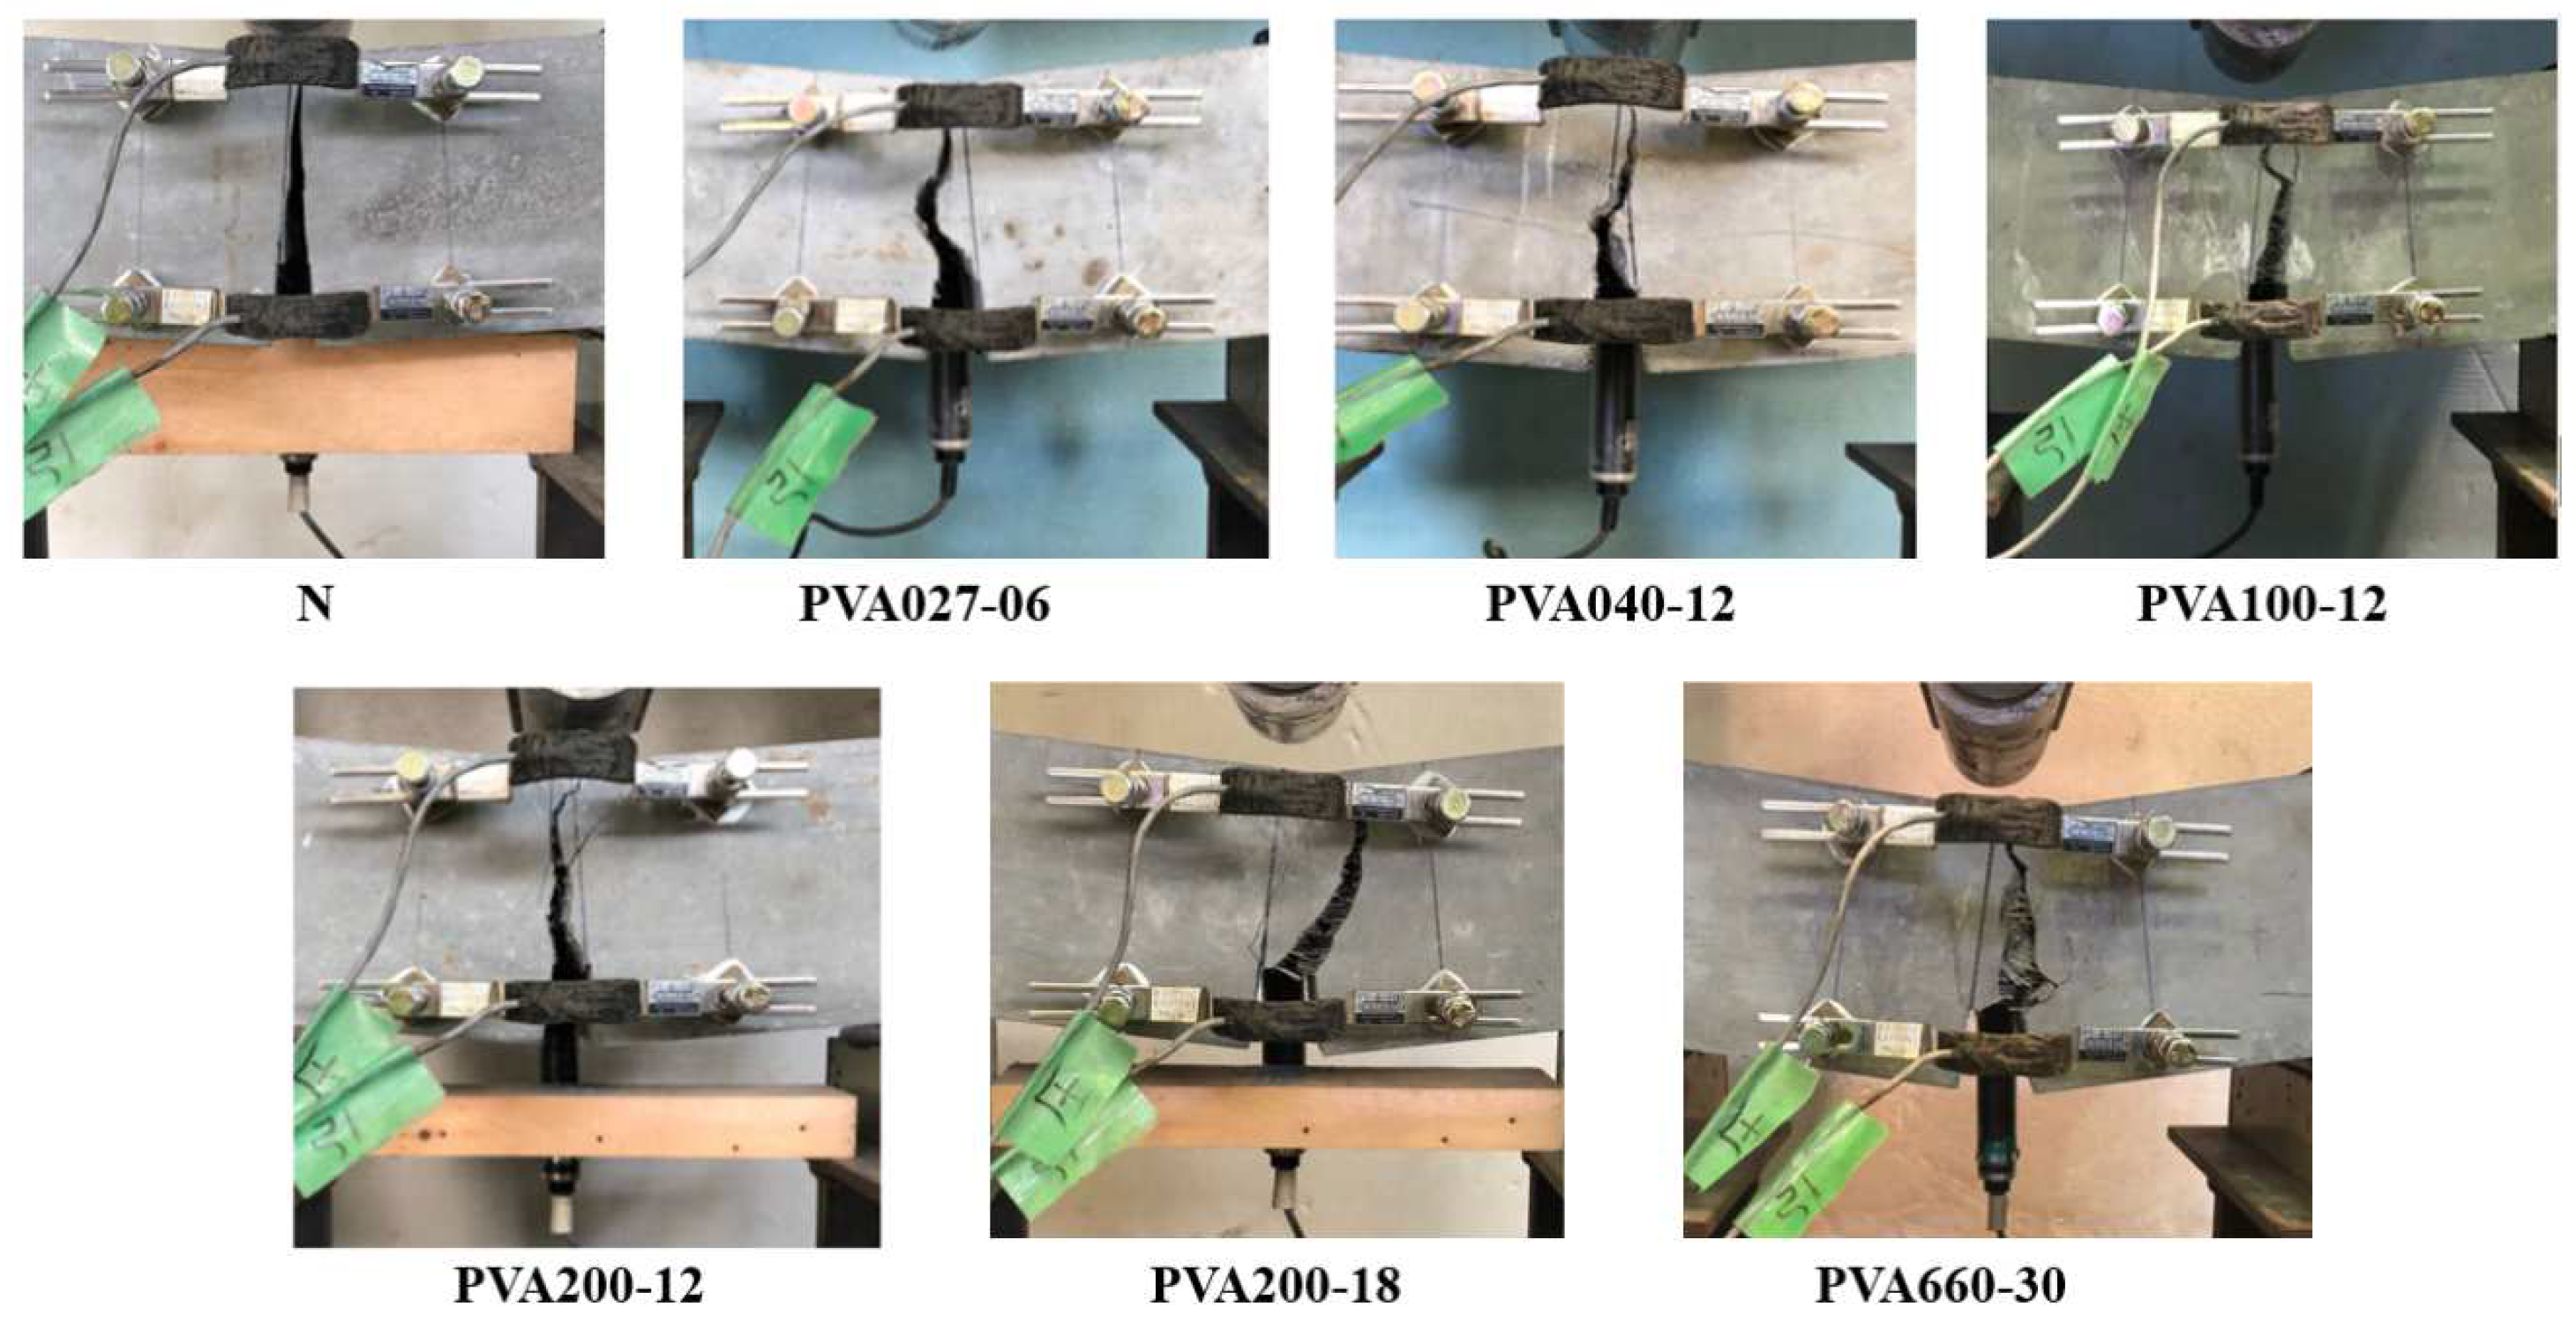
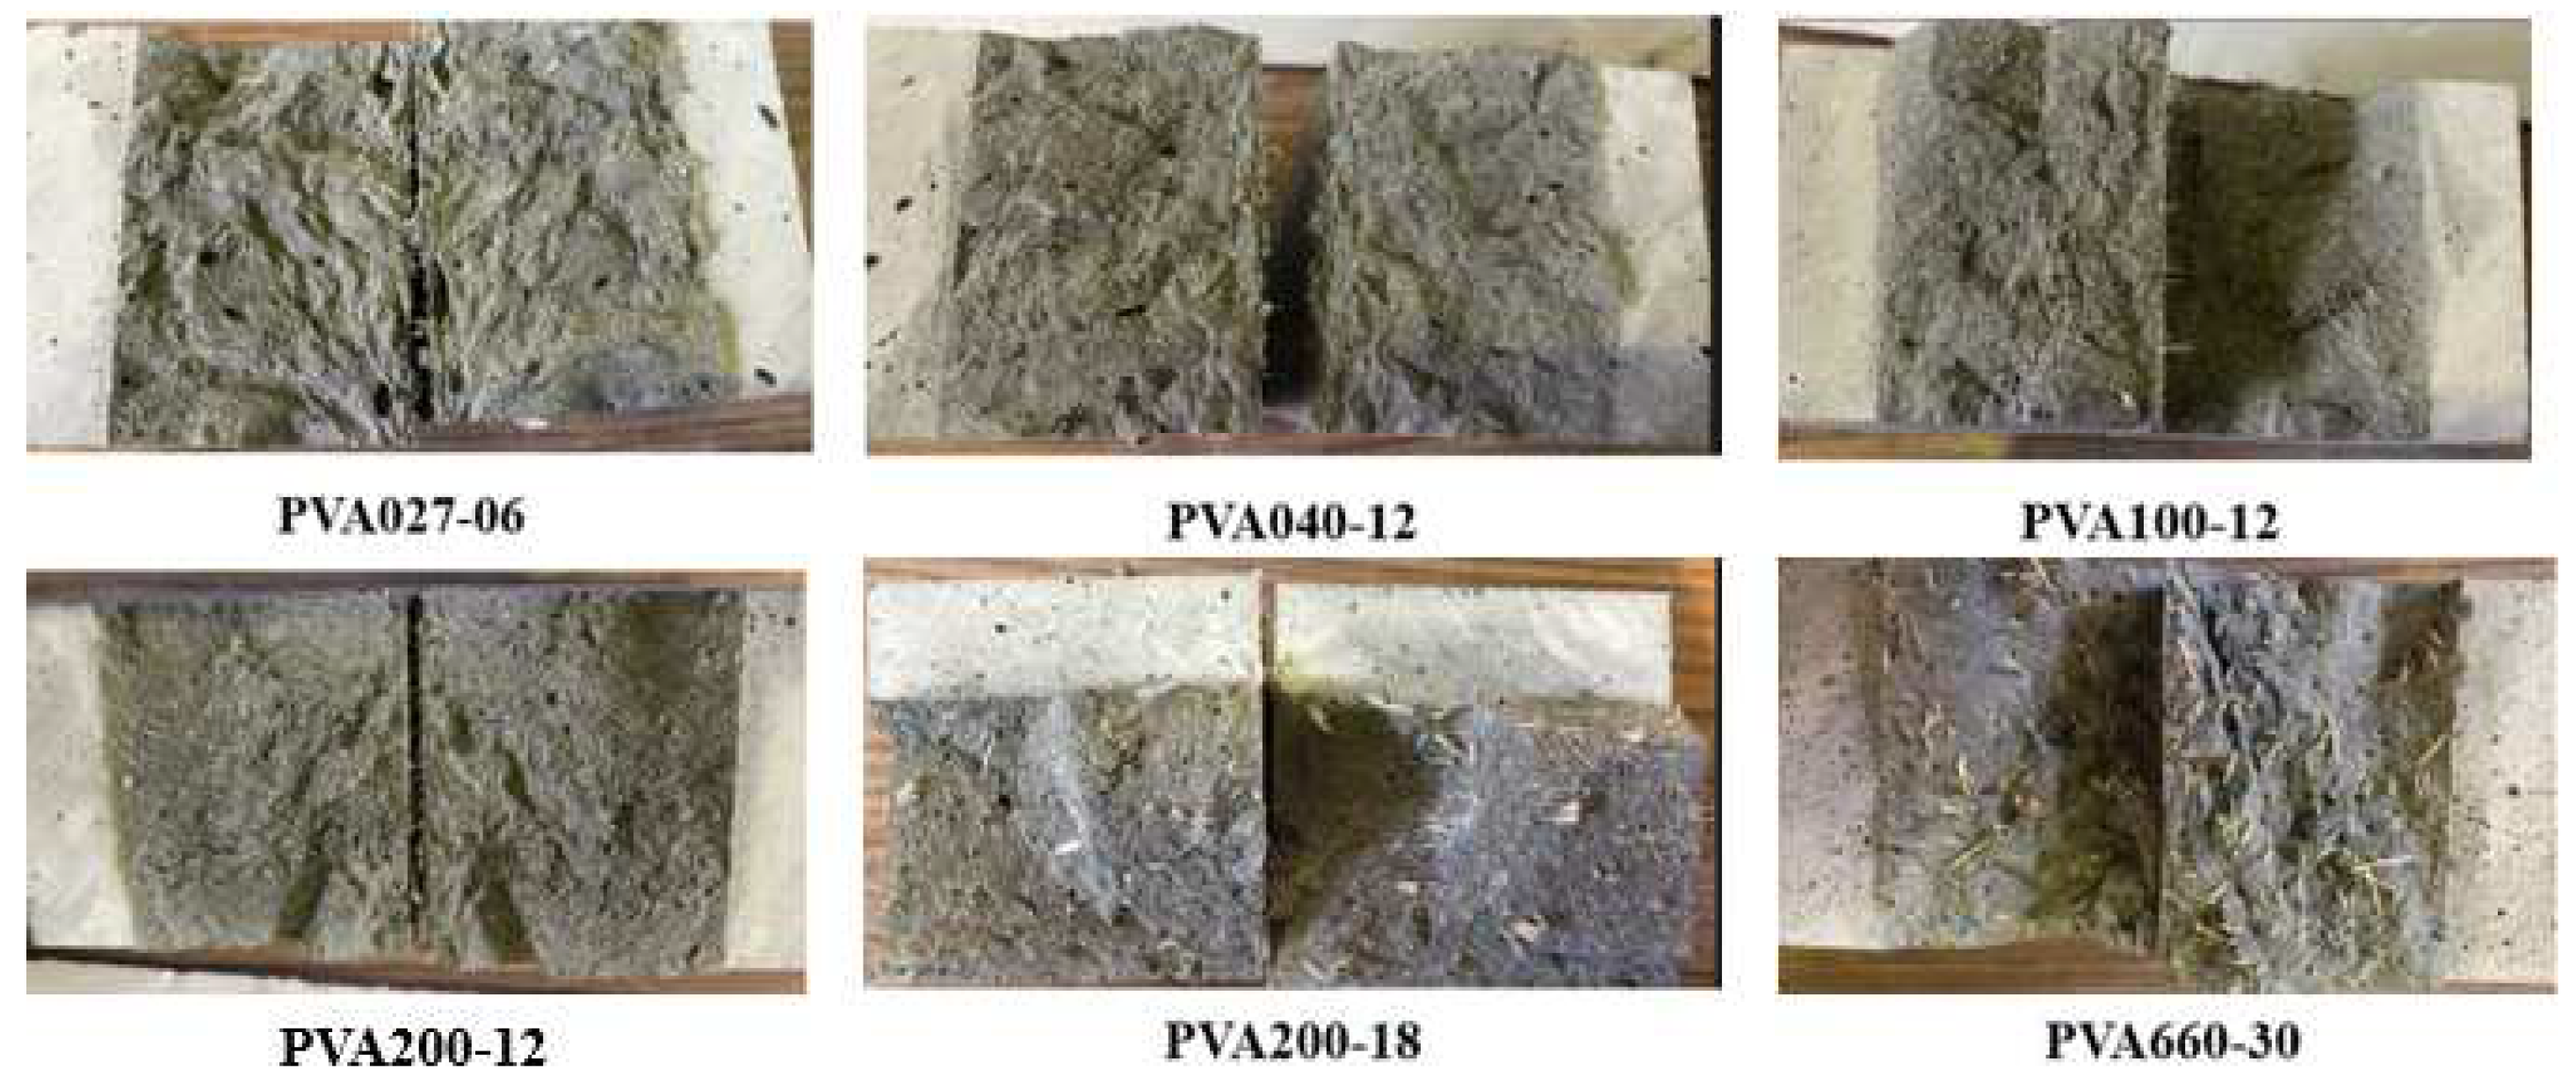
2.2.3. Failure Patterns
2.2.4. Load–Deflection Relationship
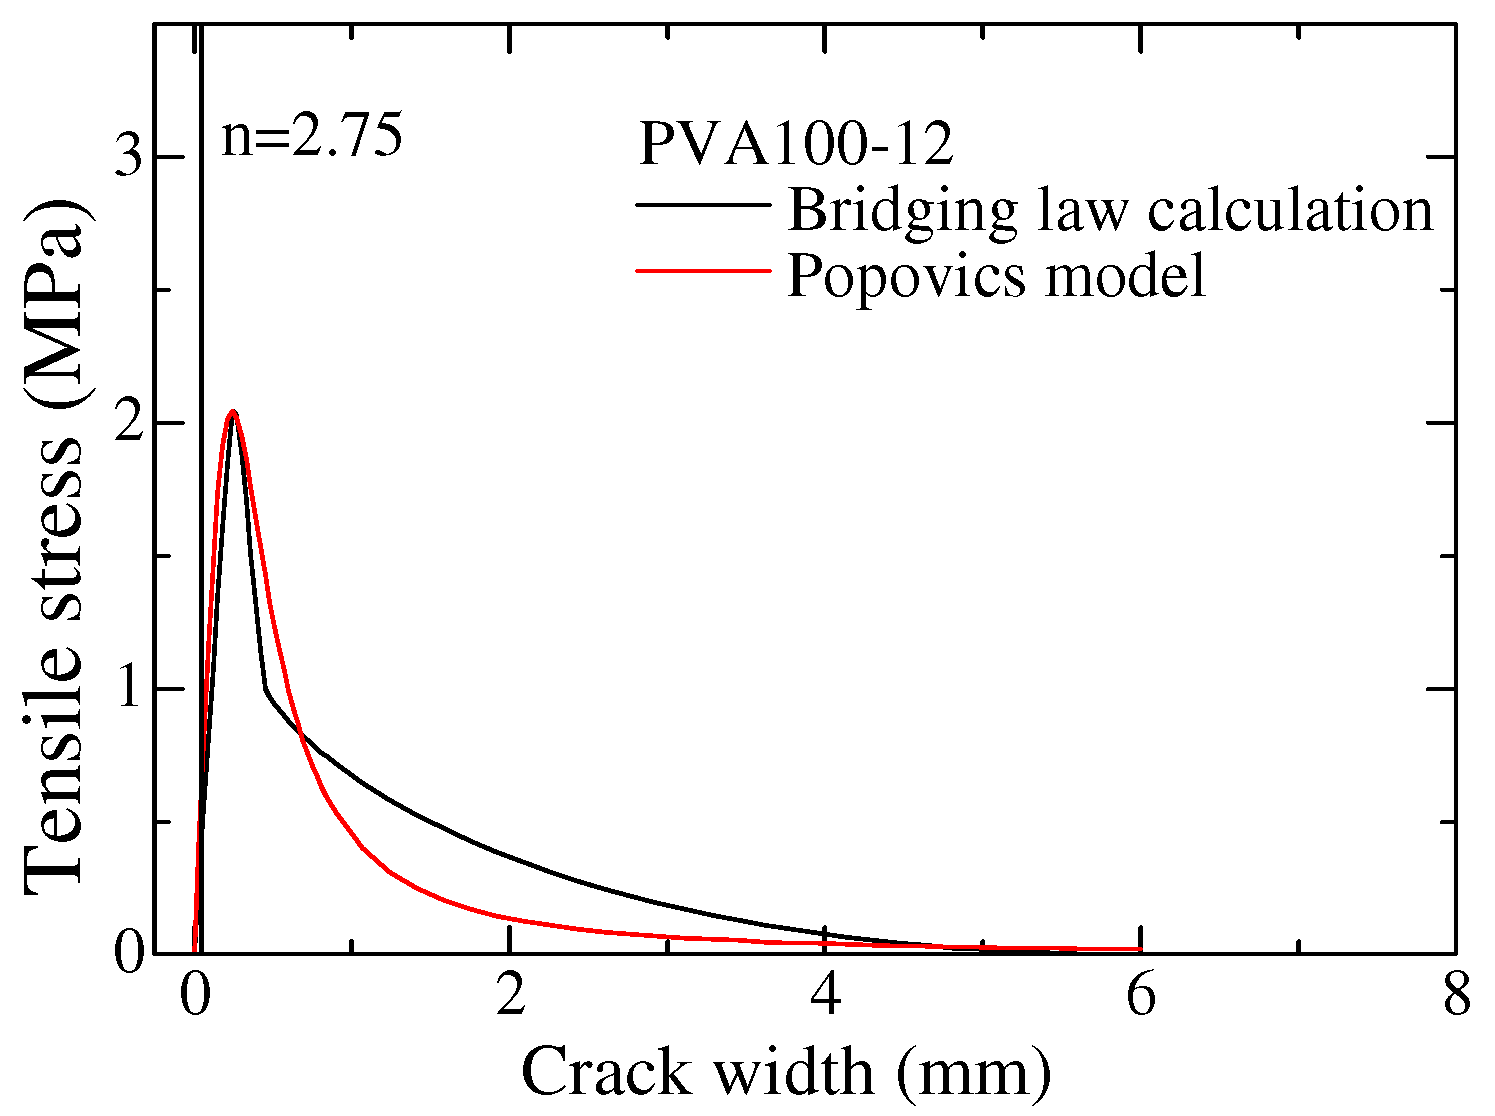
3. Adaptability of Bridging Law Calculation for PVA100-12
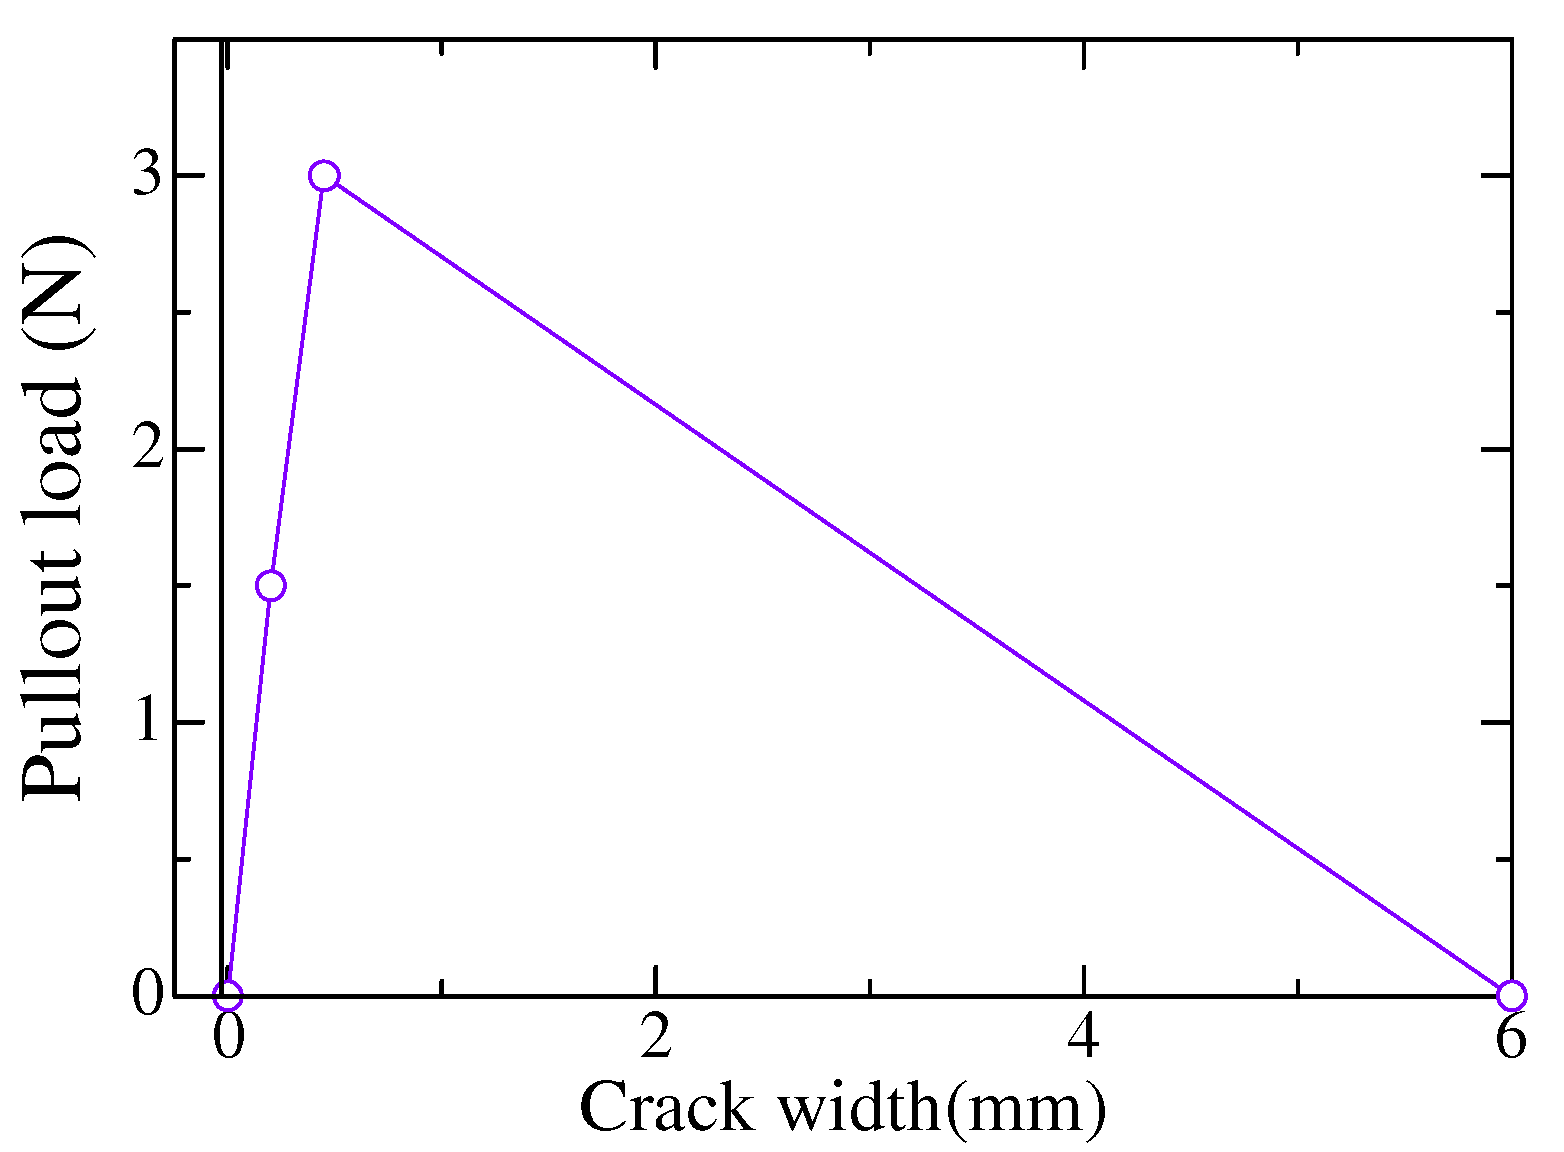
3.1. Single-Fiber Pullout Model and Calculation of Bridging Law
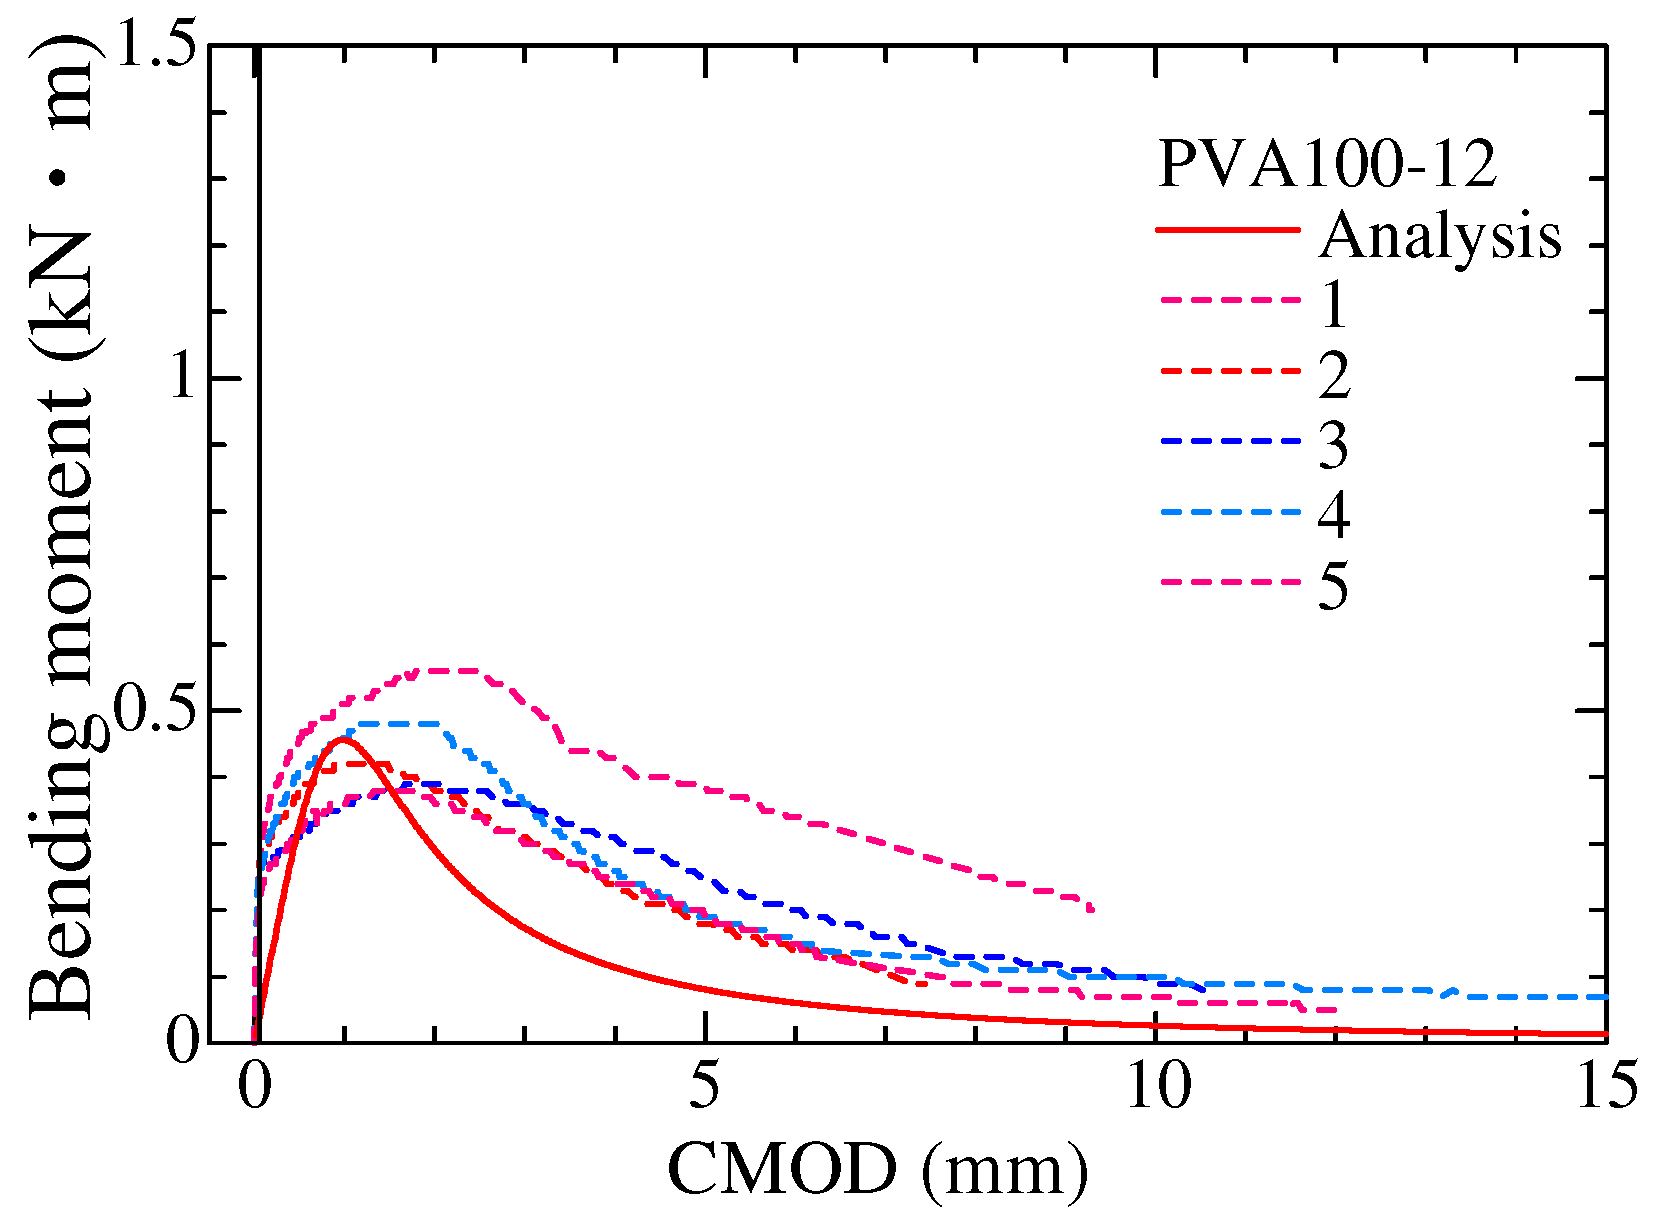
3.2. Section Analysis
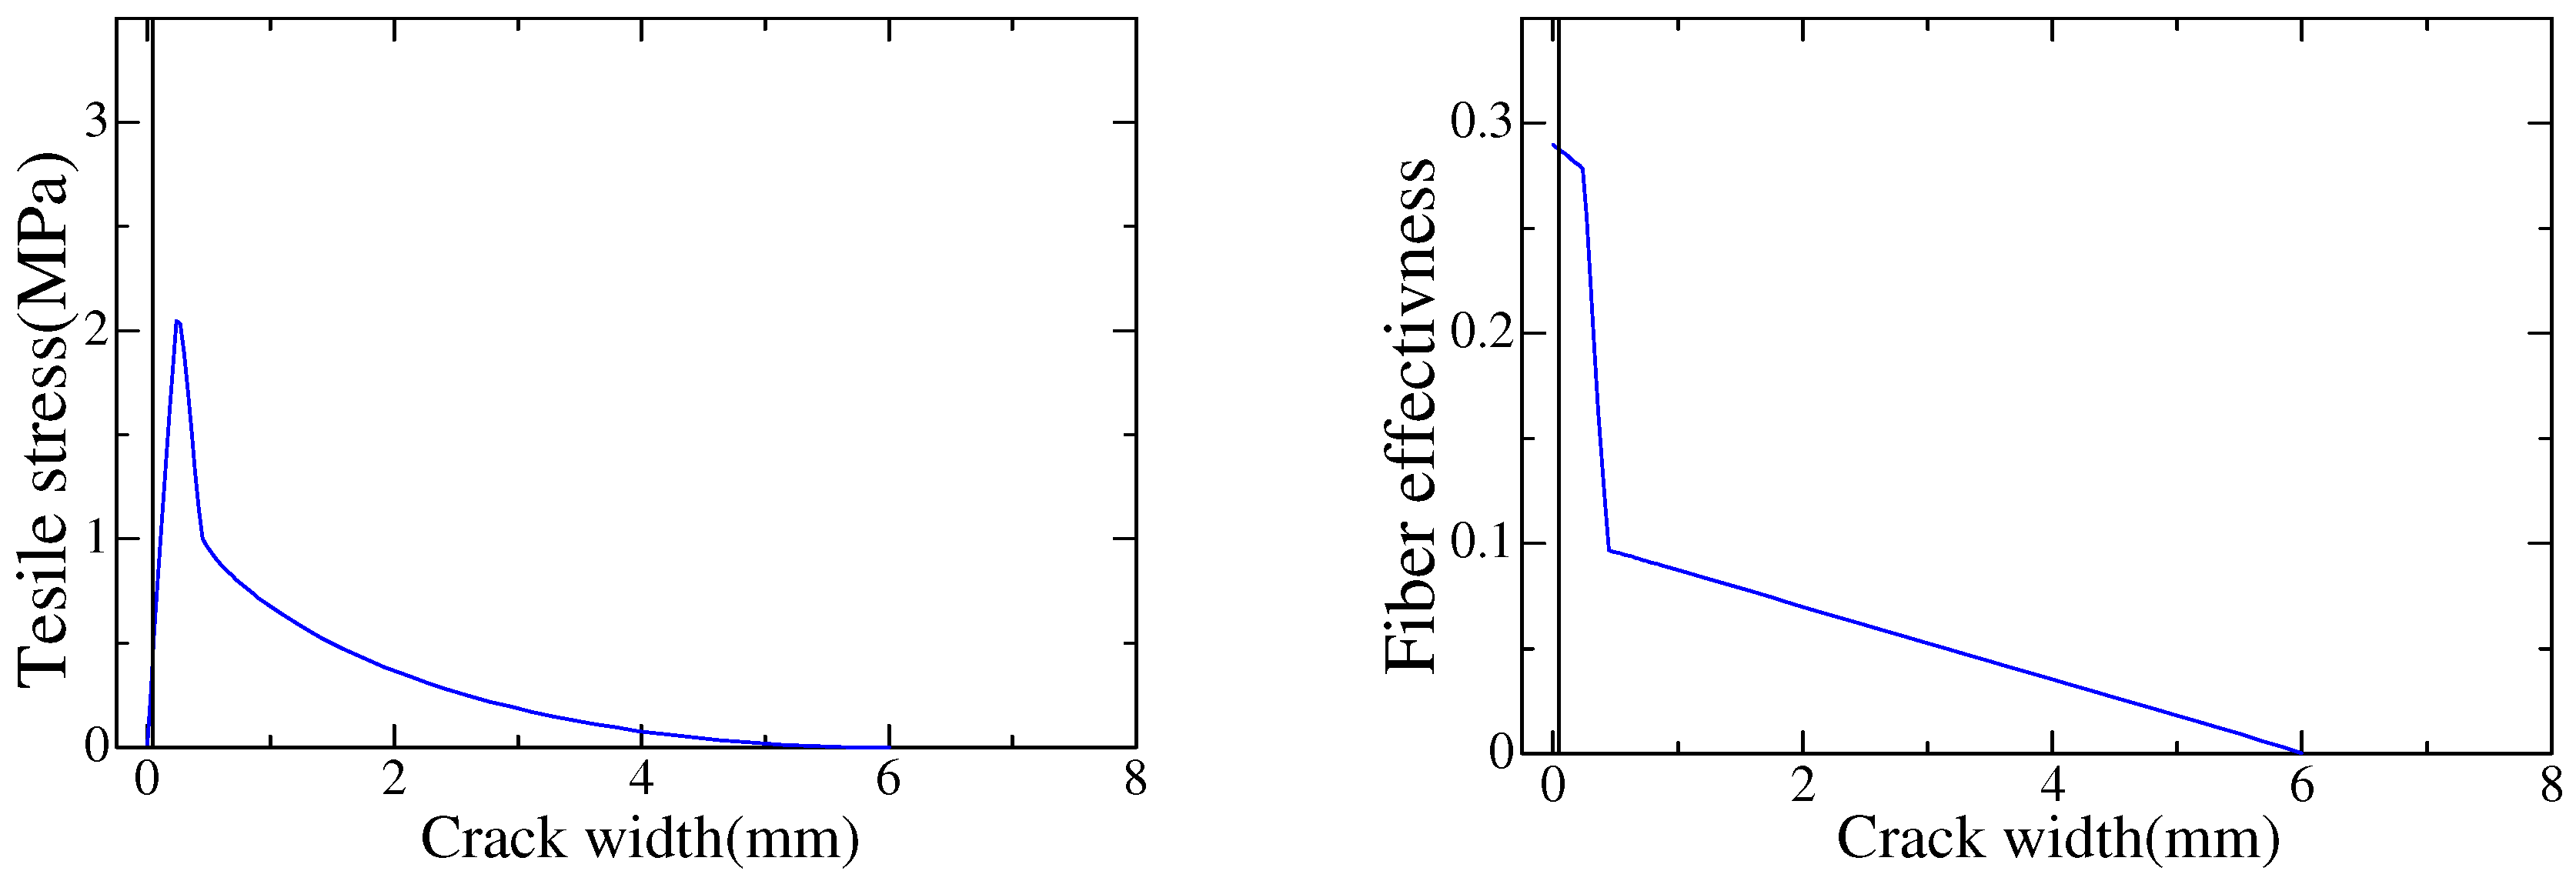
4. Bridging Law Considering the Influence of Fiber Dimensions
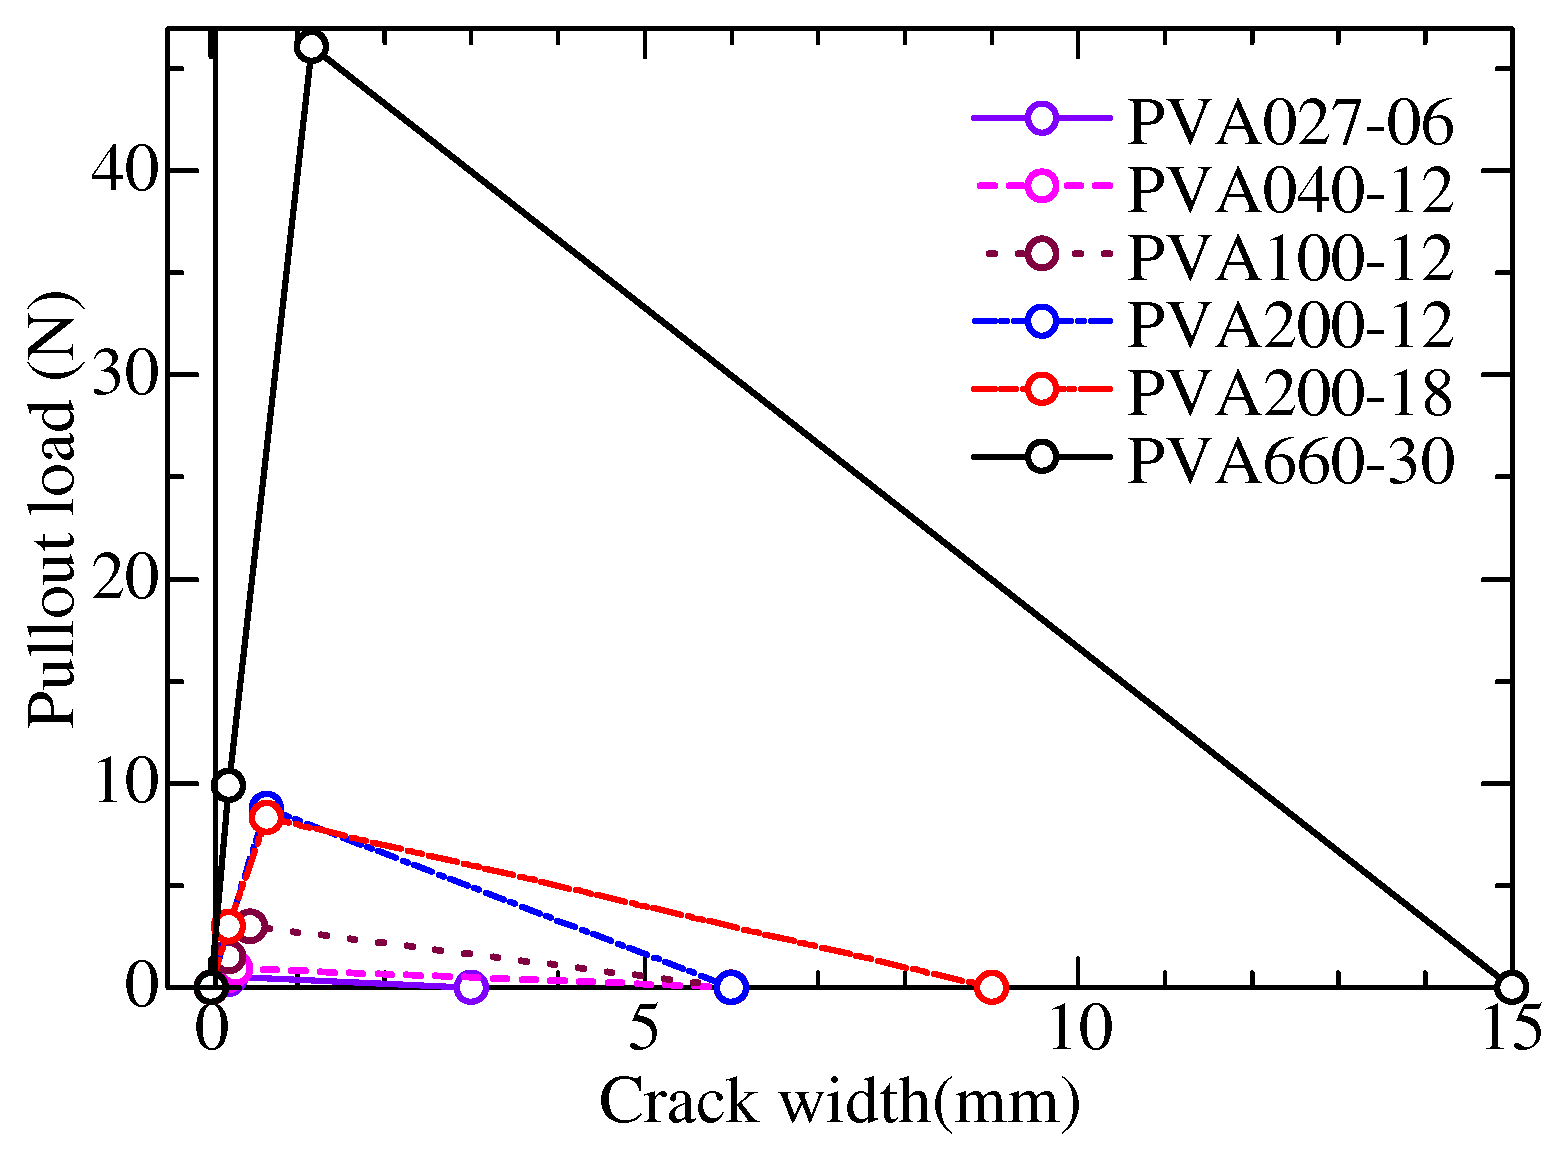
4.1. Single-Fiber Pullout Model and Calculation of Bridging Law
4.2. Section Analysis and Its Adaptability
5. Conclusions
- From the bending test, it was found that the load capacity of PVA-FRCC with 27 μm diameter fiber (PVA027-06) is much higher than the other specimens, and the load capacity decreases as the fiber diameter increases.
- From the bending test, bridging law calculation, and section analysis results of different fiber lengths of FRCC with the same diameter (PVA200-18 and PVA200-12), the length of the fiber has a small effect on the load capacity and the bridging performance of PVA-FRCC.
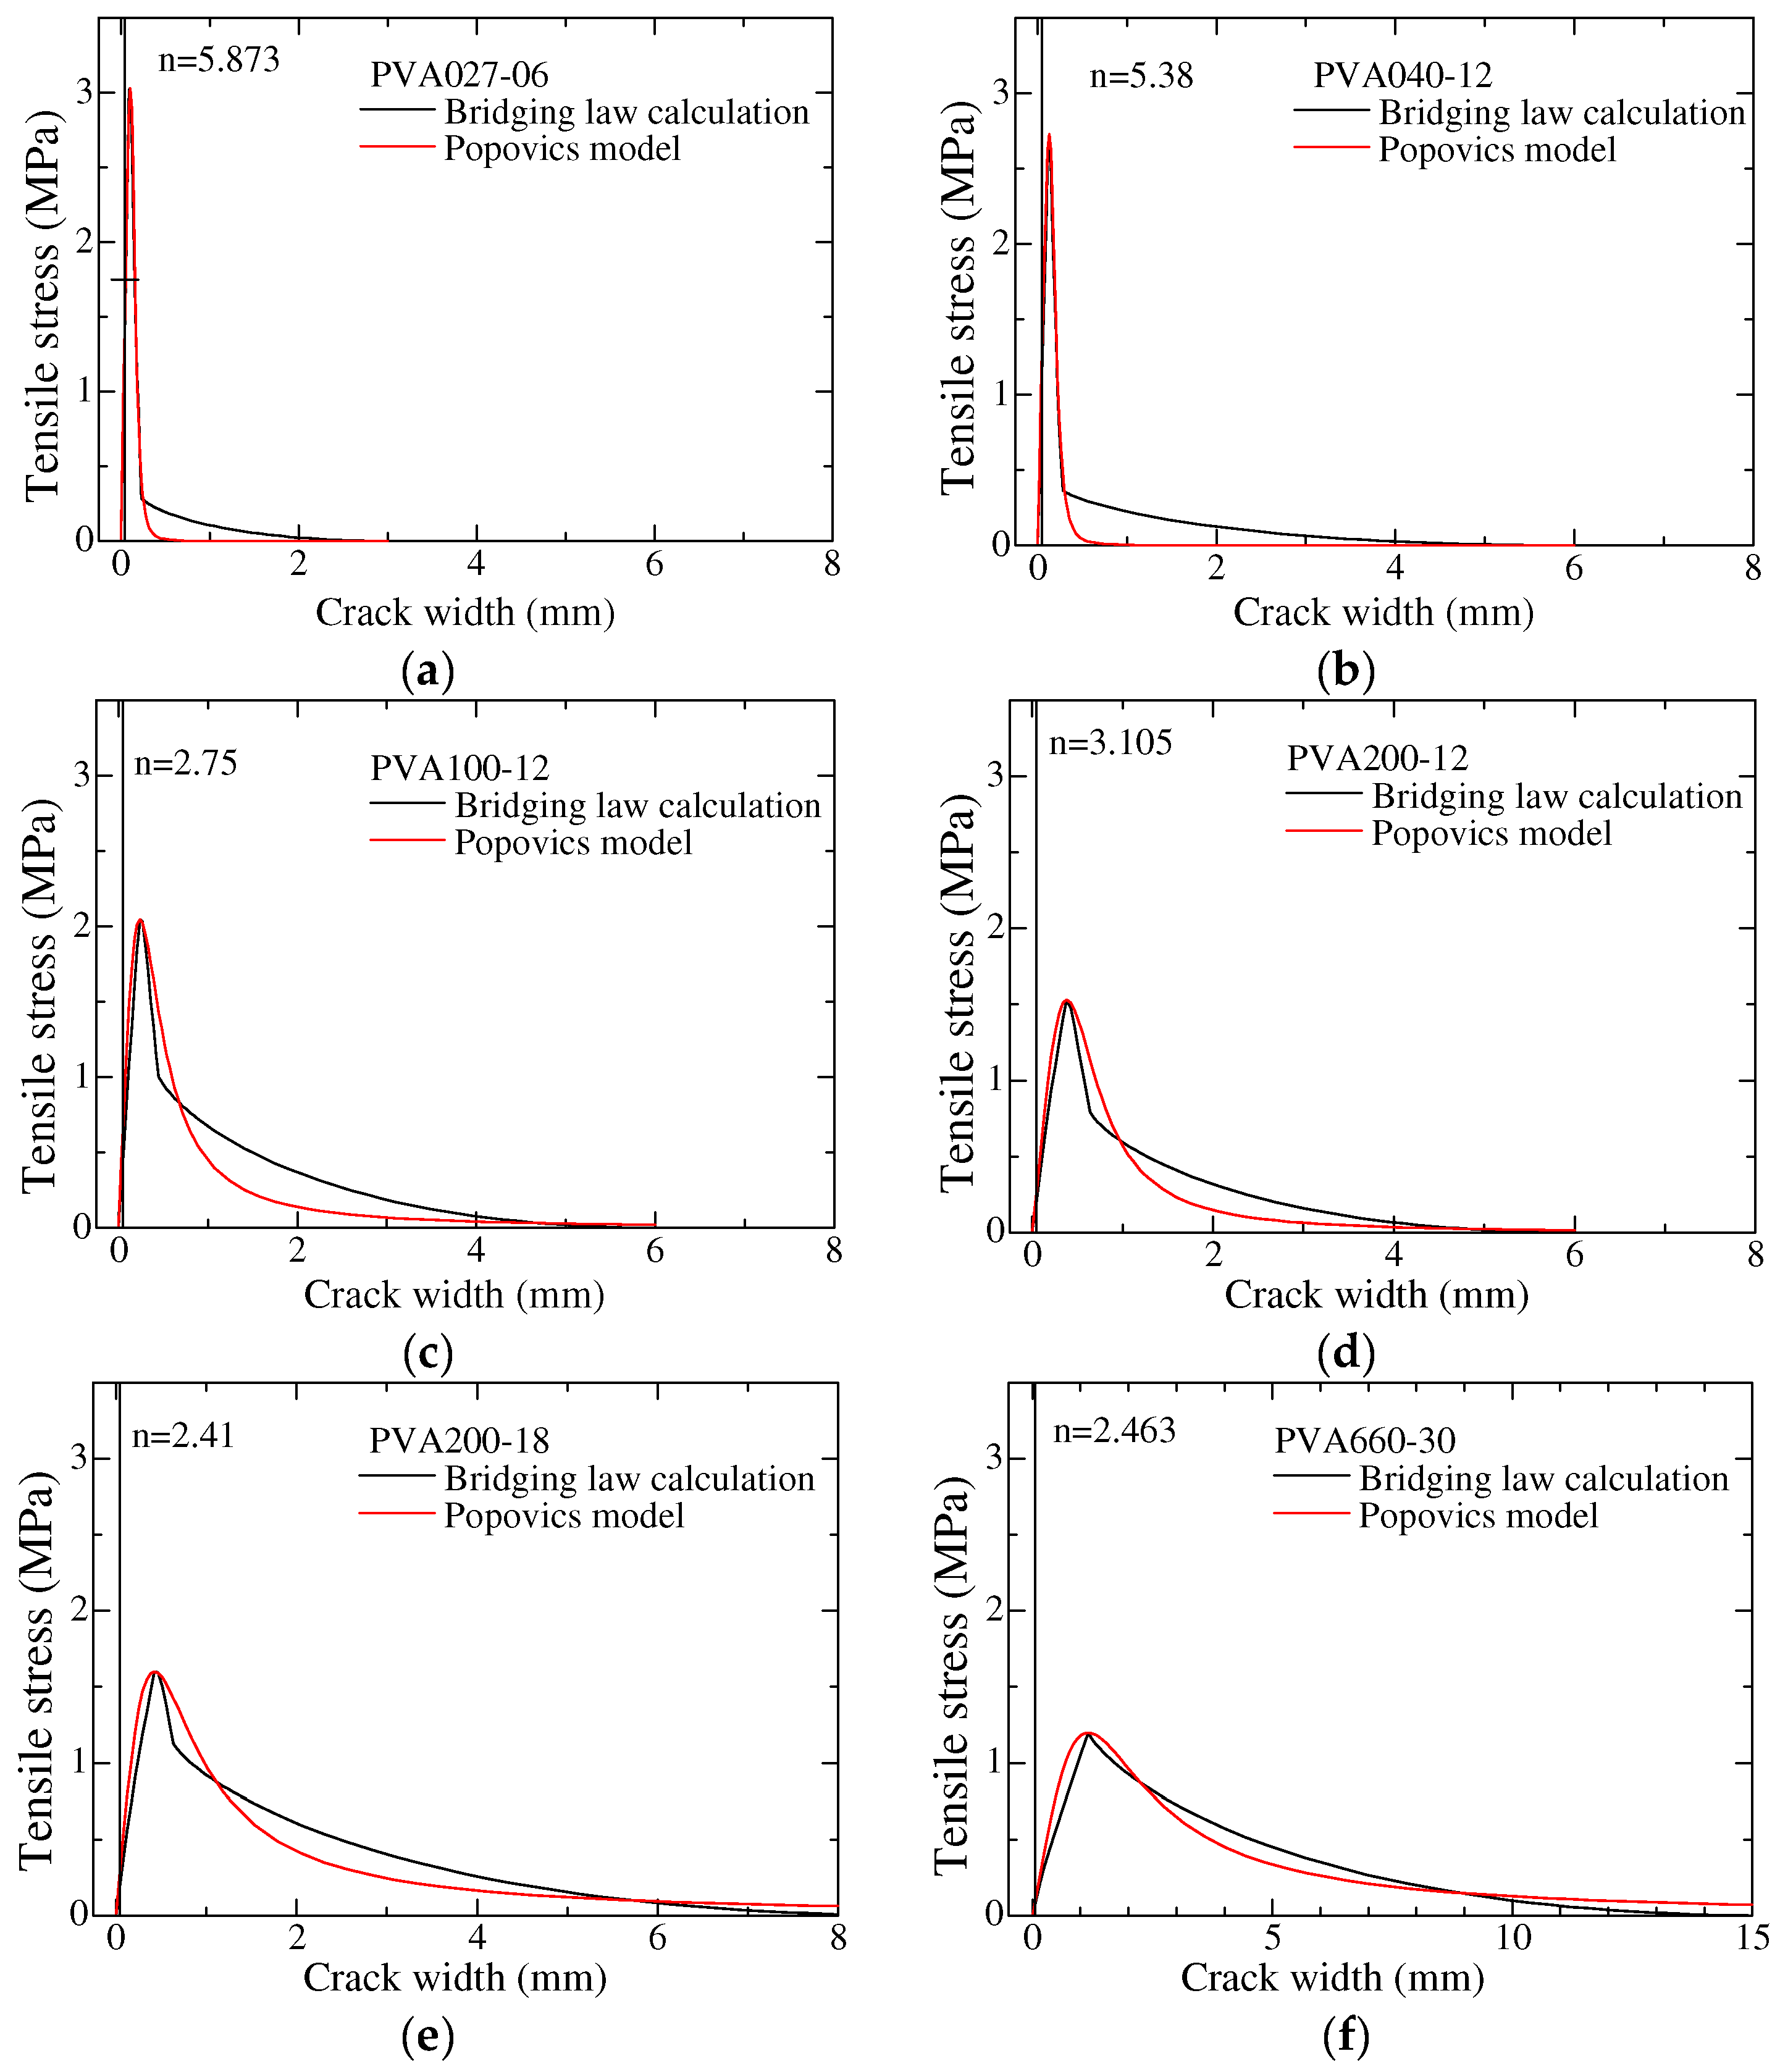
- The parameters that give the characteristic points of the tri-linear model for the single-fiber pullout model are proposed as functions of diameter, bond fracture energy, elastic modulus, cross-sectional area, and fiber perimeter.
- According to the bridging law calculation, the maximum bridging stress decreases as the fiber diameter increases. Most of the fibers with smaller diameters ruptured after the peak, while most of the fibers with bigger diameters slipped out of the matrix.
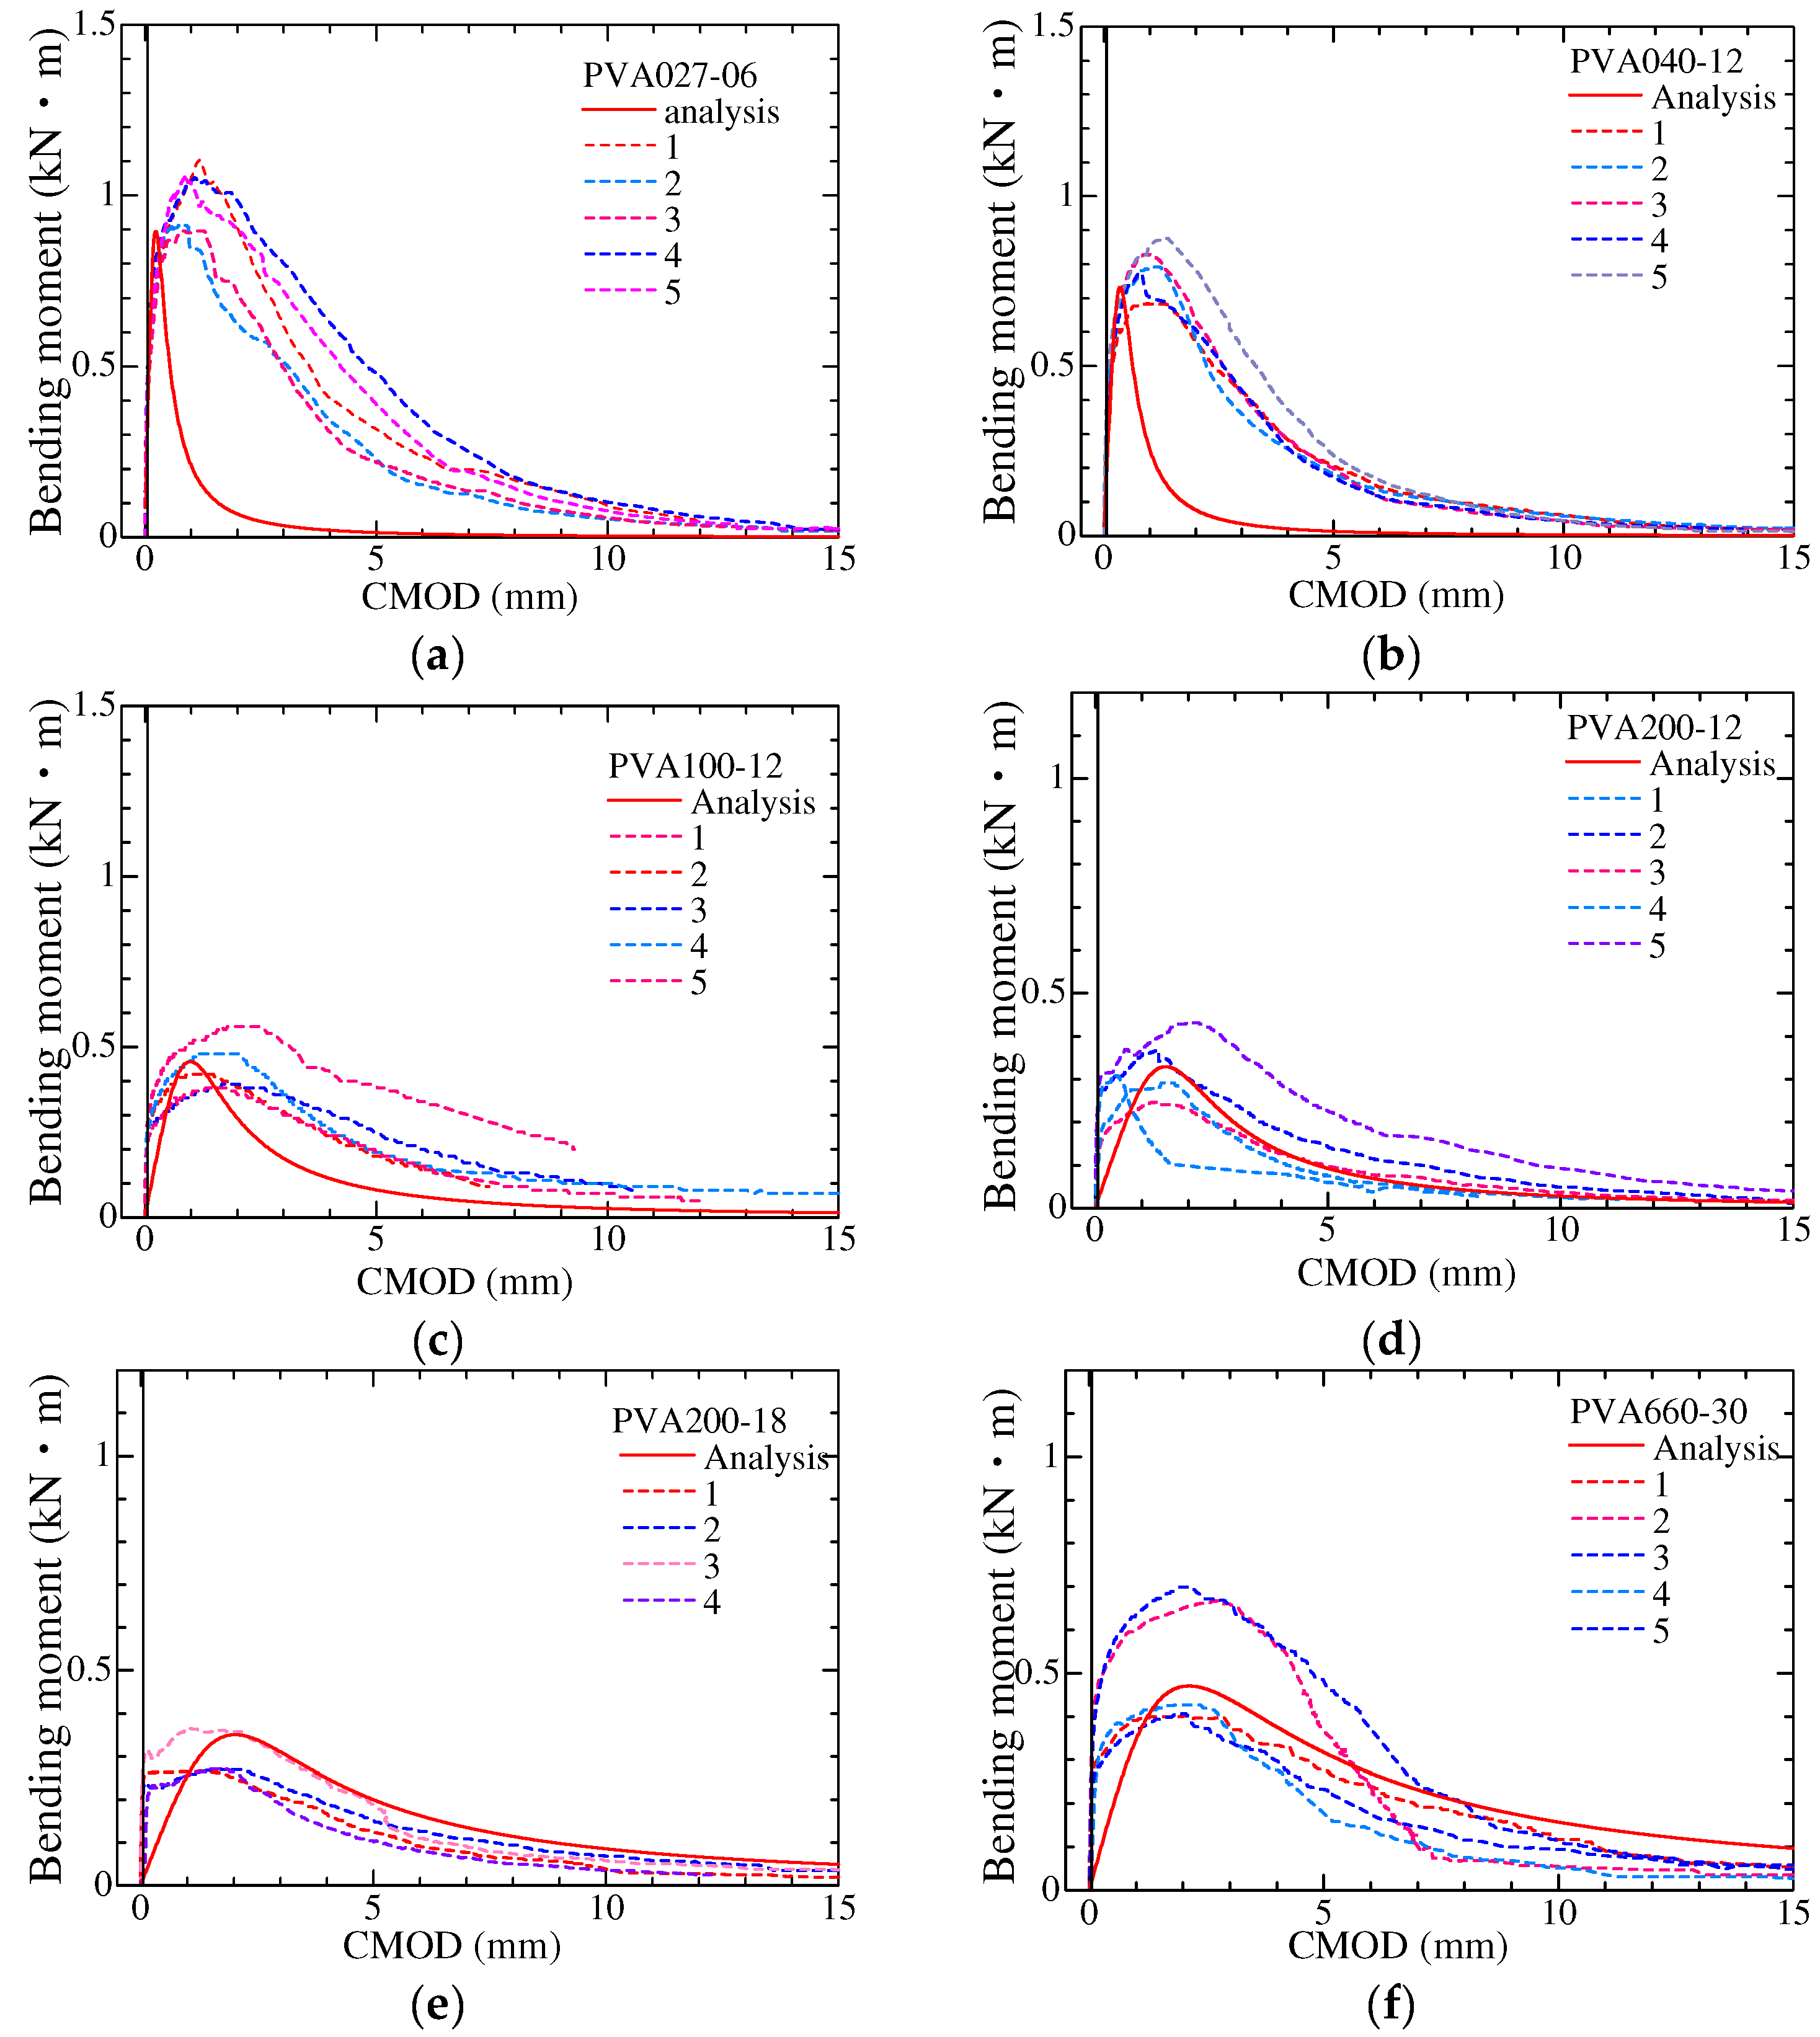
- Section analysis is conducted to verify the proposed model. The ratio of the maximum bending moment of the experiment to the analysis ranged from 0.93 to 1.13, which can lead to the conclusion that the proposed model shows a good agreement with the experiment result.
6. Recommendation
Supplementary Materials
Author Contributions
Funding
Data Availability Statement
Conflicts of Interest
Nomenclature
| Af | Cross-sectional area of fiber (mm2) |
| Alig | Area of the ligament (mm2) |
| Diameter of fiber (μm) | |
| Diameter of fiber for PVA 100-12 (μm) | |
| Ef | Elastic modulus of fiber (MPa) |
| f | Snubbing coefficient |
| f′ | Fiber strength reduction factor |
| Fracture energy (N/mm) | |
| Bond fracture energy (N/mm) | |
| k | Fiber orientation intensity |
| lb | Embedded length of a single fiber (mm) |
| lc,eq | Equivalent compressive length (mm) |
| n | Popovics constant, ratio of elastic modulus of fiber to matrix |
| Pa | First peak load (N) |
| First peak load for PVA100-12 (N) | |
| Pmax | Maximum pullout/tensile load (N) |
| Slip of fiber (mm) | |
| Slip of fiber at the maximum tensile force (mm) | |
| Slip of fiber at ultimate (mm) | |
| Vf | Fiber volume fraction (%) |
| W | Area below load–LPD curve (N·mm) |
| wa | Crack width at the first peak load (mm) |
| wmax | Crack width at the maximum load (mm) |
| Perimeter of fiber (μm) | |
| Perimeter of PVA100-12 fiber (μm) | |
| ρ | Ratio of the cross-sectional area of the fiber to the matrix |
| Tensile stress (MPa) | |
| Fiber strength (MPa) | |
| Maximum tensile stress (MPa) | |
| Bond stress (MPa) |
References
- Chandrathilaka, E.R.K.; Baduge, S.K.; Mendis, P.; Thilakarathna, P.S.M. Structural applications of synthetic fiber reinforced cementitious composites: A review on material properties, fire behavior, durability, and structural performance. Structures 2021, 34, 550–574. [Google Scholar] [CrossRef]
- Shah, S.P.; Rangan, B.V. Fiber Reinforced Concrete Properties. J. Proc. 1971, 68, 126–137. [Google Scholar] [CrossRef]
- Tošić, N.; Aidarov, S.; de la Fuente, A. Systematic Review on the Creep of Fiber-Reinforced Concrete. Materials 2020, 13, 5098. [Google Scholar] [CrossRef] [PubMed]
- Ahmed, S.F.U.; Mihashi, H. A review on durability properties of strain hardening fiber reinforced cementitious composites (SHFRCC). Cem. Concr. Compos. 2007, 29, 365–376. [Google Scholar] [CrossRef]
- Aydın, S. Effects of fiber strength on fracture characteristics of normal and high strength concrete. Per. Pol. Civ. Eng. 2013, 57, 191. [Google Scholar] [CrossRef]
- Naik, T.R. Sustainability of Concrete Construction. Pract. Period Struct. Des. Constr. 2008, 13, 98–103. [Google Scholar] [CrossRef]
- Kasagani, H.; Rao, C.B.K. Effect of graded fibers on stress-strain behavior of Glass Fiber Reinforced Concrete in tension. Constr. Build. Mater. 2018, 183, 592–604. [Google Scholar] [CrossRef]
- Parameswaran, V.S. Fibre-reinforced concrete: A versatile construction material. Build. Environ. 1991, 26, 301–305. [Google Scholar] [CrossRef]
- Li, V.C. Large volume, high-performance applications of fibers in civil engineering. J. Appl. Polym. Sci. 2002, 83, 660–686. [Google Scholar] [CrossRef]
- Labib, W.A. Fibre Reinforced Cement Composites. In Cement Based Materials; Saleh, H.E.-D.M., Rahman, R.O.A., Eds.; InTech: London, UK, 2018. [Google Scholar] [CrossRef]
- Mu, Y.; Yasojima, A.; Kanakubo, T. Shear Performance of FRCC Beam-Column Joints Using Various Polymer Fibers. J. Civ. Eng. Archit. 2019, 13, 562–571. [Google Scholar] [CrossRef]
- Bentur, A.; Mindess, S. Fibre Reinforced Cementitious Composites, 2nd ed.; Taylor & Francis: London, UK, 2007. [Google Scholar]
- Kanakubo, T. Tensile Characteristics Evaluation Method for Ductile Fiber-Reinforced Cementitious Composite. J. Adv. Concr. Technol. 2006, 4, 3–17. [Google Scholar] [CrossRef]
- Sagar, B.; Sivakumar, M.V.N. Compressive properties and analytical modeling for stress-strain curves of polyvinyl alcohol fiber reinforced concrete. Constr. Build. Mater. 2021, 291, 123192. [Google Scholar] [CrossRef]
- Atahan, H.N.; Pekmezci, B.Y.; Tuncel, E.Y. The behavior of PVA Fiber-Reinforced Cementitious Composites under Static and Impact Flexural Effects. J. Mater. Civ. Eng. 2013, 25, 1438–1445. [Google Scholar] [CrossRef]
- Naaman, A.E.; Reinhardt, H.W. High-Performance Fiber Reinforced Cement Composites 2: Proceedings of the International Workshop; CRC Press: London, UK, 2004. [Google Scholar]
- Pan, Y. Mechanical and Microstructural Characteristics of the Fiber-Reinforced Composite Materials. J. Miner. Mater. Charact. Eng. 2022, 10, 477–488. [Google Scholar] [CrossRef]
- Pakravan, H.R.; Ozbakkaloglu, T. Synthetic fibers for cementitious composites: A critical and in-depth review of recent advances. Constr. Build. Mater. 2019, 207, 491–518. [Google Scholar] [CrossRef]
- Ding, Y.; Yu, K.; Li, M. A review on high-strength engineered cementitious composites (HS-ECC): Design, mechanical property and structural application. Structures 2022, 35, 903–921. [Google Scholar] [CrossRef]
- Lan, M.; Zhou, J.; Xu, M. Effect of Fibre Types on the Tensile Behaviour of Engineered Cementitious Composites. Front. Mater. 2021, 8, 775188. [Google Scholar] [CrossRef]
- Meng, D.; Huang, T.; Zhang, Y.X.; Lee, C.K. Mechanical behavior of a polyvinyl alcohol fiber reinforced engineered cementitious composite (PVA-ECC) using local ingredients. Constr. Build. Mater. 2017, 141, 259–270. [Google Scholar] [CrossRef]
- Huang, T.; Zhang, Y.X. Mechanical Properties of a PVA Fiber Reinforced Engineered Cementitious Composite. Proc. Int. Struct. Eng. Constr. 2014, 1, 439–444. [Google Scholar] [CrossRef]
- Li, V.C. From Micromechanics to Structural Engineering: The Design of Cementitious Composites for Civil Engineering Applications. Doboku Gakkai Ronbunshu 1993, 1993, 1–12. [Google Scholar] [CrossRef]
- Kim, D.J.; Naaman, A.E.; El-Tawil, S. Comparative flexural behavior of four fiber reinforced cementitious composites. Cem. Concr. Compos. 2008, 30, 917–928. [Google Scholar] [CrossRef]
- Fakharifar, M.; Dalvand, A.; Arezoumandi, M.; Sharbatdar, M.K.; Chen, G.; Kheyroddin, A. Mechanical properties of high-performance fiber reinforced cementitious composites. Constr. Build. Mater. 2014, 71, 510–520. [Google Scholar] [CrossRef]
- Zhang, J.; Wang, Z.; Wang, Q.; Gao, Y. Simulation and test of the flexural performance of polyvinyl alcohol-steel hybrid fiber reinforced cementitious composite. J. Compos. Mater. 2016, 50, 4291–4305. [Google Scholar] [CrossRef]
- Plagué, T.; Desmettre, C.; Charron, J.P. Influence of fiber type and fiber orientation on cracking and permeability of reinforced concrete under tensile loading. Cem. Concr. Res. 2017, 94, 59–70. [Google Scholar] [CrossRef]
- Kanakubo, T.; Koba, T.; Yamada, K. Flexural Characteristics of Functionally Graded Fiber-Reinforced Cementitious Composite with Polyvinyl Alcohol Fiber. J. Compos. Sci. 2021, 5, 94. [Google Scholar] [CrossRef]
- Kanda, T.; Li, V.C. Effect of Fiber Strength and Fiber-Matrix Interface on Crack Bridging in Cement Composites. J. Eng. Mech. 1999, 125, 290–299. [Google Scholar] [CrossRef]
- Kanda, T.; Li, V.C. Interface Property and Apparent Strength of High-Strength Hydrophilic Fiber in Cement Matrix. J. Mater. Civ. Eng. ASCE 1998, 10, 5–13. [Google Scholar] [CrossRef]
- Suthiwarapirak, P.; Matsumoto, T.; Kanda, T. Multiple Cracking and Fiber Bridging Characteristics of Engineered Cementitious Composites under Fatigue Flexure. J. Mater. Civ. Eng. 2004, 16, 433–443. [Google Scholar] [CrossRef]
- Yang, E.H.; Wang, S.; Yang, Y.; Li, V.C. Fiber-Bridging Constitutive Law of Engineered Cementitious Composites. J. Adv. Concr. Technol. 2008, 6, 181–193. [Google Scholar] [CrossRef]
- Lin, C.; Kayali, O.; Morozov, E.V.; Sharp, D.J. Influence of fiber type on flexural behavior of self-compacting fiber reinforced cementitious composites. Cem. Concr. Compos. 2014, 51, 27–37. [Google Scholar] [CrossRef]
- Ling, Y.; Zhang, P.; Wang, J.; Chen, Y. Effect of PVA fiber on mechanical properties of cementitious composite with and without nano-SiO2. Constr. Build. Mater. 2019, 229, 117068. [Google Scholar] [CrossRef]
- Zhang, P.; Ling, Y.; Wang, J.; Shi, Y. Bending Resistance of PVA Fiber Reinforced Cementitious Composites Containing Nano-SiO2. Available online: https://www.degruyter.com/document/doi/10.1515/ntrev-2019-0060/html (accessed on 30 July 2024).
- Wang, S.; Li, V.C. Polyvinyl Alcohol Fiber Reinforced Engineered Cementitious Composites: Material Design and Performances. In Proceedings of the International Workshop on High Performance Fiber Reinforced Cementitious Composites (HPFRCC) in Structural Applications, Honolulu HI, USA, 23–26 May 2005. [Google Scholar]
- Li, V.C.; Wang, S.; Wu, C. Tensile strain-hardening behavior or polyvinyl alcohol engineered cementitious composite (PVA-ECC). ACI Mater. J. 2001, 98, 483–492. [Google Scholar]
- Wang, H.L.; Peng, G.Y.; Luo, Y.J.; Sun, X.Y. Uniaxial Tensile Experiment on PVA Fiber Reinforced Cementitious Composites. Appl. Mech. Mater. 2013, 438–439. [Google Scholar] [CrossRef]
- Kanakubo, T.; Miyaguchi, M.; Asano, K. Influence of Fiber Orientation on Bridging Performance of Polyvinyl Alcohol Fiber-Reinforced Cementitious Composite. ACI Mater. J. 2016, 113, 131. [Google Scholar] [CrossRef]
- JIS A 6201; Fly Ash for Use in Concrete. Japanese Standards Association (JSA): Tokyo, Japan, 2015.
- ISO 19044; Test Methods for Fiber-Reinforced Cementitious Composites-Load Displacement Curve Using a Notched Specimen. ISO: Geneva, Switzerland, 2016.
- Ozu, Y.; Miyaguchi, M.; Kanakubo, T. Modeling of Bridging Law for PVA Fiber-Reinforced Cementitious Composite Considering Fiber Orientation. J. Civ. Eng. Archit. 2018, 12, 651–661. [Google Scholar] [CrossRef]
- Asano, K.; Yasojima, A.; Kanakubo, T. Study on bond splitting behavior of reinforced concrete members. Part 6 Theoretical solution by the parabolic model of bond constitutive law. J. Struct. Constr. Eng. AIJ 2008, 73, 641–646. (In Japanese) [Google Scholar] [CrossRef]
- Rehm, G. Über die Grundlagen des Verbundes zwischen Stahl und Beton. Deutscher Ausschuss für Stahlbeton; Schriftenreihe, Heft. 138; Ernst: Berlin, Germany, 1961. [Google Scholar]


| ID | Type | Diameter (μm) | Length (mm) | Tensile Strength (MPa) | Elastic Modulus (GPa) |
|---|---|---|---|---|---|
| PVA027-06 | RMS702×6 | 27 | 6 | 1800 | 46 |
| PVA040-12 | REC15×12 | 40 | 12 | 1560 | 41 |
| PVA100-12 | RECS100L×12 | 100 | 12 | 1200 | 28 |
| PVA200-12 | RF350×12 | 200 | 12 | 910 | 30 |
| PVA200-18 | RFS400×18 | 200 | 18 | 975 | 27 |
| PVA660-30 | RF4000×30 | 660 | 30 | 900 | 23 |
| Fiber Volume Fraction | W/C | FA/B | Unit Weight (kg/m3) | |||
|---|---|---|---|---|---|---|
| Water | Cement | Fly Ash | Sand | |||
| 2% | 0.56 | 0.3 | 380 | 678 | 291 | 484 |
| Cement: High early-strength Portland cement Fly ash: Type II of Japanese Industrial Standard (JIS A 6201 [40]) Sand: Size under 0.2 mm Super plasticizer: Binder × 0.6% | ||||||
| Specimen ID | Compressive Strength (MPa) | Elastic Modulus (GPa) |
|---|---|---|
| N | 45.7 | 17.2 |
| PVA027-06 | 49.0 | 16.1 |
| PVA040-12 | 37.2 | 13.2 |
| PVA100-12 | 47.7 | 17.0 |
| PVA200-12 | 45.0 | 15.8 |
| PVA200-18 | 43.3 | 16.3 |
| PVA660-30 | 47.4 | 16.4 |
| Specimen ID | Avg. Max. Load (kN) | Avg. Max. Moment (kN·m) | Avg. CMOD at Max. Load (mm) | Avg. Fracture Energy (N/mm) |
|---|---|---|---|---|
| N | 2.13 | 0.160 | 0.056 | 0.07 |
| PVA027-06 | 13.43 | 1.007 | 1.004 | 3.70 |
| PVA040-12 | 10.56 | 0.792 | 1.039 | 2.77 |
| PVA100-12 | 5.93 | 0.444 | 1.881 | 2.48 |
| PVA200-12 | 4.40 | 0.330 | 1.368 | 1.53 |
| PVA200-18 | 4.35 | 0.326 | 1.457 | 1.74 |
| PVA660-30 | 6.94 | 0.521 | 2.200 | 3.38 |
| Parameter | PVA027-06 | PVA040-12 | PVA100-12 | PVA200-12 | PVA200-18 | PVA660-30 |
|---|---|---|---|---|---|---|
| First peak load, Pa (N) | 0.4 | 0.6 | 1.5 | 3.0 | 3.0 | 9.9 |
| Crack width at Pa, wa (mm) | 0.2 | 0.2 | 0.2 | 0.2 | 0.2 | 0.2 |
| Maximum load, Pmax (N) | 0.5 | 0.9 | 3.0 | 8.8 | 8.3 | 46.1 |
| Crack width at Pmax, wmax (mm) | 0.23 | 0.28 | 0.45 | 0.64 | 0.64 | 1.16 |
| Fiber strength, σfu (MPa) | 1161 | 1006 | 774 | 587 | 629 | 581 |
| ID | Maximum Moment (kN·m) | Ratio of Maximum Moment of the Test to the Analysis Result | |
|---|---|---|---|
| Test | Analysis | ||
| PVA027-06 | 1.007 | 0.895 | 1.13 |
| PVA040-12 | 0.792 | 0.773 | 1.02 |
| PVA100-12 | 0.444 | 0.457 | 0.97 |
| PVA200-12 | 0.330 | 0.329 | 1.00 |
| PVA200-18 | 0.326 | 0.350 | 0.93 |
| PVA660-30 | 0.521 | 0.470 | 1.11 |
Disclaimer/Publisher’s Note: The statements, opinions and data contained in all publications are solely those of the individual author(s) and contributor(s) and not of MDPI and/or the editor(s). MDPI and/or the editor(s) disclaim responsibility for any injury to people or property resulting from any ideas, methods, instructions or products referred to in the content. |
© 2024 by the authors. Licensee MDPI, Basel, Switzerland. This article is an open access article distributed under the terms and conditions of the Creative Commons Attribution (CC BY) license (https://creativecommons.org/licenses/by/4.0/).
Share and Cite
Shiferaw, H.N.; Abrha, S.F.; Kanakubo, T.; Sivasubramanian, M.V.R.; Singh, S.B. Influence of Fiber Dimensions on Bridging Performance of Polyvinyl Alcohol Fiber-Reinforced Cementitious Composite (PVA-FRCC). Fibers 2024, 12, 70. https://doi.org/10.3390/fib12080070
Shiferaw HN, Abrha SF, Kanakubo T, Sivasubramanian MVR, Singh SB. Influence of Fiber Dimensions on Bridging Performance of Polyvinyl Alcohol Fiber-Reinforced Cementitious Composite (PVA-FRCC). Fibers. 2024; 12(8):70. https://doi.org/10.3390/fib12080070
Chicago/Turabian StyleShiferaw, Helen Negash, Selamawit Fthanegest Abrha, Toshiyuki Kanakubo, Madappa V. R. Sivasubramanian, and Shamsher Bahadur Singh. 2024. "Influence of Fiber Dimensions on Bridging Performance of Polyvinyl Alcohol Fiber-Reinforced Cementitious Composite (PVA-FRCC)" Fibers 12, no. 8: 70. https://doi.org/10.3390/fib12080070
APA StyleShiferaw, H. N., Abrha, S. F., Kanakubo, T., Sivasubramanian, M. V. R., & Singh, S. B. (2024). Influence of Fiber Dimensions on Bridging Performance of Polyvinyl Alcohol Fiber-Reinforced Cementitious Composite (PVA-FRCC). Fibers, 12(8), 70. https://doi.org/10.3390/fib12080070