Abstract
An optical fiber scale sensor based on the detection principle of surface plasmon resonance (SPR) was developed for the rapid, high-sensitivity, real-time evaluation of scale precipitation in geothermal fluids. The optical fiber SPR scale sensor was fabricated by depositing a gold thin film onto the surface of an optical fiber with an exposed core. The optimal gold film thickness of the sensor was determined to be 30 nm, which achieved a refractive index sensitivity of 2140 nm per refractive index unit. A field test was conducted using geothermal brine from the Obama Binary Geothermal Power Plant in Unzen, Nagasaki Prefecture. A conventional optical fiber scale sensor and the SPR sensor were simultaneously assessed using raw and pH-adjusted brines. For the SPR sensor, a peak shift of 0.27 nm/min was observed at a response time of 1 min, whereas no change in transmittance was observed for the conventional sensor until 180 min. After the experiments, a scanning electron microscopy-energy-dispersive spectroscopy analysis was conducted on the sensors, and the findings showed that the deposition of Mg-SiO2 scale did not significantly differ between the two sensors. The developed SPR sensor achieved faster scale precipitation detection (tens of minutes to hours) than the conventional sensor.
1. Introduction
In geothermal power plants and hot spring facilities, inorganic salts dissolved in geothermal fluids become supersaturated and precipitate as scales in pipes and other locations with changes in temperature, pH, and pressure. Calcium carbonate scale precipitates from the reaction of dissolved Ca2+ and HCO3− as the temperature decreases and the pH of the geothermal brine increases due to gas-liquid separation [1]. Likewise, silica scale precipitates when silica is concentrated and supersaturated in geothermal brine due to gas-liquid separation in production wells and separators. Scale deposits in pipes and heat exchangers cause a wide range of problems, such as reductions in the flow rate of geothermal brine in pipes and heat exchange efficiency. To address these problems, researchers have proposed using inhibitors or adjusting the pH of the brine by adding sulfuric acid; however, these methods have insufficient efficiency [2,3,4,5,6,7,8,9,10,11,12,13].
The rate of scale formation in geothermal brine can be determined by immersing glass plates or metal pieces in the brine, collecting them after several weeks or months, and observing the weight change in scale formation. Alternatively, scale precipitation can be evaluated by continuously passing brine through a column apparatus filled with rocks or glass grains and observing the changes in its flow rate for several weeks [5,6,14]. However, these tests have long operation periods and high costs and complexity. Our research team developed an optical fiber scale sensor that can evaluate scale formation in geothermal brine in a few hours using the properties of optical fiber, such as pressure and heat resistance [15,16,17,18,19,20,21,22]. The sensing part of this sensor is a portion of the optical fiber core that is exposed by removing the cladding, where the deposited scale inhibits the total reflection and reduces the propagated light. Therefore, scale formation can be monitored by measuring the light intensity reaching the detector. Through this approach, the formation of calcium carbonate and silica scales and their prevention status, with the addition of an inhibitor in geothermal power plants and hot spring facilities, are observable in a few hours to half a day. Nonetheless, this analysis of scale precipitation using scale sensors requires high sensitivity and a further reduction in the measurement duration. Zotzmann et al. reported on the real-time monitoring of barite precipitation using a fiber optic sensor in high-pressure, high-temperature conditions in an autoclave, and indicated the important shortcoming of existing non-optical detection was overcome [23].
Surface plasmon resonance (SPR) is widely applied in the biosensor field because of its high refractive index sensitivity [24,25,26,27,28,29,30,31,32]. In particular, optical fiber SPR sensors are easy to handle because the SPR response is measured as an absorption wavelength. Moreover, the systems used to measure changes in peak wavelengths have low susceptibility to power supply instability, vibration, and unexpected changes in light intensity.
In this study, we applied SPR, a highly sensitive detection technique, to the geothermal field by developing a scale sensor that enables the rapid examination of scale precipitation and its prevention. The proposed instrument is an optical fiber SPR scale sensor (“SPR sensor” hereinafter) made by depositing a gold thin film onto the surface of an optical fiber with an exposed core. We first investigated the optimal film thickness through laboratory experiments. The applicability of this sensor was examined in a field test using geothermal brine from the Obama Binary Geothermal Power Plant in Unzen, Nagasaki Prefecture. In this facility, calcium carbonate scale precipitation is mainly suppressed by injecting sodium polyacrylate into the production wells. By contrast, Mg-SiO2 scale near the wellheads and heat exchange plates and in the aboveground pipes remains an issue. Mg-SiO2 scale precipitation can be inhibited by adjusting the pH of geothermal brine to acidic levels [33,34]. Thus, field tests were conducted to compare the evaluations of scale formation in raw and pH-adjusted brines provided by the SPR sensor and a conventional optical fiber scale sensor (“conventional sensor” hereinafter).
2. Scale Sensor Overview
The optical fiber used in this study was a core-clad step-index multimode optical fiber (FT200EMT; Thorlabs, Inc., Newton, NJ, USA), with a core diameter of 200 μm and a cladding diameter of 225 μm. For the conventional sensor, the sensing length was 16 cm and the core was exposed by removing the cladding using acetone after peeling off the jacket (Figure 1a). For the SPR sensor, an optical fiber with 5 cm of exposed core was placed in the chamber of a turbomolecular pumped coater (Q150T Plus; Quorum, Laughton, East Sussex, UK); a gold thin film was deposited onto the sensor part (Figure 1b) in the direction perpendicular to the gold target and the fiber. After deposition, the fiber was rotated 180°, and gold was deposited onto the entire fiber surface in the abovementioned manner. The film thickness, calculated using the specifications of the turbomolecular pumped coater, ranged from 15 nm to 60 nm, and the difference in sensor sensitivity for different film thicknesses was investigated. A halogen light (HL-2000-FHSA; Ocean Optics, Orlando, FL, USA) was the light source, and a spectrophotometer (MV-3200; JASCO Co., Tokyo, Japan) was used to evaluate the sensors’ response to scale formation (Figure 1a).
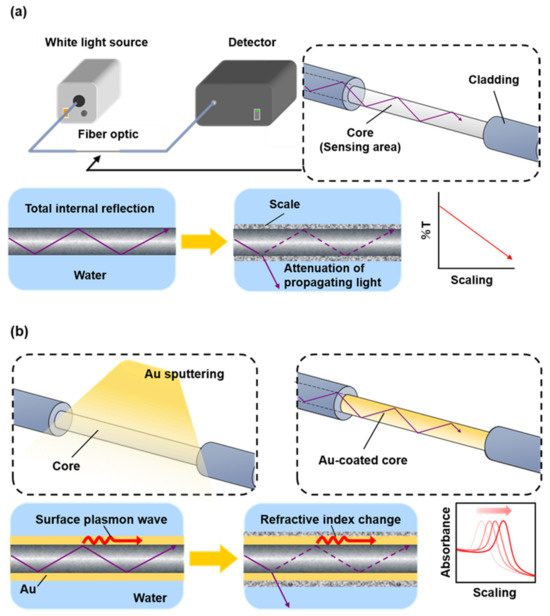
Figure 1.
Detection principles of (a) conventional optical fiber (exposed core) scale sensor and (b) optical fiber SPR scale sensor.
An optical fiber sensor with an exposed core satisfies the total internal reflection in the presence of surrounding water and excites evanescent waves at the boundary between the core and geothermal brine. Thus, in a conventional sensor, the amount of propagating light leakage (%T) in the core varies depending on the amount of scale deposited on the sensing part (Figure 1a). In the SPR sensor, the formation of a gold thin film with a thickness of several tens of nanometers on the core surface induces an interaction between the surface plasmon waves on the metal thin film surface and the evanescent waves, thus exciting SPR. The peak wavelength of the SPR spectrum shifts due to changes in the refractive index of the external field caused by scale deposition on the gold thin film (Figure 1b).
3. Materials and Methods
3.1. Optimization of Film Thickness of SPR Sensor via Laboratory Tests
SPR is sensitive; its surrounding refractive index changes with the film thickness. Therefore, we determined the optimal film thickness of the SPR sensor by changing the thickness of the gold thin film deposited onto the optical fiber surface. Three SPR sensors with 15, 30, and 60 nm thick gold thin films were fabricated. The film thickness was controlled using the deposition duration. Then, 10, 20, 30, 40, and 50 wt.% glycerol test solutions were prepared by diluting glycerol (075-00616, FUJIFILM Wako Pure Chemical Co., Osaka, Japan) with Milli-Q® water (Direct-Q UV3; Merck KGaA, Darmstadt, Germany), resulting in refractive indices of 1.34, 1.35, 1.37, 1.38, and 1.39, respectively. The SPR spectra were obtained for water and the five aqueous glycerol solutions using air as the reference (Figure 2a). During the test, the sensor section was washed using Milli-Q® water each time the solution was replaced. This operation was performed for each SPR sensor. The optimal film thickness for scale formation evaluation was determined based on the change in the SPR absorption band with the refractive index.
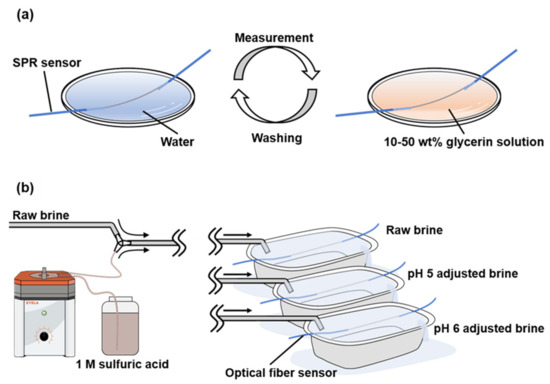
Figure 2.
Experimental system for (a) laboratory and (b) field experiments on SPR sensor.
3.2. Field Experiment
A field experiment was conducted on the SPR sensor from 11 to 15 November 2022, using the hydrothermal brine from the Obama Binary Geothermal Power Plant in Unzen, Nagasaki Prefecture. The brine composition is shown in Table 1. This power plant generates 100 kW of electricity through heat exchange with a 110 °C source. Its geothermal brine contains high levels of CO2, and carbonate and silica scales precipitate in the production wells and pipes. Scanning electron microscopy (SEM)-energy-dispersive spectroscopy (EDS) analysis of the scales showed that the white precipitates in the production wells are aragonite (CaCO3), and the black precipitates in the production wells and heat exchangers are amorphous Mg-SiO2 (MgSiO3·H2O) and chrysotile (Mg3Si2O5(OH)4) scales [34].

Table 1.
Chemical composition of raw brine from Obama Binary Geothermal Power Plant.
The geothermal brine used in the experiments was raw; that is, it was obtained before sodium polyacrylate was injected into it as an inhibitor of carbonate minerals in the production wells. The brine was exposed to the atmosphere in a tank with an internal volume of 30 L, and flowed through a silicone tube with an inner diameter of 10 mm via a siphon-type method to a reaction vessel at a flow rate of 1 L/min. The travel time of the brine from the brine tank to the reaction vessel was approximately 20 s. One tube was prepared for the raw brine, and two tubes were prepared for the pH-adjusted brines. Then, 1 mL of 2 M sulfuric acid was added to each tube to adjust the solution pH to 5 and 6. Each optical fiber sensor was directly immersed in the brine in the reaction vessel, and scale formation was evaluated using the peak shift of the SPR absorption band (Figure 2b).
Experiments were conducted on the conventional sensor with an exposed core in the raw brine and the pH 5- and pH 6-adjusted brines. The length of the sensor section was set to 16 cm because the scale precipitated in the field test within a short period was in trace amounts. The sensor was immersed in the brine pumped into the reaction vessel, and transmittance measurements were simultaneously obtained for 1310 min immediately after sensor immersion. The light transmittance of the sensor was measured by connecting it to a white-light source (HL-2000-FHSA-LL; Ocean Optics) and a spectroscopic detector (Color Compass MF, AT System, Hamamatsu, Japan).
The SPR sensor with the gold film thickness of 30 nm was tested in the raw brine and the pH 5-adjusted brine. The experiment in the pH 5-adjusted brine lasted 270 min, and that in the raw brine was conducted twice (for 270 and 660 min) to examine the reproducibility of the response and the effect of prolonged measurement on the response. The atmosphere was used as the reference. In addition, the SPR spectrum over time was obtained, and scale formation was assessed based on the peak shift of the SPR absorption band.
3.3. SEM-EDS Analysis of Scale Precipitates
SEM-EDS (JCM-7000 NeoScope™; JEOL, Tokyo, Japan) was used to observe the surfaces of the conventional and SPR sensors with the deposited scale from the field experiments. As the optical fiber penetrated the electron beam of the microscope and prevented accurate measurement, approximately 3 cm of the optical fiber was cut from its sensor part and placed in the chamber of a sample coater (DII-29010SCTR Smart Coater; JEOL), which was used to deposit a 10 nm thick gold thin film. The sample was then placed onto the SEM-EDS stage. During the surface observation of the SPR sensor, the chemical composition of a 162 nm × 325 nm area was analyzed via EDS.
4. Results and Discussion
4.1. Appropriate Film Thickness for SPR Sensor
Figure 3 shows the response of the three SPR sensors with different film thicknesses to refractive index changes in the laboratory experiment. For all the sensors, the peak shifts to longer wavelengths with an increase in the refractive index. The prominence of the peak shift increases with the film thickness. For all the sensors, the peak shift of the SPR absorption band exhibits linearity with respect to the refractive index change (right column of Figure 3). The refractive index sensitivities (nanometers per refractive index unit [RIU]) of the sensors with film thicknesses of 15, 30, and 60 nm are 833, 2141, and 2575 nm/RIU, respectively. The sensor with the 60 nm film thickness has the highest refractive index sensitivity and is sensitive to ambient refractive index changes. However, an SPR-unrelated peak appears at approximately 530 nm and is more pronounced than for the sensors with a film thickness of 30 nm. Based on these results, the optimal film thickness is 30 nm, which achieves a relatively high refractive index sensitivity and low vulnerability to the 530 nm peak.
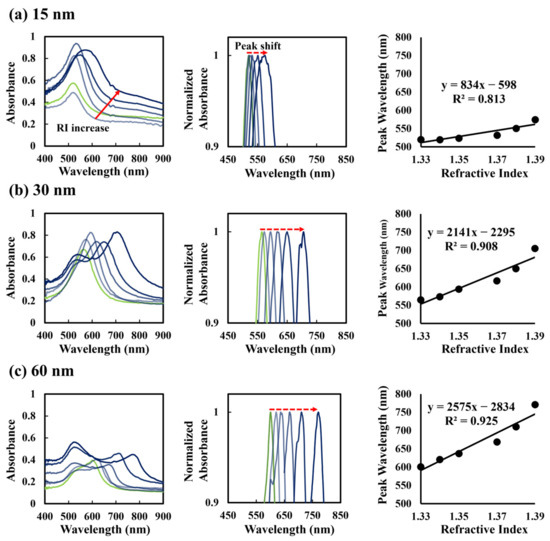
Figure 3.
The refractive index response of sensors with different thicknesses of gold thin films: (a) 15 nm, (b) 30 nm, and (c) 60 nm. The prepared sensors were immersed in glycerol solutions with different refractive indices. The left, middle, and right columns are the obtained absorption waveforms, standardized spectra of the absorption waveforms, and changes in the peak wavelengths with changes in the refractive index, respectively.
4.2. Sensor Performance Evaluation via Field Experiment
In the field experiment on the conventional sensor in the raw brine, the light transmittance decreased with time, indicating scale formation (Figure 4). The transmittance response reached zero after approximately 1000 min, meaning that the sensor did not detect any new scale deposition for any additional time, i.e., scale thickness. By contrast, no decrease in light transmittance was noted in the pH 5- and pH 6-adjusted brines because scale precipitation was mostly inhibited by the pH adjustment. However, light transmittance in the pH 5-adjusted brine started to decrease at approximately 1050 min after sensor immersion. Scale precipitation may have occurred because of the consumption of the sulfuric acid solution for pH adjustment at night, which would mean that only raw brine was flowing through the system. For the pH 6-adjusted brine, light transmittance increased approximately 800 min after sensor immersion, which can be attributed to the discontinued water supply and the flow of only sulfuric acid, which increased the pH. Therefore, the conventional sensor was highly responsive to changes in the experimental conditions.
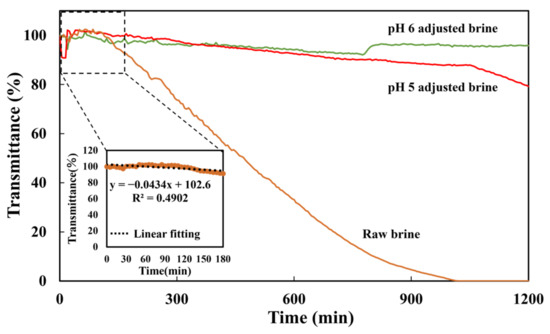
Figure 4.
Transmittance response of conventional sensor (exposed core) in raw brine and pH 5- and pH 6-adjusted brines.
The experiment on the SPR sensor in the raw brine shows that the SPR peak linearly shifts toward longer wavelengths with time. At 270 min after sensor immersion, the SPR peak shifts by 73 nm (Figure 5a), indicating the formation of scale with a higher refractive index than that of the sensor surface. The peak wavelength of the SPR spectrum immediately after sensor immersion in the raw brine is approximately 550 nm. Combined with the results in Figure 3b, this suggests that the refractive index during sensor immersion is approximately 1.33 RIU. The decrease in the SPR peak intensity is likely due to scale formation. A linear peak shift with immersion duration is also observed in the 660 min experiment (Figure 5b). The slopes of the proximal line up to 270 min after sensor immersion in the short- and long-term experiments are approximately 0.27 and 0.198, and the coefficients of determination are 0.995 and 0.997, respectively, confirming that the SPR sensor has a highly reproducible response.
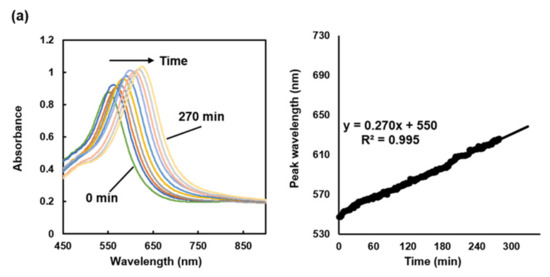
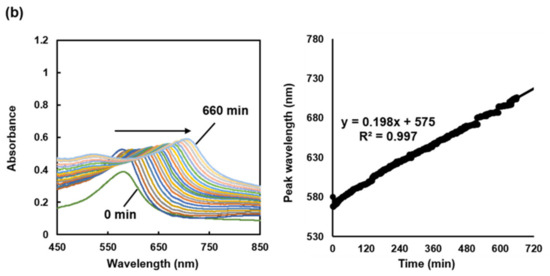
Figure 5.
Field test on SPR sensor with 30 nm thick gold thin film immersed in raw brine for (a) 270 min and (b) 660 min. The left and right columns are the absorption spectra and the peak wavelengths versus the immersion duration, respectively.
In the pH 5-adjusted brine, the SPR peak slightly shifts by 4 nm at 270 min after sensor immersion, and the SPR sensor exhibits a minimal response (Figure 6). These results are similar to those for the conventional sensor. In the experiments in the raw brine, the SPR sensor responds immediately after its immersion, whereas the conventional sensor responds to the light intensity changes with scale formation after approximately 100 min.
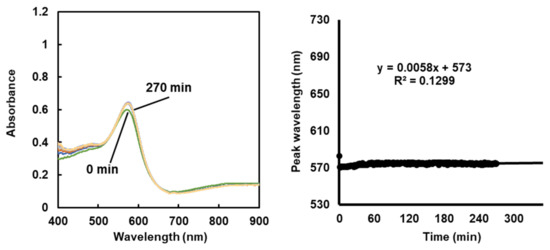
Figure 6.
Results of field tests on SPR sensor with 30 nm thick gold thin film in pH 5-adjusted brine.
4.3. SEM-EDS Observation of Precipitates on Sensor
The precipitates on the sensors after the field tests were observed through SEM-EDS, and their surface morphology and chemical composition were analyzed (Figure 7 and Table 2). In the raw brine, both the conventional and SPR sensors had uniform films of deposited scale. More scale was deposited onto the conventional sensor after a long immersion period (Figure 7a). By contrast, the SPR sensor immersed in the pH 5-adjusted brine had no precipitates. The conventional sensor in the pH 5-adjusted brine had a small amount of precipitates because the sulfuric acid could not be pumped for pH adjustment in the latter half of the experiment.
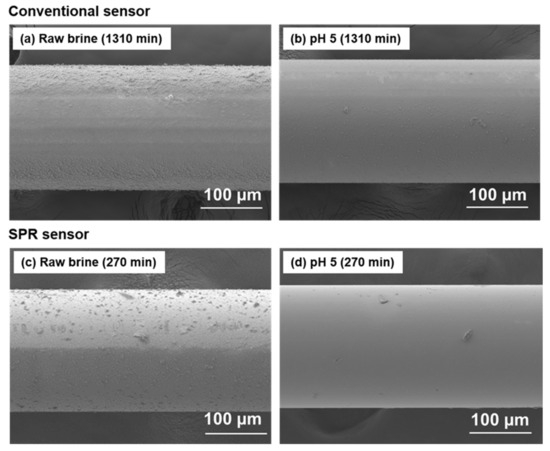
Figure 7.
SEM images of scale adhered to surfaces of sensing areas of conventional and SPR sensors after field experiments. Conventional sensor with exposed core soaked in (a) raw brine for 1310 min and (b) pH 5-adjusted brine for 1310 min. SPR sensor soaked in (c) raw brine for 270 min and (d) pH 5-adjusted brine for 270 min.
Table 2.
Chemical composition of precipitates on sensors. Conventional sensor in (a) raw brine for 1310 min and (b) pH 5-adjusted brine for 1310 min, and (c) SPR sensor in raw brine for 270 min and (d) pH 5-adjusted brine for 270 min.
The chemical composition of the precipitates on the conventional sensor included Mg and Fe in addition to Si. According to the scale survey results obtained by Morita et al. [34], this precipitate is Mg-SiO2. A small amount of precipitate containing Mg and Fe was detected on the SPR sensor because of the short test duration. The pH of the pH 5-adjusted brine during the experiment with the conventional sensor was equal to that of the raw brine. Therefore, in addition to Si, Mg and Fe were detected in the precipitate on the sensor. By contrast, trace amounts of Mg and Fe were observed in the precipitate on the SPR sensor.
4.4. SPR Simulation
A possible reason for the shift of the SPR peak to longer wavelengths is the formation of scale films with different thicknesses associated with the immersion duration of the SPR sensor in the brine. The simulation of the sensor response was performed by using Scilab 2024.1.0. A four-layer structure (glass/gold/scale/water) was modeled to predict the extent of the peak shift using the SPR numerical method (Figure 8a). The structure consisted of glass (fiber core; 0), an SPR excitation layer (gold layer; 1), a scale layer (2), and water, i.e., brine (3). The dielectric constant of each layer was εn (n = 0, 1, 2, 3), and the thicknesses of the gold and scale layers were dAu and dscale, respectively. In the planar optical configuration shown in Figure 8a, the incident light is reflected at the interface between the core surface and the gold layer at an angle θ, satisfying the total reflection condition. With the appropriate thickness of the multilayer structure, the evanescent light produced by the total reflection can extend to the gold layer and reach the outer boundary (brine). SPR occurs when the x-direction wavenumber of the incident light coincides with that of the surface plasmon wave at the core-gold interface. The reflection coefficient of the multilayer structure in the SPR numerical calculation was calculated using a general 2 × 2 matrix formula (transfer matrix method) [35]. During the numerical calculations, the refractive indices of the cladding and the scale (talc) were set to 1.46 and 1.59, respectively, and the dielectric constant of gold was obtained from the literature [36].
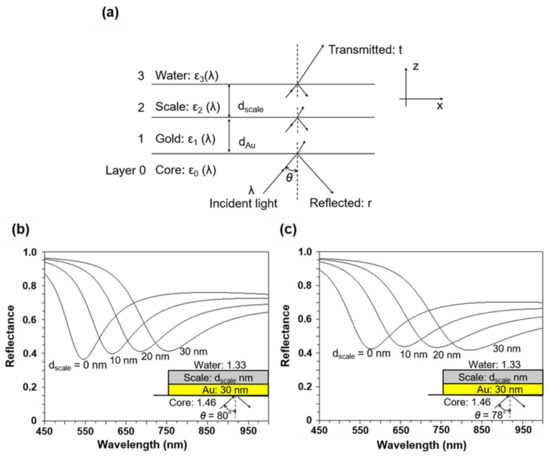
Figure 8.
(a) Four-layer system for SPR numerical calculation: 0: glass (fiber core); 1: SPR excitation layer (gold layer); 2: scale layer; and 3: water. ε (λ) is the layer permittivity, and d is the layer thickness. Theoretical SPR spectra of SPR sensor with multilayer film (30 nm Au/dscale nm scale) with single reflection angle of (b) 80° and (c) 78° for water.
Contrary to the case of the planar layer in Figure 8a, the cylindrical fiber core has different angles between the critical angle and 90°. Therefore, the SPR spectrum obtained in the experiment is the sum of the SPR spectra for the various incident angles. Figure 8b and Figure 8c show the SPR resonance wavelength spectra at dAu = 30 nm, dscale = 0, 10, 20, 30 nm, and incident angle θ = 80°, 78°. The SPR wavelength shifts toward longer wavelengths with an increase in the scale thickness regardless of the incident angle. In addition, the SPR spectral width widens with an increase in scale thickness (Figure 8b). The increase in film thickness with scale formation is attributed to this sensor response.
5. Conclusions
We developed an optical fiber sensor that can detect scale formation in geothermal power plants using SPR as a first attempt. The SPR scale sensor developed in this research can rapidly detect and measure precipitates on the Mg-SiO2 scale with dramatically greater sensitivity than conventional optical fiber scale sensors, which have been reported on by our research group. In addition, since the SPR reflects the ambient refractive index, the refractive index of the scale can be estimated once the response reaches equilibrium with respect to scale precipitation. This sensor not only has the potential to rapidly monitor the formation of various scale species in hydrothermal fluids used for geothermal power generation, but could also be useful in the evaluation of concretionary processes and in the field of CCS using mineralization reactions.
Author Contributions
A.H. and K.S. wrote the manuscript and performed the experiments. A.H., H.Y., T.O. and A.U. provided support for the experiments and prepared the manuscript. A.H. and H.K. acted as the corresponding authors, supervising the overall research and the manuscript preparation. A.T. was responsible for the project on which this study is based. All authors have read and agreed to the published version of the manuscript.
Funding
Funding was provided by the JOGMEC project investigation within the R&D project “Carbon Recycling CO2 Geothermal Power Generation Technology”. A part of this study was re-commissioned by Taisei Corporation as a part of JOGMEC project.
Data Availability Statement
The data are contained within the article.
Acknowledgments
We would like to thank SymEnergy Corporation, especially T. Kadoma and H. Mochizuki, for the supply of test brine, the use of their facilities, and their extensive advice and support for our field experiments at the Obama Binary Power Plant. We also thank the members of the University of Toyama, especially T. Takenaka, M. Kusakabe, S. Unami, Y. Hoshino, and S. Satake, for their guidance and cooperation during the field experiments. We would like to thank the members of JOGMEC and Taisei Corporation for their cooperation, advice, and comments.
Conflicts of Interest
The authors declare no conflicts of interest.
References
- Pátzay, G.; Stáhl, G.; Kármán, F.H.; Kálmán, E. Modeling of scale formation and corrosion from geothermal water. Electrochim. Acta 1998, 43, 137–147. [Google Scholar] [CrossRef]
- Dalas, E.; Koutsopoulos, S. The effect of UV radiation on calcium carbonate scale formation. J. Colloid Interface Sci. 1993, 155, 512–514. [Google Scholar] [CrossRef]
- Gallup, D.L. Brine pH modification scale control technology. Geotherm. Resour. Counc. Trans. 1996, 20, 749–755. [Google Scholar]
- Gallup, D.L. The interaction of silicic acid with sulfurous acid scale inhibitor. Geotherm. Resour. Counc. Trans. 1997, 21, 49–53. [Google Scholar]
- Gallup, D.L. Investigations of organic inhibitors for silica scale control in geothermal brines. Geothermics 2002, 31, 415–430. [Google Scholar] [CrossRef]
- Ueda, A.; Kato, H.; Miyauchi, T.; Kato, K. Investigation of pH control method to avoid silica scaling in the Sumikawa geothermal field. J. Geotherm. Res. Soc. Jpn. 2003, 25, 163–177. [Google Scholar] [CrossRef]
- MacAdam, J.; Parsons, S.A. Calcium carbonate scale formation and control. Rev. Environ. Sci. Biotechnol. 2004, 3, 159–169. [Google Scholar] [CrossRef]
- Gallup, D.L.; Barcelon, E. Investigations of organic inhibitors for silica scale control from geothermal brines—II. Geothermics 2005, 34, 756–771. [Google Scholar] [CrossRef]
- Li, X.; Gao, B.; Yue, Q.; Ma, D.; Rong, H.; Zhao, P.; Teng, P. Effect of six kinds of scale inhibitors on calcium carbonate precipitation in high salinity wastewater at high temperatures. J. Environ. Sci. 2015, 29, 124–130. [Google Scholar] [CrossRef]
- Li, J.; Zhou, Y.; Yao, Q.; Wang, T.; Zhang, A.; Chen, Y.; Wu, W.; Sun, W. Preparation and evaluation of a polyether-based polycarboxylate as a kind of inhibitor for water systems. Ind. Eng. Chem. Res. 2017, 56, 2624–2633. [Google Scholar] [CrossRef]
- Alabi, A.; Chiesa, M.; Garlisi, C.; Palmisano, G. Advances in anti-scale magnetic water treatment. Environ. Sci. Water Res. Technol. 2015, 1, 408–425. [Google Scholar] [CrossRef]
- Ikeda, R.; Ueda, A. Experimental field investigations of inhibitors for controlling silica scale in geothermal brine at the Sumikawa geothermal plant, Akita Prefecture, Japan. Geothermics 2017, 70, 305–313. [Google Scholar] [CrossRef]
- Hanajima, E.; Ueda, A. Recovery of oversaturated silica from Takigami and Sumikawa geothermal brines with cationic polymer flocculants to prevent silica scale deposition. Geothermics 2017, 70, 271–280. [Google Scholar] [CrossRef]
- Hirowatari, K. Scale prevention method by brine acidification with biochemical reactors. Geothermics 1996, 25, 259–270. [Google Scholar] [CrossRef]
- Okazaki, T.; Imai, K.; Tan, S.Y.; Yong, Y.T.; Rahman, F.A.; Hata, N.; Taguchi, S.; Ueda, A.; Kuramitz, H. Fundamental study on the development of fiber optic sensor for real-time sensing of CaCO3 scale formation in geothermal water. Anal. Sci. 2015, 31, 177–183. [Google Scholar] [CrossRef] [PubMed]
- Okazaki, T.; Orii, T.; Ueda, A.; Kuramitz, H. A reusable fiber optic sensor for the real-time sensing of CaCO3 scale formation in geothermal water. IEEE Sens. J. 2017, 17, 1207–1208. [Google Scholar] [CrossRef]
- Okazaki, T.; Orii, T.; Ueda, A.; Ozawa, A.; Kuramitz, H. Fiber optic sensor for real-time sensing of silica scale formation in geothermal water. Sci. Rep. 2017, 7, 3387. [Google Scholar] [CrossRef] [PubMed]
- Okazaki, T.; Yamamoto, T.; Taguchi, A.; Ueda, A.; Kuramitz, H. Fiber optic sensor with an optically transparent electrode for monitoring CaCO3 scale formation in geothermal water. IEEE Sens. Lett. 2017, 1, 2000104. [Google Scholar] [CrossRef]
- Okazaki, T.; Umeki, S.; Orii, T.; Ikeya, R.; Sakaguchi, A.; Yamamoto, T.; Watanabe, T.; Ueda, A.; Kuramitz, H. Investigation of the effects of electromagnetic field treatment of hot spring water for scale inhibition using a fibre optic sensor. Sci. Rep. 2019, 9, 10719. [Google Scholar] [CrossRef]
- Okazaki, T.; Seto, R.; Watanabe, T.; Ueda, A.; Kuramitz, H. U-shaped polymer cladding and hetero-core fiber optic sensors for monitoring scale formation in geothermal brine. Anal. Lett. 2020, 53, 2160–2169. [Google Scholar] [CrossRef]
- Okazaki, T.; Kuramitz, H.; Watanabe, T.; Ueda, A. Scale sensor: Rapid monitoring of scale deposition and inhibition using fiber optics in a geothermal system and comparison with other monitoring devices. Geothermics 2021, 93, 102069. [Google Scholar] [CrossRef]
- Okazaki, T.; Kamio, H.; Yoshioka, H.; Ueda, A.; Kuramitz, H.; Watanabe, T. U-shaped plastic optical fiber sensor for scale deposition in hot spring water. Anal. Sci. 2022, 38, 1549–1554. [Google Scholar] [CrossRef]
- Zotzmann, J.; Hastreiter, N.; Mayanna, S.; Reinsch, T.; Regenspurg, S. A fibre-optical method for monitoring barite precipitation at high pressure/high temperature conditions. Appl. Geochem. 2021, 127, 104906. [Google Scholar] [CrossRef]
- Qu, J.-H.; Dillen, A.; Saeys, W.; Lammertyn, J.; Spasic, D. Advancements in SPR biosensing technology: An overview of recent trends in smart layers design, multiplexing concepts, continuous monitoring and in vivo sensing. Anal. Chim. Acta 2020, 1104, 10–27. [Google Scholar] [CrossRef] [PubMed]
- Zhao, Y.; Tong, R.-J.; Xia, F.; Peng, Y. Current status of optical fiber biosensor based on surface plasmon resonance. Biosens. Bioelectronics 2019, 142, 111505. [Google Scholar] [CrossRef] [PubMed]
- Chen, C.; Wang, J. Optical biosensors: An exhaustive and comprehensive review. Analyst 2020, 145, 1605–1628. [Google Scholar] [CrossRef]
- Tabassum, R.; Kant, R. Recent trends in surface plasmon resonance based fiber-optic gas sensors utilizing metal oxides and carbon nanomaterials as functional entities. Sens. Actuators B Chem. 2020, 310, 127813. [Google Scholar] [CrossRef]
- Lee, S.; Song, H.; Ahn, H.; Kim, S.; Choi, J.-r.; Kim, K. Fiber-Optic Localized Surface Plasmon Resonance Sensors Based on Nanomaterials. Sensors 2021, 21, 819. [Google Scholar] [CrossRef]
- Duan, Q.; Liu, Y.; Chang, S.; Chen, H.; Chen, J.-h. Surface Plasmonic Sensors: Sensing Mechanism and Recent Applications. Sensors 2021, 21, 5262. [Google Scholar] [CrossRef]
- Herrera-Domínguez, M.; Morales-Luna, G.; Mahlknecht, J.; Cheng, Q.; Aguilar-Hernández, I.; Ornelas-Soto, N. Optical biosensors and their applications for the detection of water pollutants. Biosensors 2023, 13, 370. [Google Scholar] [CrossRef]
- Kourti, D.; Angelopoulou, M.; Petrou, P.; Kakabakos, S. Optical immunosensors for bacteria detection in food matrices. Chemosensors 2023, 11, 430. [Google Scholar] [CrossRef]
- Wang, Q.; Zhang, D.; Qian, Y.; Yin, X.; Wang, L.; Zhang, S.; Wang, Y. Research on fiber optic surface plasmon resonance biosensors: A review. Photonic Sens. 2024, 14, 240201. [Google Scholar] [CrossRef]
- Ueda, A.; Odashima, Y. Experimental study of stability of amorphous Mg-SiO2 scale up to 300 °C. J. Geotherm. Res. Soc. Jpn 2002, 24, 207–213, (In Japanese with English Abstract). [Google Scholar]
- Morita, M.; Umezawa, O. A model of scale formation on inner carbon steel pipe walls for transporting hot spring water. Mater. Trans. 2016, 57, 1652–1659. [Google Scholar] [CrossRef]
- Roy, D. Surface plasmon resonance spectroscopy of dielectric coated gold and silver films on supporting metal layers: Reflectivity formulas in the kretschmann formalism. Appl. Spectrosc. 2001, 55, 1046–1052. [Google Scholar] [CrossRef]
- Sharma, A.K.; Gupta, B.D. On the performance of different bimetallic combinations in surface plasmon resonance based fiber optic sensors. J. Appl. Phys. 2007, 101, 09311. [Google Scholar] [CrossRef]


Disclaimer/Publisher’s Note: The statements, opinions and data contained in all publications are solely those of the individual author(s) and contributor(s) and not of MDPI and/or the editor(s). MDPI and/or the editor(s) disclaim responsibility for any injury to people or property resulting from any ideas, methods, instructions or products referred to in the content. |
© 2024 by the authors. Licensee MDPI, Basel, Switzerland. This article is an open access article distributed under the terms and conditions of the Creative Commons Attribution (CC BY) license (https://creativecommons.org/licenses/by/4.0/).