Review

Recovery of N-Methylmorpholine N-Oxide (NMMO) in Lyocell Fibre Manufacturing Process

1
Department of Human Ecology, University of Alberta, Edmonton, AB T6G 2N1, Canada
2
Department of Agricultural, Food and Nutritional Science, University of Alberta, Edmonton, AB T6G 2P5, Canada
3
Davey Textile Solutions, Edmonton, AB T5P 4W2, Canada
*
Author to whom correspondence should be addressed.
Fibers 2025, 13(1), 3; https://doi.org/10.3390/fib13010003
Submission received: 11 November 2024 / Revised: 5 December 2024 / Accepted: 31 December 2024 / Published: 6 January 2025

Highlights

What are the main findings?
  • We developed a calibration curve for the determination of N-methyl-morpholine-N-oxide (NMMO) content in aqueous solutions using Fourier Transform Infrared Spectroscopy (FTIR).
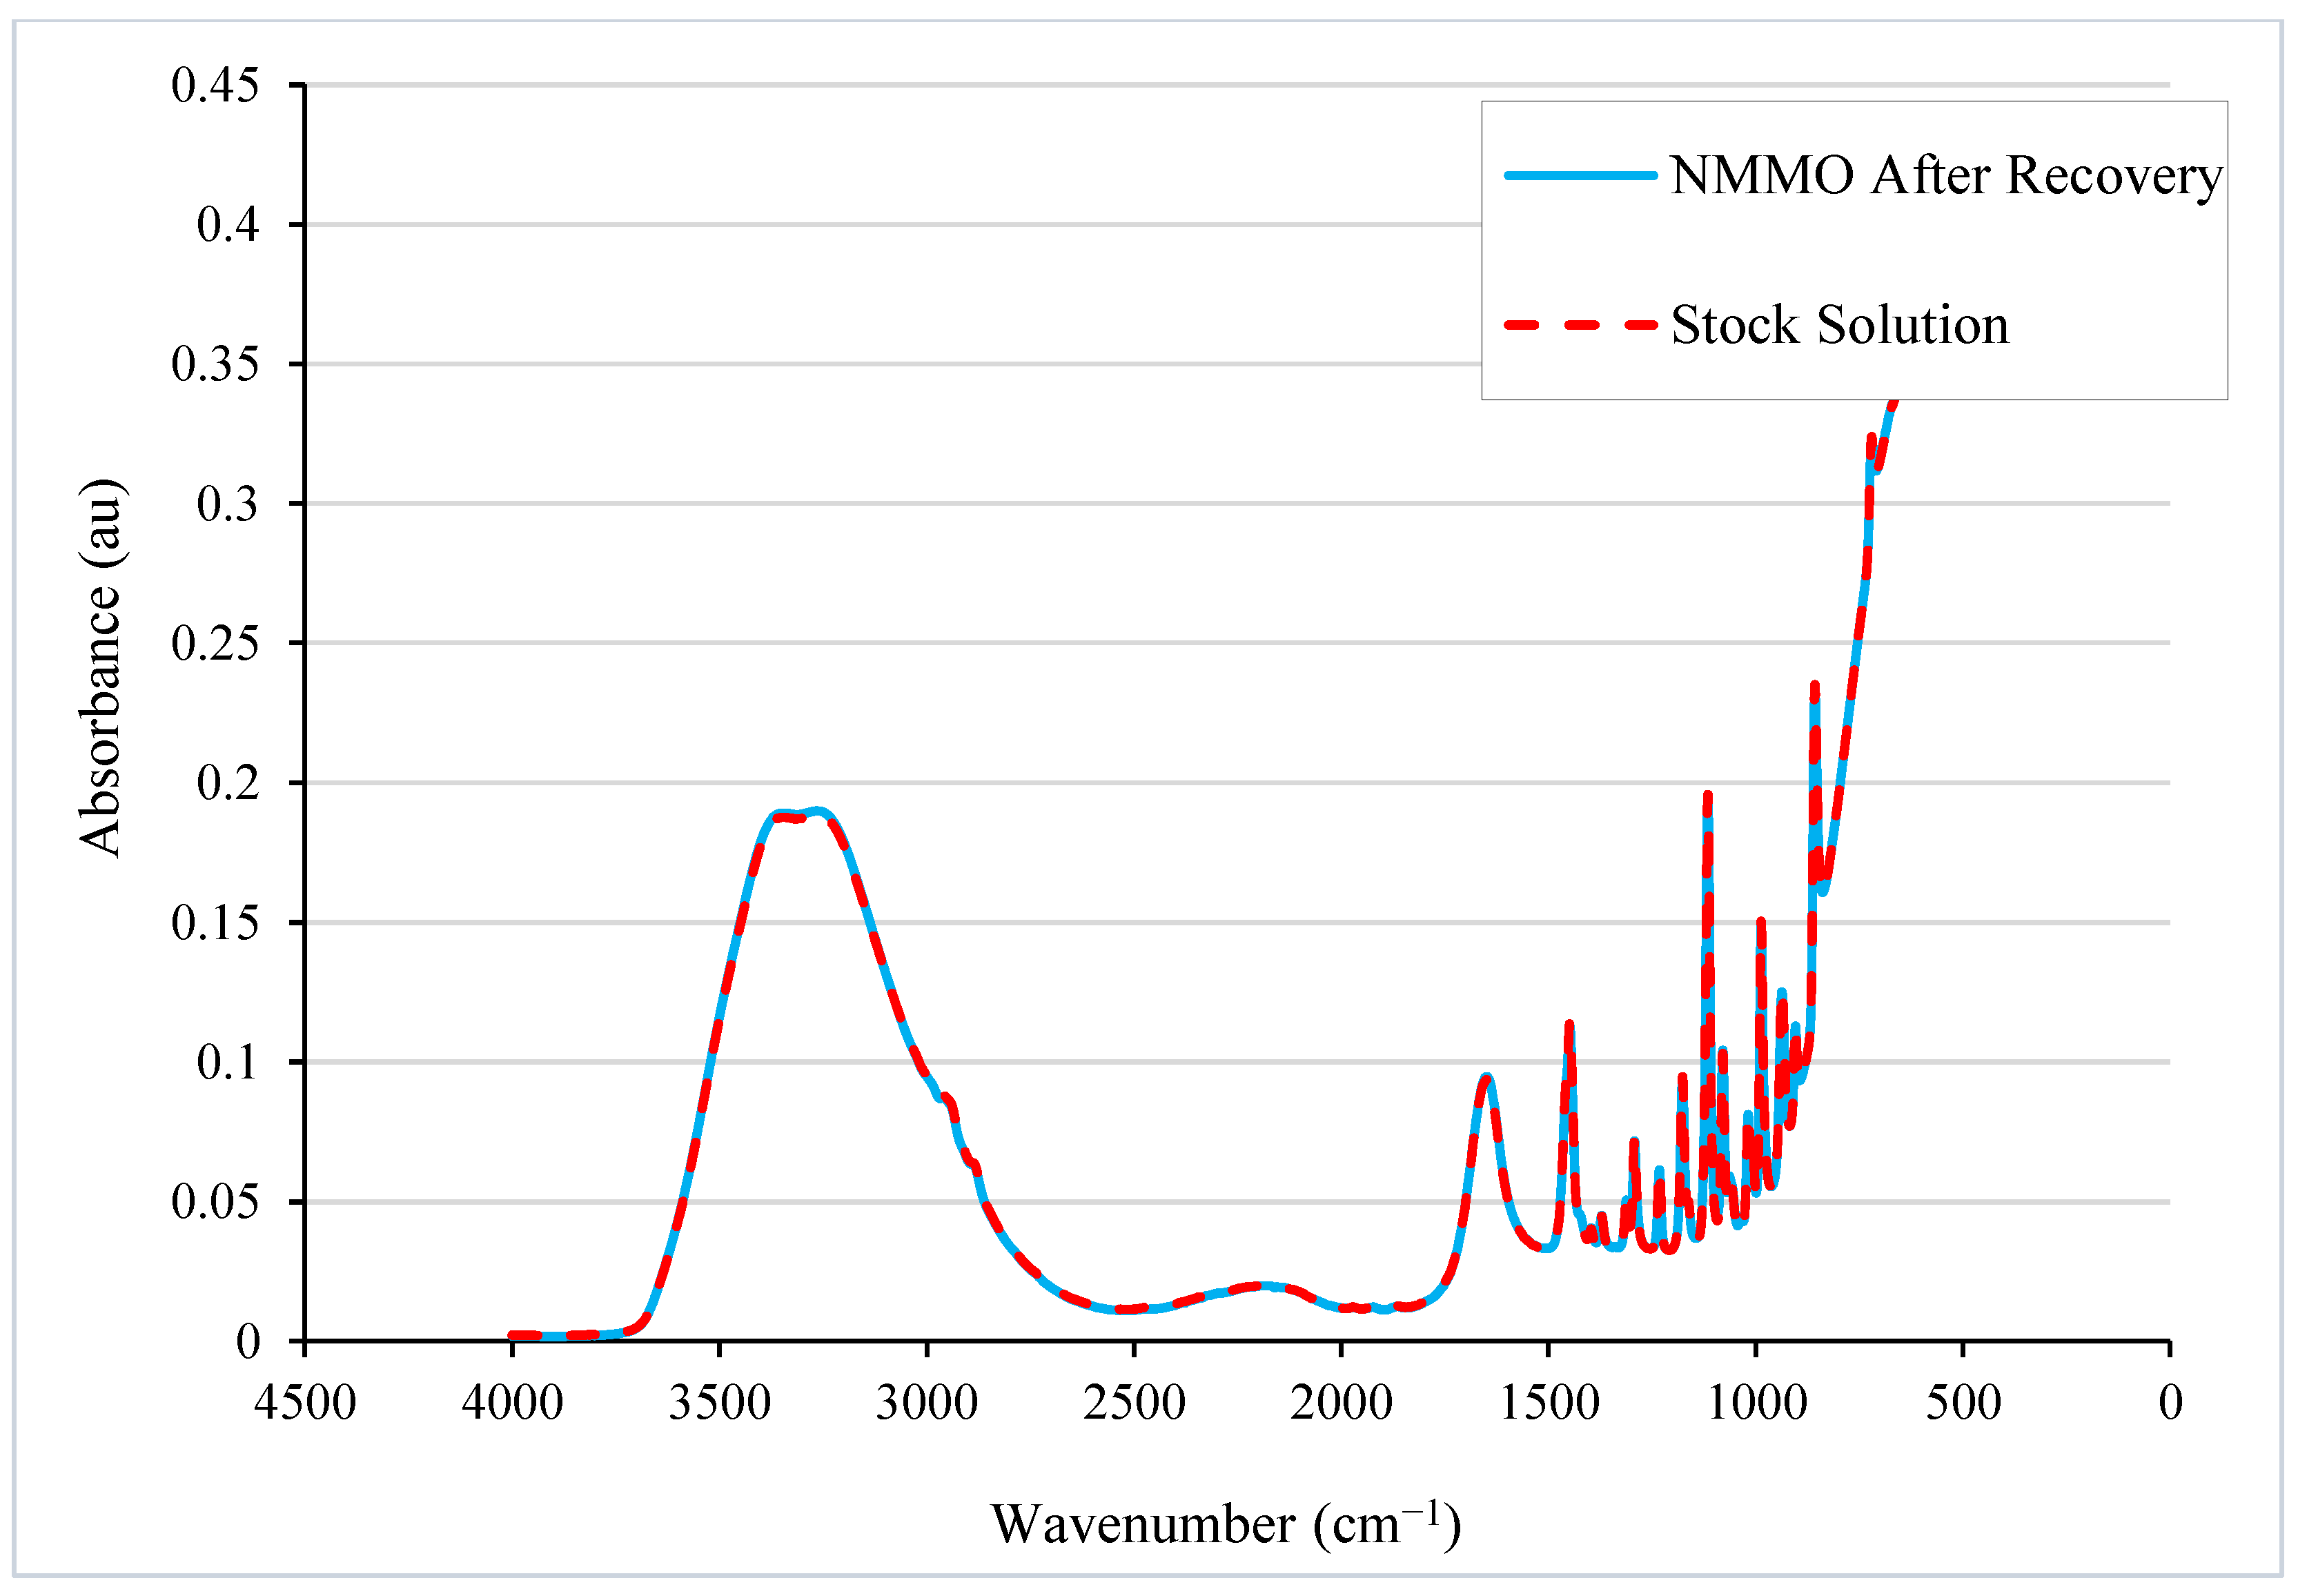
  • We successfully recovered used NMMO from lab-scale lyocell manufacturing wastewater through evaporation using a rotary evaporator without degrading the NMMO.
What is the implication of the main finding?
  • This first comprehensive survey of the NMMO recovery processes and characterization techniques will guide the industry’s advances in L-MMCF manufacturing.
  • The FTIR NMMO calibration curve provides an easy strategy to monitor the NMMO content in wastewater and optimize the L-MMCF manufacturing process.

Abstract

:
The lyocell process offers an environmentally friendly strategy to produce regenerated cellulose fibre from biomass. However, it is critical to recover and reuse the N-methyl-morpholine-N-oxide (NMMO) solvent to maximize the environmental benefits and lower the cost. This article reviews NMMO recovery and characterization techniques at the lab and industrial scales, and methods to limit the NMMO degradation during the process. The article also presents the results of a pilot study investigating the recovery of NMMO from lyocell manmade cellulosic fibre (L-MMCF) manufacturing wastewater. The work described includes the development of a calibration curve for the determination of NMMO content in aqueous solutions using Fourier Transform Infrared Spectroscopy (FTIR). Successful NMMO recovery from the wastewater was achieved using a rotary evaporator: the final NMMO concentration was 50, i.e., ready for use in the lyocell process, and no NMMO degradation was observed. The knowledge in this paper will support advances in L-MMCF manufacturing and the reduction in textile environmental footprint.

1. Introduction

Cellulose is naturally abundant within the environment [1]. It can be converted into ethers, esters, or regenerated materials. To produce regenerated materials, cellulose pulp is dissolved in a solvent to create dope, which is then spun to produce fibre [2]. The polysaccharide cellulose is made from beta-glucose molecules. They are joined together with hydrogen bonds, resulting in a crystallized structure not soluble in water [3]. Thus, nonaqueous solvents must be used for cellulose pulping dissolution [4]. Solvents containing tertiary amine oxides have successfully dissolved up to 23% pulp, making them useful solvents to produce cellulosic regenerated materials [5].
Various regenerated materials have been produced. Historically, viscose rayon has been the most widely used cellulose-regenerated material [1]. The viscose rayon process uses carbon disulfide (CS2) to derivatize cellulose pulp by converting it into cellulose xanthate (xanthation process) to prepare the pulp for dissolution in sodium hydroxide [6]. Unfortunately, CS2 is toxic to both the environment and human health. Approximately 25–35% of carbon disulfide is not recoverable, and the viscose process results in 200–300 t of wastewater per one ton of viscose produced [6,7]. Consequently, modern scientific advances are being used to reexamine regenerated cellulosic processes to look for alternatives to viscose [8].
Lyocell manmade cellulosic fibres (L-MMCF) offer an alternative fibre to viscose because it is a purely physical, non-derivatized process [4]. To dissolve the pulp, the solvent N-methyl-morpholine-N-oxide (NMMO) is used. It is part of the tertiary amine oxide family, composed of a combination of oxidized hydrogen peroxide and the tertiary amine N-methylmorpholine. Structurally, it proves particularly useful for dissolving cellulose pulps due to the coordinate-covalent bond between nitrogen and oxygen (Figure 1). The N-O bond has a dipole moment of 4.38 mD, making it extremely energy-rich [9]. This bond allows NMMO to dissolve cellulose without any further processing. Thus, it is possible to create a regenerated fibre using a closed-loop solvent recovery system.
Despite NMMO’s high cost, techno-economic studies based on simulations have demonstrated the prospect of the lyocell process if NMMO’s production and recovery are optimized [10,11]. To contribute to this effort and foster the adoption of the lyocell process in the textile industry, this article reviews the current literature on the different aspects of NMMO recovery and reuse after a brief overview of NMMO use in the lyocell process. The paper also describes the results of a pilot study featuring a lab-scale NMMO recovery trial for NMMO content determination in L-MMCF wash water and L-MMCF prototype samples. It ends with a discussion about avenues of further research.

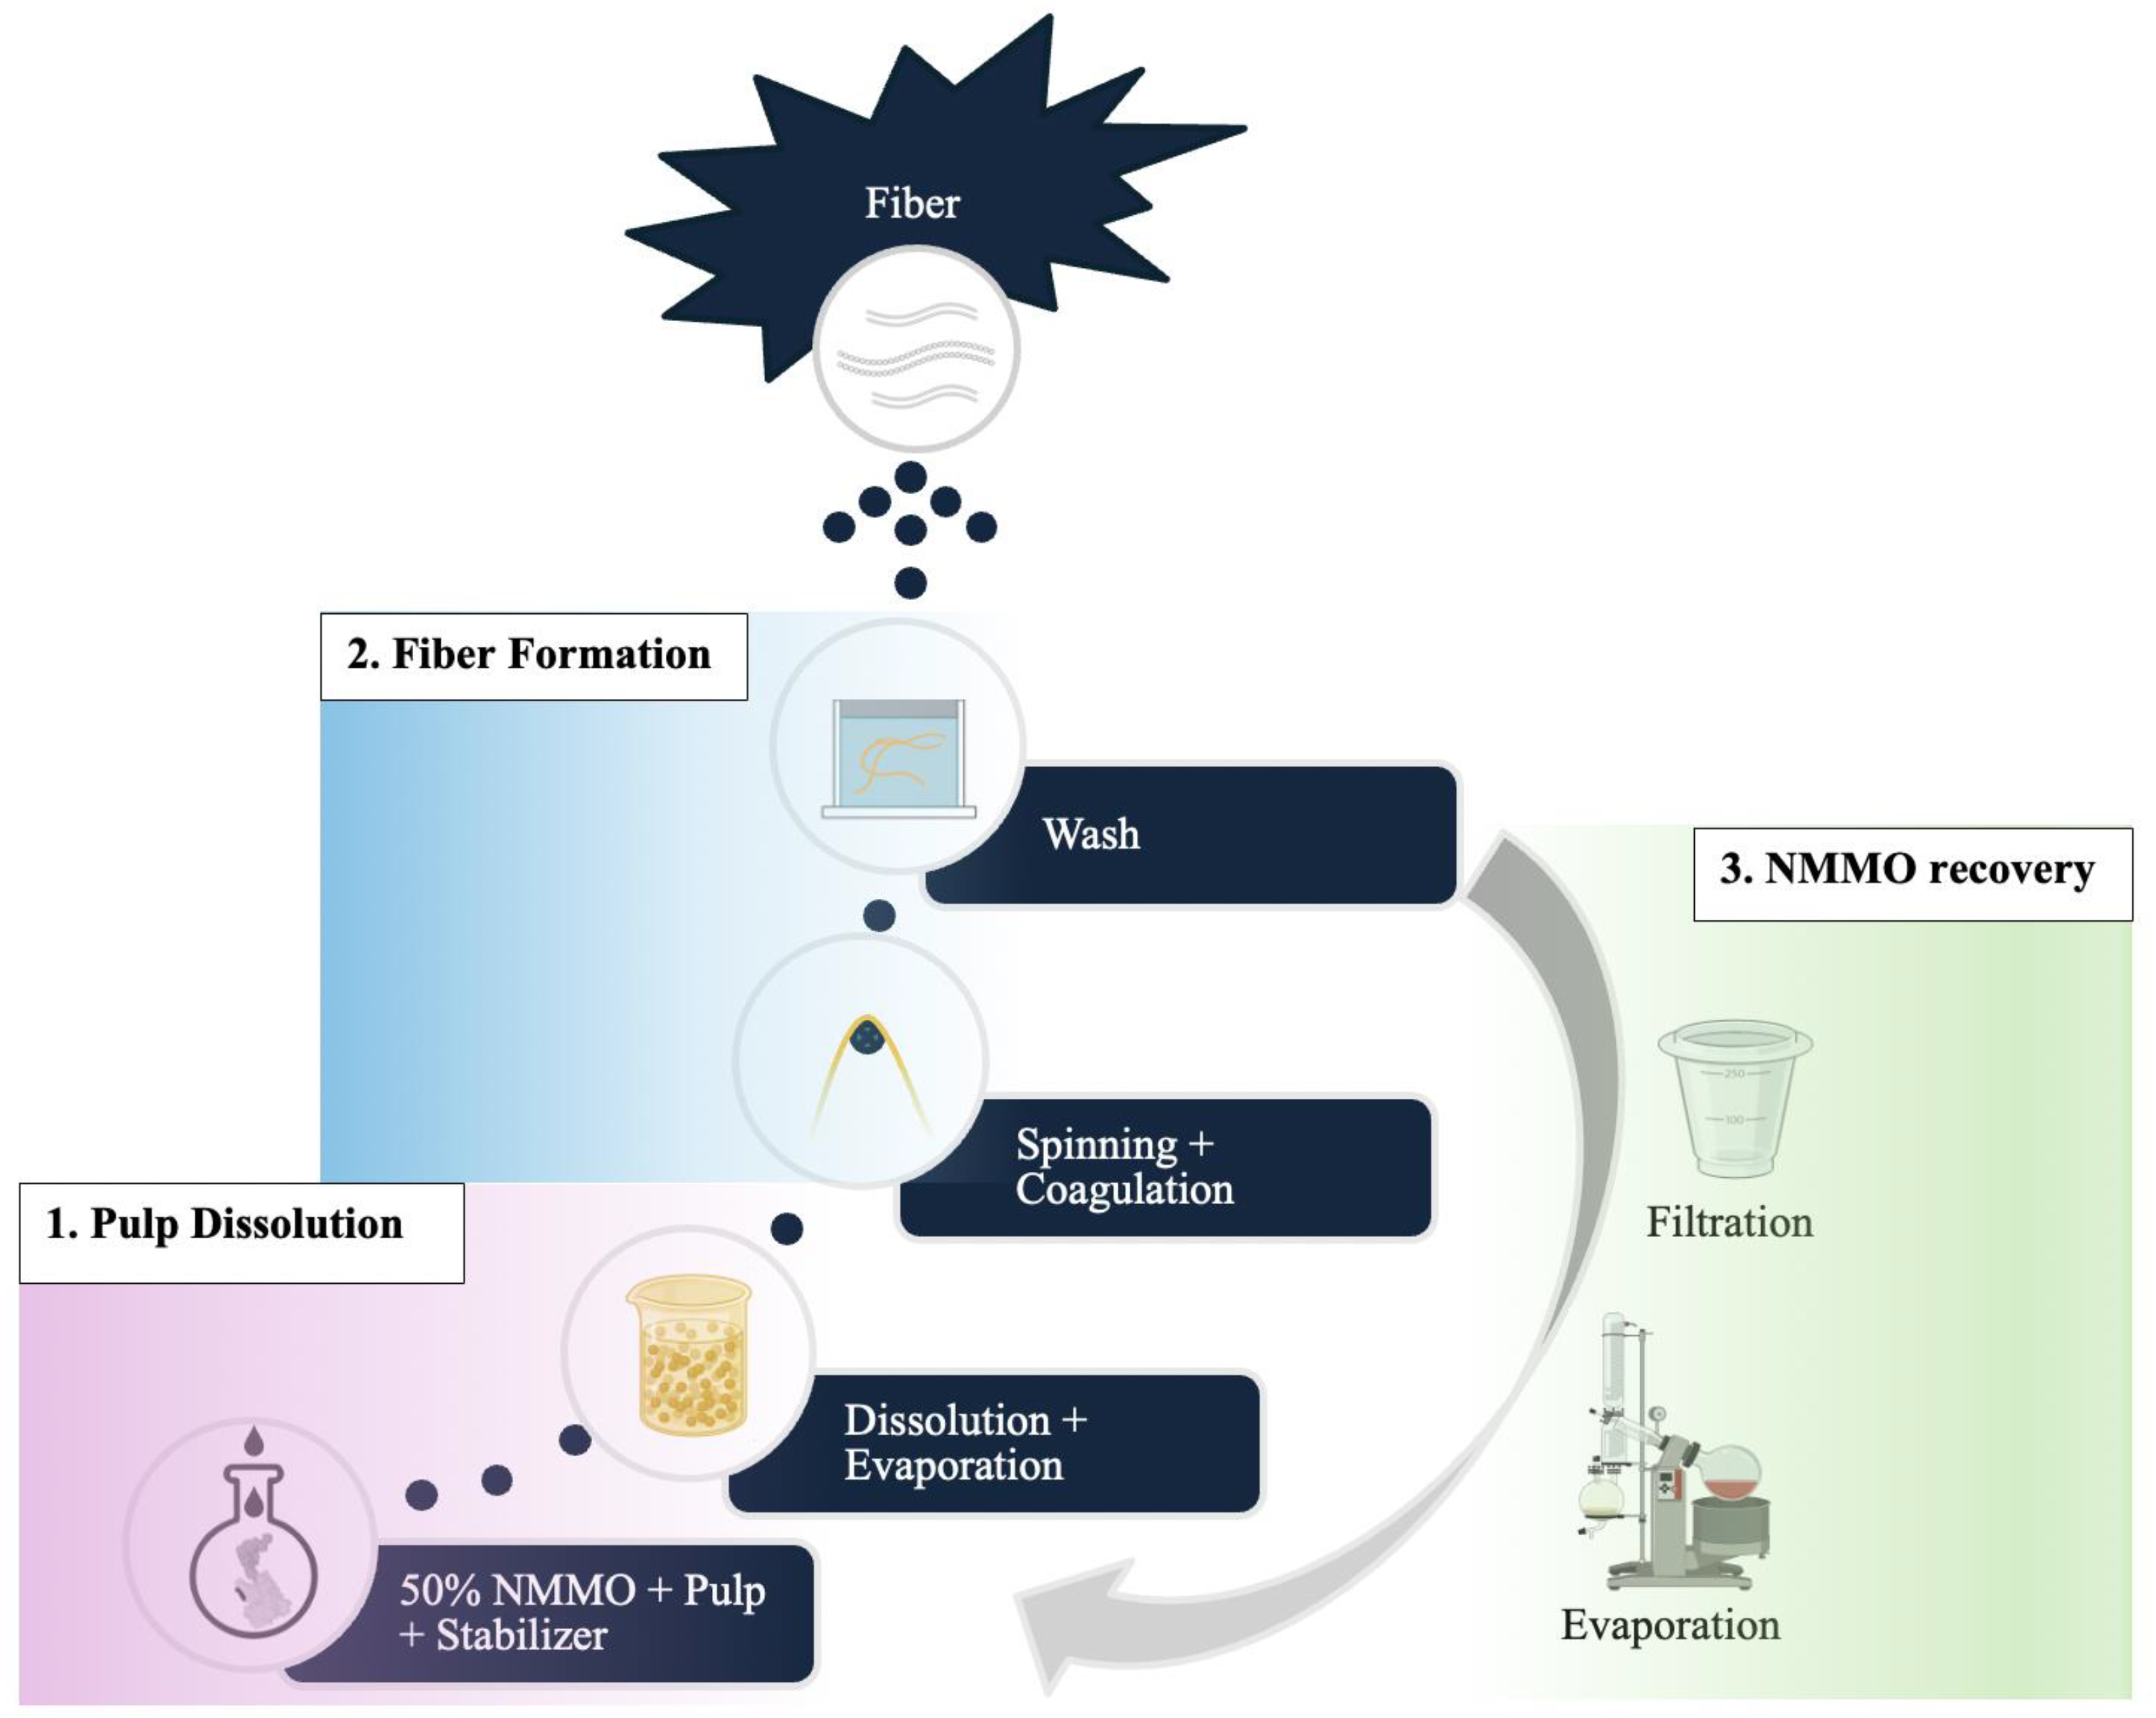
2. L-MMCF Manufacturing Process

Courtaulds Fibres was the first commercial L-MMCF fibre manufacturer [1,3,12]. They started pilot work in the early 1980s. Lenzing optimized the process and is currently the leading global lyocell producer. Other manufacturers, such as the Thuringian Institute for Textile and Plastics Research (TITK) Rudolstadt (research facility, lab- and pilot-scale production), Akzo Nobel, Greencell, Grasim, Shanghi Leo, Baoding Swen, Xinxiang Bailu, and Shandong Yingi, have more recently released products to the market [1,3,6,12,13]. There is also Birla Cellulose, which manufactures L-MMCF under Birla Excel™. The popularity of L-MMCF is trending upward, with a projected compound annual growth rate (CAGR) of 7.0% from years 2024 to 2030 [14,15]. The L-MMCF production process includes three main steps: pulp dissolution, fibre formation, and NMMO recovery (Figure 2).

2.1. Pulp Dissolution

The first step in the L-MMCF process is to dissolve the cellulosic pulp in NMMO monohydrate [16]. It involves a swelling and a dissolution stage. Pure NMMO has a melting point of 170 °C [17,18]. However, when combined with 13.3 wt% of water, its melting point reduces to 74 °C [2]. This melting point can be further reduced as more water is added. As a result, NMMO is commercially available in a 50% aqueous solution due to ease of handling. Cellulose pulp feedstock for lyocell dope preparation can swell in a 50% NMMO-water solution [19]. Swelling is essential for the NMMO to penetrate the cellulose inter- and intra-crystallinity structures [1,20,21]. In laboratory settings, scientists generally use up to 9% cellulose concentrations [17,22], while in commercial settings, concentrations of 10–20% cellulose are typically used [19].
After the swelling stage, water from the slurry is evaporated [16,17,22,23,24]. As the NMMO concentration increases, dissolution of the cellulose pulp takes place once the NMMO concentration exceeds 79% [20]. Using a molecular dynamics simulation, Deng et al. [25] demonstrated that dissolution is due to NMMO breaking the -OH bond in cellulose and forming new spontaneous hydrogen bonds between the cellulose and NMMO. Some publications mention that dissolution should take place between 90 and 120 °C [26]; however, other researchers specify that dissolution should not be performed at a temperature above 85 °C to avoid degradation of NMMO and chromophore formation [11,17,27,28]. More importantly, if NMMO reaches 150 °C, there is a risk of thermal runaway reaction [24]. In this case, the solution rapidly self-heats to a temperature of approximately 250 °C, resulting in an exothermic reaction due to its energy-rich N-O bond, which releases 222 kJ/mol when cleaved [24,29,30,31,32]. However, even at temperatures lower than 120 °C, degradation of NMMO can result from side reactions resulting from the interactions between cellulose and NMMO and water and NMMO [33].
To limit the amount of degradation and risk of an exothermic reaction during the evaporation process, the use of vacuum was introduced in 1979 [2,5,34]. The use of vacuum lowers the boiling point of water, which allows conducting the evaporation process at a lower temperature and reduces the risk of NMMO degradation. Current techniques involve wiped film, propulsive, and rotary evaporators [10,11]. In rotary evaporators, a low vacuum between 15 and 30 mmHg is typically applied in combination with temperatures ranging between 80 and 100 °C for 240 min [17,22,23,35]. Other methods mentioned include a twin-screw extruder dissolution system [36] and a kettle-type dissolution system [6]. Additionally, stabilizers such as the phenolic antioxidant propyl gallate (PG) are used to reduce the possibility of chemical decomposition and minimize exothermic reactions by trapping by-products [22,37]. Concentrations of PG or an alternative stabilizer are generally in the range of 0.5–2 wt% [19].
A high alpha cellulose content (>90–95%) is desired to increase the fibre’s mechanical strength [3]. This is because higher alpha-cellulose content results in a high degree of polymerization (DP). However, if the DP is too high, the cellulose will not be soluble or result in a dope too viscous to spin. The optimal DP for the lyocell process has been found to be between 650 and 750 [16,38]. This ensures proper cellulose fibre swelling and dissolution in the NMMO.

2.2. Fibre Formation

Typical commercial dope solutions have a ratio of 76% NMMO, 11–14% cellulose, and 10–12% water [2,3,24,26]. In lab settings, researchers generally use a ratio of 75–85% NMMO, 8–20% cellulose content, and 5–12% water [24,35,39,40]. The dope is extruded by being pushed through a spinneret at temperatures between 80 and 120 °C [6,12,36,39,41]. The extrudate is then drawn through an air gap (typically 10–50 mm) to align the cellulose chains before entering a coagulation bath comprising water at a temperature between 15 and 25 °C [6]. In a production line, the block spinneret typically has a pore diameter of 4–100 μm [6,42]. The high pressure from the spinneret helps the dissolved cellulose polymerize and create a highly oriented, regenerated cellulose structure [43].
The strength and crystallinity of the regenerated fibres are also affected by the spinning and draw speed [44]. Tension is applied to the fibre by the drawing arm to further align the polymer chains. In the water bath, the NMMO leaches out of the lyocell fibre and dissolves in the water due to a higher affinity with water than cellulose [6,12,24]. This affinity is due to the highly polar N-O bonds, lending it to be highly hydrophilic. The hydrogen bonds between NMMO and cellulose get destroyed when water/NMMO concentration is above 23% [45].
During the fibre formation process, cellulose I with its trans-gauche (tg) structure is converted to cellulose II, characterized by a gauche-trans (gt) structure (Figure 3) [25,38,46]. The transition from cellulose I to cellulose II is irreversible [47]. It has been hypothesized that this irreversibility is due to cellulose II having a more stable structure (i.e., antiparallel chain stacking) than the cellulose I structure (i.e., parallel chain stacking) [48].

2.3. Solvent Recovery

The ability to recover and reuse NMMO is a major advantage of the lyocell process compared to other regenerated cellulose processes [6,25,26]. In addition, residual NMMO and PG remaining in the fibre result in discoloration (yellowing) and strength reduction [3]. This recovery takes place when the fibre passes through the coagulation and washing bath. Authors have reported NMMO recovery ratios of up to 99% [20] and 99.5% [26]. This recovery process helps make the lyocell fibre economically feasible due to NMMO’s high cost [26].
Several techniques exist for solvent recovery. For instance, liquid–liquid extraction is a technique commonly used to separate and purify bioproducts in the biomass biorefinery industry as well as in the separation of organic compounds from wastewater [49,50]. In theory, liquid–liquid extraction could be used to remove water from the used NMMO solvent; it would involve the addition of a water-immiscible organic solvent to separate the water from the NMMO [51]. Drying compounds can be added to further dry the NMMO. The added drying compounds and the organic solvent would be removed through filtration and distillation. However, this method will completely remove the water content from the NMMO solvent and require the addition of water for reuse in the L-MMCF process. The addition of chemicals in the purification process may also result in contamination of the NMMO. As a result, evaporating water from the NMMO-containing water has been the most commonly used method due to the simplicity of the process [26]. However, it is energy intensive.
Initially, NMMO recovery was generally completed in a one-step process, where water would be evaporated from the NMMO-containing aqueous solution to increase NMMO concentration to 50% [52]. Techniques include film evaporation [11] and rotary evaporation [43,45]. However, the one-step process results in byproducts and chromophore formation. The presence of byproducts in the coagulation bath reduces the amount of NMMO that can be recovered, which increases the overall fibre production costs [10].
To improve the efficiency of the NMMO recovery process, researchers have explored multistage evaporation for the L-MMCF process. Multistage evaporation consists of a purification stage followed by evaporation [6]. For instance, Guo et al. describe a three-step process comprising an air floatation stage, an ion exchange stage, and an evaporation stage [26]. According to these authors, this is the best technique to industrialize the lyocell process.
For the air flotation process, flocculation precipitation and filtration in an air flotation machine have been used at industrial scales to remove contaminants in the wash bath after fibre extrusion [53]. Hemicelluloses, coloured materials in the coagulation bath, and any undissolved particle matter are examples of these contaminants [26]. Guo et al. found organic flocculants such as dicyandiamide formaldehyde to be superior to inorganic flocculants such as poly-aluminum chloride (PAC) for the purification of NMMO-containing L-MMCF wash bath solutions [26]. Both chemicals are commonly used in wastewater treatments [54].
The next step is the removal of dissolved substances, byproducts, excessive PG, and metal contaminants. Cation-anion exchange resins are often used for this purpose [10]. Guo et al. used a strongly basic macro-porous anion exchange resin and a strongly acidic cation exchange resin [26]. Both resins could be regenerated using 5% hydrochloric acid and 4% sodium hydroxide, respectively. However, NMMO cannot be 100% recovered due to the ion exchange process. The cation exchange resin absorbs some NMMO, which ends up in the hydrochloric acid used for the resin regeneration process. As a result, NMMO consumption generally varies from 0.01 to 0.03 kg per kg of fibre produced [12]. PG was one of the soluble contaminants successfully removed from the NMMO wastewater via the ion exchange process as evidenced by high-performance liquid chromatography (HPLC) combined with a 280 nm UV detector [26].
Finally, the evaporation stage is performed using multi-effect evaporation or mechanical vapor recompression (MVR) to increase NMMO concentration [26]. After this operation, the NMMO-water mixture can be reused in the lyocell process. The principal factors affecting the recovery of NMMO are the presence of contaminants and the degradation state of NMMO, e.g., due to processing at high temperature.
Using the ion-exchange recovery system proposed by Guo et al. [26], Hytönen et al. conducted a techno-economic analysis using simulations and investigated multiple NMMO recovery methods [10]. A simplified recovery system (three stages) and a base case recovery system (six stages) were compared. The first three stages consisted of using a filtration block, ion exchange, and evaporation; in the six-stage process, the last three stages recycled the NMMO back into the recovery system. The base case recovery system resulted in the highest recovery rate/cost ratio because the simplified recovery scenario was associated with higher steam demands. Additionally, the six-step recovery system resulted in a 99.5% NMMO recovery rate, while the simplified recovery system resulted in a 98.9% NMMO recovery rate. Hytönen et al. found that a decrease in NMMO recovery rate from 99.7% to 98.9% resulted in a 5.4 times increase in NMMO makeup costs.
Multistage evaporation has also been explored in lignocellulose processes [45,55]. In a techno-economic analysis, Shafei et al. demonstrated that multistage evaporation can lead to an 80% increase in efficiency, indicating that most of the NMMO energy consumption resulted when NMMO concentrations go from 70 to 86% [52].

2.4. Reuse of Recovered NMMO

The dissolution power of recovered NMMO in the lyocell process has not been described within the literature. However, related information can be found in studies on methane production as a by-product in biofuel processes [35,45]. Jeihanipour et al. used NMMO for the separation of cellulose from cotton/polyester and viscose/polyester blended textile waste [45]. The recovered cellulose was then converted to methane. The researchers did not observe any difference in methane production efficiency when NMMO was recovered via evaporation or fresh NMMO was used. Kabir et al. investigated how fresh NMMO would compare to recovered NMMO for the pretreatment of forest residues and barley straw in biofuel processes [35]. No effect of the use of recycled NMMO on methane production was observed for up to five NMMO reuse cycles in the case of barley straw. For forest residues, on the other hand, the methane production efficiency decreased by 45% and 55% after three and five NMMO reuses, respectively, compared to the use of fresh NMMO solution for the lignocellulosic material pretreatment. The researchers attributed the difference observed in the effect of NMMO reuse between barley straw and forest residues to the higher lignin content and presence of bark in the forest residues that may have led to the formation of by-products and NMMO degradation. Thus, NMMO’s potential to be recycled at a high rate would be contingent on whether the other compounds within the pulp catalyze NMMO degradation reactions [6].

3. NMMO Degradation

To produce both lyocell dope and recover NMMO, water must be evaporated (Section 2.3). While some authors mention that it is a physical process and does not result in chemical alteration [4], NMMO degradation may still occur due to the presence of contaminants in the cellulose pulp as well as the interaction of NMMO with cellulose and water (Section 2.1). NMMO can undergo homolytic reactions, which result in the cleavage of the N-O bond [24]. This is often the result of the presence of transition metals within the pulp, which can potentially lead to thermal runaway reactions. Alternatively, different heterolytic reactions can occur. NMMO could degrade into N-methylmorpholine (NMM) accompanied by cellulose reductants and/or into morpholine. NMM can be recombined with hydrogen peroxide to regenerate NMMO [24,56]. Or NMMO can undergo a Polonovski decomposition process or reaction, which involves the transformation of a tertiary amine N-oxide into an iminium ion intermediate. In this case, NMMO transforms into a carbonium–iminium ion before decomposing into morpholine and formaldehyde [17,24]. Welder et al. found that NMMO degradation mainly results from Polonovski reactions [17]. PG and other additives are used to mitigate the risk of homolytic and heterolytic reactions by neutralizing transition metals [57] and by binding to NMMO’s degraded intermediates [33].

4. NMMO Characterization

4.1. NMMO Content Measurement Techniques

Researchers have explored different techniques to characterize the NMMO content in water and solid media. When NMMO concentration is high, its content in water can be easily quantified based on density [24,58]. Rosenau et al. demonstrated that the difference between NMMO (density at 1.25 g/cm3) and water (density at 1.00 g/cm3) allows for a rough NMMO content estimation based on densitometry and refractometry [24]. However, NMMO content can be difficult to quantify when its concentration in water is very low or if it remains within the fibre itself. As a result, a variety of other techniques have been explored to characterize NMMO content (Table 1).
Differential scanning calorimetry (DSC) is one of the most common techniques used for thermal analysis [60]. It monitors the difference in heat absorbed or released between a sample and a reference when the two samples are heated and/or cooled. DSC permits fast temperature screenings with high heating rates [29,59,60]. This fact is critical to monitor autocatalytic reactions within cellulose/NMMO solutions. Wendler et al. used a DSC analysis and a mini autoclave to characterize NMMO [17]. The DSC measured initial autocatalytic degradation onsets between 140 °C (with additives) and 158 °C (without additives). Their results demonstrated the importance of additives such as PG to limit autocatalytic reactions.
HPLC is one of the most powerful laboratory chromatography techniques [61]. It separates mixtures of substances into their principal components as different components travel through the column at different rates depending on how they interact with the stationary phase of solid particles in the column. A detector then generates an electrical signal when exposed to the separated components [61]. HPLC has been successfully applied for the quantification of NMMO in solutions in lyocell production [17,62,63]. Wendler et al. combined it with a UV detector with a far-ultraviolet wavelength (192–195 nm) for improved spectral response [17]. The UV detector has also been useful in deciphering the role of PG as a stabilizer for NMMO dope solutions [24,64]. Konkin et al. combined HPLC with DSC to detect amines and aldehydes in the NMMO molecule in the fingerprint region [22]. Sohn et al. used both reverse-phase and ion-exchange HPLC to separate morpholine from NMMO [63]. Unfortunately, HPLC does not have the column separation capacity to handle contaminated samples, which does not make it useful in determining NMMO content in biorefinery processes [16].
Headspace gas chromatography (HS-GC) is another effective technique for measuring volatile substances. It has been used to investigate both NMMO and PG [16,19]. It also has a higher separation capacity on complicated samples compared to HPLC. As HS-GC only measures volatile substances, NMMO must be converted into volatile substances such as NMM before GC testing. Zhang et al. and Zeng et al. both used HS-GC to determine NMM content in NMMO-based biorefinery process solutions [16,58]. Zhang et al. also created a calibration curve for NMMO quantification in biofuel production [16]. Finally, Melikhov et al. used HS-GC to demonstrate that gallic acid morpholine can be used as a stabilizer in cellulose-NMMO solutions, which aligns with Wendler et al.’s results demonstrating the importance of additives in autocatalytic reactions [17,19].
X-ray diffractometer (XRD) analysis is used to investigate the crystallinity of materials. In many cases, researchers have employed it to measure the crystallinity of NMMO swollen pulp samples as NMMO content increases [20]. Before full dissolution, XRD recorded a 35–42% drop in crystallinity in cellulosic pulps due to swelling in NMMO. As NMMO concentration in the solution increased, the cellulose crystallinity index decreased.
Fourier Transform Infrared Spectroscopy (FTIR) is another form of characterization technique used to analyze unknown samples [72]. The peaks in the FTIR spectrum correspond to various molecular functional groups [65]. Luo et al. used FTIR to determine the cellulose, water, and NMMO content in lyocell slurries [76]. The authors used the angle spectrum (Common Astronomy Software Applications (CASAS)) 6.6 and partial least squares (PLS) models to convert the absorption spectra and extract the content information. Zhao et al. also used a combination of FTIR, NMR, and XRD to show that NMMO crystal structure degradation in cellulose dope solution began between 70 and 100 °C. This exposure resulted in degradation of cellulose crystal structure too [74]. Above a cellulose concentration of 6%, NMMO crystallization decreased, with NMMO recrystallization occurring during the cooling process when it was heated below 100 °C.
When comparing the efficiency of these different techniques at measuring NMMO content, the following conclusions can be drawn based on the information provided above. DSC and XRD do not directly quantify NMMO content. Density measurement is a useful strategy for large concentrations of NMMO present in water; however, it is not accurate enough to quantify smaller amounts. On the other hand, HPLC, FTIR, and HS-GC have been successfully used to determine small amounts of NMMO in water. Yet, HS-GC does not directly measure NMMO content but rather estimates it through NMM. HPLC, in particular when combined with UV detection, offers a slightly more precise estimate of NMMO content than FTIR. However, HPLC is more complex and less accessible than FTIR, which may be sufficient for lab-scale investigations if all the compounds present have been identified and more appropriate for industry settings due to its simplicity of use.

4.2. NMMO Degradation Monitoring Techniques

Initially, NMMO degradation was qualitatively monitored via the colour change to an amber hue in the L-MMCF dope due to chromophore formation [33]. However, chromophore formation can arise both from NMMO decomposition and the stabilization process by PG [26]. When oxidized, PG generates coloured bis(ortho-quinone) [28]. As a result, colour change is not a very accurate measurement of NMMO decomposition. Gallamides, such as gallic morpholide, have been reported to offer equivalent stabilizing efficiency of the lyocell process as PG without generating as much change in colour in the dope solution as PG [19,68]; however, it does not seem to be widely used.
Spectroscopy techniques are often used in combination with thermal analysis to characterize the degradation of NMMO. For example, Wendler et al. combined UV/VIS spectroscopy and DSC to determine byproduct formation in the NMMO-cellulose solution as evident by a change in colour at 40 nm [17]. Additionally, UV detection has been employed to monitor NMMO degradation through its melting point and chromophore content [24]. Rosenau et al. also used UV fluorescence detection with thin-layer chromatography to show that NMMO does not play a reducing role when transition metals are introduced to the lyocell process [31].
Nuclear magnetic resonance (NMR) is used to determine molecular structures present within samples [65]. This is achieved specifically by detecting changes between hydrogen bond structures. Within the lyocell process, it has been used to determine the reactive components of PG [19,68]. Using a combination of thin-layer chromatography and NMR, Rosenau et al. found that NMMO in lyocell solutions has an oxidizing role that is catalyzed by transition metals [31].
Similarly, ESR (electron spin resonance) has been used to study radical formation from NMMO degradation. Konkin et al. used ESR to determine NMMO secondary radical formation resulting from both the cleavage between the N–O bond and amine aldehyde ring degradation [22,70]. In this experiment, ESR was combined with UV irradiation by an excimer laser at temperature intervals of 77–120 K [22]. This kinetic range specifically targeted secondary-forming radicals.

5. Pilot Study of NMMO Residual Content Characterization and Recovery

Based on the conclusions of the comparison between the different characterization techniques in Section 4.1, FTIR was explored as a technique to quantify the NMMO content in lyocell fibre wash wastewater. It has been used by Luo et al. to determine the cellulose, water, and NMMO content in lyocell slurries [76]. However, the authors applied the angle spectrum (CASAS) and partial least squares (PLS) models to the absorption spectra to extract the content information. As a result, there is potential for a simplified FTIR-based NMMO quantification method that would be applicable for industrial use.
The strategy selected for NMMO content quantification by FTIR relied on molecular functional groups found in NMMO but not in the other compounds present in the lyocell fibre wash wastewater. A C-N tertiary amine bond is present in the NMMO chemical structure (Figure 1), which is not present in cellulose, PG, and water (Figure 4). This C-N tertiary amine bond has been associated with an absorbance in the range of 1100–1200 cm−1 [77,78,79]. The experiments conducted involved three steps. First, the spectrum of samples of NMMO solution, water, cellulose pulp, and PG (used to limit NMMO thermal degradation) were analyzed by FTIR to confirm the choice of the selected peak. Second, a calibration curve was constructed by measuring several serial dilutions of NMMO in water. Finally, the NMMO content in lyocell fibre wash wastewater was measured before and after NMMO recovery treatment by evaporation.

5.1. Materials

The dissolving pulp was acetate-grade acid sulphite aspen wood pulp with a 95% alpha-cellulose content. It was supplied by Innotech Alberta, Canada. A 50 wt% NMMO/water solution was supplied by Huntsman International LLC (Salt Lake City, UT, USA). PG (97%) was obtained from Sigma-Aldrich (St. Louis, MO, USA), and MilliQ distilled water was produced using a MilliporeSigma™ Milli-Q™ Direct Water Purification System (Sigma-Aldrich, St. Louis, MO, USA).
The wastewater used in the study originated from the wash bath of lab-scale L-MMCF production using the acetate-grade acid sulfite aspen wood pulp sheet mentioned above [8]. In addition to the dissolving pulp, NMMO, and water, the cellulose dope contained 2% of PG to improve NMMO stability.

5.2. Methods

5.2.1. NMMO Content Characterization

The NMMO content in solid and liquid samples was measured using a Frontier MIR NIR spectrometer (Perkin Elmer, Shelton, WA, USA) coupled with a Universal Attenuated Total Reflectance (UATR) diamond/ZnSe top plate, set in the range of 3,600 and 600 cm−1, and resolution of 4 cm−1, with a total number of scans of 16. To establish the calibration curve, serial dilutions of 40 wt%, 25 wt%, 12.5 wt%, 6.25 wt%, 3.125 wt%, 1.56 wt%, 0.78 wt%, 0.39 wt%, and 0.195 wt% NMMO by volume were prepared from the 50 wt% NMMO/water stock solution and measured by FTIR, and their absorbance was recorded. FTIR measurements were also performed on the 50 wt% NMMO/water stock solution, distilled water, unevaporated and evaporated filtrate from lab-scale L-MMCF production wastewater, and PG.

5.2.2. NMMO Recycling Process

Since it is the most employed technique for NMMO recovery as described in Section 2.3, evaporation was used to concentrate wastewater from the lab-scale L-MMCF spinning wash bath. The wastewater was filtered using fine filter paper (pore size 2–5 µm). No other purification technique was applied. An aliquot of the filtered wastewater was collected for further analysis, and the remainder was concentrated using a rotary evaporator system (Büchi, New Castle, DE, USA), which comprised a rotavapor (R-200), a vacuum controller (V-800), a vacuum pump (V-500), and a heating bath (B-49). The temperature of the heating bath was set to 90 °C. Rotary evaporator rotation began when the mixture began to boil at approximately 60 °C. The level of vacuum was increased until the pressure reached 3 kPa (0.435 psia). When the temperature reached 90 °C, the rotation rate was increased to 280 rotations per minute (RPM). The evaporation was stopped when the solution turned to an amber colour, which occurred after approximately 240 min.

5.3. Results

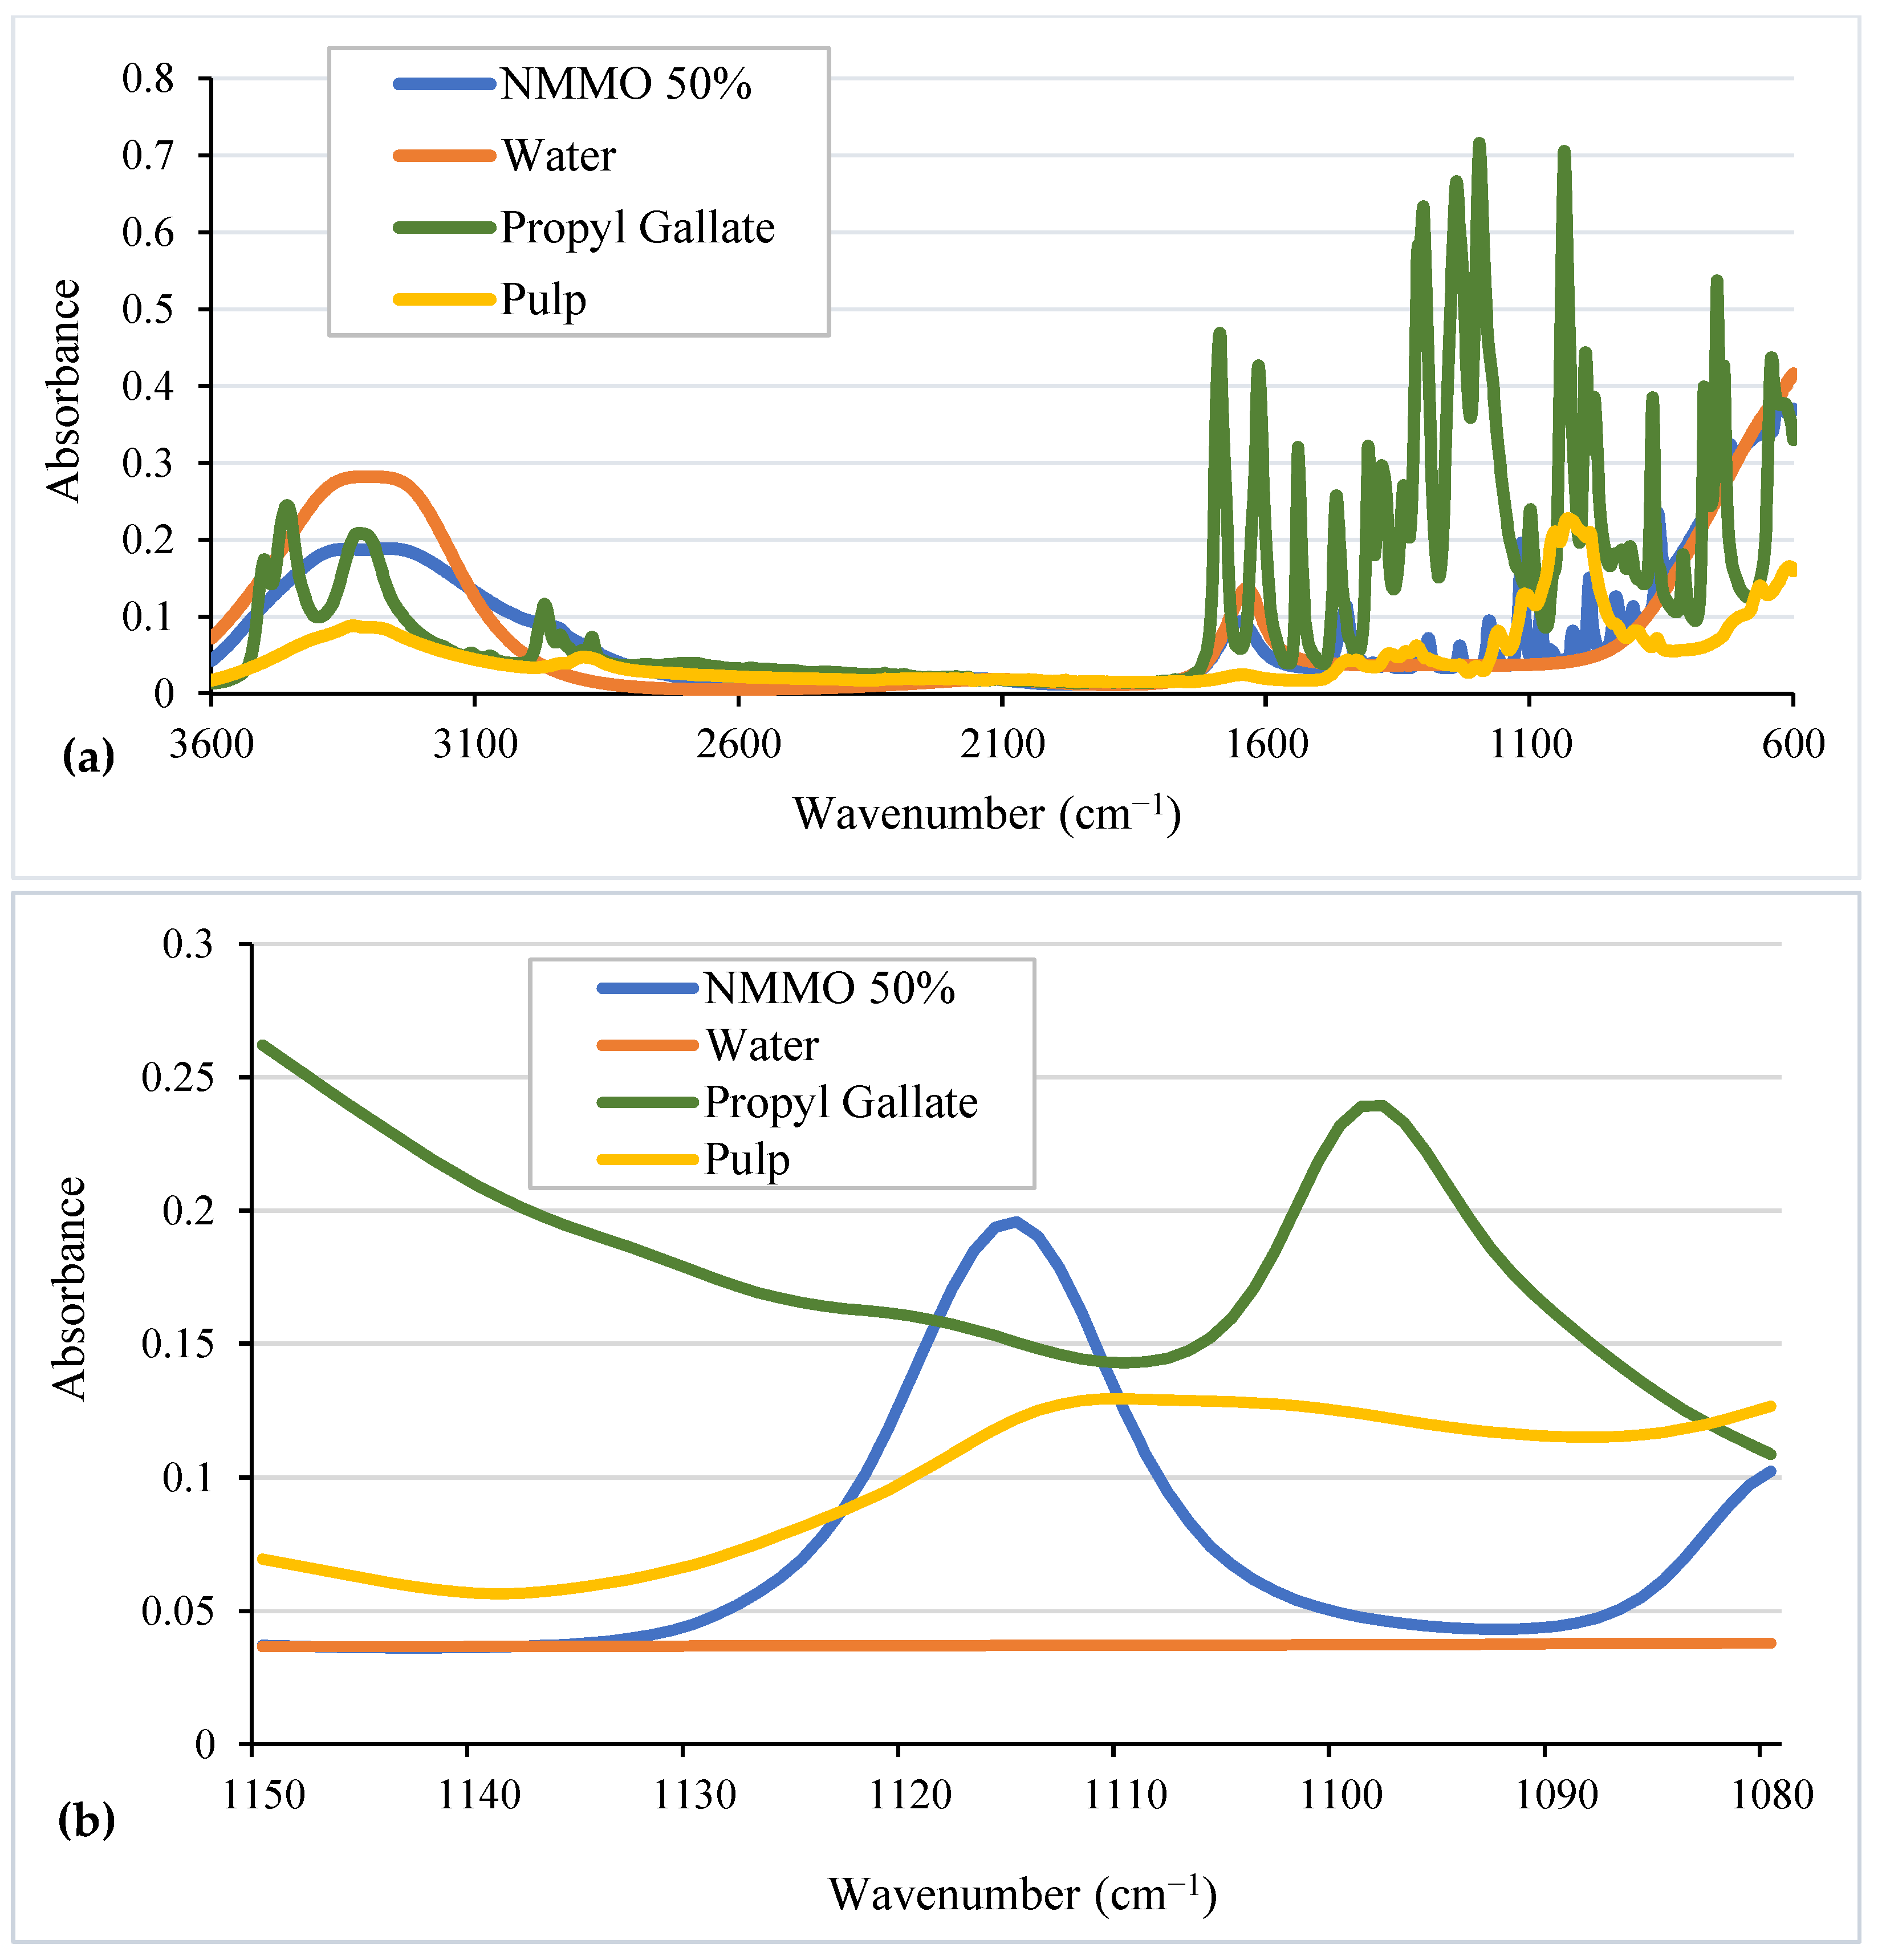
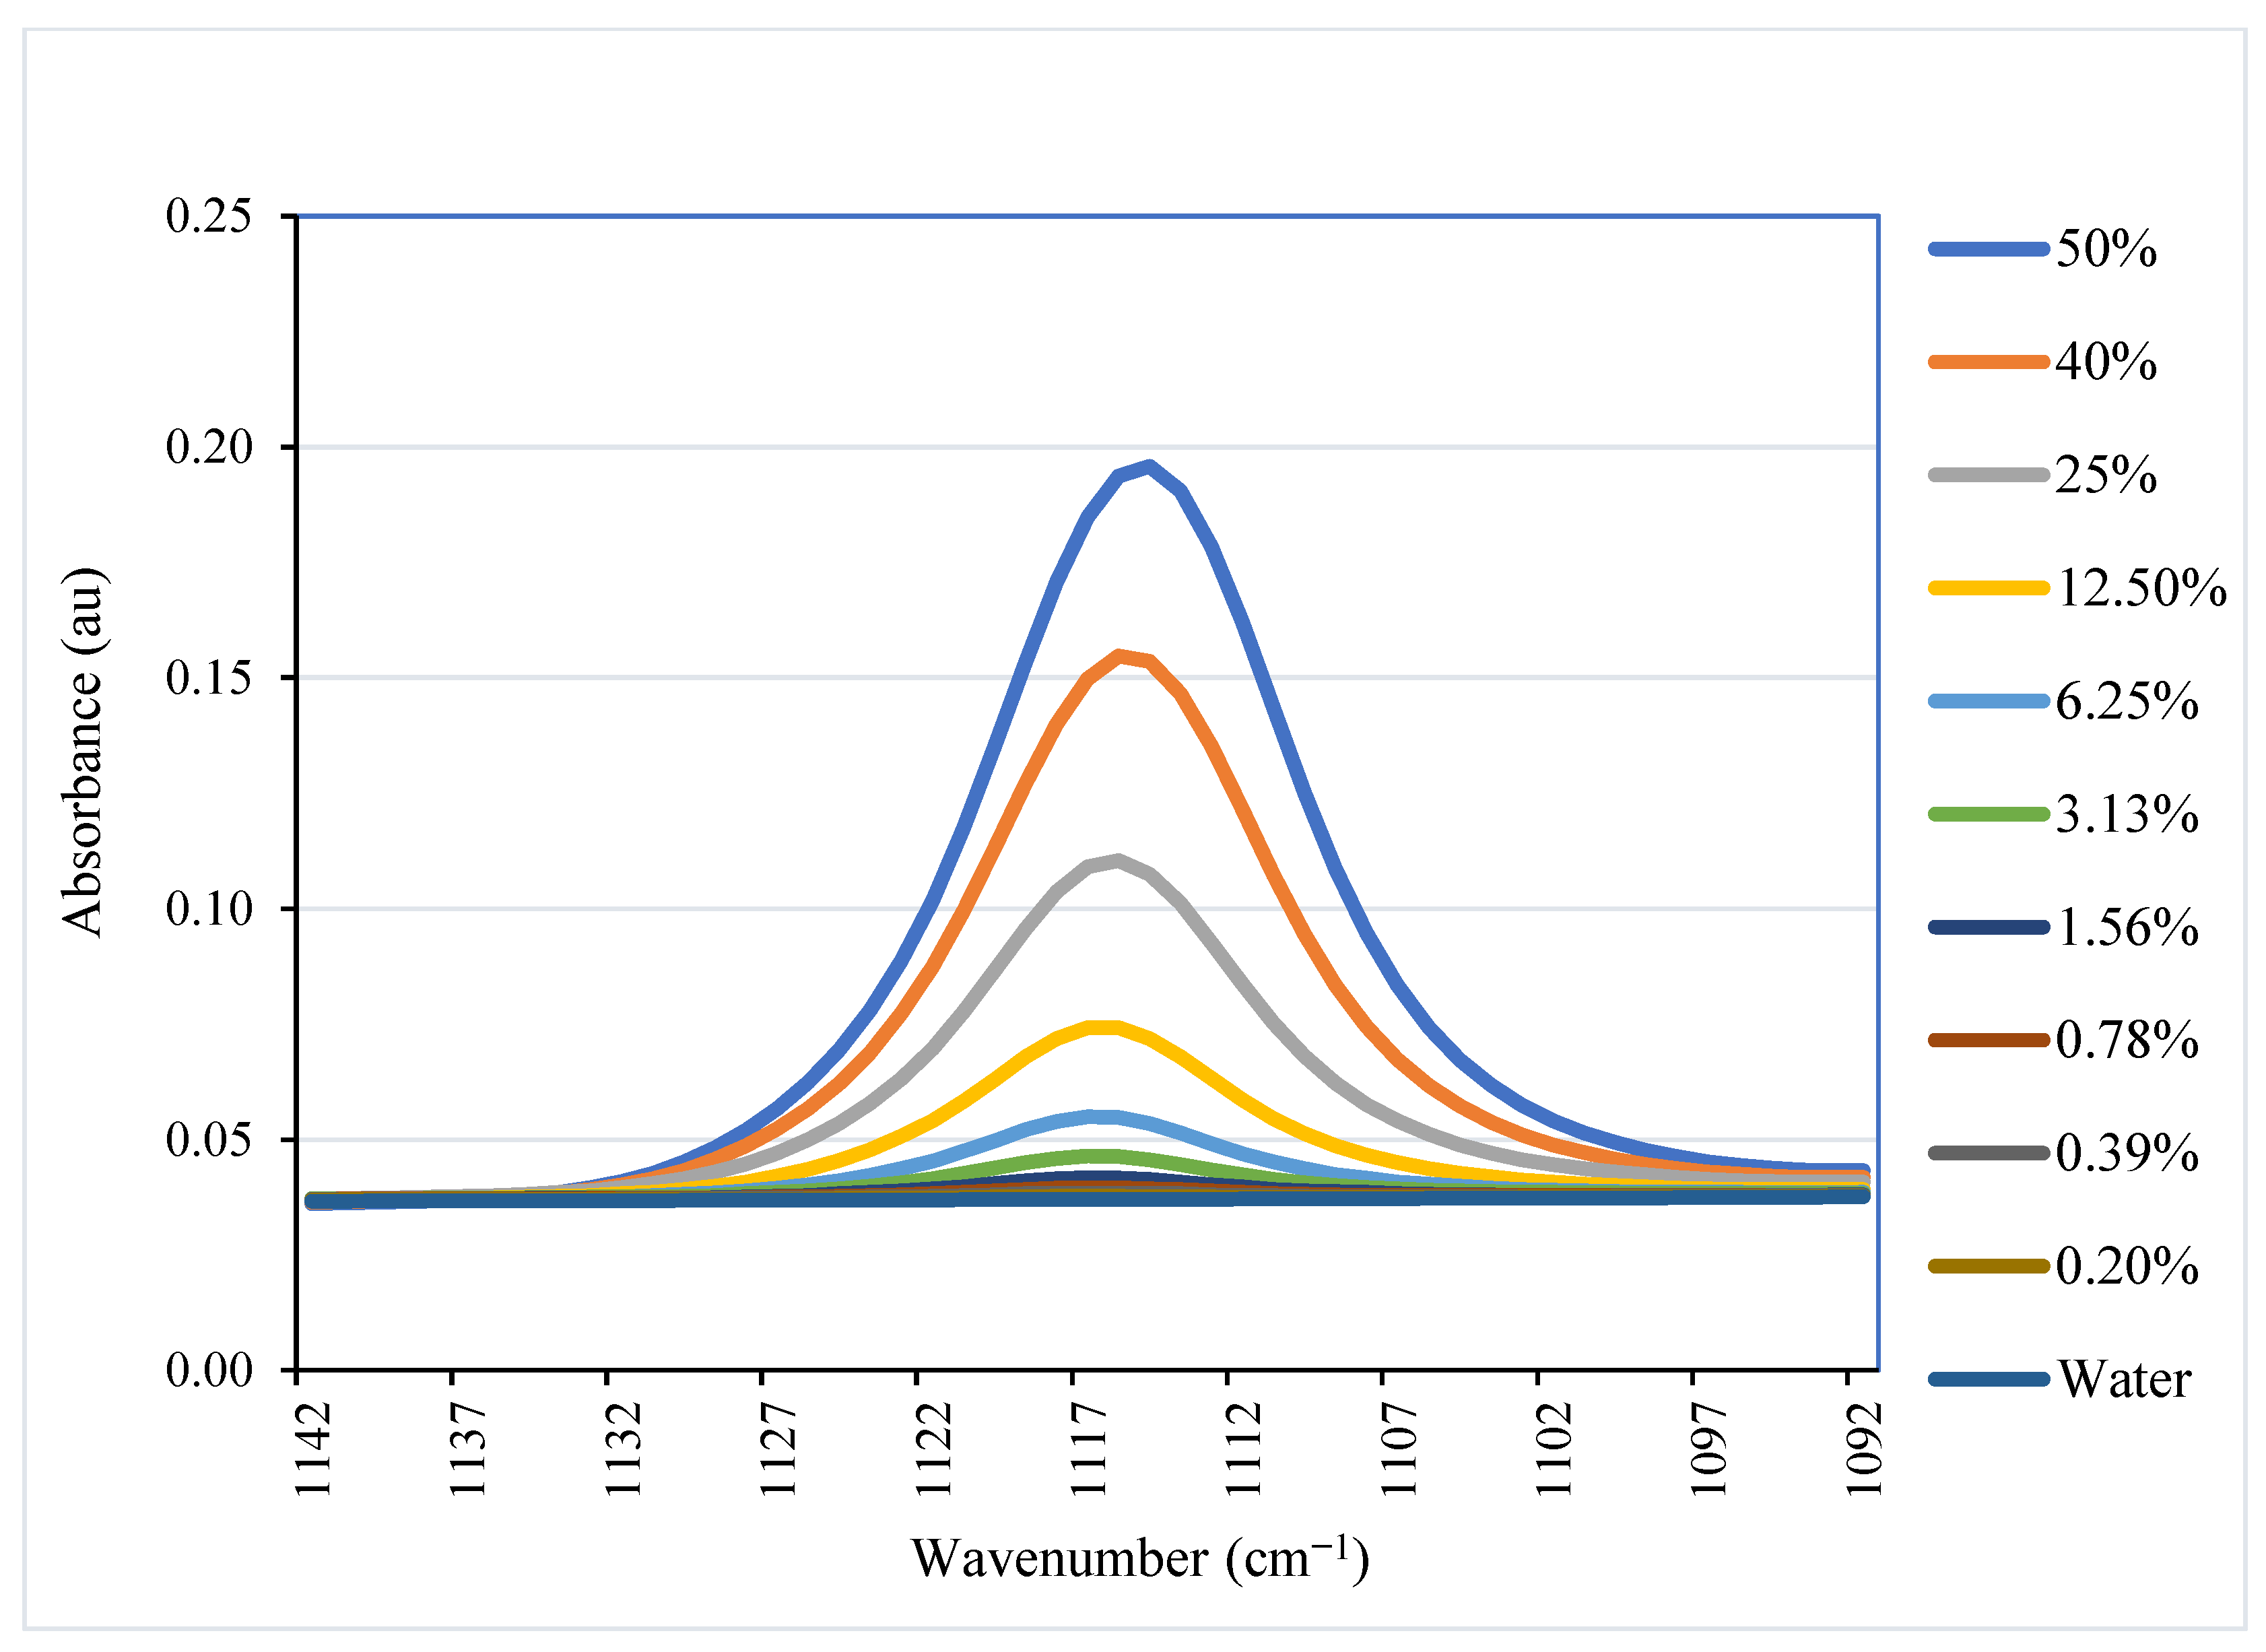
5.3.1. Peak Selection

Figure 5 shows representative examples of the FTIR spectra of 50 wt% NMMO/water, deionized water, PG, and a sample of wood-based dissolving pulp measured between 600 and 3600 cm−1. Water, PG, and pulp are the three compounds that would likely be present in L-MMCF production wastewater in addition to NMMO. Figure 5 also includes a detailed view displaying the 1081–1150 cm−1 area of the FTIR spectra.
The spectrum corresponding to the 50 wt% NMMO/water solution shows a well-defined medium peak at 1116 cm−1, which can be attributed to the C-N tertiary amine bond in NMMO [77,80]. On the other hand, the FTIR spectrum of deionized water is completely featureless in the 1081–1150 cm−1 area. In the case of PG, its FTIR spectrum in the 1081–1150 cm−1 area includes two peaks: one at 1097 cm−1, corresponding to C–O stretching, and the foot of a peak at 1192 cm−1, which has been attributed to C-C stretching [81]. These two peaks might interfere with the measurement of the NMMO C-N tertiary amine bond at 1116 cm−1. However, the concentration of PG in the cellulose dope, and thus in the wash bath wastewater, is very low compared to NMMO: 2 wt% for PG and 50 to 85 wt% for NMMO in the dope solution. Therefore, even if the height of the 1116 cm−1 peak is not much higher than the signal for PG around the C-N 1116 cm−1 peak in Figure 5, the effect of PG FTIR peaks on the measurement of NMMO content in wash bath wastewater is expected to be negligible. In the case of the signal elicited by the cellulose pulp, the 1081–1150 cm−1 area features a peak at 1100 cm−1, corresponding to C-O stretching [77]. However, similarly to PG, the pulp content in the L-MMCF wash bath wastewater is likely to be much lower than NMMO. As the height of the 1100 cm−1 peak in the cellulose pulp is about half that of the 1116 cm−1 peak corresponding to the NMMO C-N tertiary amine bond, it is not expected to significantly affect the determination of the NMMO content in the L-MMCF wash bath wastewater using the 1116 cm−1 peak.

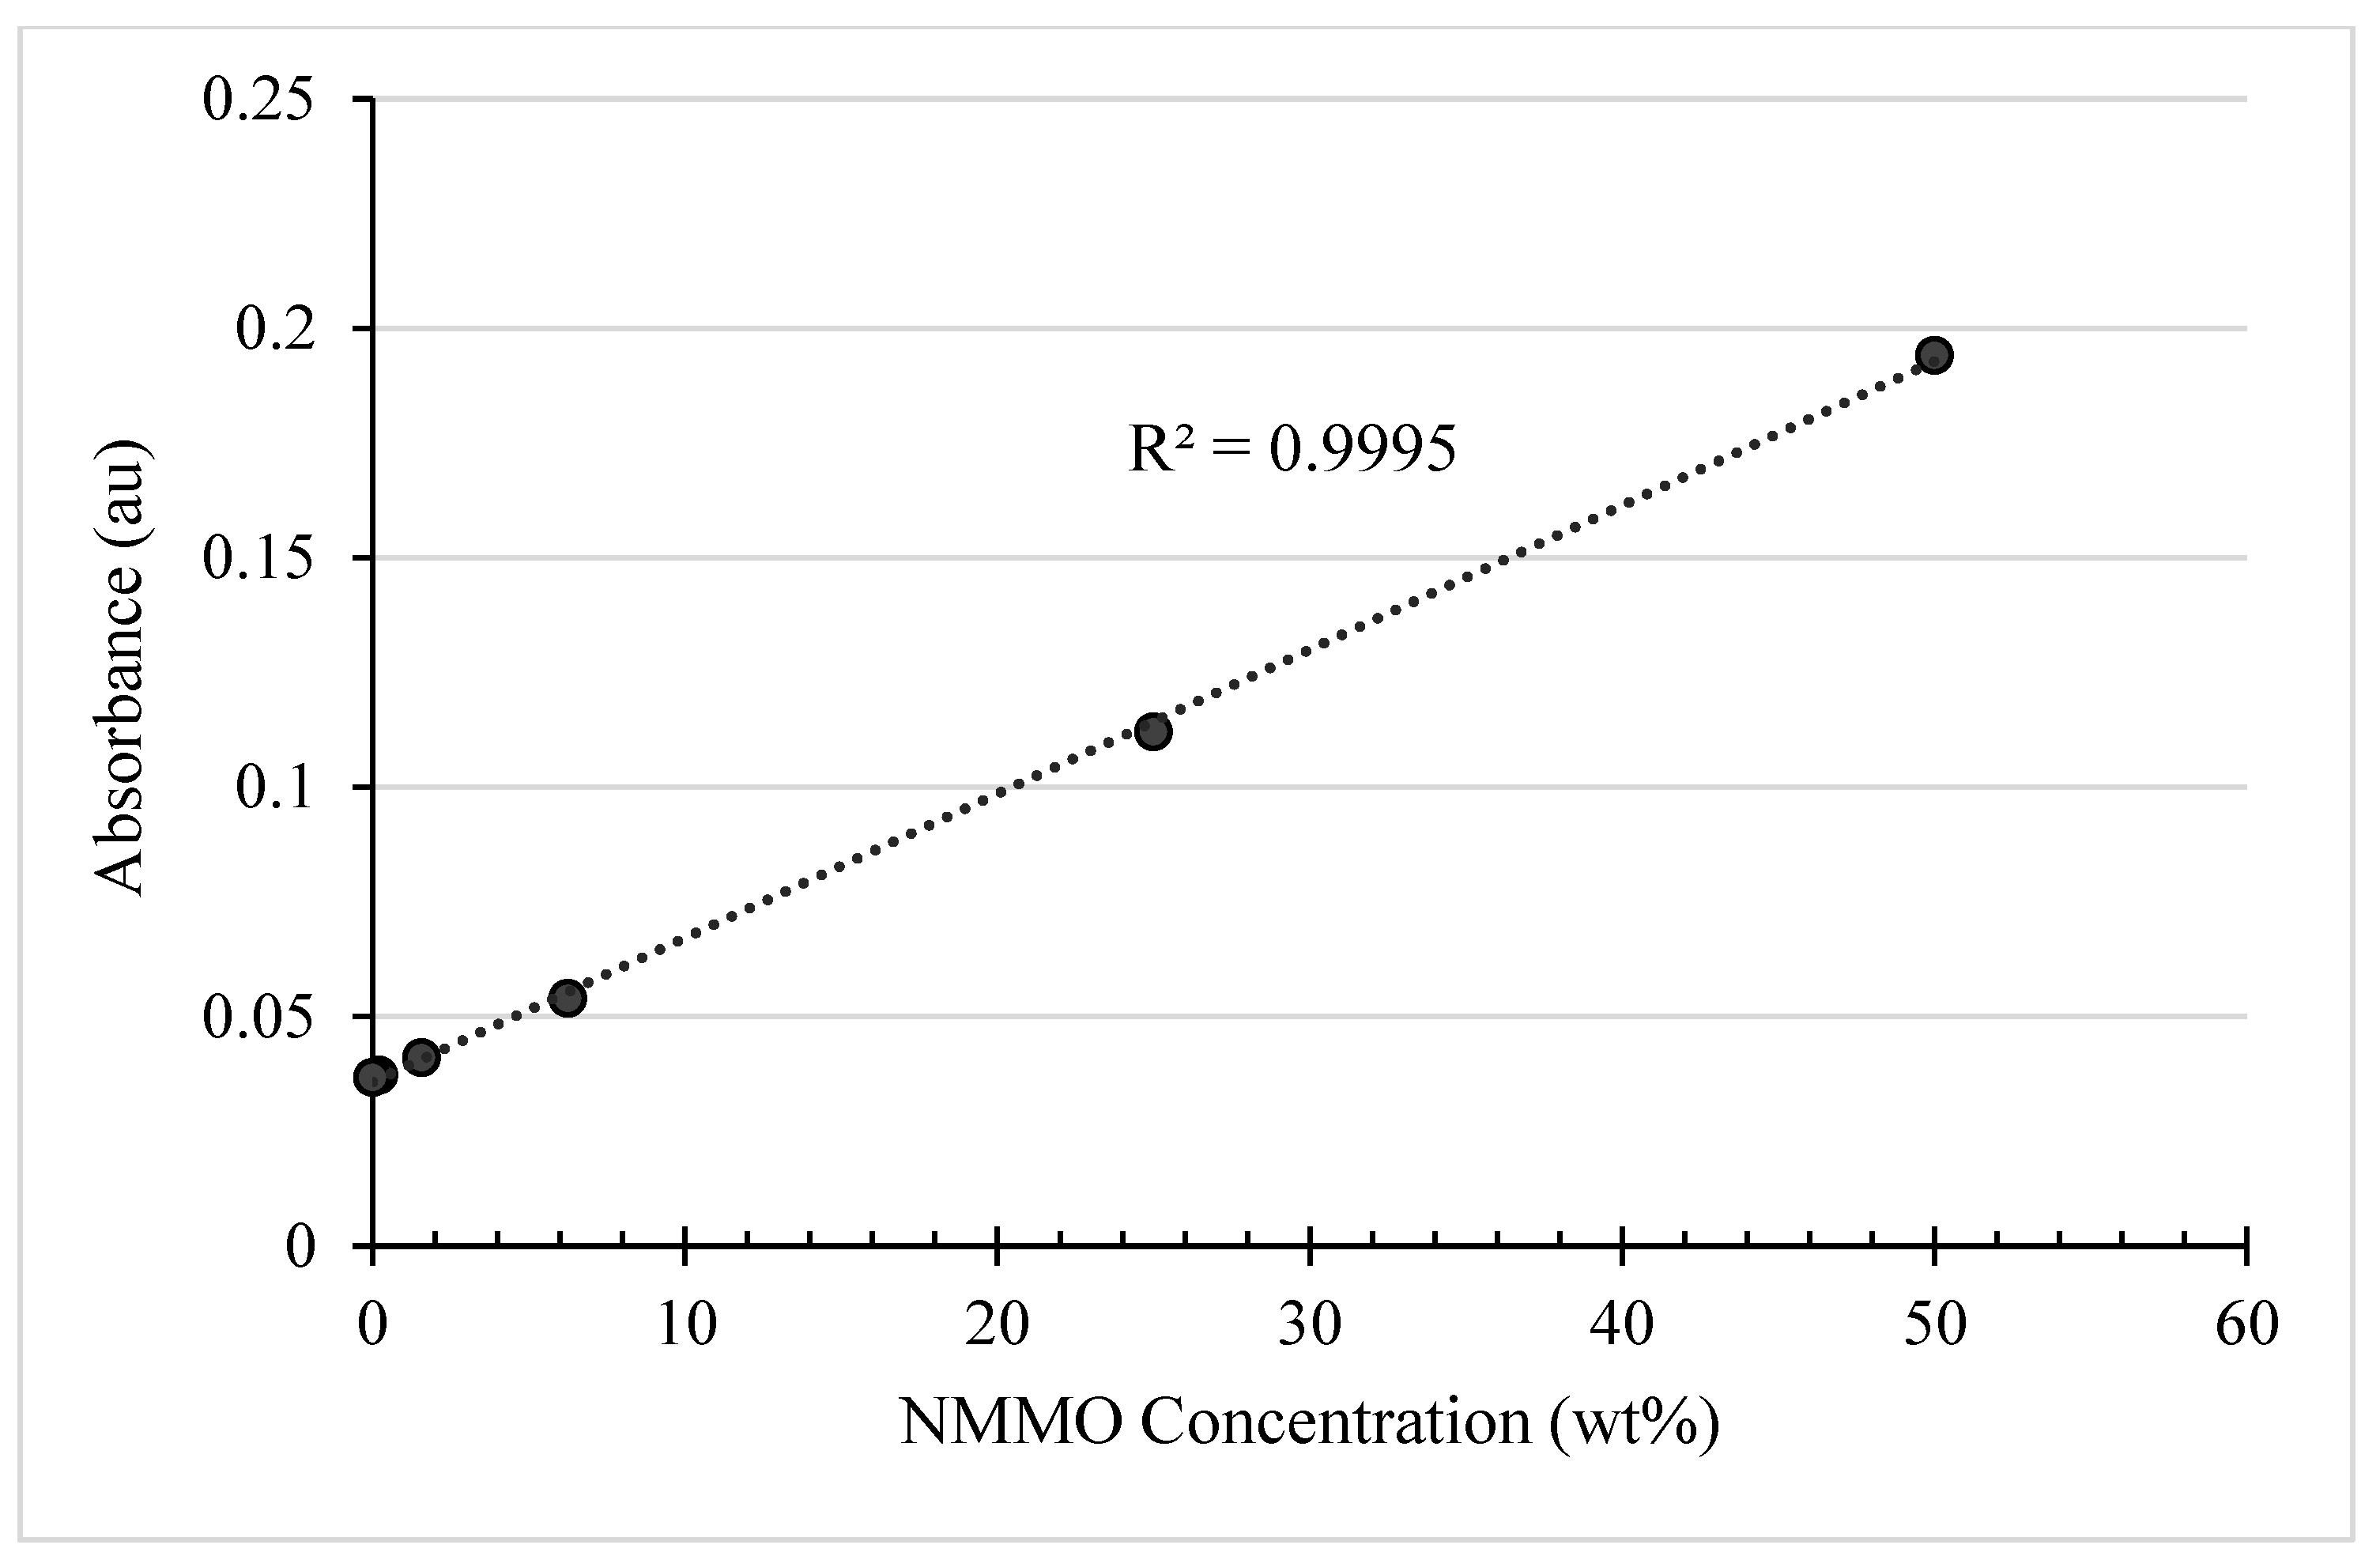
5.3.2. Calibration Curve for NMMO Content Determination

Figure 6 shows the FTIR spectra in the 1092–1142 cm−1 area for 50 wt%, 40 wt%, 25 wt%, 12.5 wt%, 6.25 wt%, 3.125 wt%, 1.56 wt%, 0.78 wt%, 0.39 wt%, and 0.195 wt% aqueous NMMO solutions (by volume) and MilliQ water. They show a gradual increase in the 1116 cm−1 peak height as the NMMO concentration in the aqueous solution increases.
A calibration curve for the determination of NMMO content in L-MMCF production wastewater was constructed using the results for the 50 wt%, 25 wt%, 6.25 wt%, 1.56 wt%, and 0.195 wt% aqueous NMMO solutions (by volume) and MilliQ water, which were measured in triplicate. Figure 7 displays the variation in the mean height of the 1116 cm−1 peak in the FTIR spectra as a function of the NMMO concentration. A positive linear relationship is observed with an R-squared value of 0.9995. This high R-square value indicates that this curve can be used as a calibration curve for the determination of NMMO content in L-MMCF production wastewater.
The limit of detection (LOD) for unknown concentrations was determined using a linear regression model, then multiplying the standard error of the fit by 3.3 and dividing the product by the slope of the calibration curve. The limit of quantification (LOQ) was determined by multiplying the standard error of the fit by 10 and dividing the product by the slope of the calibration curve. The results are shown in Table 2. The low values of LOD at 0.04 wt% and LOQ at 0.1 wt% indicate the suitability of the method for the NMMO content quantification in L-MMCF production wash wastewater.

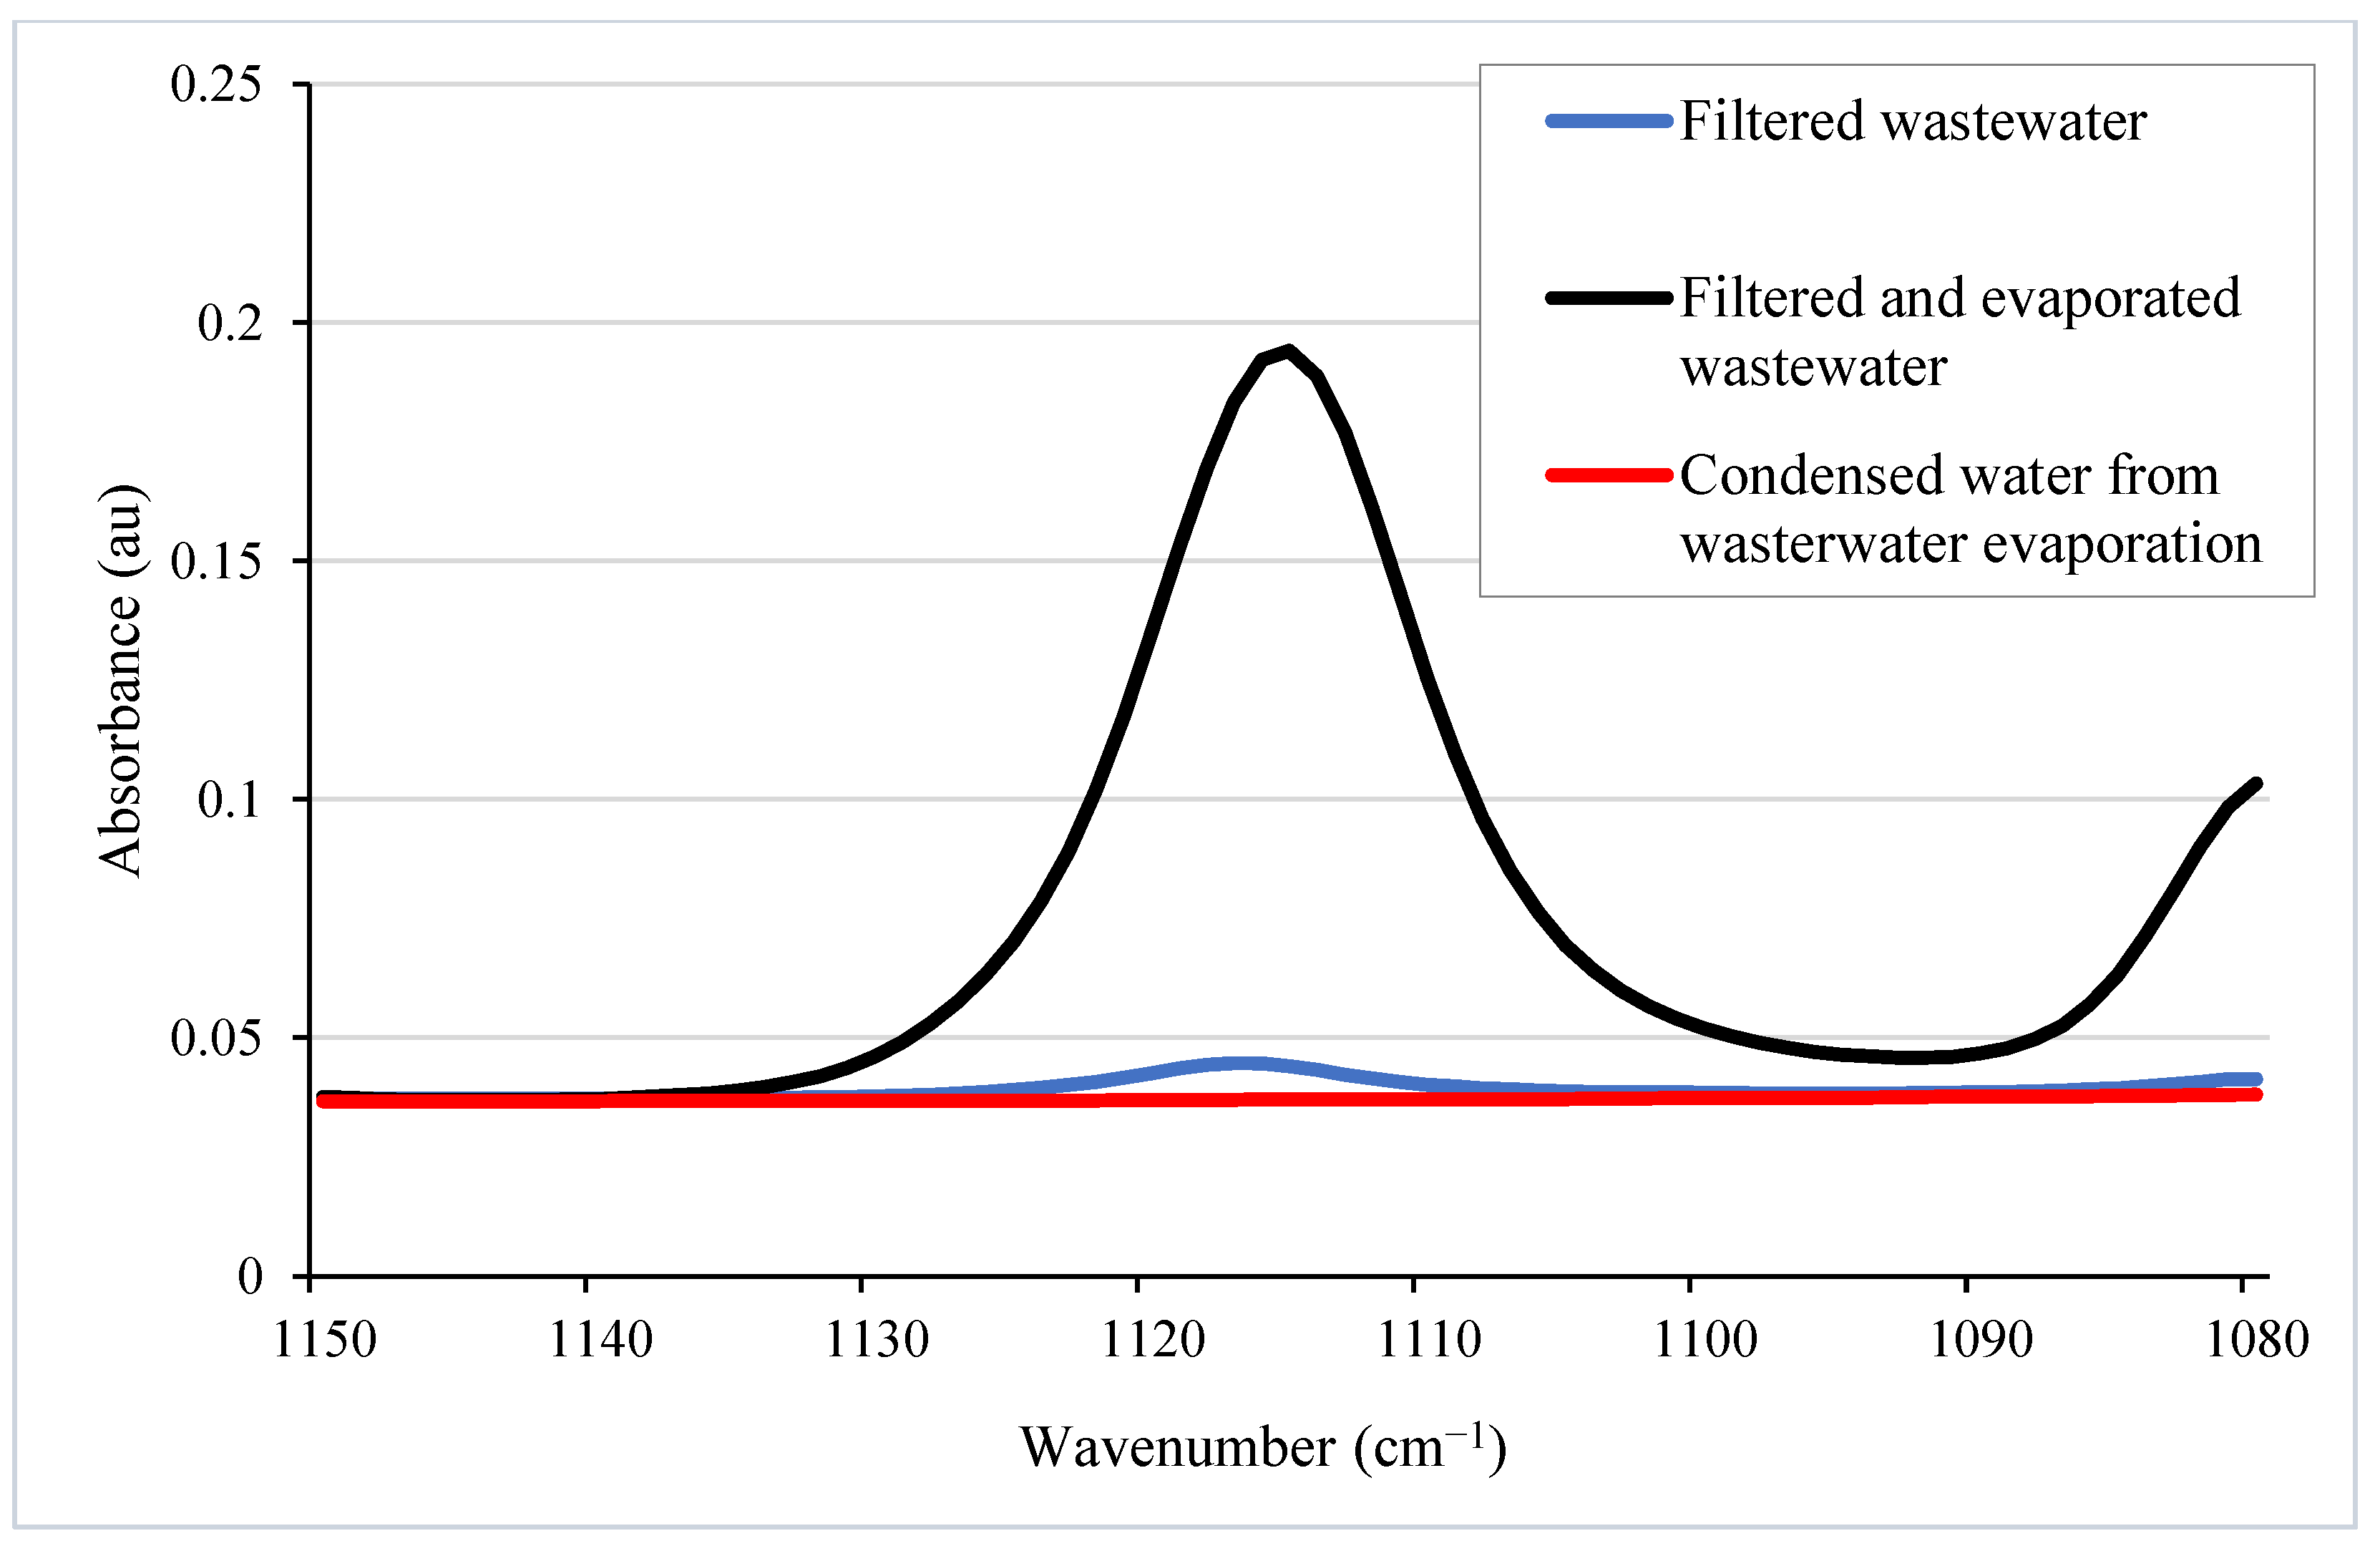
5.3.3. NMMO Recycling from L-MMCF Production Wastewater

The NMMO content in the filtrate of the L-MMCF production wastewater before and after evaporation using a rotary evaporator (Section 5.2.2) was quantified using the FTIR peak at 1116 cm−1 and the calibration curve shown in Figure 7. The FTIR spectra in the 1080–1150 cm−1 range are shown in Figure 8. They show a well-defined peak at 1116 cm−1 in the data corresponding to the filtrate of the L-MMCF production wash wastewater before and after evaporation. Prior to the rotary evaporation, the amount of NMMO in the filtered waste was 2.7 wt% (Table 3). After 240 min of evaporation, the NMMO content reached 51.4 wt%. This concentration is very close to the NMMO content in the NMMO stock solution used for pulp dissolution in the L-MMCF production process. No significant amount of NMMO was detected in the condensed water from the wastewater evaporation process (Figure 8 and Table 3).
The FTIR spectrum of the NMMO/water solution recovered by rotary evaporation from the L-MMCF production wastewater was compared to that of the 50 wt% NMMO/water stock solution. As shown in Figure 9, the two spectra perfectly overlap in the 600–3600 cm−1 range (R-square of 0.99997). This indicates that NMMO had not experienced any significant degradation during the recovery process from the L-MMCF production wastewater by rotary evaporation. The amber colour observed in the evaporated wastewater was potentially due to PG chromophore formation, which would not produce a large effect on the FTIR spectrum due to the low PG content. The same amber colour was observed in the NMMO/water/cellulose/PG dope after it had been evaporated to increase the NMMO concentration from 50 to 85 wt% [8].

6. Discussion

Information obtained from literature on L-MMCF and biofuel production processes shows the potential of NMMO recycling and reuse. These recovery processes would lead to lower production costs, as well as reduce the environmental footprint in L-MMCF manufacturing. However, NMMO degradation during the recovery process should be minimized by using a temperature as low as possible. The recycled NMMO should also be free from any contaminants, including PG used for NMMO stabilization and NMMO degradation by-products.
The results described in this article provide a strategy to quantify the NMMO content in aqueous solution. It relies on a peak at 1116 cm−1 in the fingerprint region of the FTIR spectrum of FTIR. This peak has been attributed to the C-N stretch from the amine group in the NMMO molecule. The fact that this peak at 1116 cm−1 is in the NMMO fingerprint region constitutes an advantage as it is the unique signature of the compound. Even if water, pulp, and PG are present in the wash wastewater, they do not feature this C-N stretch. Therefore, they do not interfere with the determination of NMMO content using this peak.
This method of NMMO content determination based on the 1116 cm−1 peak height offers the advantage of simplicity compared to the strategy based on the use of angle spectrum (CASAS) and partial least squares (PLS) proposed by Luo et al. [76]. It is thus very well adapted for monitoring the NMMO content in solutions at the different stages of the L-MMCF manufacturing process in commercial settings.
However, this method has some limitations. First, it only determines intact NMMO and does not indicate if some of the NMMO has been degraded. Second, it cannot be used to determine the residual NMMO content in the lyocell fibre due to the presence of the peak at 1100 cm−1 associated with the C-O stretch in the cellulose molecule. This peak is more prominent in cellulose, so identifying NMMO from cellulose within the L-MMCF is not possible. Finally, the possible signal interference was only assessed with water, cellulose pulp, and PG. In theory, contamination of the cellulose by other compounds could compromise the precision of the method. In practice, due to the sensitivity of the L-MMCF manufacturing process to the presence of contaminants (e.g., runaway exothermic reactions with NMMO), dissolving pulp is manufactured with controlled parameters to remove contaminants; the presence of an unknown or uncontrolled chemical species in the wastewater from L-MMCF production would thus be highly improbable.
In the case of NMMO recovery, the strategy based on rotary evaporation used in the trial described in this paper would need to be complemented by prior purification of the wastewater to remove dissolved contaminants, including PG, cellulose, and any residual hemicellulose and lignin. The presence of these contaminants, and their build-up over multiple NMMO recovery treatments, would affect the efficacy of NMMO at dissolving cellulose. Techniques such as flocculation precipitation followed by filtration and cation-anion exchange resins should be used for this wastewater purification operation. To ensure the quality of the recovered NMMO, it is critical that the levels of possible contaminants present in the wastewater before evaporation be determined, for example, by FTIR.

7. Conclusions

This article reviewed the existing literature on NMMO, including its role in L-MMCF manufacturing with cellulose swelling and dissolution. NMMO recovery techniques were also described. In the L-MMCF manufacturing process, flocculation and filtration are used to remove suspended particulates. Then, ion exchange blocks or cation-anion exchange resins remove dissolved chemicals such as PG and metal contaminants. NMMO’s potential to be recycled depends on its degree of degradation, which results from byproduct formation throughout the L-MMCF process.
The article also depicts techniques used to quantify NMMO content and degradation. NMMO content in liquid and solid media can be determined directly by densimetry, DSC, HPLC, XRD, and FTIR, and indirectly by measuring its degradation products by HS-GC. Other techniques have also been used to monitor specifically its degradation behaviour: spectroscopy, NMR, and ESR.
The article also includes the results of a pilot study on the recovery of NMMO from L-MMCF manufacturing wastewater. An NMMO calibration curve was developed using FTIR by monitoring the peak specific to the tertiary amine group in NMMO at 1116 cm−1. This calibration curve was successfully used to determine the NMMO content in the L-MMCF manufacturing wastewater before and after NMMO recovery using a rotary evaporator. The NMMO solution produced after the recovery process had the desired 50 wt% concentration for cellulose dissolution using the lyocell process. No signs of NMMO degradation were detected in the FTIR spectrum of the recovered NMMO solution.
To the authors’ knowledge, the review part of the paper constitutes the first comprehensive survey of the NMMO recovery processes and characterization techniques. In addition, the pilot study offers a simple method of NMMO content determination and recovery suitable for lab settings. However, the recovery treatment will need to be complemented with a purification process to remove dissolved contaminants from the wastewater before the evaporation process. The information contained in this paper will support advances in L-MMCF manufacturing and contribute to efforts towards the reduction in textile environmental footprint.

Author Contributions

Conceptualization, M.S., J.L., L.L. and P.I.D.; data curation, M.S. and B.A.S.; writing—original draft preparation, M.S.; visualization, M.S.; writing—review and editing, P.I.D., B.A.S., L.L. and J.L.; supervision, P.I.D.; funding acquisition, P.I.D., M.S. and L.L. All authors have read and agreed to the published version of the manuscript.

Funding

This research was funded by Alberta Innovates (#222300804, Agri-Food and Bio-Industrial Innovation program), Davey Textile Solutions Inc. (AB, Canada), Mark’s Work Wearhouse Ltd. (AB, Canada), BioIndustrial Innovation Canada (SCAP-ASC-03, AgriScience Program Cluster Component), PrairiesCan (#PC0007976, Regional Innovations Ecosystems program), and the Natural Sciences and Engineering Research Council of Canada (Undergraduate Student Research Awards program).

Acknowledgments

The authors would like to thank Dagem Z. Haddis, Md Abu Sayed, KM Abdun Noor, and Nadeesha Samaraweera for their suggestions as well as Innotech Alberta, Canada, for providing the dissolving pulp used in the study. The experimental work was performed in the Biorefining Conversions and Fermentation Laboratory, which is under the leadership of David C Bressler at the University of Alberta.

Conflicts of Interest

Davey Textile Solutions, Inc. (Lelia Lawson) has interest and experience in the utilization of L-MMCF towards the manufacturing of high-visibility safety apparel (HVSA) to promote local fibre sourcing and meet sustainability initiatives. The other funders were not involved in the study design, collection, analysis, or interpretation of data; the writing of this article; or the decision to submit it for publication. The other authors declare no conflicts of interest.

References

  1. Sayyed, A.J.; Mohite, L.V.; Deshmukh, N.A.; Pinjari, D.V. Structural characterization of cellulose pulp in aqueous NMMO solution under the process conditions of lyocell slurry. Carbohydr. Polym. 2019, 206, 220–228. [Google Scholar] [CrossRef] [PubMed]
  2. Fink, H.-P.; Weigel, P.; Purz, H.J.; Ganster, J. Structure formation of regenerated cellulose materials from NMMO-solutions. Prog. Polym. Sci. 2001, 26, 1473–1524. [Google Scholar] [CrossRef]
  3. Lawson, L.; Ford, M.; Hoque, M.S.; Chute, W.; Bressler, D.C.; Dolez, P.I. Processes and Challenges for the Manufacturing of Lyocell Fibres with Alternative Agricultural Feedstocks. Appl. Sci. 2023, 13, 12759. [Google Scholar] [CrossRef]
  4. Bagherjeri, M.; Monhemi, H.; Haque, A.N.M.A.; Naebe, M. Molecular mechanism of cellulose dissolution in N-methyl morpholine-N-oxide: A molecular dynamics simulation study. Carbohydr. Polym. 2024, 323, 121433. [Google Scholar] [CrossRef] [PubMed]
  5. Granacher, C.; Sallmann, R. Cellulose Solutions and Process of Making Same. US Patent 2,179,181, 7 November 1939. [Google Scholar]
  6. Jiang, X.; Bai, Y.; Chen, X.; Liu, W. A review on raw materials, commercial production and properties of lyocell fiber. J. Bioresour. Bioprod. 2020, 5, 16–25. [Google Scholar] [CrossRef]
  7. Shen, L.; Patel, M.K. Life cycle assessment of man-made cellulose fibres. Lenzing. Berichte 2010, 88, 1–59. [Google Scholar]
  8. Lawson, L.; Sayed, M.A.; Noor, K.M.A.; Haddis, D.; Araujo Souto, B.; Chute, W.; Batcheller, J.; Bressler, D.C.; Dolez, P.I. A Tiered Approach Towards Optimization of Lyocell Prototype Development. In Proceedings of the 35th Canadian Materials Science Conference—CMSC 2024, Edmonton, AB, Canada, 22–24 May 2024. [Google Scholar]
  9. Linton, E.P. The dipole moments of amine oxides. J. Am. Chem. Soc. 1940, 62, 1945–1948. [Google Scholar] [CrossRef]
  10. Hytönen, E.; Sorsamäki, L.; Kolehmainen, E.; Sturm, M.; Weymarn, N. Lyocell fibre production using NMMO—A simulation-based techno-economic analysis. BioResources 2023, 18, 6384–6411. [Google Scholar] [CrossRef]
  11. Ri, C.J.; Kim, Y.C.; Kim, S.W.; Chloe, J.H. A simulation of evaporation dissolution process for a lyocell solution in a vertical wiped film evaporator (1: Simulation of flow process for solution). Cellul. Chem. Technol. 2023, 57, 741–748. [Google Scholar] [CrossRef]
  12. Perepelkin, K.E. Lyocell fibres based on direct dissolution of cellulose in N-methylmorpholine N-oxide: Development and prospects. Fibre Chem. 2007, 39, 163–172. [Google Scholar] [CrossRef]
  13. Gao, D.C.; Lu, X.Y.; Wang, H.P. Technological development of industrial process of lyocell fiber. Artif. Fiber 2019, 49, 2–16. [Google Scholar]
  14. Research and Markets. Lyocell Fiber Market Report: Trends, Forecast and Competitive Analysis to 2030; Research and Markets: Dublin, UK, 2024; 150p. [Google Scholar]
  15. Quintana, E.; Valls, C.; Roncero, M.B. Dissolving-grade pulp: A sustainable source for fiber production. Wood Sci. Technol. 2024, 58, 23–85. [Google Scholar] [CrossRef]
  16. Zhang, S.; Chen, C.; Duan, C.; Hu, H.; Li, H.; Li, J.; Liu, Y.; Ma, X.; Stavik, J.; Ni, Y. Regenerated cellulose by the Lyocell process, a brief review of the process and properties. BioResources 2018, 13, 4577–4592. [Google Scholar] [CrossRef]
  17. Wendler, F.; Graneß, G.; Heinze, T. Characterization of Autocatalytic Reactions in Modified Cellulose/NMMO Solutions by Thermal Analysis and UV/VIS Spectroscopy. Cellulose 2005, 12, 411–422. [Google Scholar] [CrossRef]
  18. Lang, H.; Laskowski, I.; Lukanoff, B.; Schleicher, H.; Mertel, H.; Franz, H.; Taeger, E. Untersuchungen an Lösungen von Cellulose in N-Methylmorpholin-N-Oxid (MMNO). Cellul. Chem. Technol. 1986, 20, 289–301. [Google Scholar]
  19. Melikhov, I.; Bacher, M.; Hosoya, T.; Hettegger, H.; Potthast, A.; Rosenau, T. On the chemical fate of propyl gallate as stabilizer in Lyocell spinning dopes. Cellulose 2023, 30, 5373–5390. [Google Scholar] [CrossRef]
  20. Oliva, A.; Tan, L.C.; Papirio, S.; Esposito, G.; Lens, P.N.L. Use of N-Methylmorpholine N-oxide (NMMO) pretreatment to enhance the bioconversion of lignocellulosic residues to methane. Biomass Convers. Biorefinery 2024, 14, 11113–11130. [Google Scholar] [CrossRef]
  21. Le Moigne, N.; Jardeby, K.; Navard, P. Structural changes and alkaline solubility of wood cellulose fibers after enzymatic peeling treatment. Carbohydr. Polym. 2010, 79, 325–332. [Google Scholar] [CrossRef]
  22. Konkin, A.; Wendler, F.; Meister, F.; Roth, H.-K.; Aganov, A.; Ambacher, O. Degradation processes in the cellulose/N-methylmorpholine-N-oxide system studied by HPLC and ESR. Radical formation/recombination kinetics under UV photolysis at 77 K. Cellulose 2007, 14, 457–468. [Google Scholar] [CrossRef]
  23. Yeoh, S.J. Electrospun Cellulose Fibres from Kraft Pulp. Ph.D. Dissertation, University of British Columbia, Vancouver, BC, Canada, 2009. [Google Scholar]
  24. Rosenau, T.; Potthast, A.; Sixta, H.; Kosma, P. The chemistry of side reactions and byproduct formation in the system NMMO/cellulose (Lyocell process). Prog. Polym. Sci. 2001, 26, 1763–1837. [Google Scholar] [CrossRef]
  25. Deng, Z.; Zhou, G.; Fang, T.; Fang, K.; Liu, X. The bidirectional regulation mechanism of NMMO concentration change on cellulose dissolution and regeneration. Cellulose 2024, 31, 1205–1222. [Google Scholar] [CrossRef]
  26. Guo, Y.; Cai, J.; Sun, T.; Xing, L.; Cheng, C.; Chi, K.; Xu, J.; Li, T. The purification process and side reactions in the N-methylmorpholine-N-oxide (NMMO) recovery system. Cellulose 2021, 28, 7609–7617. [Google Scholar] [CrossRef]
  27. Lukanoff, B.; Philipp, B.; Schleicher, H. Untersuchungen zum thermischen Abbau von cellulose unter homogenen Reaktionsbedingungen. Acta Polym. 1984, 35, 339–343. [Google Scholar] [CrossRef]
  28. Rosenau, T.; Potthast, A.; Hofinger, A.; Kosma, P. Isolation and Identification of Residual Chromophores in Cellulosic Materials. Macromol. Symp. 2005, 223, 239–252. [Google Scholar] [CrossRef]
  29. Bou-Diab, L.; Fierz, H. 2002. Autocatalytic decomposition reactions, hazards and detection. J. Hazard. Mater. 2002, 93, 137–146. [Google Scholar] [CrossRef] [PubMed]
  30. Rosenau, T.; Potthast, A.; Kosma, P.; Chen, G.; Josef, S. Autocatalytic Decomposition of N-Methylmorpholine N-Oxide Induced by Mannich Intermediates. J. Org. Chem. 1999, 64, 2166–2167. [Google Scholar] [CrossRef]
  31. Rosenau, T.; Potthast, A.; Hettegger, H.; Bacher, M.; Opietnik, M.; Röder, T.; Adorjan, I. On the role of N-methylmorpholine-N-oxide (NMMO) in the generation of elemental transition metal precipitates in cellulosic materials. Cellulose 2021, 28, 10143–10161. [Google Scholar] [CrossRef]
  32. Wendler, F.; Konkin, A.; Heinze, T. Studies on the Stabilization of Modified Lyocell Solutions. Macromol. Symp. 2008, 262, 72–84. [Google Scholar] [CrossRef]
  33. Rosenau, T.; Potthast, A.; Adorjan, I.; Hofinger, A.; Sixta, H.; Firgo, H.; Kosma, P. Cellulose solutions in N-methylmorpholine-N-oxide (NMMO)–degradation processes and stabilizers. Cellulose 2002, 9, 283–291. [Google Scholar] [CrossRef]
  34. McCorsely, C.C.; Varga, J.K. Process for Making a Precursor of a Solution of Cellulose. US Patent 4, 142,913, 6 March 1979. [Google Scholar]
  35. Kabir, M.; Niklasson, C.; Taherzadeh, M.; Horváth, I. Biogas production from lignocelluloses by N-methylmorpholine-N-oxide (NMMO) pretreatment: Effects of recovery and reuse of NMMO. Bioresour. Technol. 2014, 161, 446–450. [Google Scholar] [CrossRef] [PubMed]
  36. Wang, Y.; Koo, W.; Kim, H. 2003. Preparation and Properties of New Regenerated Cellulose Fibers. Text. Res. J. 2003, 73, 998–1004. [Google Scholar] [CrossRef]
  37. Gregor, W.; Grabner, G.; Adelwöhrer, C.; Rosenau, T.; Gille, L. Antioxidant properties of natural and synthetic chromanol derivatives: Study by fast kinetics and electron spin resonance spectroscopy. J. Org. Chem. 2005, 70, 3472–3483. [Google Scholar] [CrossRef]
  38. Li, C.; Fang, T.; Zhou, G.; Ge, M.; Li, Y.; Liu, X. Mechanism and conformation changes for the whole regeneration process of cellulose in pyridinium-based ionic liquids. Cellulose 2022, 29, 5479–5492. [Google Scholar] [CrossRef]
  39. Periyasamy, A.; Khanum, R. Effect of fibrillation on pilling tendency of Lyocell fiber. Bangladesh Text. Today 2012, 4, 31–39. [Google Scholar]
  40. Teghammar, A.; Forgács, G.; Sárvári Horváth, I.; Taherzadeh, M. Techno-economic study of NMMO pretreatment and biogas production from forest residues. Appl. Energy 2014, 116, 125–133. [Google Scholar] [CrossRef]
  41. Duan, J.; Shao, H.; Zhang, T.; Hu, X. Influence of the coagulation bath temperature on the structure and properties of lyocell fiber. J. Text. Res. 2001, 22, 13–15. [Google Scholar]
  42. Mo, D. Review of spinning process of lyocell fiber. Guangxi Chem. Fiber Commun. 2002, 1, 25–29. [Google Scholar]
  43. Chen, Y.; Wang, W.; Zhang, Q. Investigation of Factors Affecting the Rate of High-Boiling-Point Solvent Removal Using a Rotary Evaporator. Synlett 2024, 35, 598–602. [Google Scholar]
  44. Maron, R.; Michels, C.; Taeger, E. Investigations for preparation of cellulose solutions in NMMO and the following forming. Lenzing. Berichte 1994, 74, 27–29. [Google Scholar]
  45. Jeihanipour, A.; Karimi, K.; Niklasson, C.; Taherzadeh, M. A novel process for ethanol or biogas production from cellulose in blended-fibers waste textiles. Waste Manag. 2010, 30, 2504–2509. [Google Scholar] [CrossRef] [PubMed]
  46. Mortimer, S.; Peguy, A.; Ball, R. Influence of the physical process parameters on the structure formation of lyocell fibres. Cell. Chem. Technol. 1996, 30, 251–266. [Google Scholar]
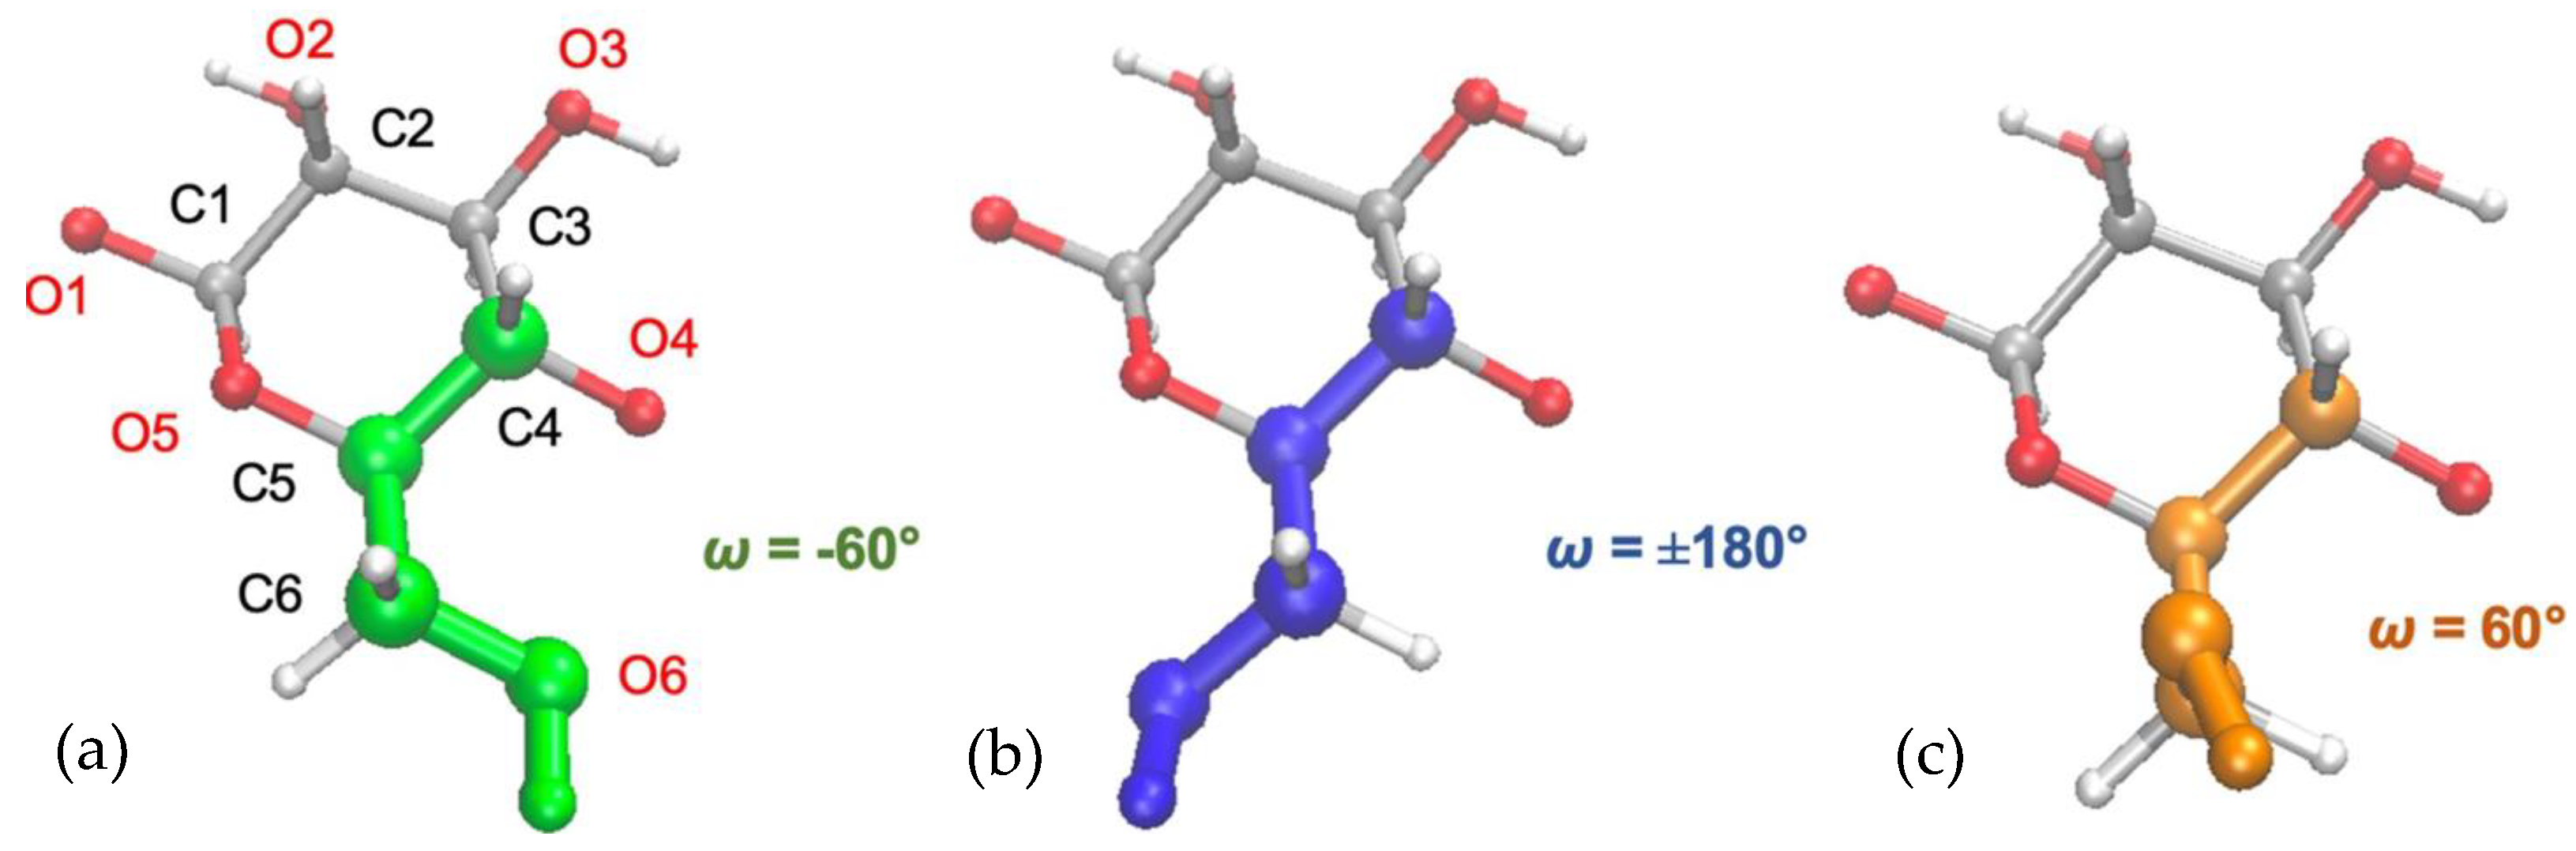
  47. Nomura, S.; Sato, S.; Erata, T. DFT approach to the pathway of conformational changes of cellulose C6-hydroxymethyl group with simple cellotetraose model involving the mechanism of mercerization process. Chem. Phys. Lett. 2020, 742, 137154. [Google Scholar] [CrossRef]
  48. Klemm, D.; Heublein, B.; Fink, H.-P.; Bohn, A. Cellulose: Fascinating Biopolymer and Sustainable Raw Material. Angew. Chem. Int. Ed. 2005, 44, 3358–3393. [Google Scholar] [CrossRef]
  49. Bokhary, A.; Leitch, M.; Liao, B.-Q. Liquid-liquid extraction technology for resource recovery: Applications, potential, and perspectives. J. Water Process Eng. 2021, 40, 101762. [Google Scholar] [CrossRef]
  50. Patel, J.; Desai, H. Removal of phenol by liquid-liquid extraction from pharmaceutical wastewater. Mater. Today Proc. 2022, 57, 2396–2399. [Google Scholar] [CrossRef]
  51. Sanchis, J.; Llorca, M.; Barceló, D.; Farré, M. Sample treatment procedures for environmental sensing and biosensing. Curr. Opin. Biotechnol. 2017, 45, 170–174. [Google Scholar] [CrossRef]
  52. Shafiei, M.; Karimi, K.; Zilouei, H.; Taherzadeh, M. Enhanced ethanol and biogas production from pinewood by NMMO pretreatment and detailed biomass analysis. BioMed Res. Int. 2014, 2014, 469378. [Google Scholar] [CrossRef]
  53. Agarwala, P.; Kanthale, P.; Thakre, S. Flocculation of spin bath NMMO solution for removal of colloidal impurities in lyocell process. Sep. Sci. Technol. 2019, 54, 2516–2527. [Google Scholar] [CrossRef]
  54. Uzunsakala, S.; Zeytincia, S.; Uyanık, Ö.; Uyanık, N. Adsorption Kinetics Studies of Polymeric Nanocomposite Coagulants. J. Appl. Polym. Sci. 2013, 130, 481–486. [Google Scholar] [CrossRef]
  55. Satari, B.; Karimi, K.; Kumar, R. Cellulose solvent-based pretreatment for enhanced second-generation biofuel production: A review. Sustain. Energy Fuels 2018, 3, 11–62. [Google Scholar] [CrossRef]
  56. Kalt, H.; Rosenau, T. NMM can be recombined with H2O2 to regenerate NMMO. Cellul. Chem. Technol. 1999, 33, 481–486. [Google Scholar]
  57. Marini, A.; Brauneis, W. Homolytic and heterolytic reactions by neutralizing transition metals. J. Inorg. Chem. 1996, 35, 481–486. [Google Scholar]
  58. Zeng, T.; Ke, X.; Li, L.; Cheng, X.; Ni, Y.; Ouyang, X.; Zhang, X.; Chen, L.; Huang, L.; Hu, H. Quantification of N-methyl morpholine N-oxide in biorefinery process solution by headspace gas chromatography. Cellulose 2020, 27, 6861–6870. [Google Scholar] [CrossRef]
  59. Dien, J.; Fierz, H.; Stoessel, F.; Killé, G. The Thermal Risk of Autocatalytic Decompositions: A Kinetic Study. Chimia 1994, 48, 542–550. [Google Scholar] [CrossRef]
  60. Singh, M.; Singh, A. Chapter 9—Thermal characterization of materials using differential scanning calorimeter. In Characterization of Polymers and Fibres; Singh, M.K., Singh, A., Eds.; Elsevier: Amsterdam, The Netherlands, 2022; pp. 201–222. [Google Scholar]
  61. Corradini, D. Handbook of HPLC; Taylor & Francis Group: Boca Raton, FL, USA, 2010. [Google Scholar]
  62. Stockinger, H.; Brauneis, W. High-performance liquid chromatography (HPLC) method for the determination of N-methylmorpholine N-oxide (NMMO) in cellulose solutions. J. Chromatogr. A 1996, 740, 123–130. [Google Scholar]
  63. Sohn, J.; Kim, S. High-performance liquid chromatography (HPLC) method for the analysis of N-methylmorpholine N-oxide (NMMO) in cellulose solutions. J. Chromatogr. A 1982, 234, 123–130. [Google Scholar]
  64. Gómez-Hens, A.; Godoy-Navajas, J. Determination of propyl, octyl, and dodecyl gallates. In Flow Injection Analysis of Food Additives, 1st ed.; CRC Press: Oxford, UK, 2015; pp. 241–260. [Google Scholar]
  65. Singh, M.; Singh, A. Chapter 14—Nuclear magnetic resonance spectroscopy. In Characterization of Polymers and Fibres; Singh, M.K., Singh, A., Eds.; Elsevier: Amsterdam, The Netherlands, 2022; pp. 321–339. [Google Scholar]
  66. Schenzel, K.; Fischer, S. NIR FT Raman Spectroscopy—A Rapid Analytical Tool for Detecting the Transformation of Cellulose Polymorphs. Cellulose 2001, 8, 49–57. [Google Scholar] [CrossRef]
  67. Fadavi, R.; Karimi, M. NMR spectroscopy of N-methylmorpholine N-oxide (NMMO) in cellulose solutions. J. Polym. Sci. 2022, 60, 1234–1245. [Google Scholar]
  68. Zieher, J.; Melikhov, I.; Bacher, M.; Hettegger, H.; Potthast, A.; Rosenau, T. Gallic acid derivatives as stabilizers in cellulose solutions: Analysis by 31P NMR spectroscopy. Cellulose 2023, 30, 6109–6118. [Google Scholar] [CrossRef]
  69. Fink, H.; Weigel, P.; Ganster, J.; Rihm, R.; Puls, J.; Sixta, H.; Parajo, J. Evaluation of new organosolv dissolving pulps. Part II: Structure and NMMO processability of the pulps. Cellulose 2004, 11, 85–98. [Google Scholar] [CrossRef]
  70. Konkin, A.; Wendler, F.; Meister, F.; Roth, H.; Aganov, A.; Ambacher, O. Degradation processes in the cellulose/N-methylmorpholine-N-oxide system studied by HPLC and ESR. Cellulose 2008, 15, 457–468. [Google Scholar]
  71. Singh, M.K.; Singh, A. (Eds.) Chapter 13—Fourier transform infrared (FTIR) analysis. In Characterization of Polymers and Fibres; Elsevier: Amsterdam, The Netherlands, 2022; pp. 295–320. [Google Scholar]
  72. Wu, C.; Qiu, G.; Shentu, B.; Jin, Y. Effect of N-methylmorpholine-N-oxide (NMMO) pretreatment on liquefaction behavior of cornstalk. Biomass Convers. Biorefinery 2024, 14, 27407–27417. [Google Scholar] [CrossRef]
  73. Fang, H.; Sun, J.; Zhang, L. Characterization of bamboo cellulose-based green composite film by NMMO technology. Front. For. China 2008, 3, 514–517. [Google Scholar] [CrossRef]
  74. Zhao, H.; Kwak, J.; Wang, Y.; Franz, J.; White, J.; Holladay, J.E. Interactions between cellulose and N-methylmorpholine-N-oxide. Carbohydr. Polym. 2007, 67, 97–103. [Google Scholar] [CrossRef]
  75. Dai, J.; Chae, M.; Beyene, D.; Danumah, C.; Tosto, F.; Bressler, D. Co-Production of Cellulose Nanocrystals and Fermentable Sugars Assisted by Endoglucanase Treatment of Wood Pulp. Materials 2018, 11, 1645. [Google Scholar] [CrossRef]
  76. Luo, X.; Yuan, H.; Song, C.; Meng, Y.; Li, X. Determination of Cellulose, Water, and N-Methylmorpholine N-Oxide during the Production of Lyocell by Attenuated Total Reflection (ATR)—Fourier Transform Infrared (FTIR) Spectroscopy. Anal. Lett. 2021, 55, 388–398. [Google Scholar] [CrossRef]
  77. Textmap, W. Organic Chemistry; LibreTexts: Davis, CA, USA, 2024. [Google Scholar]
  78. Sun, Z.; Qi, S.; Lees, R.; Xu, L. Lamb-dip spectroscopy of the C− N stretching band of methylamine by using frequency-tunable microwave sidebands of CO2 laser lines. Sci. Rep. 2016, 6, 34270. [Google Scholar] [CrossRef]
  79. FTIR Functional Group Database Table with Search—InstaNANO. 2024. Available online: https://instanano.com/all/characterization/ftir/ftir-functional-group-search/ (accessed on 21 October 2024).
  80. Spectrabase. Spectral Database for Organic Compounds (SDBS); John Wiley Sons, Inc.: Hoboken, NJ, USA, 2024. [Google Scholar]
  81. Eunice, E.; Prasana, J.C.; Muthu, S.; Anuradha, A. Molecular Structure, Spectroscopic, Quantum Computational, and Molecular Docking Investigations on Propyl Gallate. Polycycl. Aromat. Compd. 2023, 43, 5747–5767. [Google Scholar]
Figure 1. Chemical structure of NMMO.
Fibers 13 00003 g001
Figure 2. The lyocell manufacturing process.
Fibers 13 00003 g002
Figure 3. Structure of each cellulose C6 conformation. This figure illustrates the cellulose conformation in the original state (a), while dissolved in NMMO (b), and after being dissolved in NMMO (c) (reproduced [47] with permission from Science Direct).
Fibers 13 00003 g003
Figure 4. Chemical structure of cellulose (a), PG (b), and water (c).
Fibers 13 00003 g004
Figure 5. FTIR of lyocell process components. FTIR of the 50 wt% NMMO/water stock solution (dark blue), deionized water (orange), propyl gallate (green), and wood-based dissolving pulp (light blue). The first chart (a) shows an image of the entire FTIR scan. The second chart (b) shows a zoomed-in image of the FTIR scan from wavelengths 1050–1081 cm−1.
Fibers 13 00003 g005
Figure 6. FTIR spectra in the 1092–1142 cm−1 area of the 50% NMMO/water stock solution, serial dilutions, and distilled water.
Fibers 13 00003 g006
Figure 7. Variation in the 1116 cm−1 peak height in the FTIR spectra as a function of the NMMO content in the solution. The error bars correspond to the average of measurements performed in triplicate.
Fibers 13 00003 g007
Figure 8. NMMO concentrations before and after rotary evaporation recovery.
Fibers 13 00003 g008
Figure 9. Comparison of FTIR spectra of the stock solution (50% NMMO/water) and the NMMO after recovery (50% NMMO/water solution recovered by rotary evaporation) from the L-MMCF production wastewater.
Fibers 13 00003 g009
Table 1. NMMO Characterization Techniques.
Characterization TechniqueFindingsReferences
Density
  • Allows for a rough estimation of NMMO content within high concentrations of water
[24,58]
Differential scanning calorimetry
  • Temperature screening for autocatalytic reaction detection
[17,22,29,59,60]
High-performance liquid chromatography
  • Quantifies the amount of NMMO in solutions by separating the mixture into principal components
  • Does not allow separation for overly contaminated samples
[22,61,62,63,64]
UV Detection
  • No direct measurement of NMMO. Estimation of NMMO content after reduction to NMM
  • Has a higher separation capacity on complicated samples compared to HPLC
[17]
Headspace gas chromatography
  • No direct measurement of NMMO but estimate NMMO content after being reduced to NMM
  • Has a higher separation capacity on complicated samples compared to HPLC
[16,19,58]
Nuclear magnetic resonance
  • One of the main techniques to measure cellulosic and NMMO crystallinity index
  • Has been used to determine reactive components within PG
[19,65,66,67,68,69]
Electron spin resonance
  • Determine NMMO secondary radical formation
  • Lower resolution than NMR
[22,70]
X-ray diffractometer
  • Measure the crystallinity of NMMO in swollen pulp samples
[20,71,72,73,74,75]
Fourier Transform Infrared Spectroscopy
  • One of the main techniques to measure NMMO and cellulose functional groups
[67,71,72,73,74,75]
Table 2. LOD and LOQ corresponding to the NMMO content calibration curve in Figure 7.
Concentration (wt%)
Limit of detection (LOD)0.04
Limit of quantification (LOQ)0.1
Table 3. NMMO content in L-MMCF production wastewater filtrate before and after rotary evaporation, as well as in the condensed water from wastewater evaporation.
SampleNMMO Concentration (wt%)
Filtered wastewater2.7
Filtered and evaporated wastewater51.4
Condensed water from wastewater evaporation0.2
Disclaimer/Publisher’s Note: The statements, opinions and data contained in all publications are solely those of the individual author(s) and contributor(s) and not of MDPI and/or the editor(s). MDPI and/or the editor(s) disclaim responsibility for any injury to people or property resulting from any ideas, methods, instructions or products referred to in the content.

