Fiber Microsphere Coupled in a Taper for a Large Curvature Range


P. Robalinho and O. Frazão are with the INESC TEC and Department of Physics and Astronomy, Faculty of the University of Porto, Rua do Campo Alegre, 687 4169-007 Porto, Portugal
*
Author to whom correspondence should be addressed.
Fibers 2019, 7(10), 87; https://doi.org/10.3390/fib7100087
Submission received: 2 September 2019
/
Revised: 26 September 2019
/
Accepted: 2 October 2019
/
Published: 9 October 2019
(This article belongs to the Special Issue Optical Fibers Sensors 2019)
Abstract
:This work consists of using an optical fiber microsphere as a sensor for a wide range of curvature radii. The microsphere was manufactured in a standard fiber with an electric arc. In order to maximize system efficiency, the microsphere was spliced in the center of a taper. This work revealed that the variations of the wavelength where the maxima and minima of the spectrum are located varies linearly with the curvature of the system with a maximum sensitive of 580 ± 20 (pm km). This is because the direction of the input beam in the microsphere depends on the system curvature, giving rise to interferometric variations within the microsphere.
Keywords:
optic; physic; sensor; microsphere; taper; fiber; signal processing; curvature; optical fiber sensor; optical microstructures1. Introduction
The demand for optical sensors has been increasing in recent times due to the low cost associated with the high sensitivity of these types’ sensors. One of the geometries explored is the microsphere due to the simplicity of manufacture [1].
The production of this can be achieved by means of lasers and electric arcs [1,2,3,4]. Their fabrication consists in heating a portion of fiber, which, when molten, results in a structural repositioning leading to the spherical shape. The microspheres are characterized by minimal surface deformations in relation to the wavelength range located in the infrared and visible.
For many years, scattering was inconvenient. However, with the appearance of resonant micro-cavities [5], the dispersion, namely multiple dispersion, has been fundamental for the development of new technologies with applicability in both sensors (biological, temperature. and pressure, among others) as the optical signals processing [6,7,8,9,10]. Another aspect of great importance is the doping of microspheres with rare earth elements allowing the production of micro-lasers with large spectral range and with ease in operating in the single-mode regime [11].
Microspheres are spherical dielectric structures, where different light rays are reflected internally. Due to the low material absorption and the possibility of reduced losses in the glass–air reflection, several optical paths exist, leading to the formation of guided modes. These pathways result from the dispersion that occurs due to the change in the size of the medium in which the beam propagates. Thus, the spectrum of the optical output signal will contain fringes, which reveal the existence of interferences between the different optical paths. If the geometry of the hollow microsphere changes based on one or more physical characteristics, it will cause a change in the output signal; then, this will be a sensor. However, the solid microsphere is more stable and can be used to measure temperature, refractive index, and others where the intensity variation is easily changed. In addition, as will be demonstrated in this work, the microspheres have a high sensitivity to the direction of the input and output beams that are controlled by the curvature of the input and output tapers, respectively.
Currently, for curvature sensors formed by a multimode fiber placed between two single-mode fibers, the sensitivity is of the order of 10 pm km in a range of hundreds of km−1 and, for a structure consisting of a taper placed in the center of the curve for curvatures between 4.5 km−1 and 16.3 km−1, have a sensitivity of 340 pm km [12,13,14].
In this paper is a study on how the microsphere, which is fused between a taper, allows to increase the sensitivity of the fibers for the measurement of the curvature to which it is submitted. The diameter of the microsphere is 258 µm. The analysis is realized for low and high wavelengths when the microsphere is subject to the range of curvatures between 1 and 3 km−1.
2. Materials and Methods
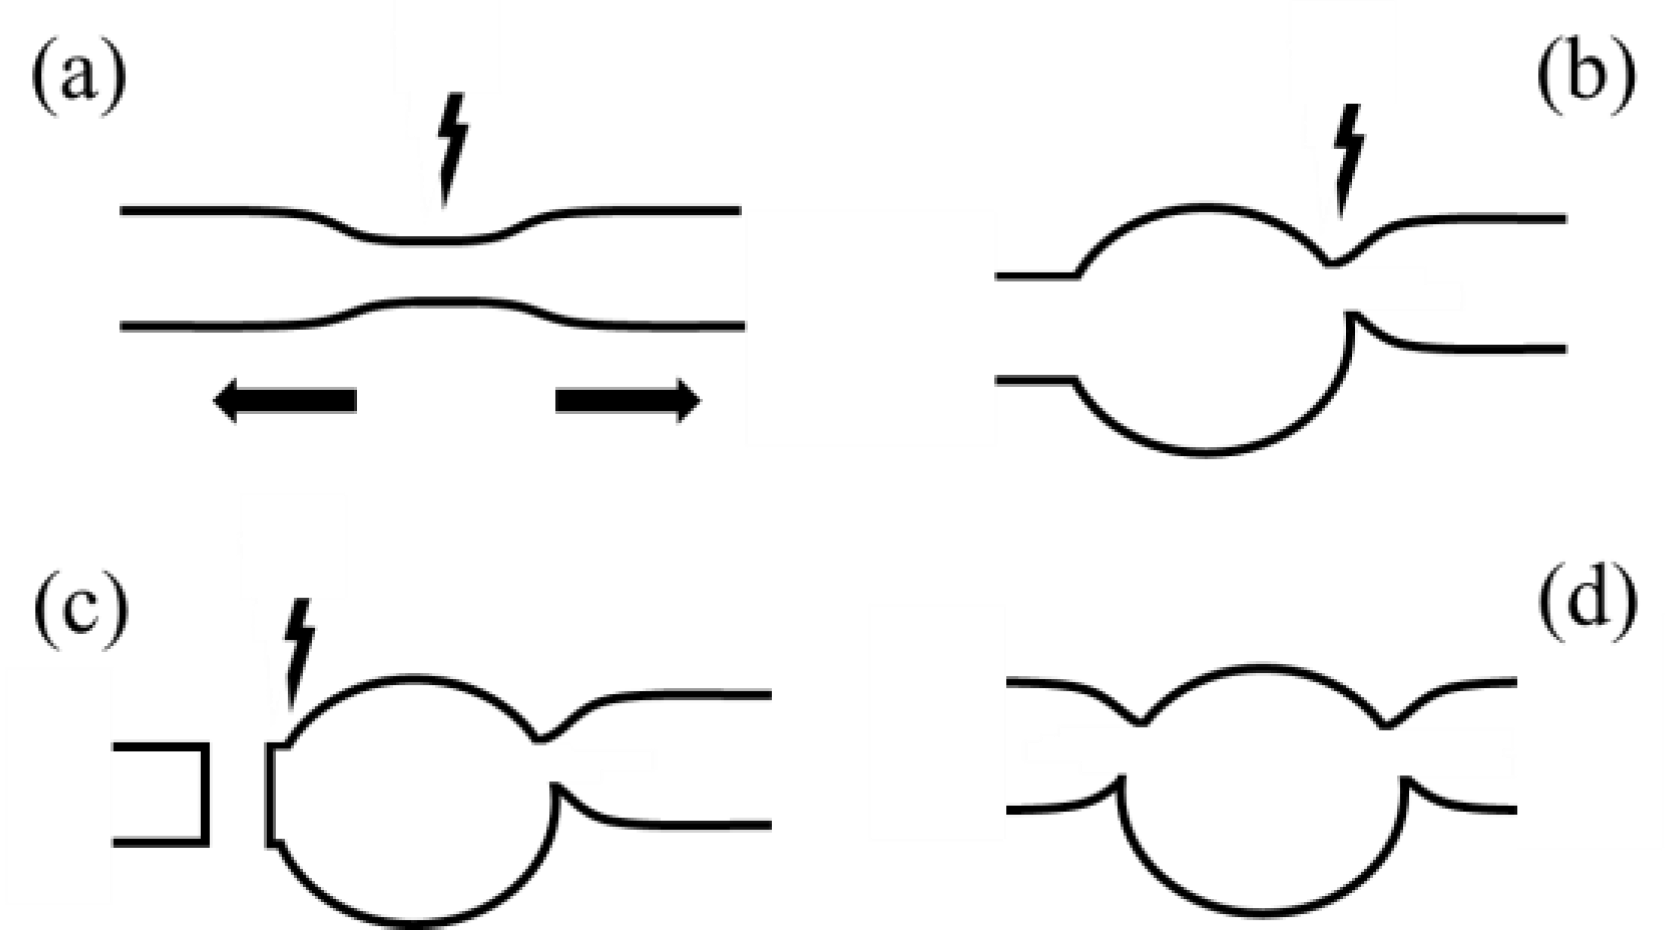
The system under study consists of a microsphere of which the input and output are aligned with each other and misaligned with the center of the microsphere (Figure 1). Both the microsphere and the connections are made with single mode fibers using a Fusion Splice (“Sumitomo Electric™”). To manufacture the new structure, the following must be included:
- Microsphere (apply an electric arc for at least 5 s; for this study, we use the “Sumitomo Electric Type-72C” splice machine with a power of 100 u.a.);
- Taper (Figure 1a) (splice between two fibers with an electric arc equal to or greater than 20 s and intensity of 50 u.a.; at the same time, stretch the fibers by varying the point of electric arc’s application)
- Cleave the taper and fuse the microsphere and the tip (Figure 1b) (intensity electric arc of 20 u.a. and duration of 1 s)
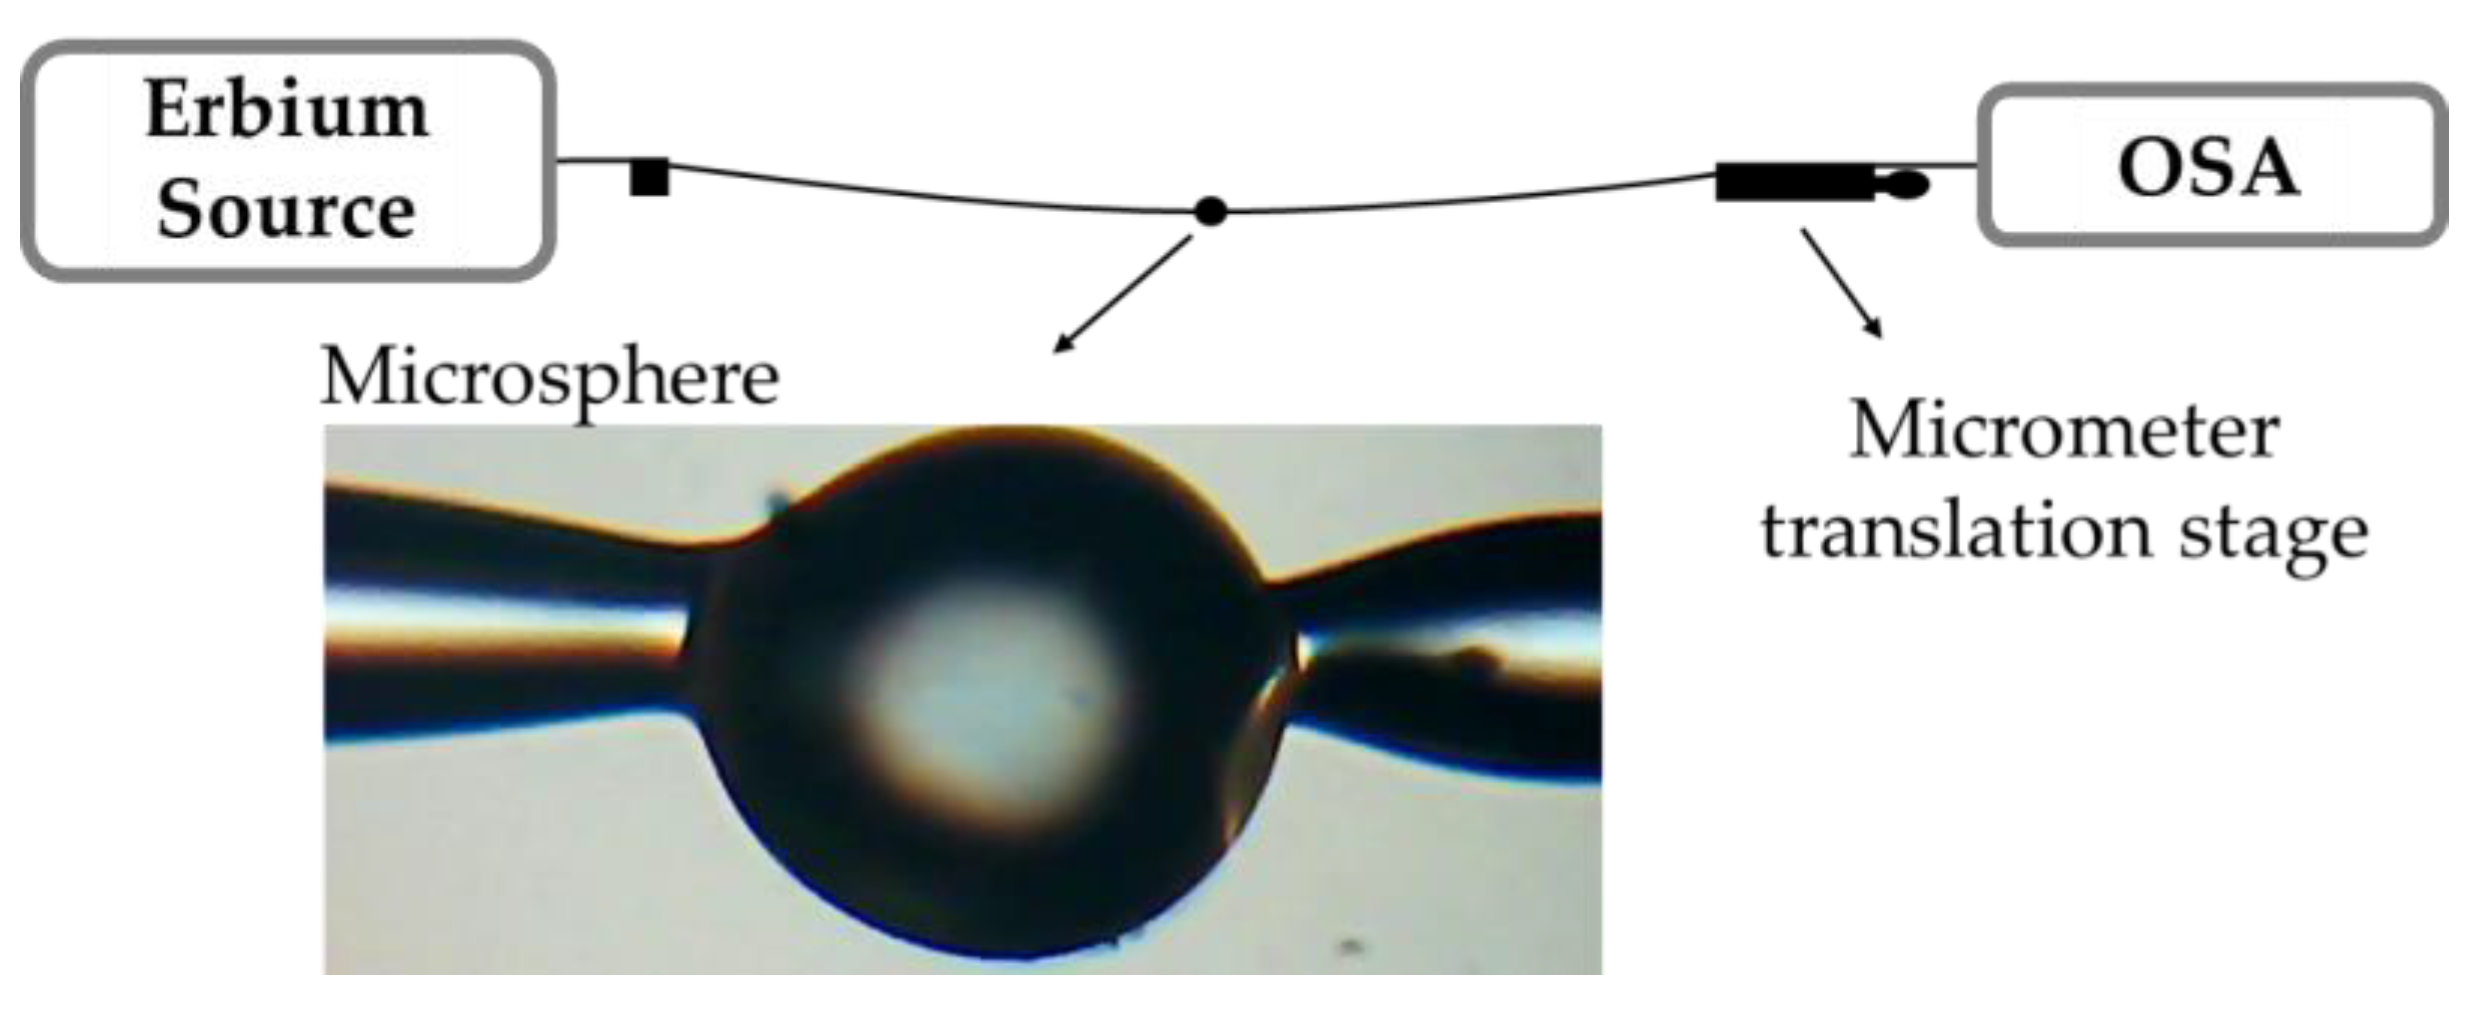
The interrogation system used to read the microsphere was an Optical Spectrum Analyzer (OSA) with a resolution of 0.02 nm and a wide spectrum source in the 1550 nm region with a width of 100 nm. See Figure 2. The fiber was stretched between two supports that are distant: 2.825 m. One of the brackets contains a micrometer translation stage. Varying this allows to vary the curvature of the fiber that is given by the following expression [15]:
where l is the half distance between supports and d is the flexion displacement. To simplify the positioning of the microsphere, place it on the outside of the curve and then connect the input and output fiber to the source and to the OSA, respectively. In this experiment, the oscillations from the movement of the air as well as from the table were minimized. During acquisition of several samples, be careful of the tension applied on the fiber so that the measurements do not reflect the deformations of the microsphere when under stress. The performance of the sensor does not depend only on the microsphere, it also depends on the narrowing of the fibers connected to the microsphere. The narrower this taper (particularly the output fiber), the lower the output spectrum power and the greater the impact of multiple interference displayed on the output spectrum (not only in absolute terms but also in relative terms). Also, it depends on the position of the microsphere, i.e., if the microsphere is placed outside the curve, the output signal exhibits a greater impact of the multiple interferences (thus, it is a sensor based on the power variations resulting from interferences beyond the decrease in the power resulting from the misalignment of the beam with the output fiber and various reflections). See Figure 2. If the microsphere is positioned inside the curve, the power variation will be mainly a consequence of the misalignment of the beam with the output fiber, showing little impact of the interference beyond to the output spectrum that contains more energy.
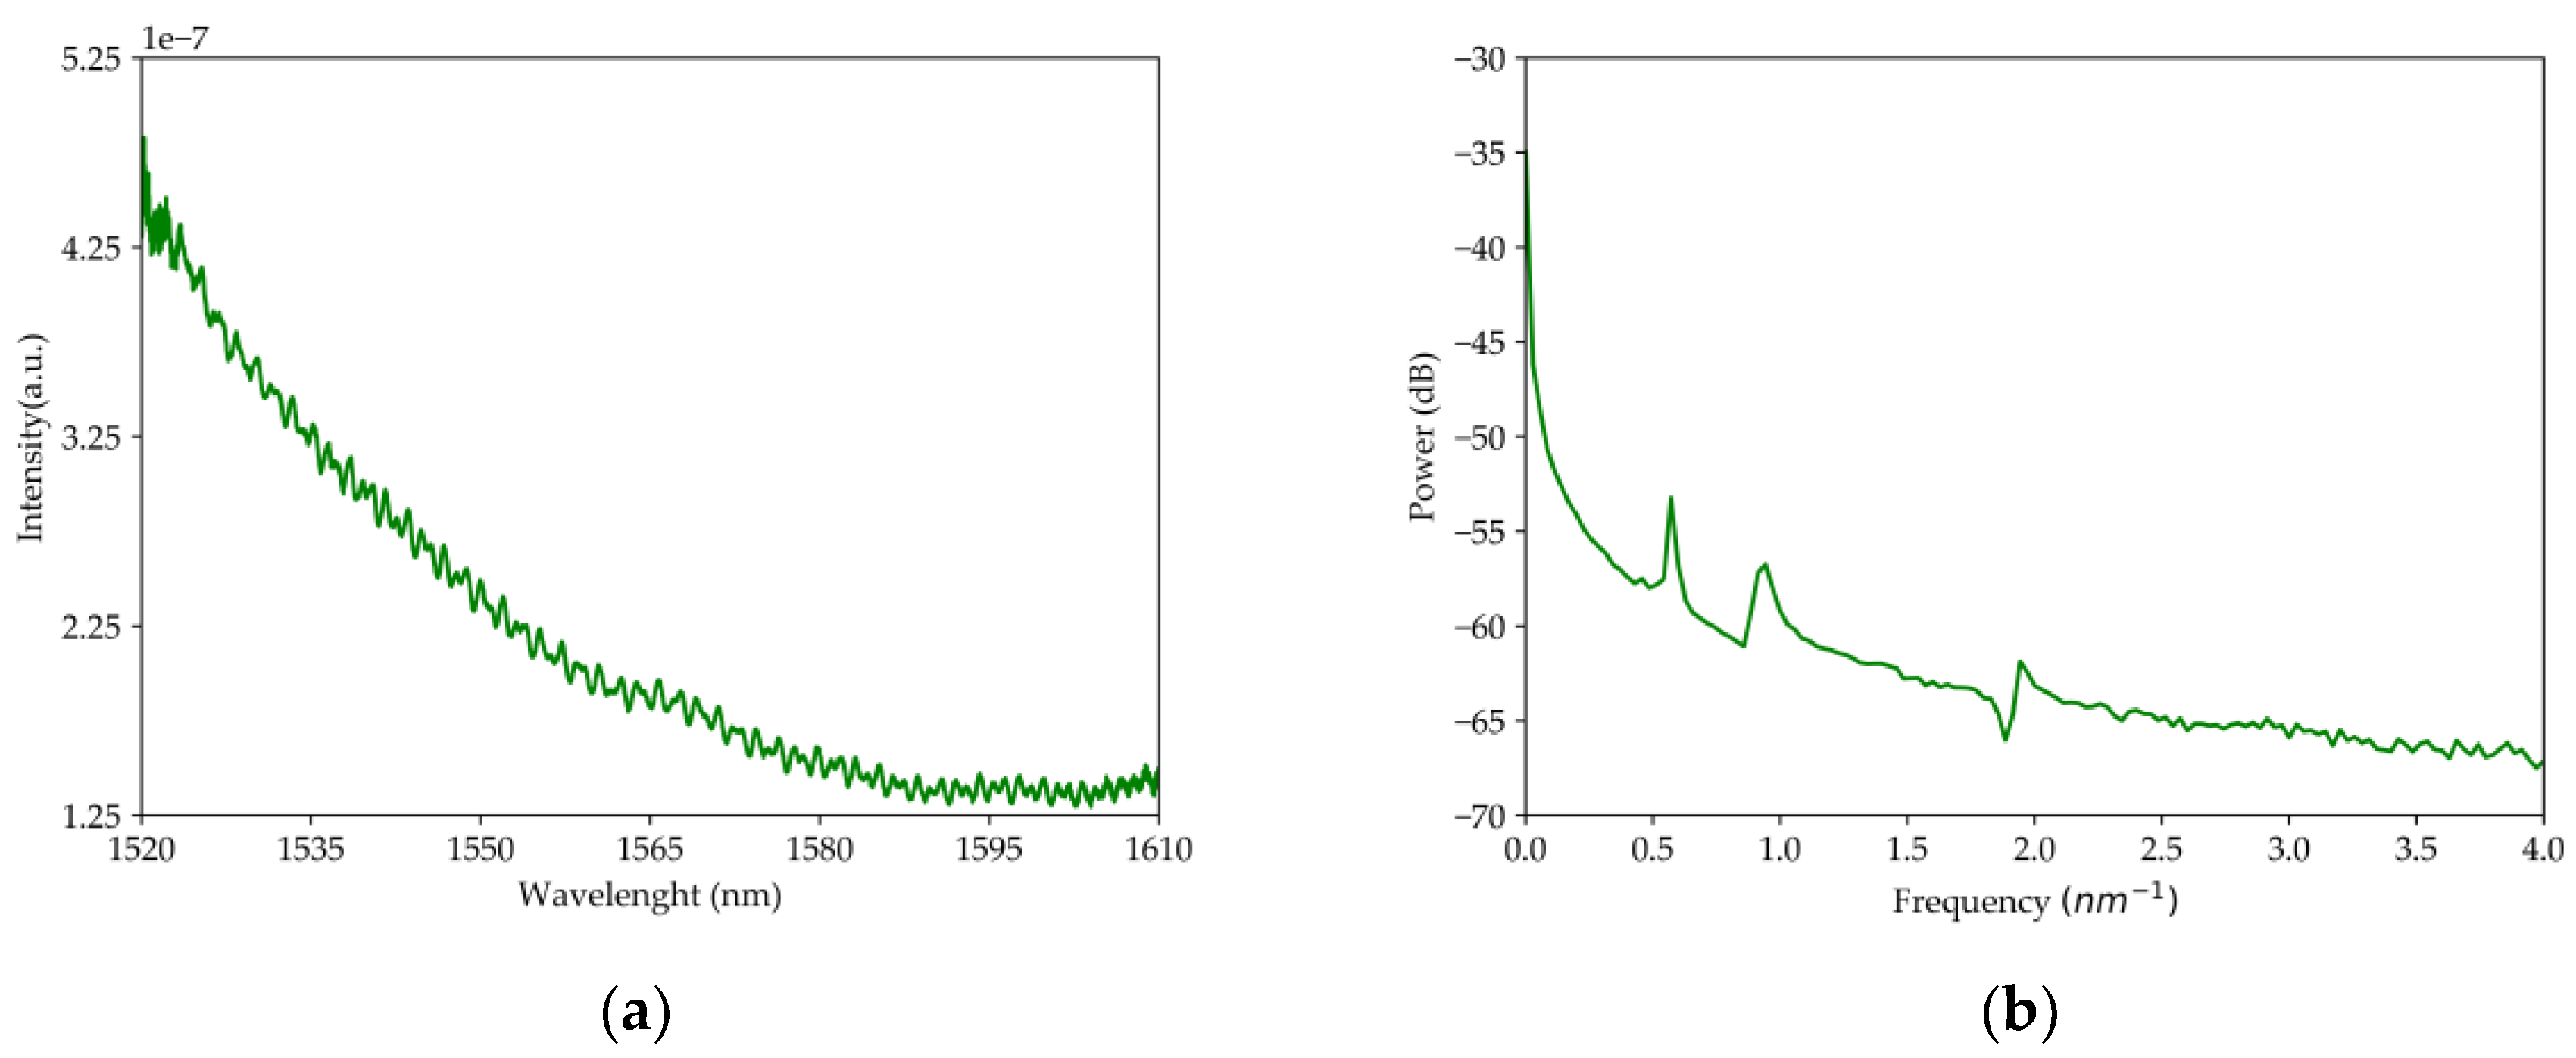
Figure 3a presents the spectral response of the multi-interferometer created by fiber microsphere coupled in a taper structure. The spectral response is complex, but the FFT (Fast Fourier Transform; Figure 3b) demonstrates the existence of three main interferometers. Optical paths result from the fact that the microsphere creates two mirrors, one at the top and one at the bottom. As the geometry is asymmetric, then generation of three interferences exists: two between the signal that moves in a straight line between the tapers and the light reflected in the mirrors and a third interference between the reflected light in the two mirrors. Therefore, if the microsphere is smaller, the length of the optical paths will be shorter and the difference between them will be small. If the microsphere is bigger, the difference between optical paths increases, but due to the increase in beam dispersion as well as to the increase of the reflections, the output signal power will be lower.
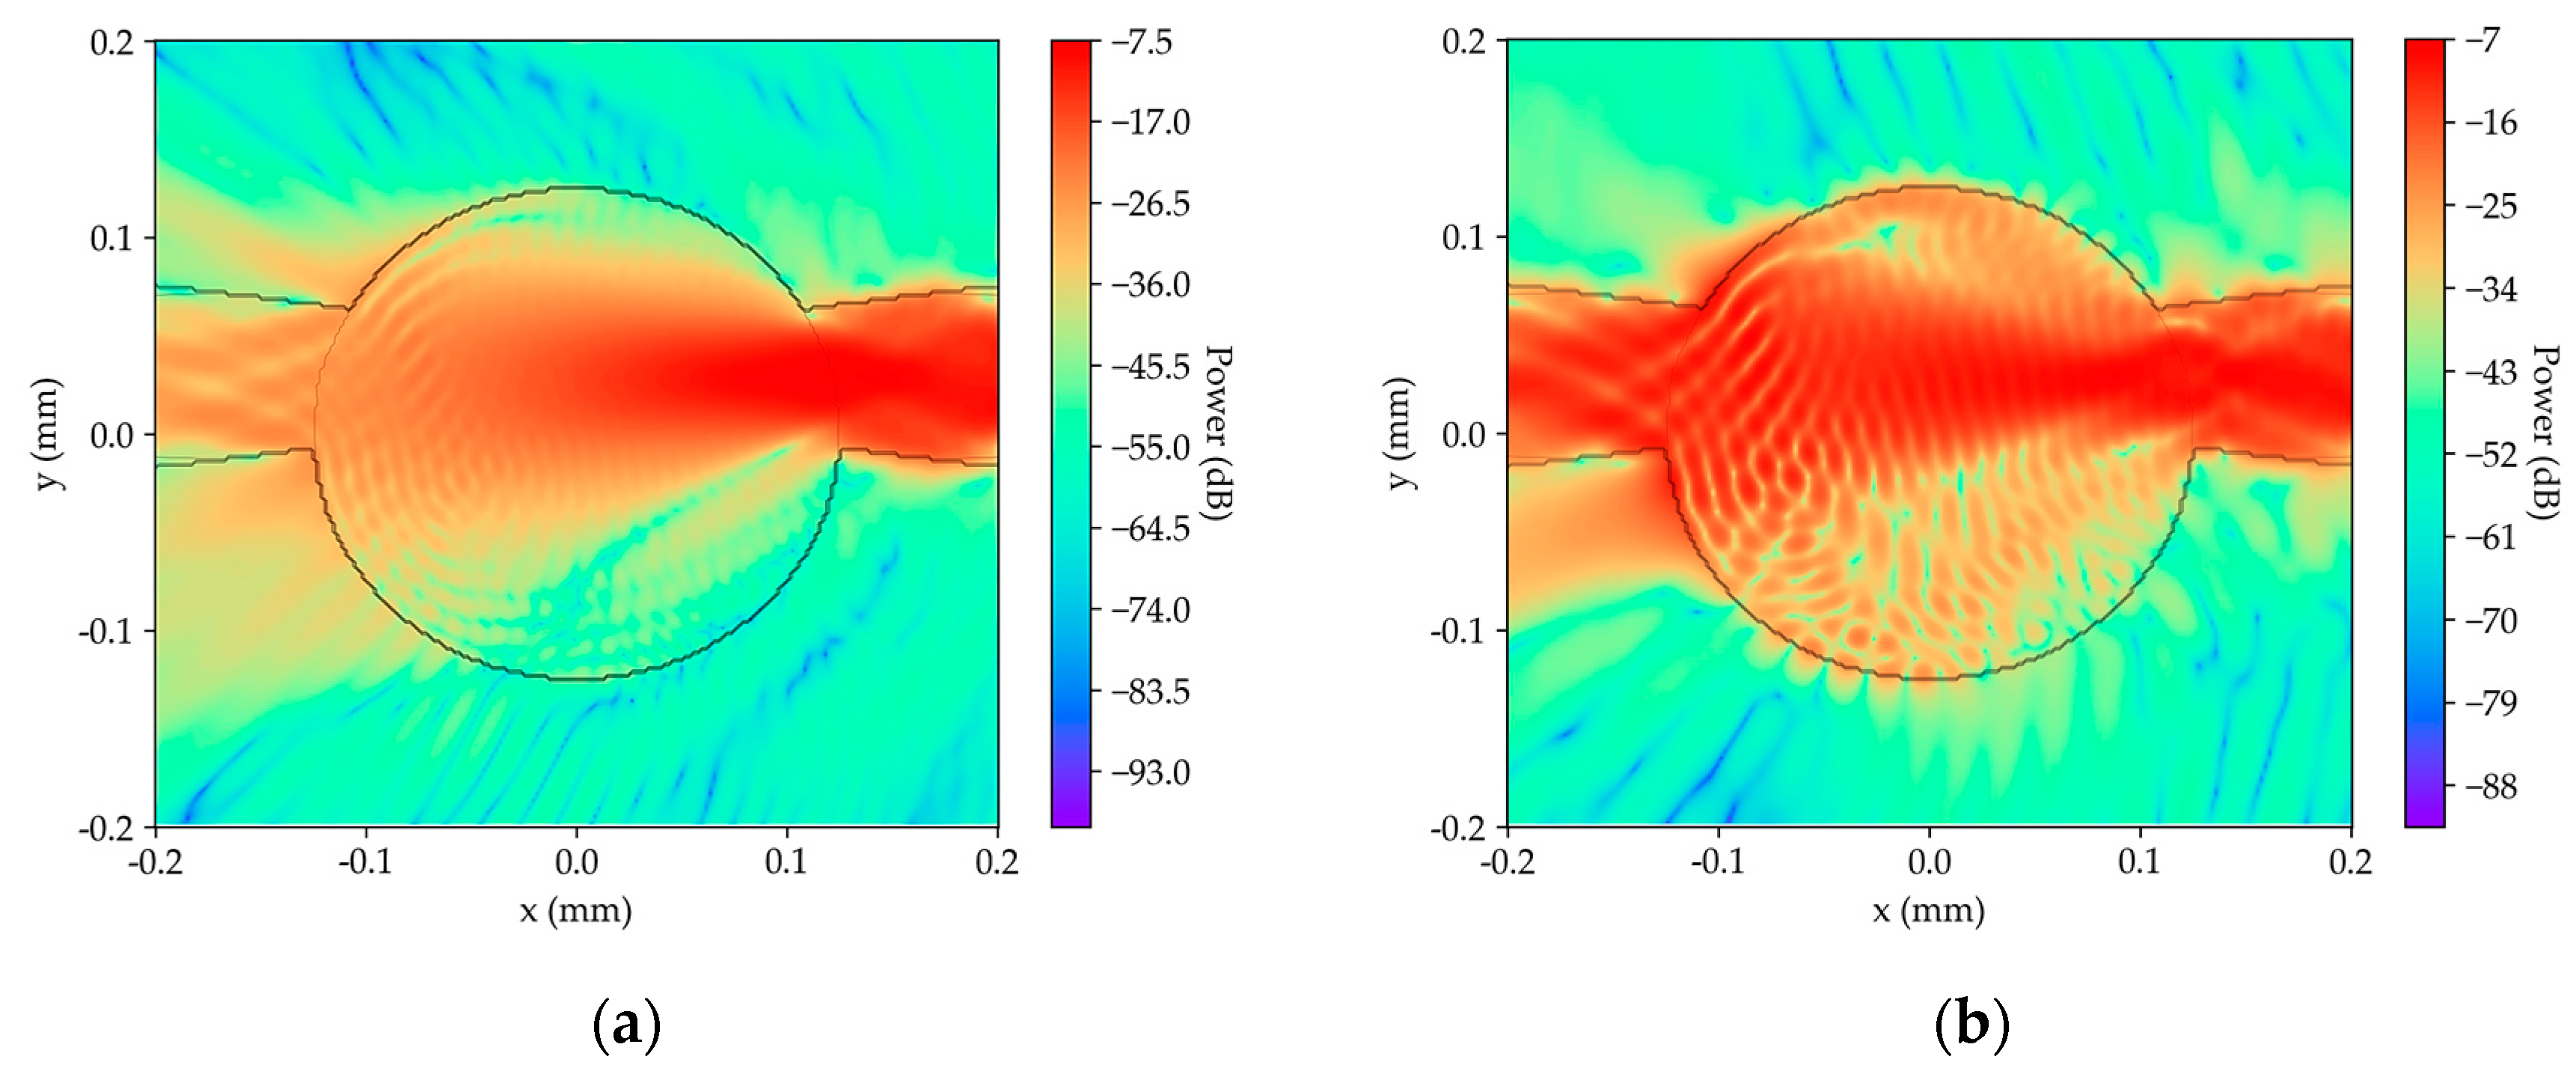
In Figure 4 are two frames of the simulation of the geometry performance. This uses the “Symmetric Split Step Fourier” method and the Hamiltonian, and considering that there are no nonlinear effects, it is as follows:
Figure 4a is the frame where the beam enters the microsphere, and Figure 4b includes several reflections in the microsphere. It is clearly possible to see the cone of light illuminating the exit taper, and when a curvature is applied to the taper, the direction of the cone will be altered, changing the properties of light in the exit taper.
3. Results
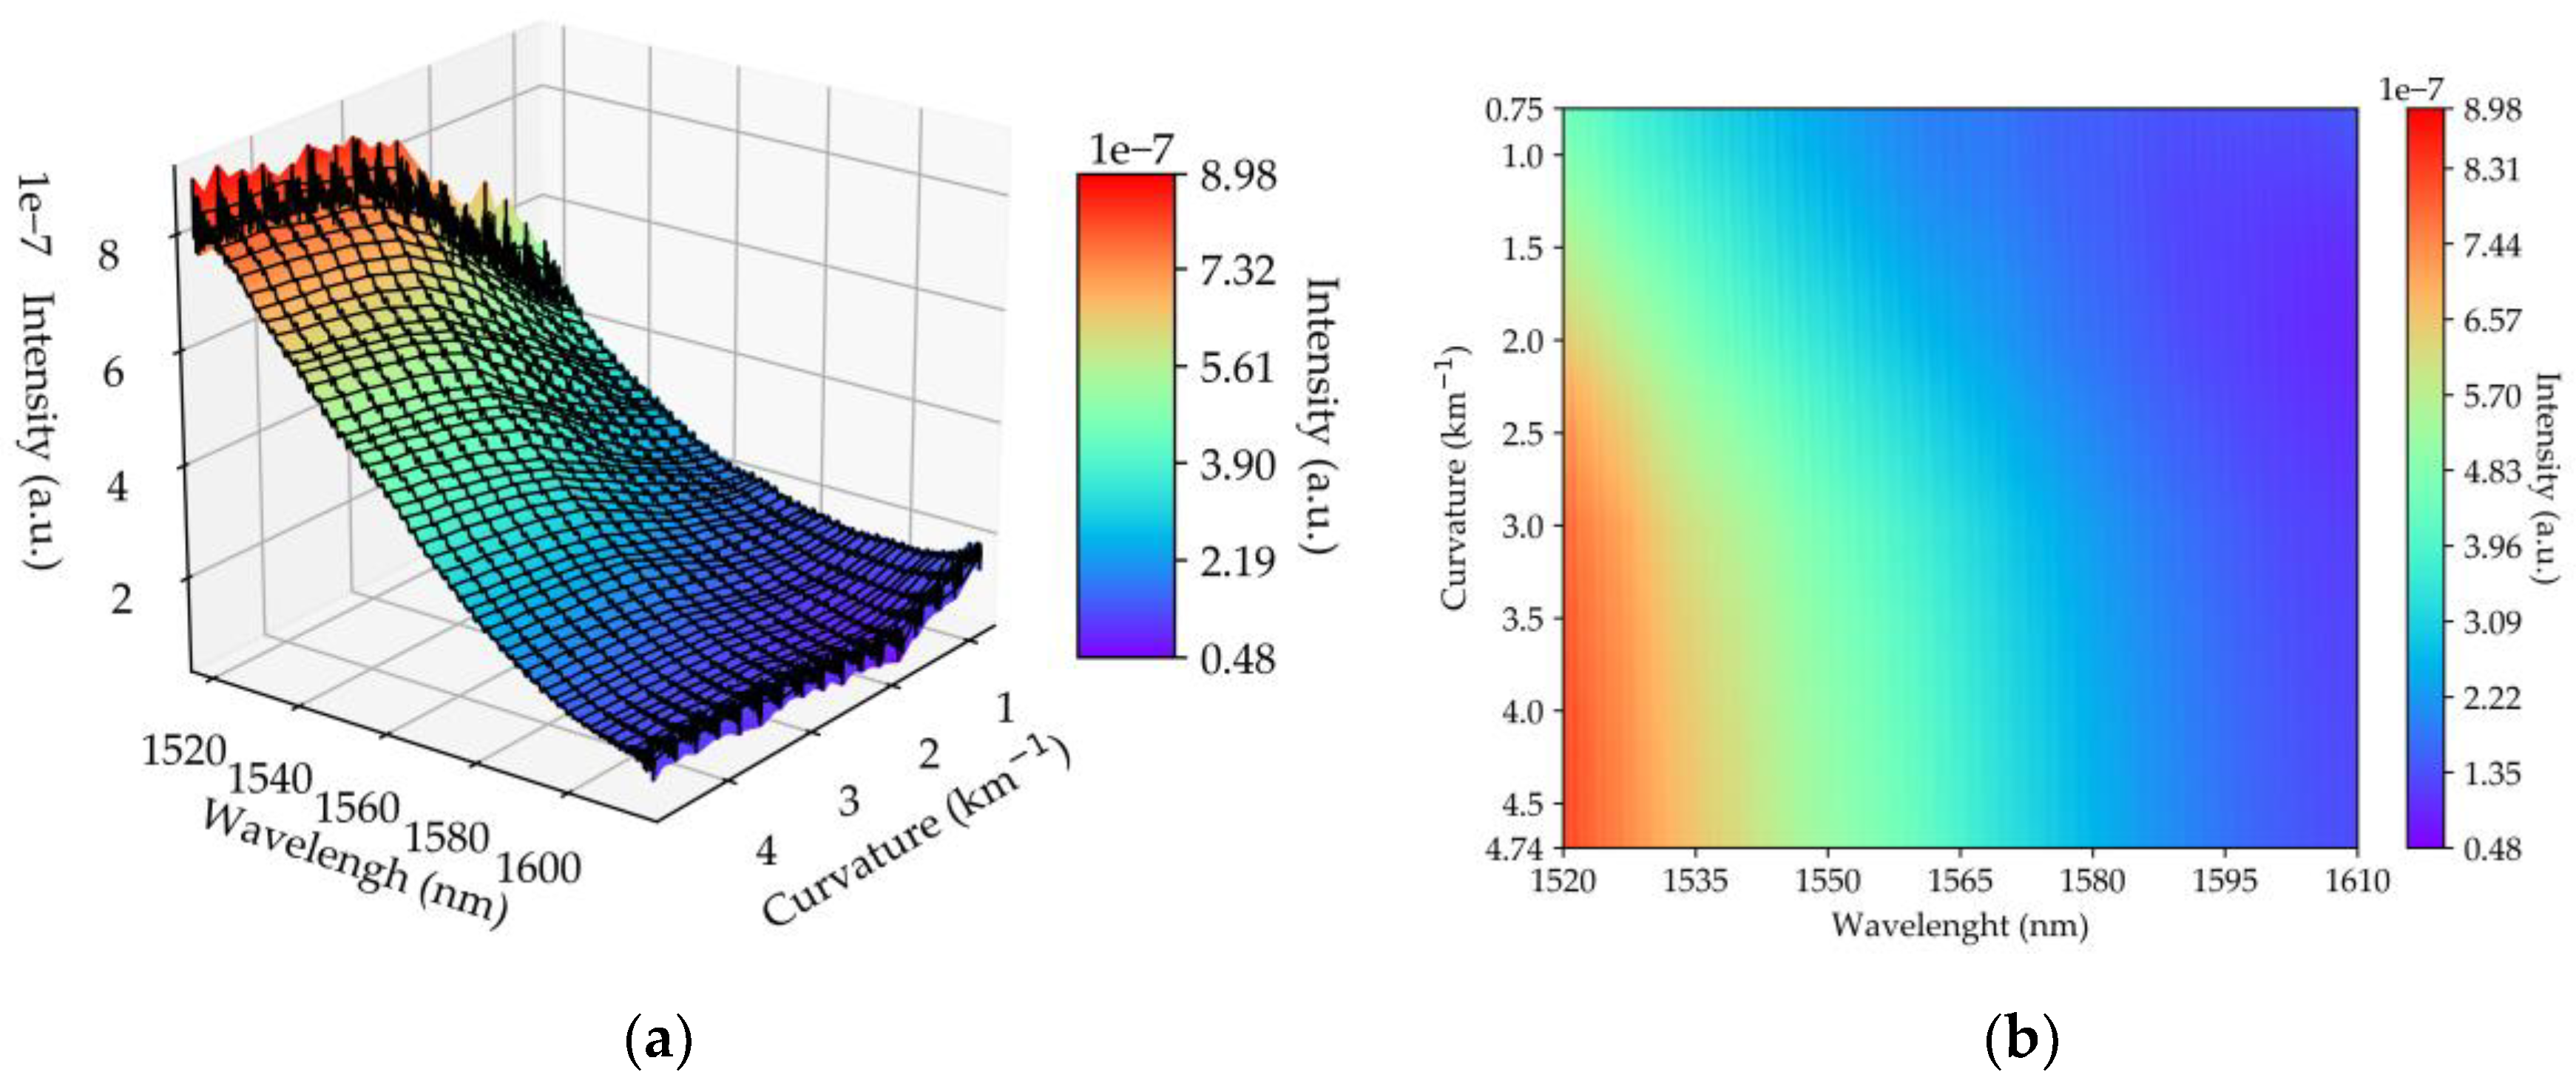
After the measurements, it is possible to obtain the graphs of Figure 5, where there are several fringes resulting from the interference of several optical pathways (the analysis of this sensor will be done based on its transfer function). Is observed that the profile of intensities for low curvatures is different in relation to larger curvatures. In addition, the wavelength variations where the relative extremums of the spectrum are located are a result of the phase variation introduced by the optical system under study.
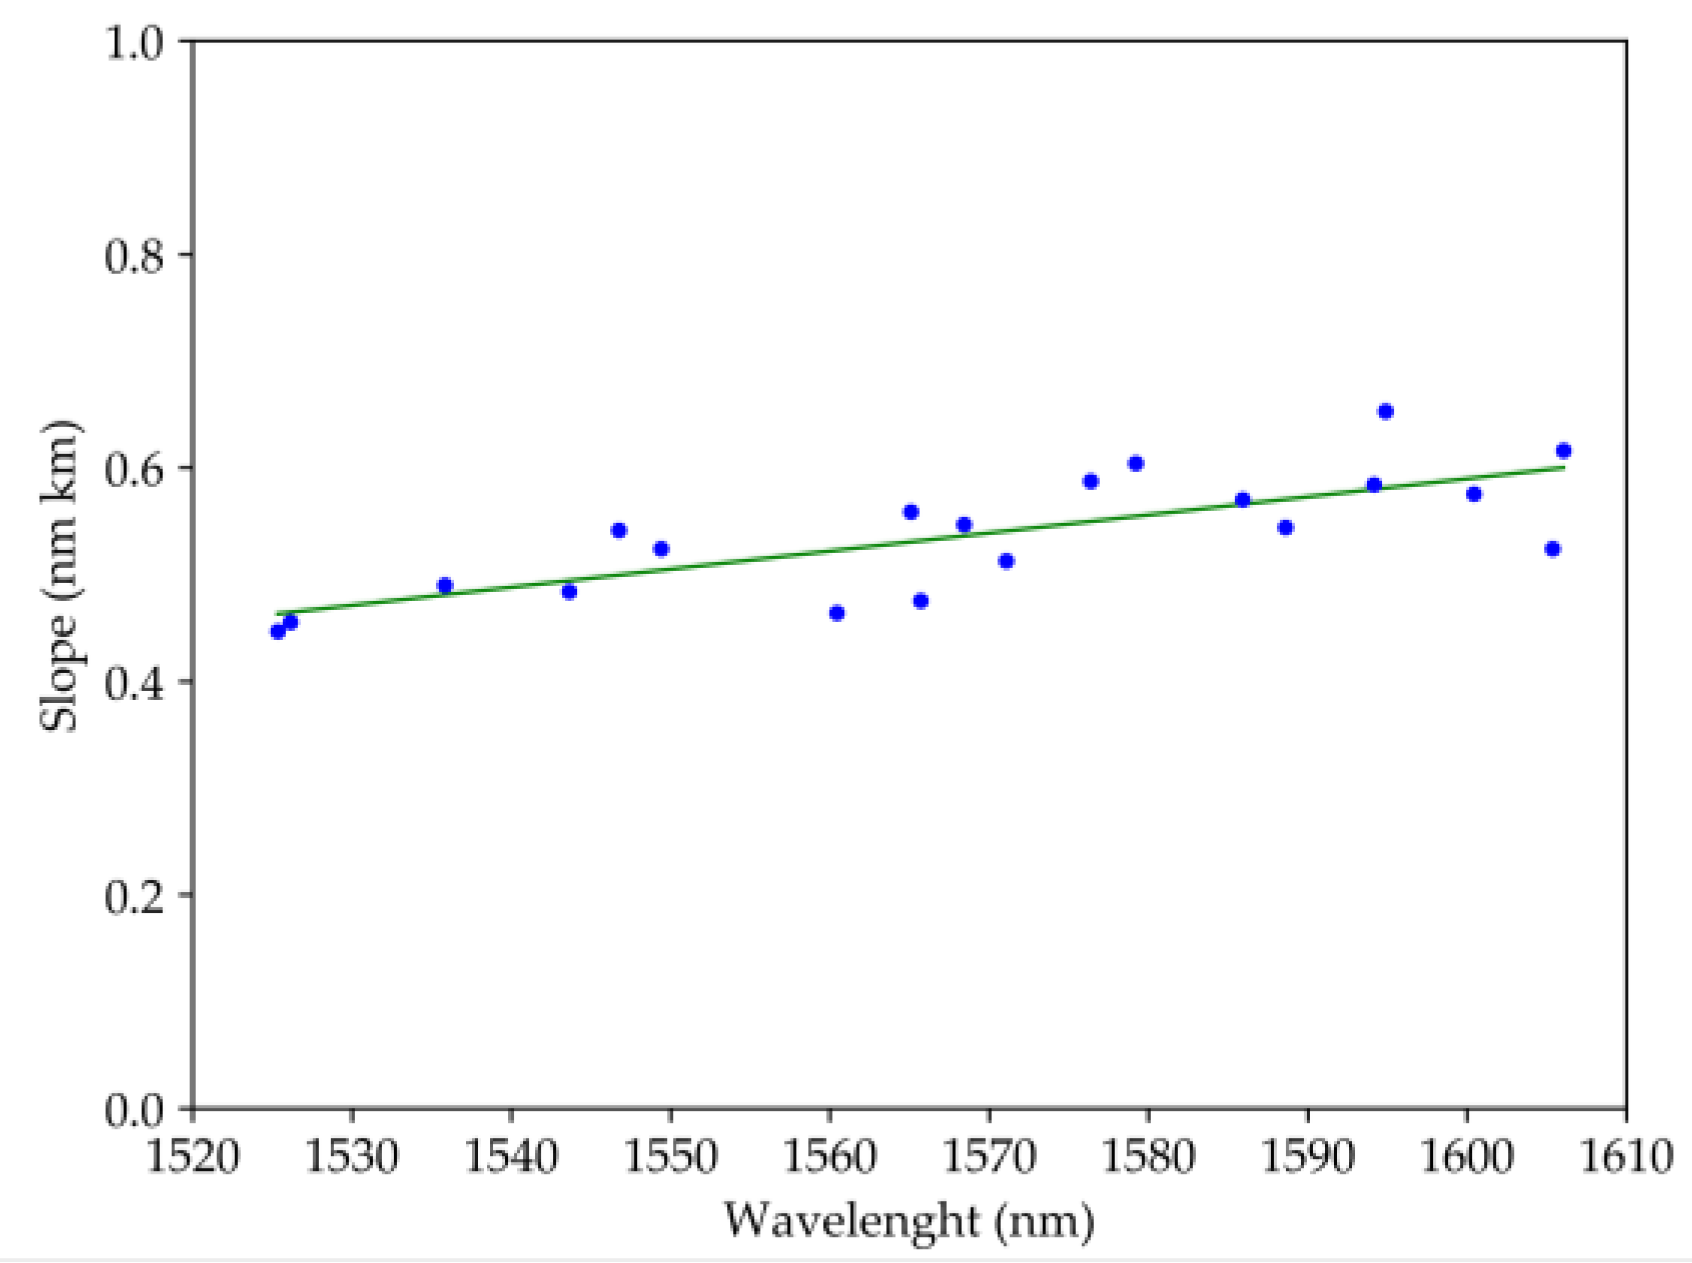
Is observed that the maxima and minima, as the curvature increases, move to higher wavelengths. In Figure 6, it is verified that, for wavelengths located at 1500 nm, the slope of the linear fit is smaller than for wavelengths at 1600 nm and the wavelength where there is higher sensitivity is 1594.88 nm and lower sensitivity is 1525.34 nm.
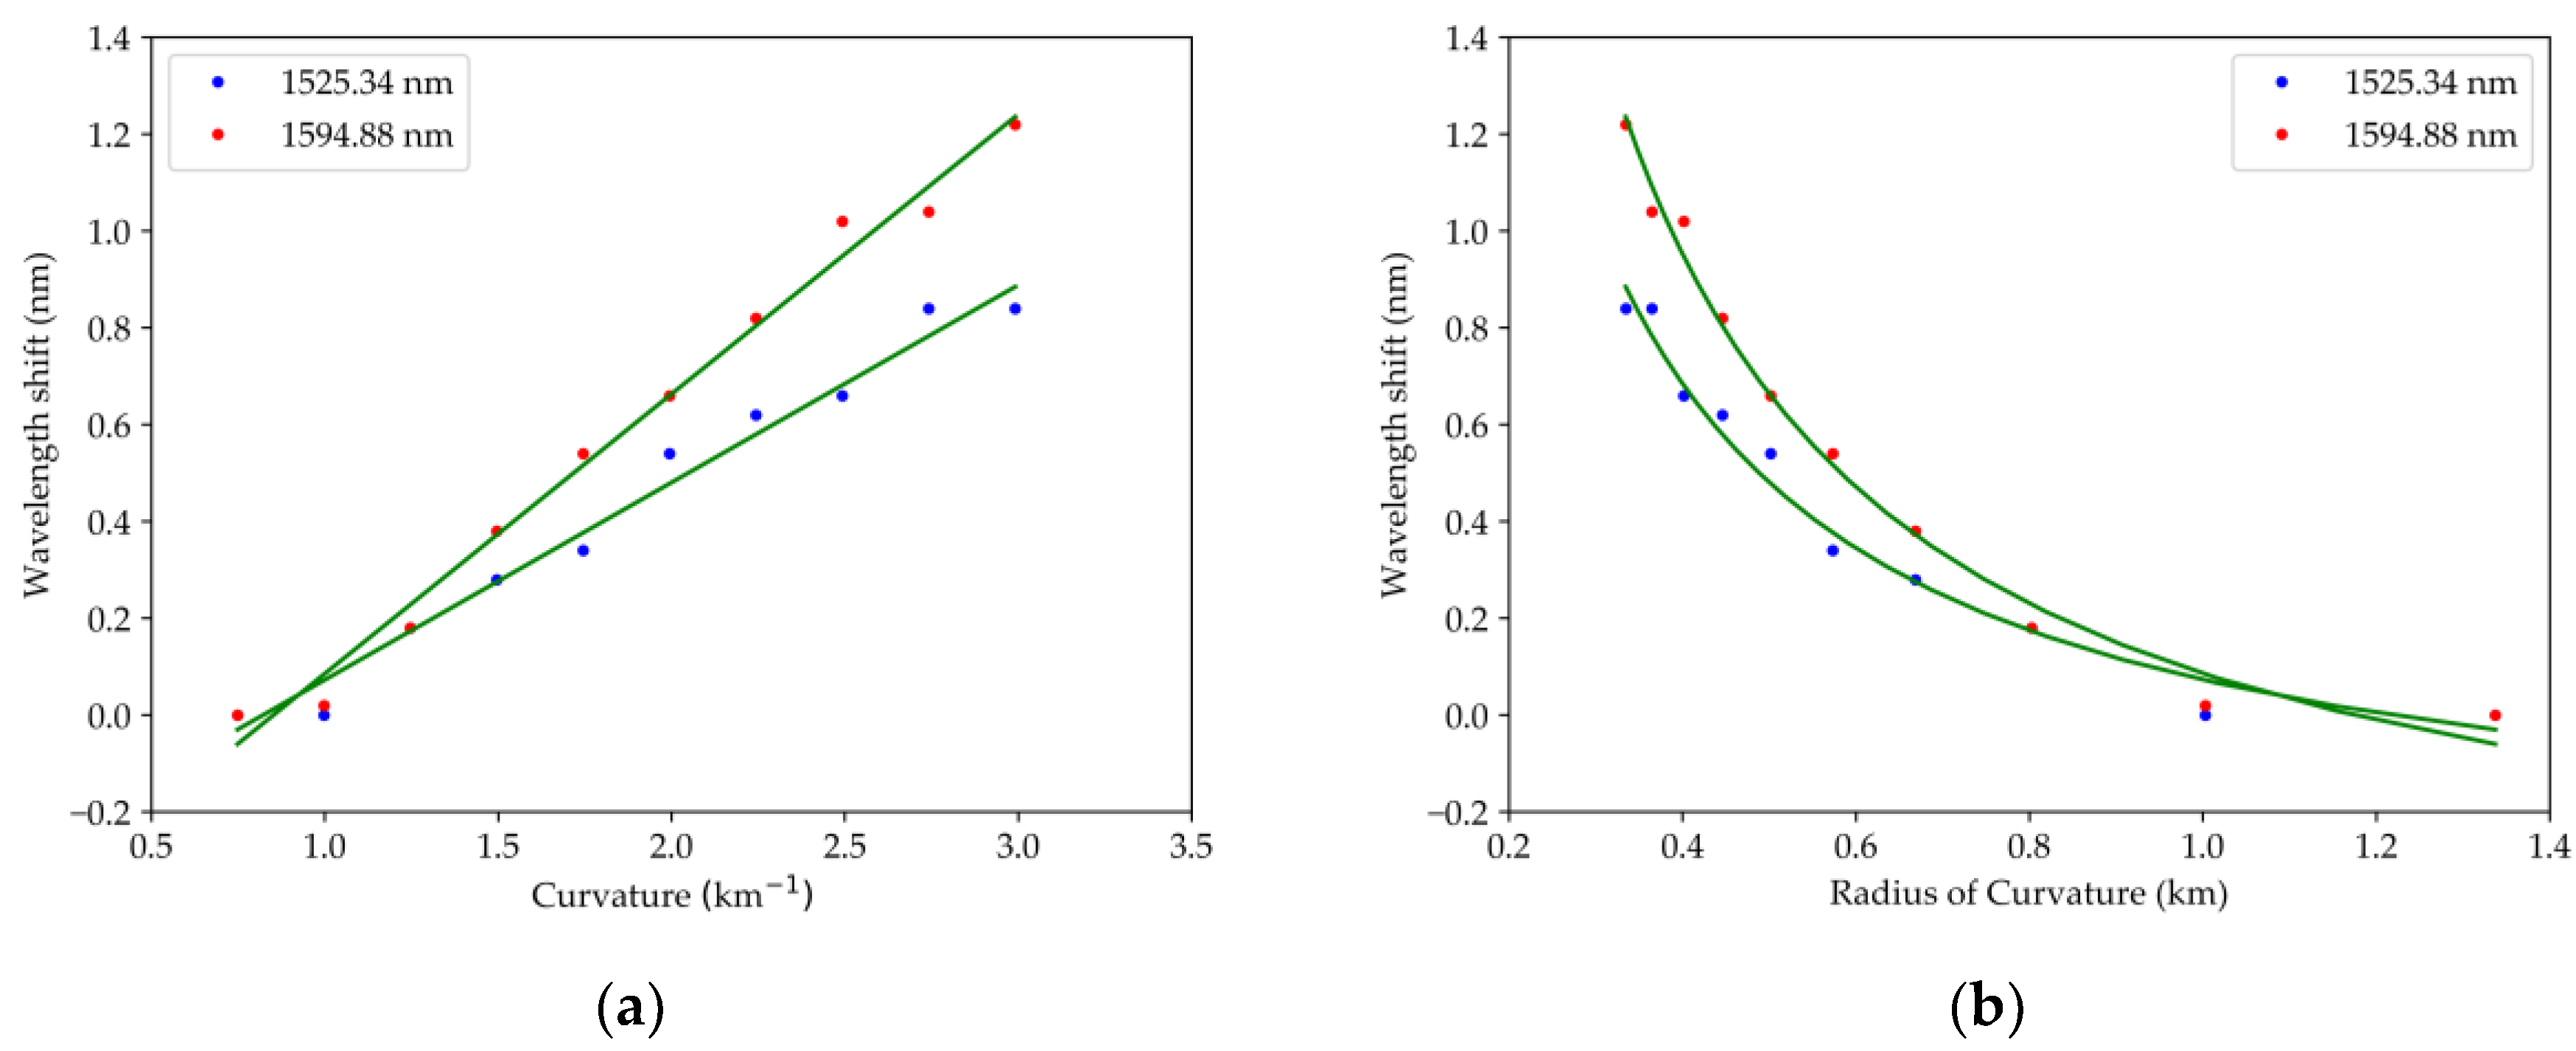
Regarding the linear behavior, Figure 7a, for high wavelengths, the sensitivity is 580 ± 20 (pm km) in a range of 1 to 3 km−1 with an r2 of 0.990. For low wavelengths, the sensitivity is 410 ± 20 (pm km) in a same range with an r2 of 0.98. Figure 7b contains the same wavelength range as that of Figure 7a, but it depends on the radius of curvature and presents a nonlinear behavior as expected.
This result is expected due to the sensor head’s geometry. When the sensor is stretched and begins to suffer curvature, the increased sensitivity is due to the microsphere that is coupled to the tapers. That is, tapers change the optical path by injecting light into the microsphere. Given that the maximum spectrum can be obtained by the equation m = 2nl/λ, where m is the maximum’s order, n is the refractive index, and λ is the wavelength, since the region is below 3 km−1, the length wave where they are located increases, so the length of the optical path increases. Throughout the experimental realization, the entire structure demonstrated a good resistance to mechanical stresses in addition to the observed variations of signal due to these tensions.
4. Discussion and Conclusions
As the curvature increases, there are linear phase variations. The sensitivity is maximum for high wavelengths (close to 1600 nm). This work proves that this type of geometry allows to accurately measure large curvatures to which the fiber is subjected, opening the door for application not only as a sensor of curvature but also of oscillations. This structure has a sensitivity of 580 ± 20 (pm km) that is higher than the sensitivity in the literature (see the Introduction section). To reduce reflection losses, a coating can be used to increase the internal reflectivity; however, the mobility of the input and output fibers must be considered. We concluded that this structure can be applied in a large structure, especially in civil engineering applications such as bridges, electric cables, buildings, tunnels, and pipelines.
Author Contributions
P.R. performed the experimental work, analyzed the data, and wrote the article; O.F. supervised and reviewed.
Funding
This work is financed by national funds through the Portuguese funding agency, FCT—Fundação para a Ciência e a Tecnologia within project UID/EEA/50014/2019.
Conflicts of Interest
The authors declare no conflict of interest.
References
- Ferreira, M.S.; Santos, J.L.; Frazão, O. Silica microspheres array strain sensor. Opt. Lett. 2014, 39, 5937–5940. [Google Scholar] [CrossRef] [PubMed]
- Murphy, R.; Lei, F.; Ward, J.; Yang, Y.; Chormaic, S. All-optical nanopositioning of high-Q silica microspheres. Opt. Express 2017, 25, 13101–13106. [Google Scholar] [CrossRef] [PubMed] [Green Version]
- Kieu, Q.K.; Veiko, V.P. Laser fabrication of optical microspheres. In Proceedings of the Laser-Assisted Micro and Nanotechnologies 2003, St. Petersburg, Russia, 2 April 2004. [Google Scholar]
- Yu, H.; Huang, Q.; Zhao, J. Fabrication of an Optical Fiber microsphere with a Diameter of Several Tens of Micrometers. Materials 2014, 7, 4878–4895. [Google Scholar] [CrossRef] [PubMed]
- Foreman, M.R.; Swaim, J.D.; Vollmer, F. Whispering gallery mode sensors. Adv. Opt. Photonics 2015, 7, 168–240. [Google Scholar] [CrossRef] [PubMed]
- Soria, S.; Berneschi, S.; Brenci, M.; Cosi, F.; Conti, G.N.; Pelli, S.; Righini, G.C. Optical Microspherical Resonators for Biomedical Sensing. Sensor 2012, 11, 785–805. [Google Scholar] [CrossRef] [PubMed]
- Ali, A.R.; Afifia, A.N.; Tahaa, H. Optical signal processing and tracking of whispering gallery modes in real-time for sensing applications. In Proceedings of the Integrated Photonics: Materials, Devices, and Applications IV, SPIE Microtechnologies, Barcelona, Spain, 30 May 2017; Volume 10249. [Google Scholar] [CrossRef]
- Pöllinger, M.; Rauschenbeutel, A. All-optical signal processing at ultra-low powers in bottle microresonators using the Kerr effect. Opt. Express 2010, 18, 17764–17775. [Google Scholar] [CrossRef] [PubMed]
- Ward, J.; Benson, O. WGM microresonators: Sensing, lasing and fundamental optics with microspheres. Laser Photonics Rev. 2011, 5, 553–570. [Google Scholar] [CrossRef]
- Reynolds, T.; Riesen, N.; Meldrum, A.; Fan, X.; Hall, J.M.; Monro, T.M.; François, A. Fluorescent and lasing whispering gallery mode microresonators for sensing applications. Laser Photonics Rev. 2017, 11, 1600265. [Google Scholar] [CrossRef]
- Yan, S.B.; Wang, X.Q.; Ma, K.Z.; Zhang, A.F.; Xue, C.Y.; Zhang, W.D. Fabrication and Analysis Optical Microsphere Cavity Based on High Q Erbium-doped. In Proceedings of the 8th IEEE International Conference Nano/Micro Engineered and Molecular Systems (NEMS), Suzhou, China, 7–10 April 2013. [Google Scholar] [CrossRef]
- Salceda-Delgado, G.; Martínez-Ríos, A.; Selvas-Aguilar, R.; Álvarez-Tamayo, R.I.; Castillo-Guzmán, A.; Ibarra-Escamilla, B.; Duran-Ramirez, V.M.; Enriquez-Gomez, L.F. Adaptable Optical Fiber Displacement-Curvature Sensor Based on a Modal Michelson Interferometer with a Tapered Single Mode Fiber. Sensors 2017, 17, 1259. [Google Scholar] [CrossRef] [PubMed]
- Gong, Y.; Zhao, T.; Rao, Y.; Wu, Y. All-Fiber Curvature Sensor Based on Multimode Interference. IEEE Photonics Technol. Lett. 2011, 23, 679–681. [Google Scholar] [CrossRef]
- Su, Y.; Wei, Y.; Zhang, Y.; Liu, C.; Nie, X.; Zhu, Z.; Liu, L. Surface-Plasmon-Resonance-Based Optical Fiber Curvature Sensor with Temperature Compensation by Means of Dual Modulation Method. Sensors 2018, 18, 2608. [Google Scholar] [CrossRef] [PubMed]
- Silva, S.; Pachon, E.G.; Franco, M.A.; Jorge, P.; Santos, J.L.; Malcata, F.X.; Cordeiro, C.M.; Frazão, O. Curvature and Temperature Discrimination Using Multimode Interference Fiber Optic Structures—A Proof of Concept. J. Lightwave Technol. 2012, 30, 3569–3575. [Google Scholar] [CrossRef]
Figure 1.
Fabrication scheme of head sensor based on microsphere coupled between the short taper: (a) taper, (b) cleaving of the microsphere and tip, (c) clamping of the stem, and (d) fusion of the microsphere and other taper.
Figure 1.
Fabrication scheme of head sensor based on microsphere coupled between the short taper: (a) taper, (b) cleaving of the microsphere and tip, (c) clamping of the stem, and (d) fusion of the microsphere and other taper.

Figure 2.
Experimental setup scheme of head sensor based on microsphere coupled between the short taper.
Figure 2.
Experimental setup scheme of head sensor based on microsphere coupled between the short taper.

Figure 3.
(a) Spectral response of the interferometer; (b) Fast Fourier Transform (FFT) of Figure 3a.
Figure 3.
(a) Spectral response of the interferometer; (b) Fast Fourier Transform (FFT) of Figure 3a.

Figure 4.
Simulation of the geometry: (a) frame 103 and (b) frame 143.

Figure 5.
Transfer function depending of the wavelength and the curvature: (a) 3-D and (b) 2-D.

Figure 6.
Slope of various extremes of the spectrum as a function of the wavelength where these extremes are located at the smallest curvature.
Figure 6.
Slope of various extremes of the spectrum as a function of the wavelength where these extremes are located at the smallest curvature.

Figure 7.
Variation of the two distinct wavelengths as a function of (a) curvature and (b) radius of curvature.
Figure 7.
Variation of the two distinct wavelengths as a function of (a) curvature and (b) radius of curvature.

© 2019 by the authors. Licensee MDPI, Basel, Switzerland. This article is an open access article distributed under the terms and conditions of the Creative Commons Attribution (CC BY) license (http://creativecommons.org/licenses/by/4.0/).
Share and Cite
MDPI and ACS Style
Robalinho, P.; Frazão, O. Fiber Microsphere Coupled in a Taper for a Large Curvature Range. Fibers 2019, 7, 87. https://doi.org/10.3390/fib7100087
AMA Style
Robalinho P, Frazão O. Fiber Microsphere Coupled in a Taper for a Large Curvature Range. Fibers. 2019; 7(10):87. https://doi.org/10.3390/fib7100087
Chicago/Turabian StyleRobalinho, Paulo, and Orlando Frazão. 2019. "Fiber Microsphere Coupled in a Taper for a Large Curvature Range" Fibers 7, no. 10: 87. https://doi.org/10.3390/fib7100087
Note that from the first issue of 2016, this journal uses article numbers instead of page numbers. See further details here.