1. Introduction
The fiber dominated tensile strength of a composite material is an important design parameter. It is typically measured on unidirectional laminates [
1,
2] or it can be back calculated from cross-plied or other laminate configurations. Back calculation first requires calculation of the UD elastic constants from the laminate performance [
3]. Subsequently, a failure criterion needs to be applied [
4,
5]. A simple approach to obtain the strength assumes the strain to failure of the fibers does not change, combined with the maximum strain criterion. The data is typically well known for the common fiber-matrix combinations. When using composites in harsh environments over long periods, the fiber dominated strength may drop. The strength reduction with time under such conditions is not well documented and the mechanisms are not completely understood. This lack of understanding is a problem where composites are used with long term exposure to a combination of high temperatures, water and/or oil. Obtaining these data requires extensive test programs that are time consuming and costly.
Using a multiscale approach can potentially simplify the test effort by investigating the performance of the fibers and matrix separately and then predicting many properties of the composite laminate from the constituent’s behavior. This paper focuses on one such aspect, the change in strength of the fibers when exposed to water or oil, thereby providing a building block for a full multiscale analysis. (For a full design the complete set of properties is needed.) Glass and carbon fibers exposed to water and toluene at 60 °C are investigated. Toluene is chosen as a low molecular weight component of oil. The effect of sizing on the fibers also will be analyzed as an important part to understanding the degradation of strength.
The strength reduction with time will be investigated for the simple case where the fibers are exposed to the environment without being loaded, so called “zero stress aging”. Extension of the results to other loading conditions, and to applying the results for composite laminates, will be discussed.
Carbon fibers are typically seen to be chemically inert and should not degrade from exposure to water or toluene. Somewhat surprisingly there seemed to be no documentation of this inertness in the open literature. Glass fibers are known to lose strength with time, as will be described in the next section.
2. Modeling Strength Loss of Glass Fibers Due to the Environment
Glass fibers can be seen as a brittle material and the strength of the fiber
can be described by the well-known Griffith equation (Equation (1a)) [
6] or an equivalent fracture mechanics approach (Equation (1b)):
where
is the Young’s modulus,
is the surface energy of the fiber,
is the fracture toughness and
is the crack length.
is a geometry correction factor for specimens of finite size—values for a rod with a crack can be found in [
7].
is taken to be constant for the small changes in crack length relevant for this study. A delayed fracture due to environmental attack on the fiber already was attributed to a growth of the flaw by Inglis [
8], Griffith [
6] and Orowan [
9] and further discussed by Charles [
10,
11]. It was pointed out that the sharpness of the crack must remain constant and blunting of the crack tip would increase the fiber’s strength. This assumption also is used here. It also was postulated that the crack growth velocity should be related to a corrosion rate. Delayed failure due to crack growth would only happen if the corrosion rate of the crack is faster than the corrosion rate of the fiber. When the corrosion rate of the fiber was the same as the crack growth rate, the crack length would not increase because the radius of the fiber would decrease by the same amount as the length of the crack tip grows.
Mathematically the crack length
can be expressed as:
where
is the initial crack length,
is the crack growth rate or velocity and
is the rate of the fiber’s radius change with time.
The growth velocity of a crack in glass was quite extensively studied. The velocity goes through three phases [
12]. The initial phase is dependent on the stress intensity factor, the second phase is independent of the stress intensity factor and the final phase is very rapid. Regarding cracks filled with water, the initial phase dominates the crack velocity. It was stated by Freiman, Wiederhorn and Mecholsky [
13], that the crack velocity is described by:
where
is a constant,
is the chemical activity of water at the crack tip and
is the activation free energy of the reaction of at the crack tip.
and
are the gas constant and absolute temperature, respectively. According to Stephen W. Freiman, Sheldon M. Wiederhorn and John J. Mecholsky, Jr. [
13]
is given by:
where
is the radius of the crack tip,
is the surface tension of the glass,
is the surface tension of the glass in the activated state,
is the molar volume of the glass, and
is the molar volume of the glass in the activated state. T is the absolute temperature,
the activation entropy,
the activation energy and
the activation volume.
is the pressure at the crack tip, which also depends on the stress intensity factor. Since zero stress experiments were done in this study
= 0.
The authors of this paper studied the dissolution of glass fibers in distilled water (large “infinite” amount) for sized and unsized fibers. Regarding both cases, the dissolution could be well described with zero-order kinetics [
14,
15,
16].
Concerning unsized fibers , for sized fibers the dissolution rate is lower with . Note that the dissolution rate needs to be separated in a primary and secondary dissolution rate. This aspect will be added when the experimental results are discussed.
When modeling the glass fiber as a cylinder, mass loss is related to a surface area reduction. The change of mass from Equation (5) can be converted into a change of radius of the fibers with time [
16]:
The factor
describes the speed of the dissolution for the glass fibers. As described in Equations (3) and (4), more generally the dissolution speed is dependent on the radius of the surface. To account for the radius dependency the velocity of the dissolution can be given by:
where
is the crack sharpness amplification factor due to the thermodynamics described in Equations (3) and (4), in particular the last term in Equation (4). The factor is a function of the radius of the surface:
. The dissolution constant
addresses the energy and entropy terms in Equation (4). P = 0 since zero stress aging is investigated here.
When the cracks in the fiber are penetrated by water, the mass loss inside the crack should also be described by Equation (7). Since the radius of the glass fiber and of the crack tip of the flaw in the fiber are very different, the factor
is important. The length extension of the crack can then be described by a simple surface mass loss as
It is assumed here that the crack tip is not covered by the sizing, i.e., for the crack. Equation (8) is valid for any crack geometry, provided there is no preferred dissolution direction in the material, i.e., dr/dt = 0 in Equation (2). Equations (8) and (9) are based on an implicit assumption that the crack tip radius is constant, i.e., dr/dt = 0 in Equation (2) during dissolution.
The crack length is then the initial crack length and the crack velocity times time. The crack velocity is given by the difference in crack growth and radius shrinkage of the fiber due to dissolution of the glass in water:
Putting the time dependent crack length into the Griffith or fracture toughness equation should allow prediction of strength with time.
The time dependent strength also can be expressed in relation to the static (short term at t = 0) strength
giving the same equation for the Griffith or fracture mechanics approach:
Other authors found a similar time dependency of the effect of zero stress aging, but without linking the results directly to dissolution kinetics and using the empirical parameters
and
to modify the Griffith equation:
The same time dependency as in Equation (8) (
was predicted by Schultheisz et. al. [
17], based on the predictions by Charles [
11]. Experimental data showed that behavior at different temperatures, even though agreement with the formula was not perfect. Similar experimental trends were observed for optical glass fibers [
18,
19].
Hasløv et al. [
20] found a good fit of the data for
. Using linear elastic fracture mechanics rather than the Griffith equation, the same empirical relationship as in Equation (12) was obtained [
21,
22].
3. Materials and Methods
3.1. Fiber Bundles
Glass fiber and carbon fiber bundles were tested experimentally.
The glass fibers were boron-free and fluorine-free high strength, high modulus 3B HiPer-Tex
TM W2020 R-glass fiber bundles. The average fiber diameter was 17 ± 2 μm [
16,
23]. The density of glass (
) was 2.54 g/cm
3 [
16,
23]. The authors estimated that a bundle had about 4098 fibers [
16]. The Young’s modulus of the glass was 86 GPa [
23]. The fibers were sized with an epoxy compatible sizing.
Bare glass fibers were obtained by desizing the glass fibers via heat cleaning. The heat cleaning was done at 565 °C for 5 h. It should be noted that the heat cleaning might have had an effect on the density and the chemical nature of the surface layer of glass fibers, which could affect the initial dissolution of the desized glass fibers.
Carbon fibers SOFICAR TORAYCA T700SC 12000-50C (TORAYCA, Tacoma, WA, USA) were used. The bundles were in the shape of a tape, held together by some sort of binder. This binder was immediately soluble in both water and toluene.
3.2. Conditioning of Fiber Bundles
The fiber bundles were conditioned either in a water bath or in a toluene bath under no mechanical loads.
The water bath was filled with distilled water (0.5–1.0 MΩ·cm) produced via water purification system Aquatron A4000 (Cole–Parmer, Vernon Hills, IL, USA). The pH of the distilled water was 5.650 ± 0.010, being lower than neutral due to dissolved CO2 from the atmosphere in equilibrium. The toluene bath was used to represent an oil chemical. Toluene was of environmental grade (99.8+%) obtained from Alfa Aesar (Ward Hill, MA, USA).
The conditioning temperatures of 23 and 60 °C for toluene and water, respectively, was controlled to an accuracy of ±1 °C by a PID controller. After, conditioning samples were removed from the bath after 10 min, 5 days, 15 days, 30 days and 90 days for tensile tests. The fibers were dried and stored in air at room temperature before testing. Five to nine fiber bundles were tested per condition. All fiber bundles were tested approximately at the same time after the 90-day conditioning was finished.
3.3. Fiber Bundle Tensile Tests
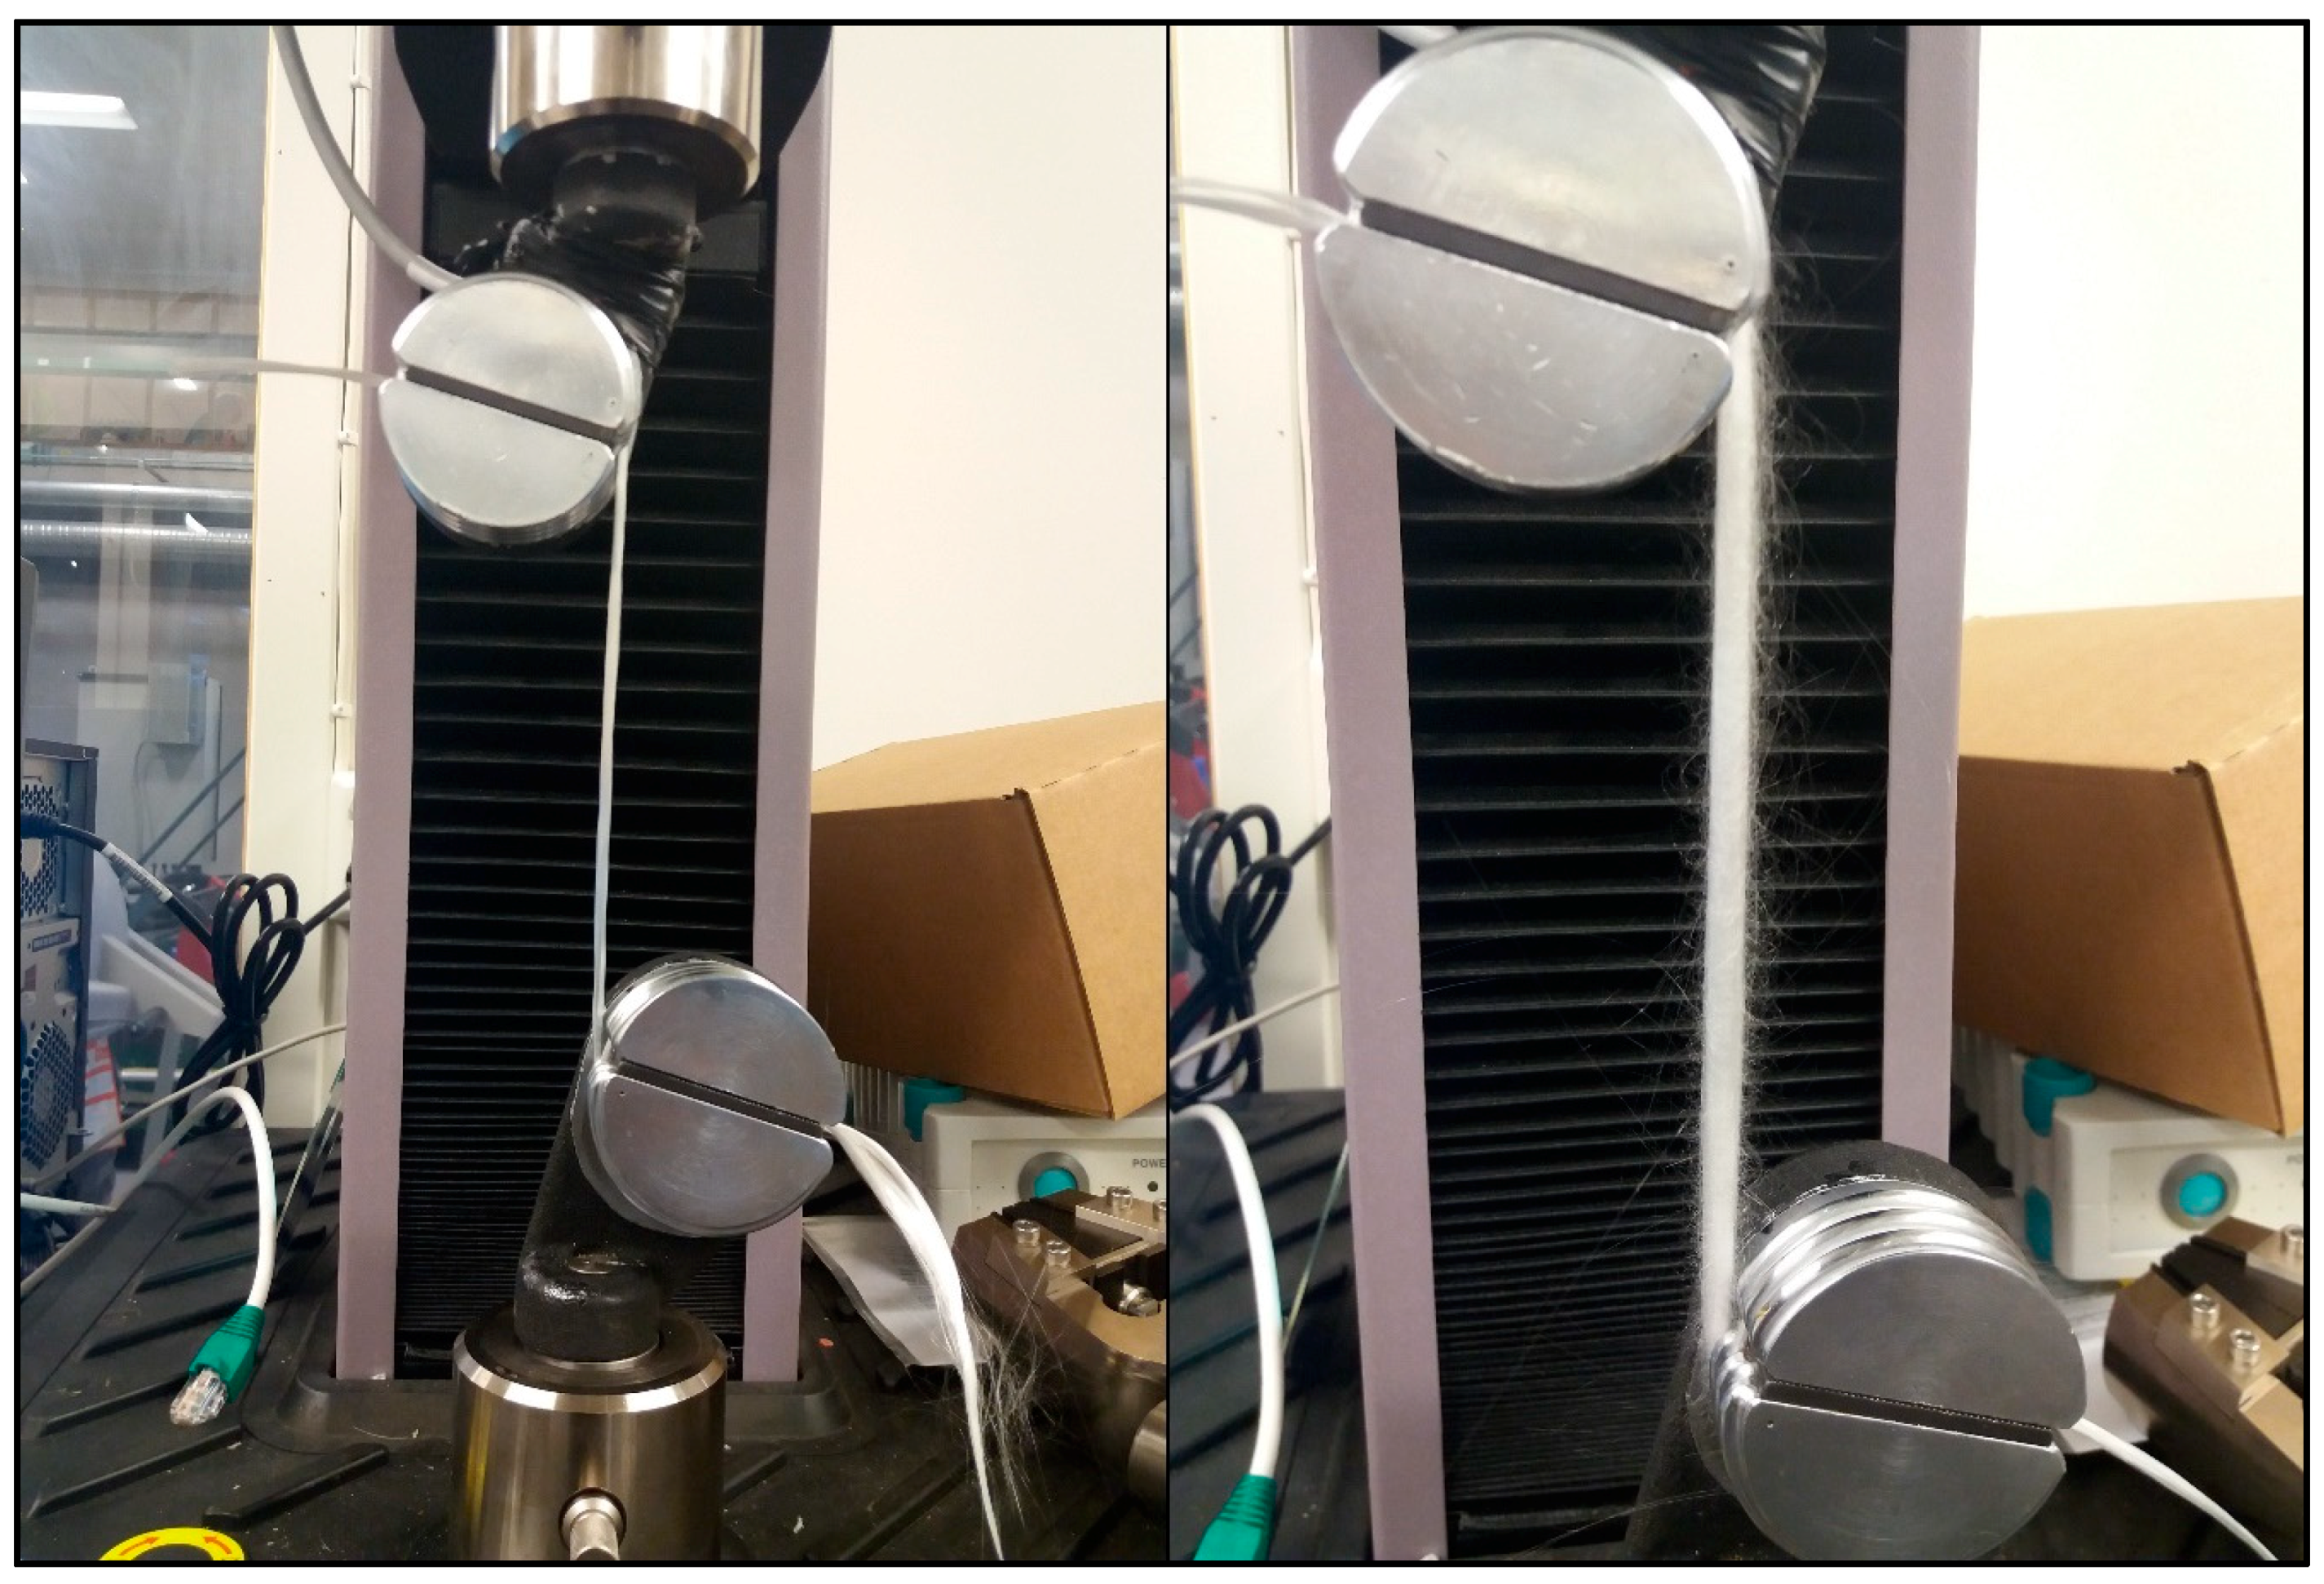
Tensile tests were conducted in air using a servo hydraulic test machine MTS Criterion Model 42 (MTS Systems Corporation, Eden Prairie, MN, USA) with custom grips made for the fiber bundles (seen in
Figure 1). The displacement rate was set to 1 mm/min. The temperature during the tests was about 23 °C (room temperature). Tensile tests were performed with 5 specimens for dry samples and for each aging time. The testing rig is shown in
Figure 1.
Failure of the glass fiber bundle was detected by a severe drop in the testing load. The maximum load from the load displacement curve was taken as the failure load. The fiber bundle’s failure is shown in the right picture of
Figure 1—when the fiber bundle fails, it looks as puffy as cotton (there are only a few fibers which are intact), but a few fibers still run from grip to grip. The length of the fiber bundles subjected to tension during tests (i.e., “gauge length”) was 200 mm.
Carbon fiber bundles were tested the same way and showed similar failure behavior.
3.4. Fiber Strength and Bundle Strength
Glass and carbon fibers show statistical variation of their strength. Weibull statistics are most widely used to characterize the strength of individual fibers [
24]. Getting meaningful statistical data requires testing of 40–100 individual fibers for one test condition [
25]. A simpler way to measure the strength is to test a whole bundle of fibers, especially for comparing different fibers, fiber treatments etc. [
26,
27,
28,
29]. Assuming the load displacement curves are measured carefully, it also is possible to back calculate the Weibull parameters of individual fibers. This work focused on investigating the relative change of the strength of the fibers after different exposure times to water at 60 °C. Assuming that Weibull and Young’s moduli remain constant, and that exposure to water only changes the characteristic strength of the fibers [
22], measuring the peak load of a bundle test is sufficient for exploring the strength changes. The fiber’s peak strength was calculated as the maximum load measured on the bundle divided by the total cross-sectional area of all fibers in a bundle.
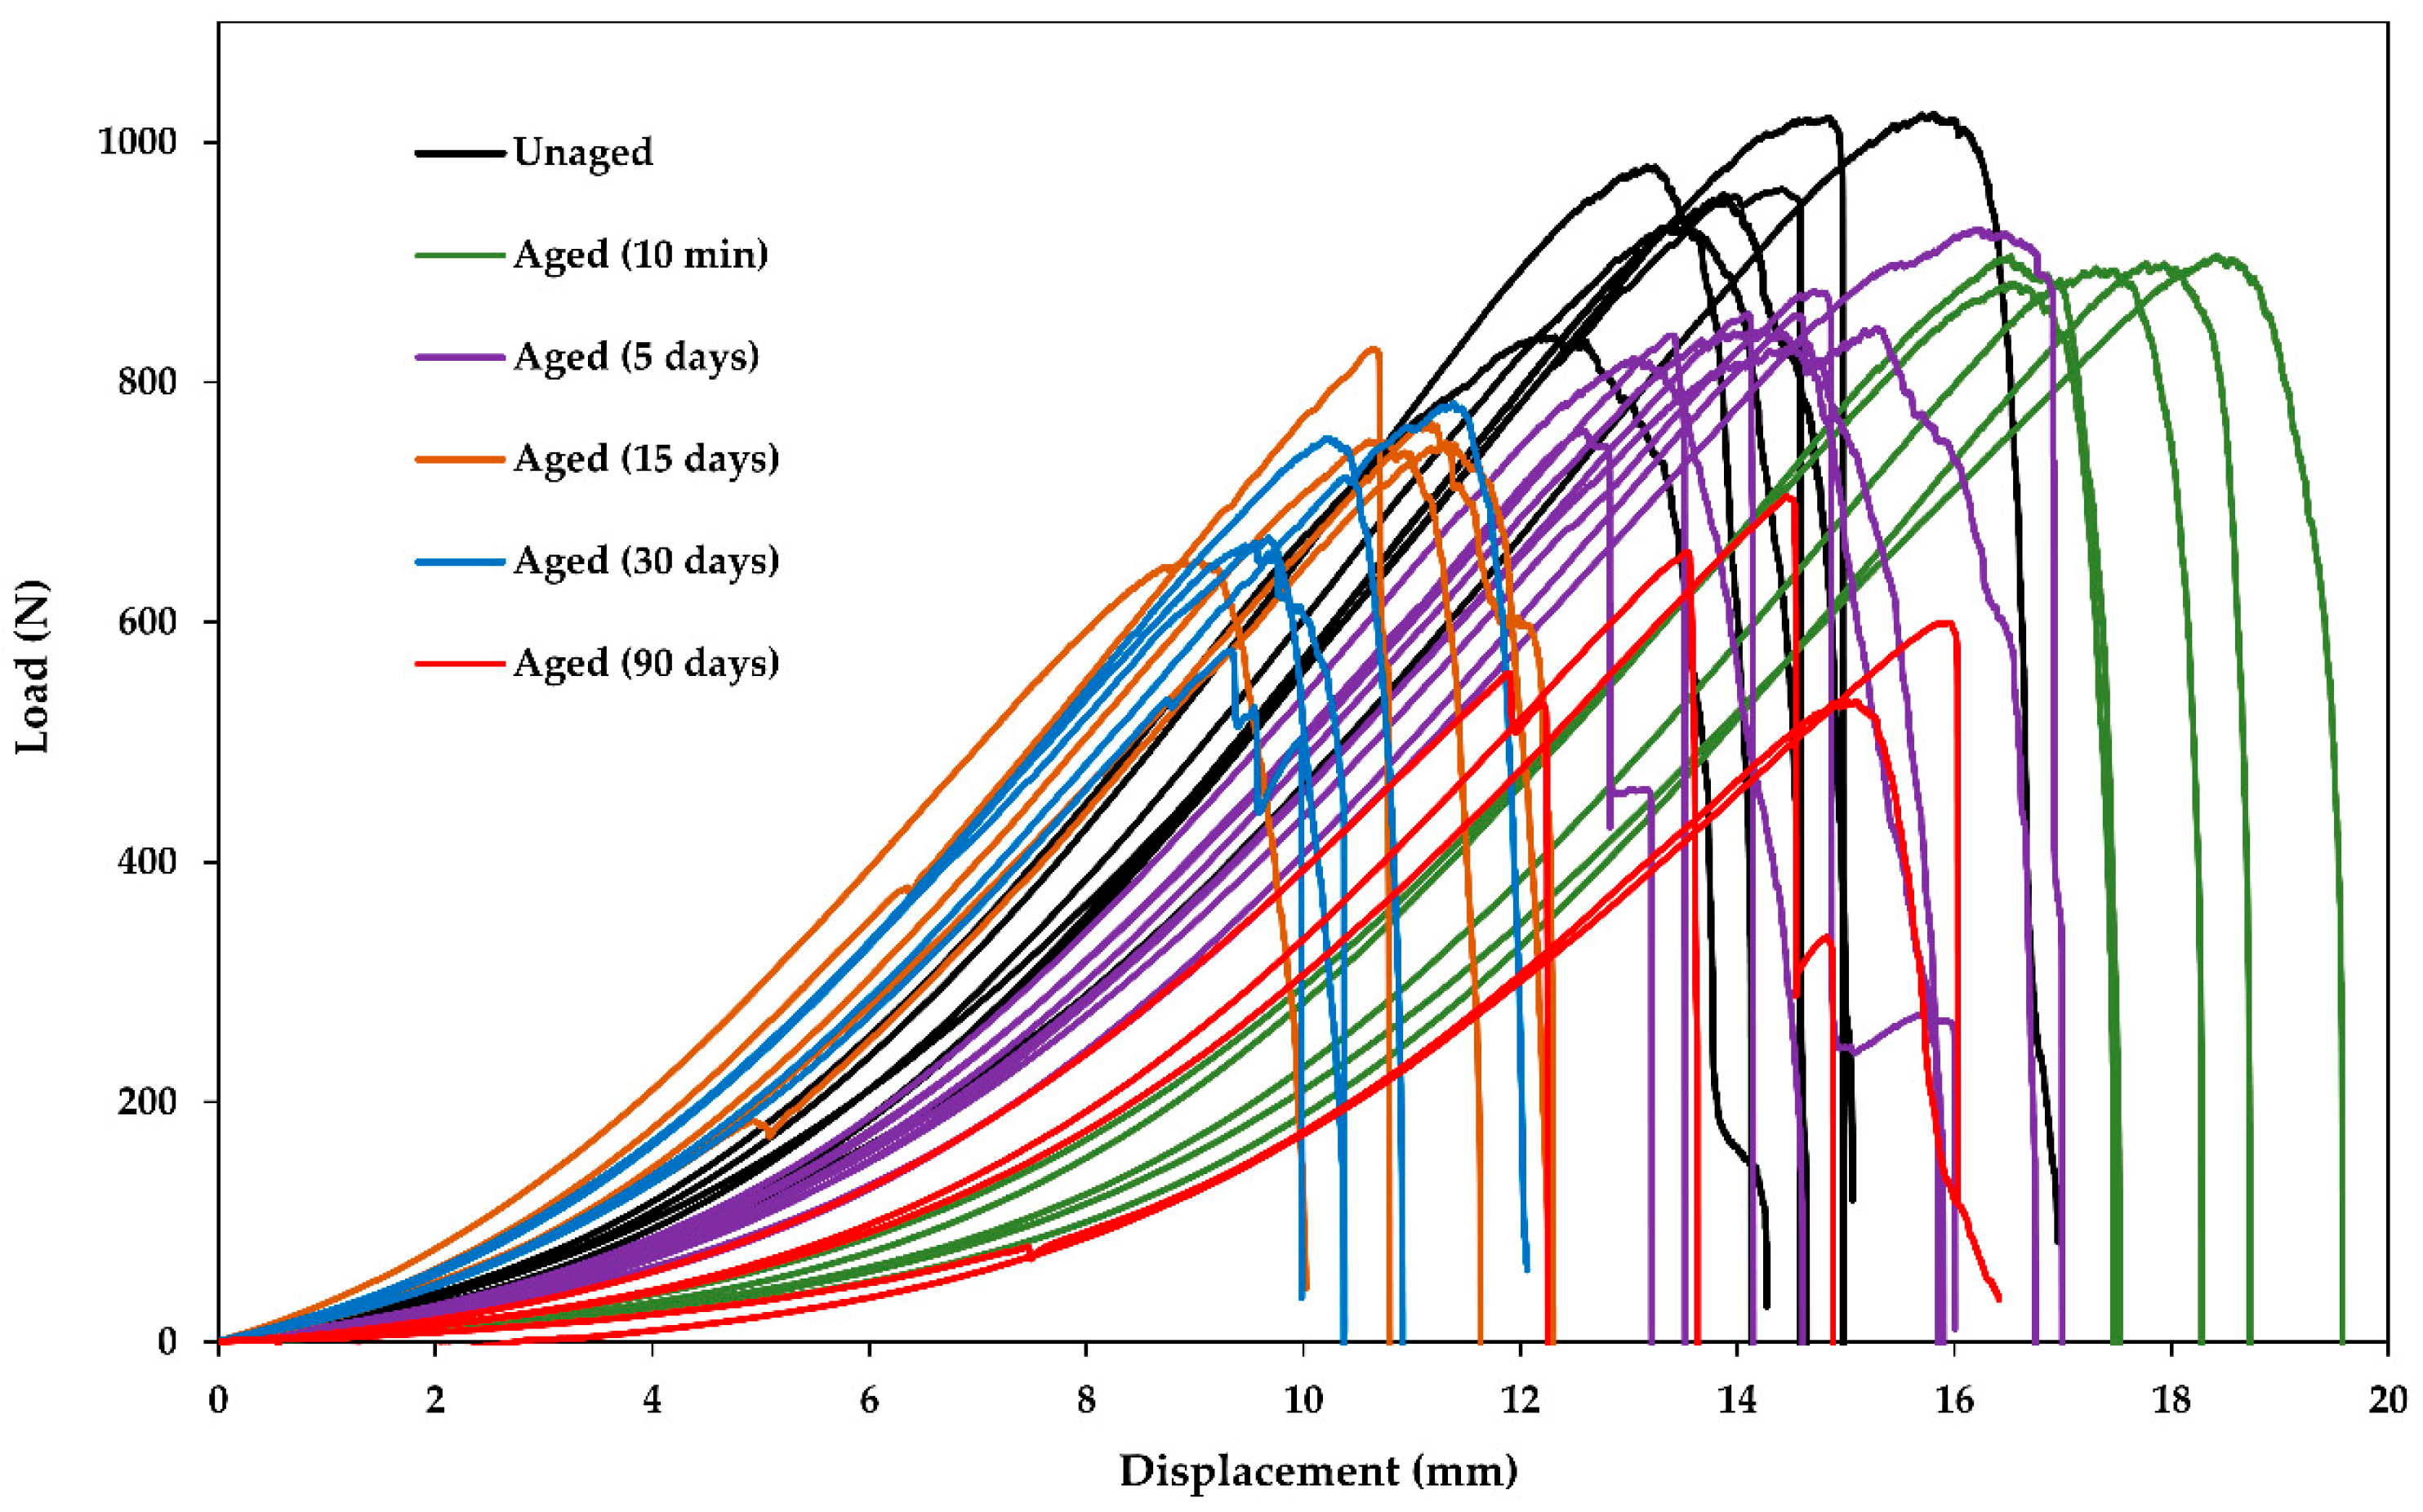
The raw data of the tensile load displacement curves for sized R-glass fiber bundles after different conditioning times are shown in
Figure 2, as an example. The bundles usually slipped a bit in the grips when loaded, so the displacement is not reflecting the bundle’s behavior. However, not much attention was paid to this effect since the only property of interest was the maximum load from which the fiber strength was calculated. The maximum load could be easily identified.
It should be noted that the initial strength of the fibers, according to the manufacturer datasheets [
23,
30], are: GF 2700-2900 MPa and CF 4900 MPa. The bundle testing method reported here appears to be underestimating the initial fiber strength by a factor of more than 2. It is likely that such disparity is due to fiber–fiber friction within bundles and/or due to misalignment, which are common issues with fiber bundle strength testing. Since this paper is mainly interested in the relative change of the strength, the low absolute values were not seen as being critical for the results.
5. Discussion
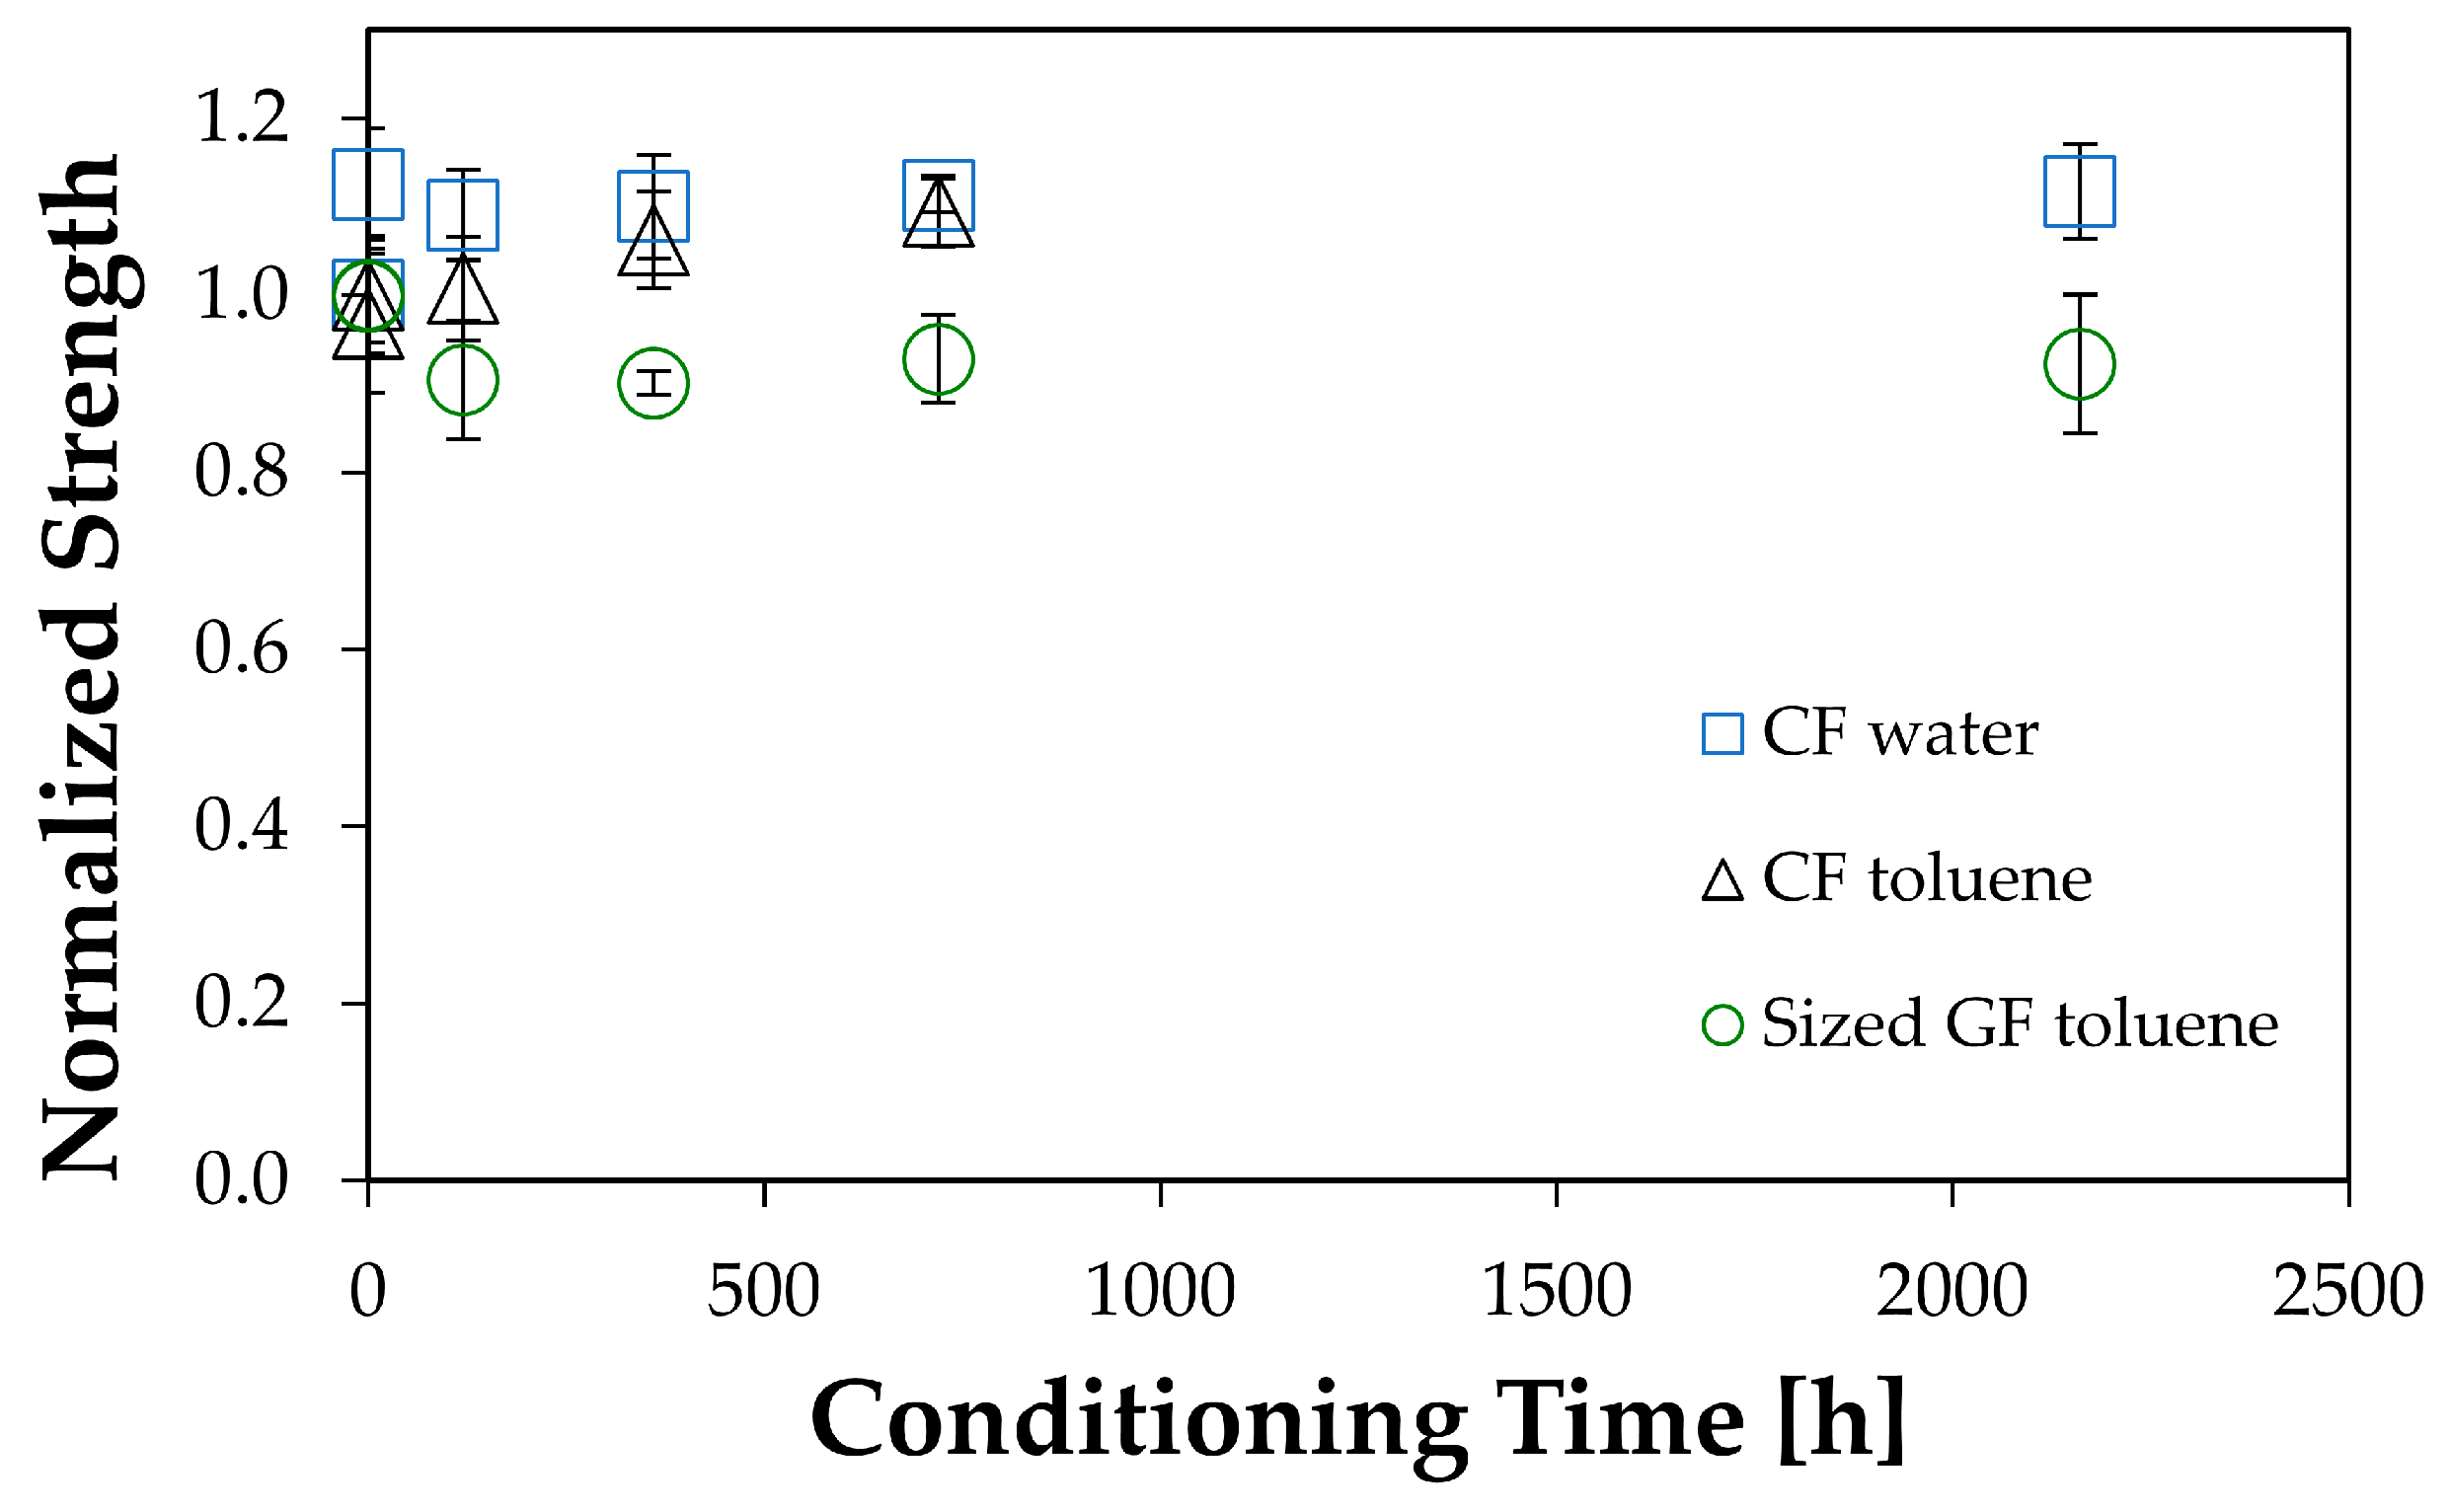
This section concentrates on the results obtained for glass fiber bundles exposed to warm water. The other results of carbon fibers and glass in toluene only confirmed the expected behavior of no change of properties. Nonetheless, it is useful to have this documented.
The zero stress aging in distilled water at 60 °C caused a 33% drop of strength within 90 days of exposure. General drops in strength of glass fibers have been reported before [
11,
17,
18,
19,
20,
21,
22], but not for R-glass. Previous approaches to model the strength degradation were based on semi-empirical formulas, as described by Equation (12). Experimental data in this study, and also the studies reported in the literature, show a fair amount of scatter. This makes it difficult to compare the accuracy of the models. Roughly speaking, however, the results found here agree with the previous studies performed on different types of glass fibers. All show a significant decrease in strength with exposure time.
Linking the strength degradation results to the chemical dissolution of glass gives a possible quantitative link to the concept that the crack growth must somehow be related to a corrosion process. The fact that the experimental data can be well modeled by the dissolution constants
and
, representing the two dissolution phases, shows that crack growth also is influenced by the two phases of dissolution observed for fiber bundles [
16] and also other types of glass [
15]. We attempted to fit the experimental data with only one of the
factors, but this did not work. The fact that the two dissolution phases need to be considered also may explain why previous authors could not agree on the shape of the strength loss curve. Different betas were tried in Equation (12) to fit the data, while a two-step process as described here in Equations (14a) and (14b) should be used.
It was good that exactly the same model parameters also could explain the behavior of the desized fibers. However, the desizing lowered the initial strength of the fibers by a factor five, which makes the fibers of no practical use and somewhat non-representative. Whether the model suggested here stands up to other more realistic cases remains to be seen and should be tested.
The crack sharpness amplification factor has a physical meaning in this model, but it enters the model as the fraction in Equations (14a) and (14b) (the small can be ignored). The initial crack length is not a well-defined property, since the surface energy is not well known. This means also compensates for uncertainties in . It can be seen from this study that the magnitudes of the parameters in the model make physical sense, but to determine the values properly, more tests would be needed.
The authors measured a wide set of dissolution constants on glass fiber bundles in water at different temperatures and pH values [
15]. The constants for phase 1 and 2 are listed in
Table 4.
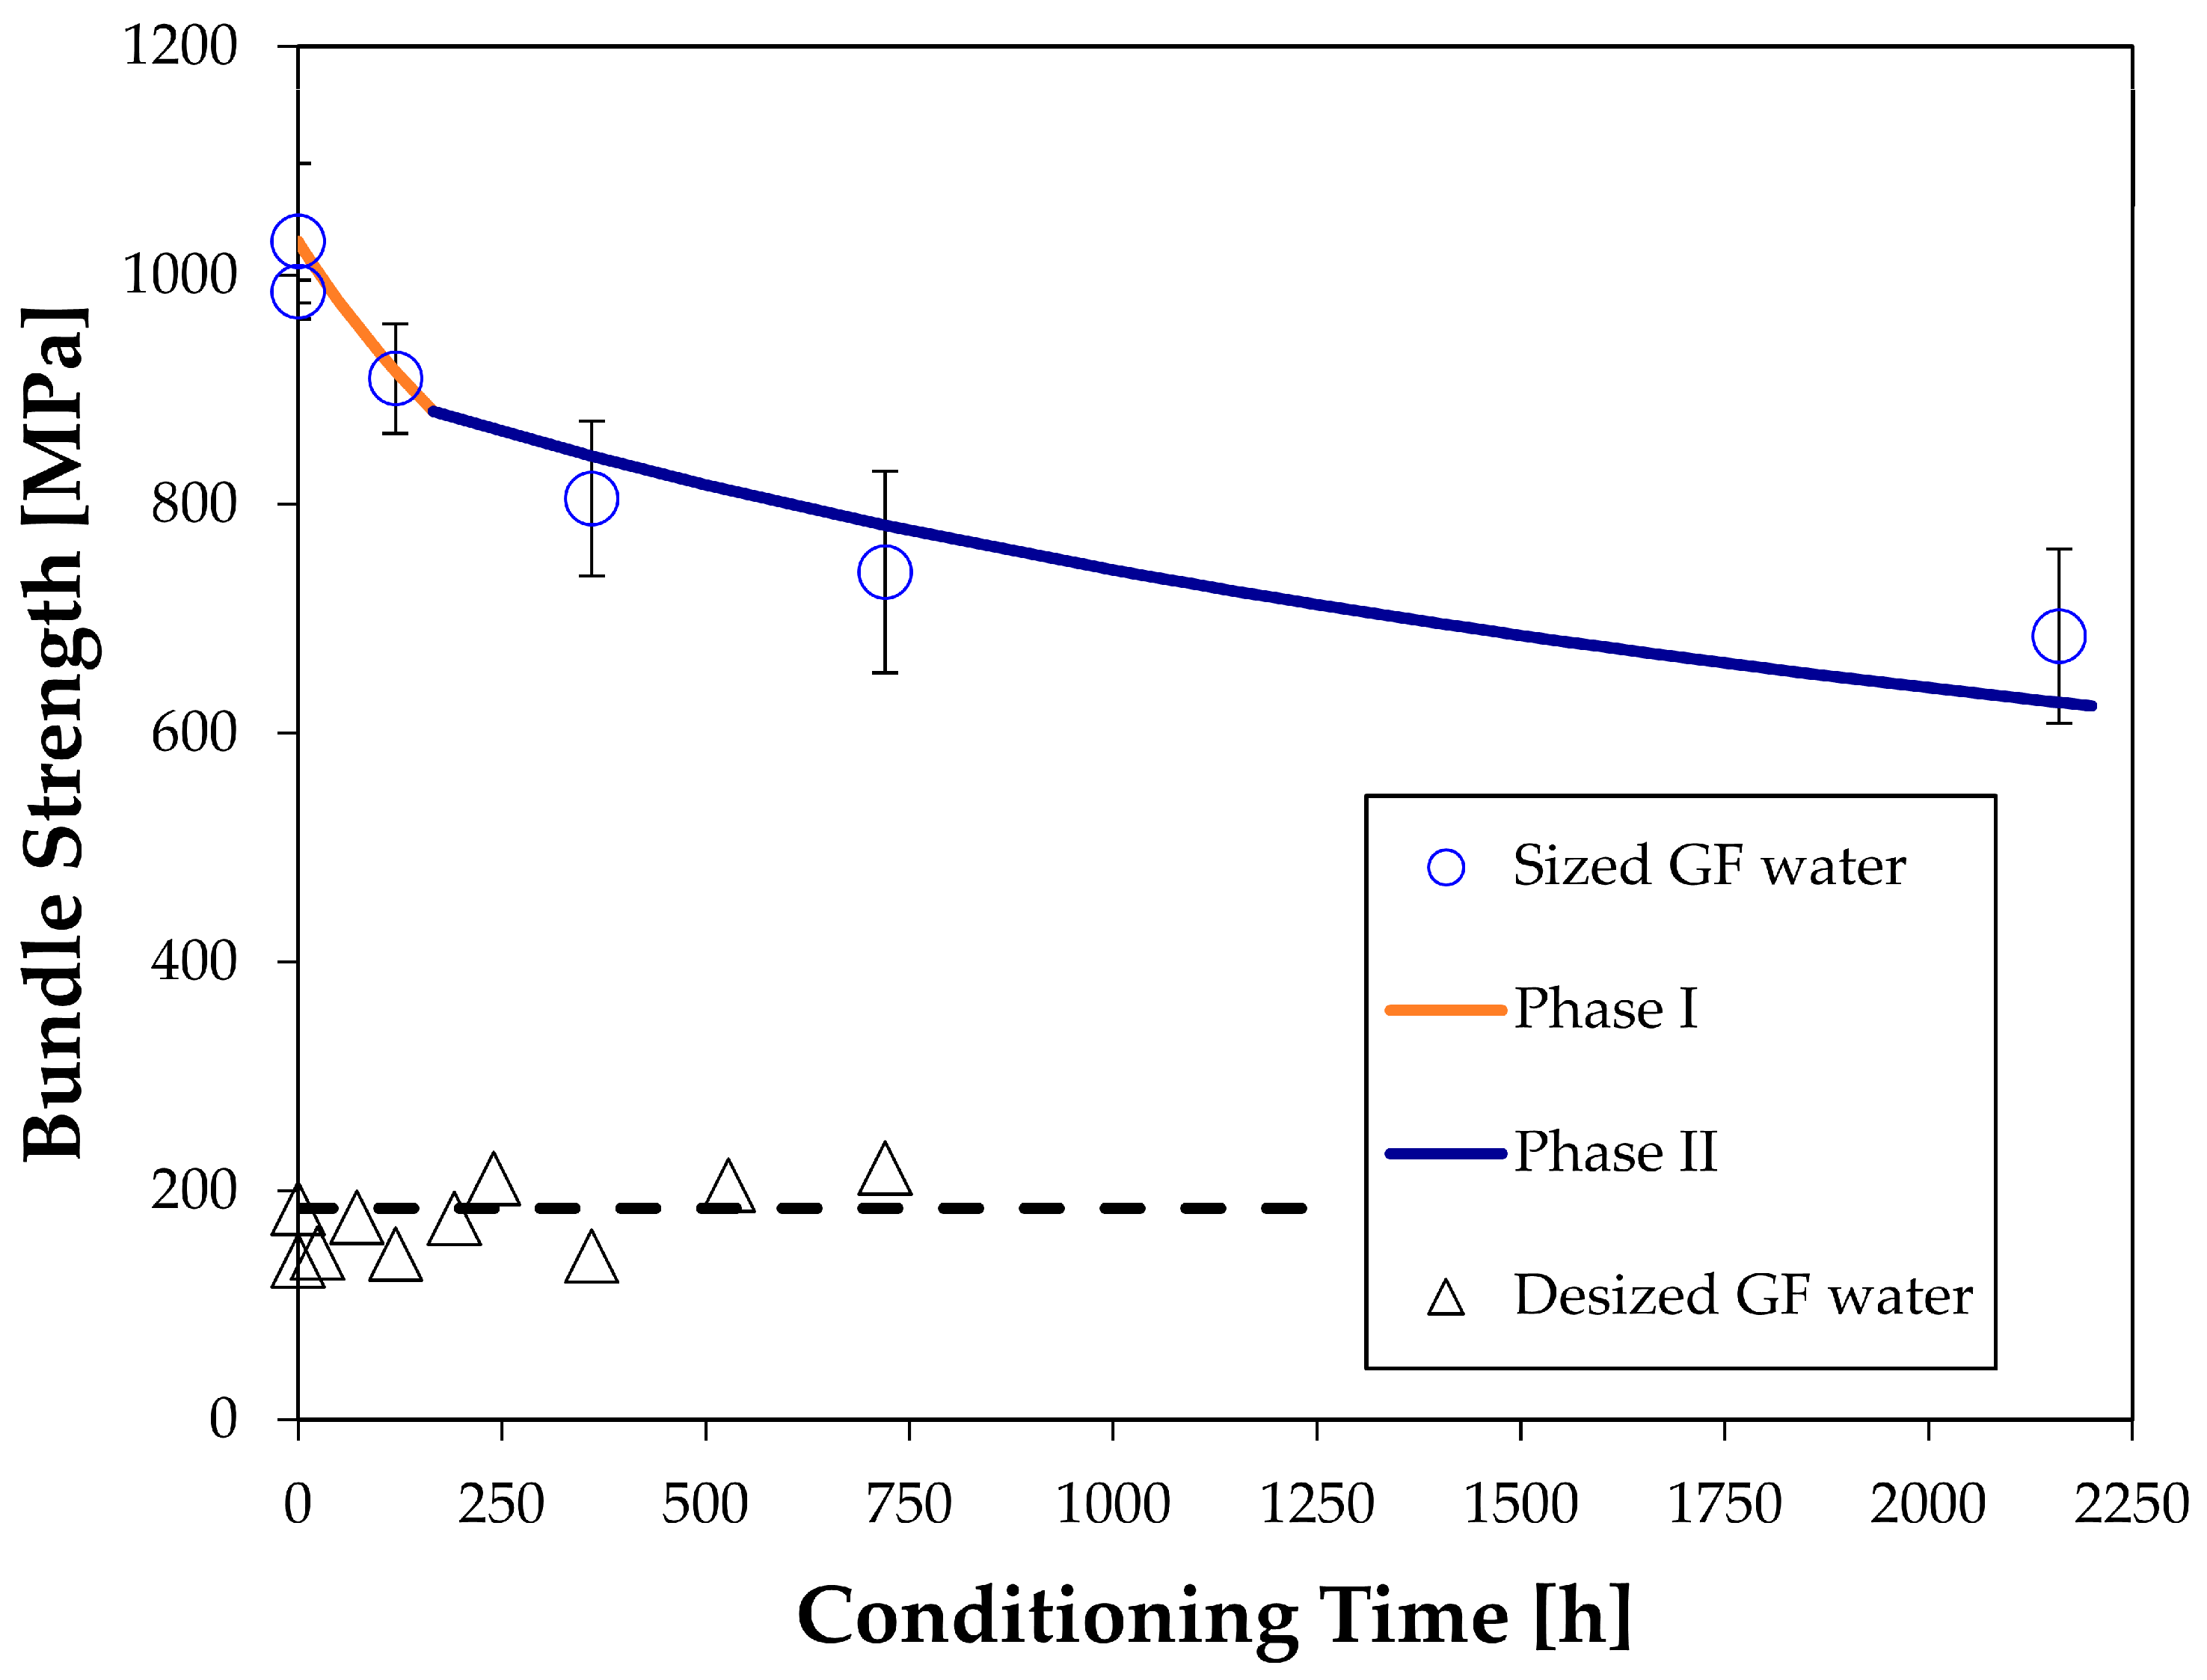
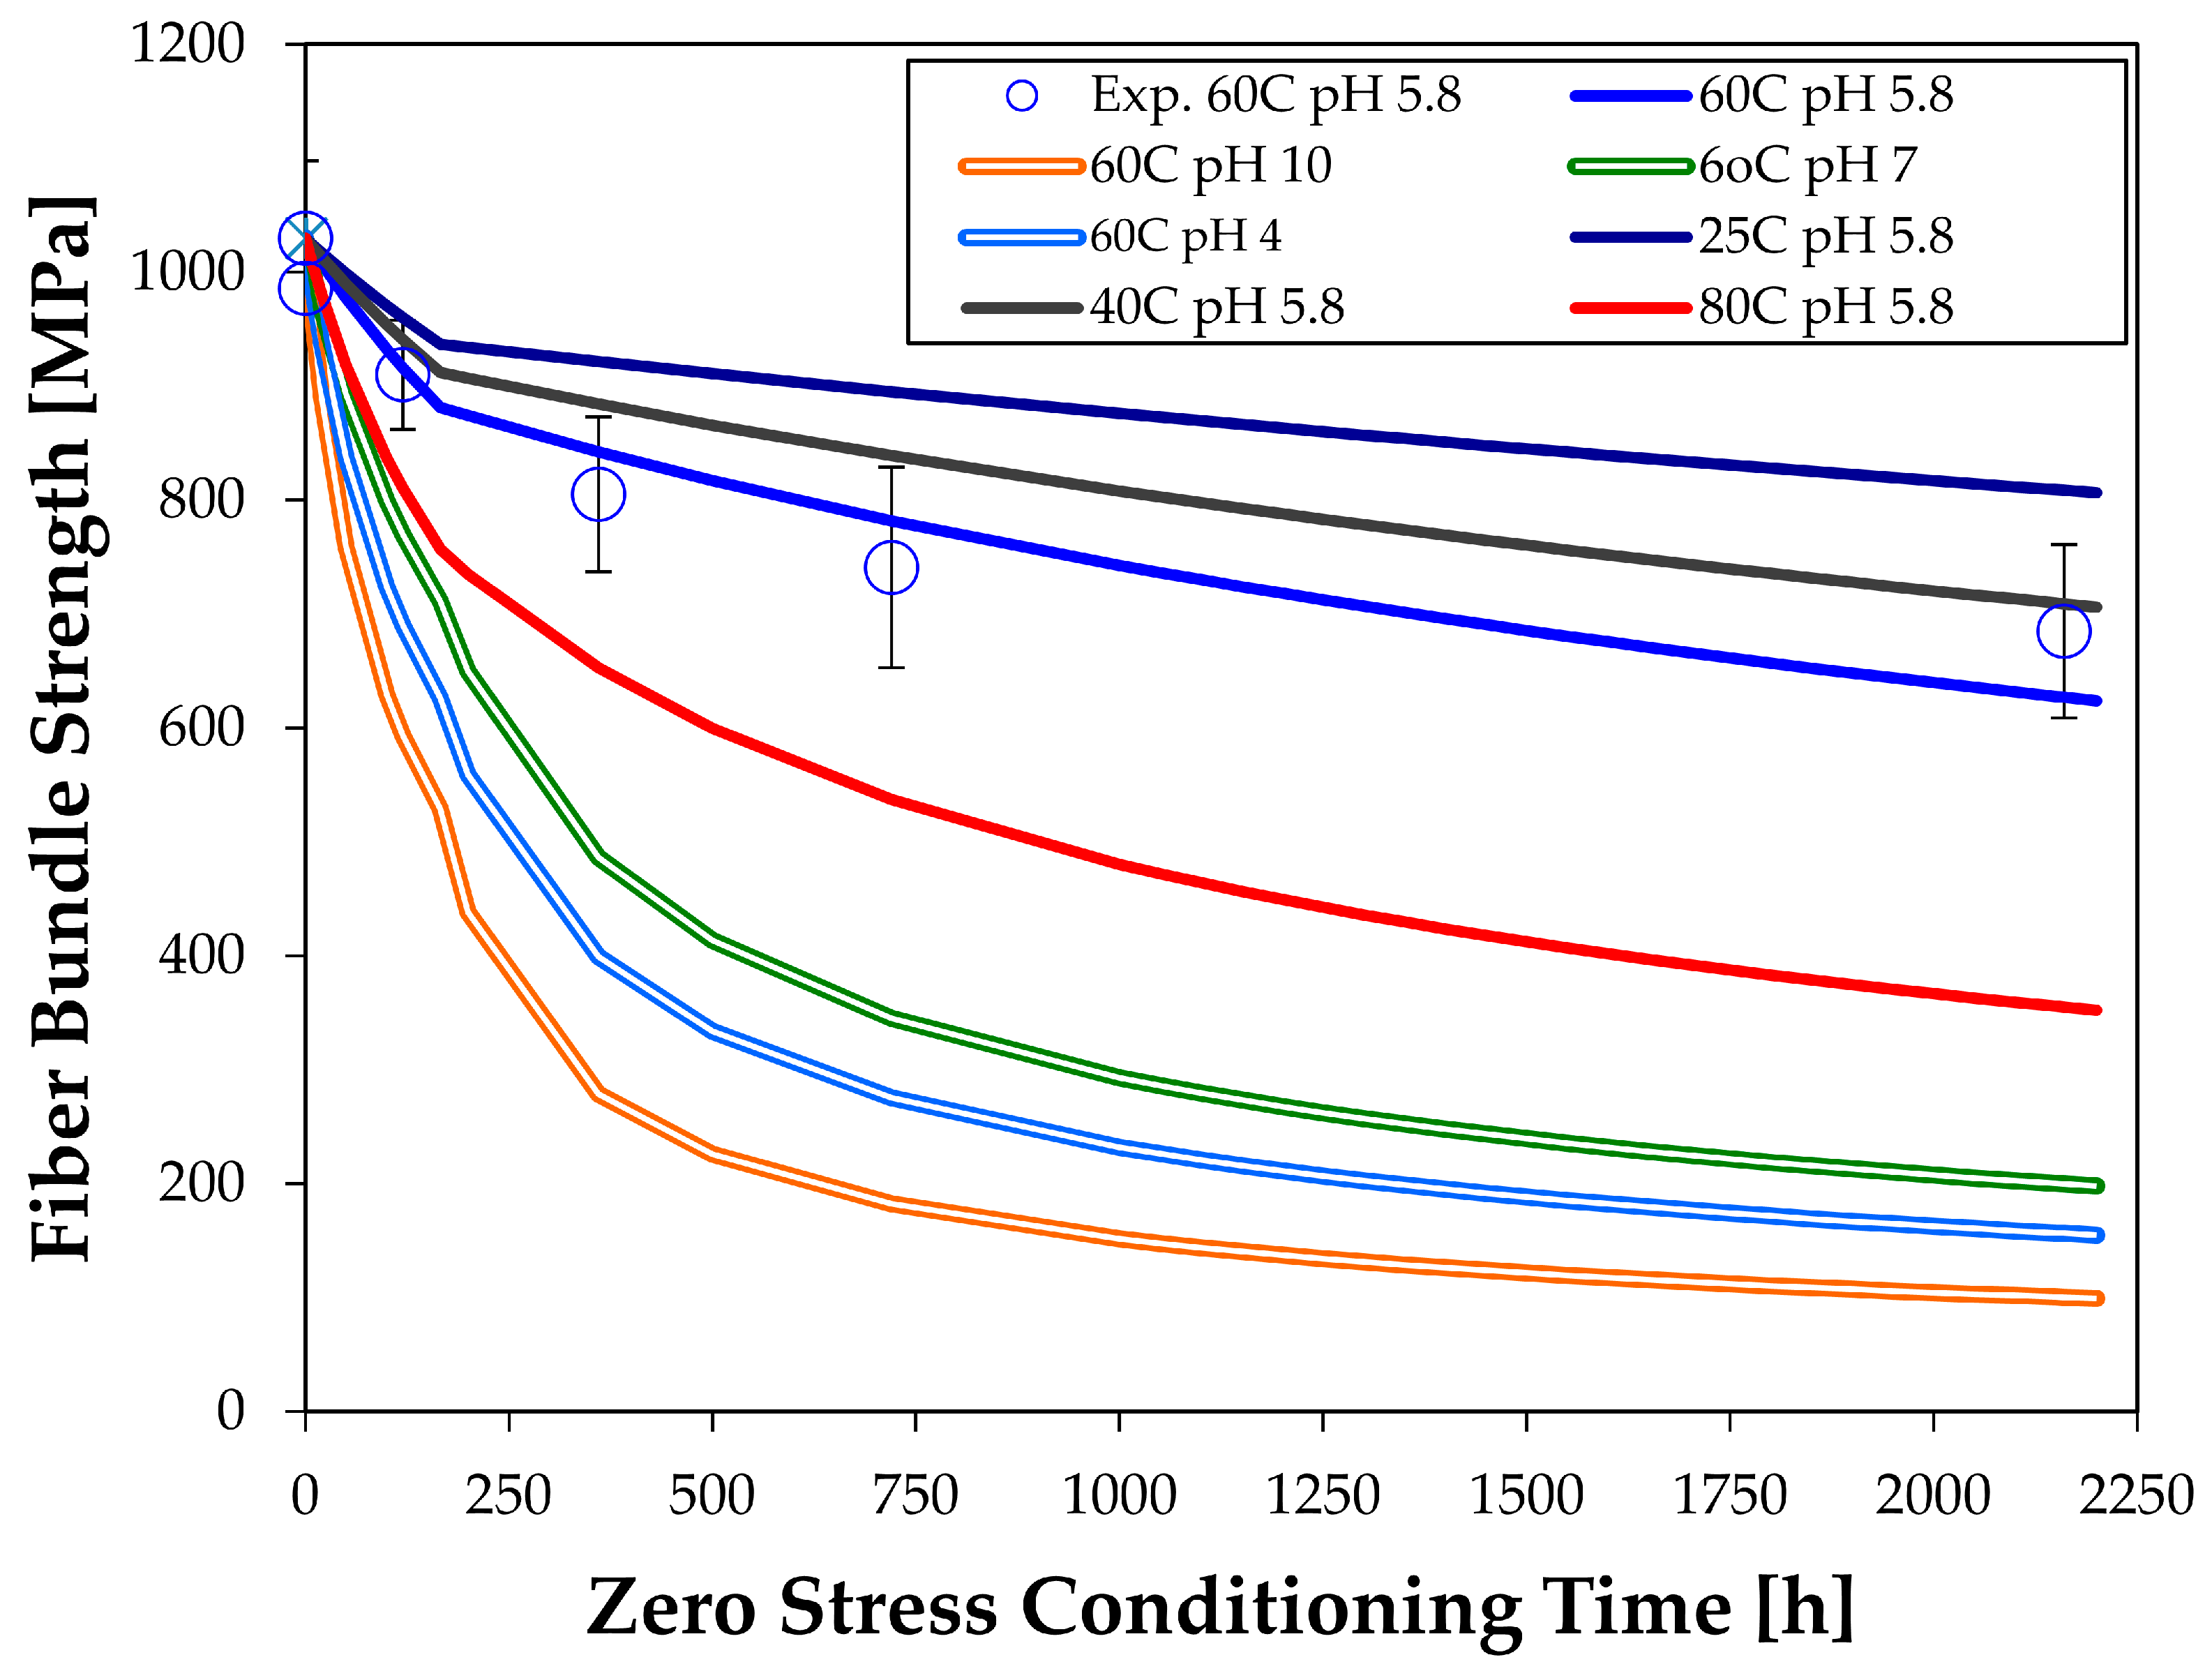
Inserting the dissolution constants into Equations (14a) and (14b) gives the strength change of the fiber bundles due to zero stress exposure. The predictions are shown in
Figure 5, together with the experimental results that were taken at 60 °C and a neutral pH (at 60 °C) of 5.8. The combination of high temperature (60 °C) and not neutral pH is predicted to give rather rapid degradation in strength. Increasing the temperature to 80 °C also increases the strength loss, but less than the pH change. Lowering the temperature decreases strength loss but, even at room temperature, a noticeable strength degradation is predicted.
Some fiber strength testing under these conditions should be done to confirm the validity of the predictions. We plan to do this in the future. Since the dissolution tests can be done fairly easily, they could be more convenient for predicting strength reductions than fiber bundle testing. More importantly, the dissolution constants are directly related to chemical reactions and Arrhenius extrapolations, allowing the prediction of properties at a wide set of conditions.
This paper investigated R-glass, which is becoming popular for structural applications [
15,
16,
35]. The model should be applicable to other types of glass as well, as SiO
2 is the major component in virtually all types of glass [
15] and SiO
2 dominates the dissolution process, at least in phase 2.
It was mentioned in the introduction that this investigation is a step for modelling the strength loss of composites (fiber reinforced plastics, FRP). Considering a composite, the fibers are protected by the matrix and water access is limited, even if the matrix is saturated with water. Removing the ions from the glass and bringing them outside of the composite will be slower. This means the dissolution constants used here are too high for the embedded fibers. Regarding most cases, the fibers also will be stressed when exposed to water. This effect would increase the crack speed as the pressure term in Equation (4) would get activated. The approach shown here helps to explain the mechanisms involved in the fiber degradation.
6. Conclusions
A model was developed that can quantitatively link the strength reduction of glass fiber bundles in water at zero stress to the chemical dissolution kinetics of glass ions migrating into the surrounding water.
The model is based on basic concepts: the Griffith model for strength, a crack sharpness amplification factor linked to thermodynamics of surfaces and a zero-order dissolution model for glass.
The dissolution of glass happens in two phases, during an initial disorderly phase and a subsequent steady state phase. The strength reduction model reflects this behavior and makes it different from all previously developed empirical models.
The agreement of the model with experimental results is reasonable but more testing should be done to obtain the model parameters more accurately, over longer times and to confirm the model’s validity. Tests were done for R-glass, but it is expected that the principal approach should be valid for any glass.
The model allows predictions of temperature and pH dependence on strength loss, as long as dissolution constants can be found. Since the dissolution constants are linked to standard Arrhenius type dependencies, interpolation of measured values can be easily done.
Experimentally, glass fibers in toluene and carbon fibers in water or toluene did not show any strength changes within the experimental error. Since no chemical reaction happened between the fibers and the liquids in these cases, this result was expected, but it is useful to have it confirmed.
The understanding of the mechanisms of fiber degradation developed here should be useful for characterizing the strength degradation of fibers embedded in a matrix in composites. However, the results cannot be directly used since the dissolution kinetics will be different in a composite, probably slower.


