Article

Cellulose Dissolution in Ionic Liquid under Mild Conditions: Effect of Hydrolysis and Temperature

Fiber and Biopolymer Research Institute, Texas Tech University, Lubbock, TX 79409, USA
*
Author to whom correspondence should be addressed.
Fibers 2021, 9(1), 5; https://doi.org/10.3390/fib9010005
Submission received: 14 October 2020 / Revised: 14 December 2020 / Accepted: 18 December 2020 / Published: 6 January 2021
(This article belongs to the Special Issue Recent Progress in Cellulose Dissolution and Regeneration)

Abstract

:
This study investigated the effect of acid hydrolysis of cellulose on its dissolution under mild conditions in ionic liquid, 1-butyl-3-methylimidazolium acetate/N,N-dimethylacetamide (BMIMAc/DMAc). Acid hydrolysis of high molecular weight (MW) cotton cellulose (DP > 4000) was carried out to produce hydrolyzed cotton (HC) samples for dissolution. The HC samples were characterized using gel permeation chromatography (GPC), Fourier transform infrared spectroscopy (FTIR), X-ray diffraction (XRD), and thermogravimetric analysis (TGA), and the dissolution process was monitored using polarized light microscopy (PLM). It was found that the drastic decrease of the MW of cellulose did not result in improvement of its dissolution at room temperature. As compared to original cotton cellulose, the high amount of undissolved fibers in HC solutions led to unstable rheological behavior of HC solutions. Agglomeration and inhomogeneous dispersion of HC, and increased crystallinity, in this case, likely made the diffusion of BMIMAc/DMAc more difficult to the inside of the polymeric network of cellulose at ambient temperature, thereby hindering the dissolution. However, increasing the temperature from room temperature to 35 °C and 55 °C, led to a significant improvement in cellulose dissolution. This phenomenon implies that reducing the MW of cellulose might not be able to improve its dissolution under certain conditions. During the dissolution process, the physical properties of cellulose including fiber aggregation status, solvent diffusivity, and cellulose crystallinity may play a critical role compared to the MW, while the MW may not be an important factor. This finding may help further understand the mechanism of cellulose dissolution and seek better strategies to dissolve cellulose under mild conditions for industrial applications.

1. Introduction

Cellulose, the most abundant renewable resource in the world with an annual yield of 1.5 × 10¹² ton, is a homopolymer composed of repeating units of β-D glucopyranose linked together by 1→4 glyosidic bonds. A single cellulose polymer chain is comprised of several hundreds to over ten thousand repeating glucose units. Because of the extensive intra- and interchain hydrogen bondings and van der Waals forces, cellulose chains are assembled into highly crystalline micro-fibrils [1,2,3]. Cellulose is a promising candidate as a raw material for the preparation of various “green” materials such as fibers, films, food casing, membranes, and sponges, which are currently predominantly prepared from petroleum based synthetic polymers. Cellulose possess many desirable properties such as biocompatibility, renewability, and versatility [2,4]. Materials prepared from cellulose have the potential to meet the expectation of environmental friendliness while being economically viable at the same time [5,6,7,8,9,10,11]. However, unlike most of its synthetic polymer counterparts, cellulose cannot be melted without degradation. Melting is the most common route for processing many synthetic polymers. The dissolution of cellulose offers an alternative way to melting and is, generally, the only viable option for processing cellulose to prepare materials for non-conventional applications such as films and fibers, and efficient chemical modification as well. Because of the complex polymeric network of cellulose, high molecular weight and extended non-covalent interactions among molecules, cellulose is often recalcitrant to chemical processing. The dissolution process of cellulose generally requires rigorous conditions (relatively harsh solvents, elevated temperatures and prolonged dissolution time) [12,13,14]. Therefore, although studied for a long time, efficient dissolution of cellulose under low-cost and mild conditions has persistently been pursued by scientists and engineers in this field. Besides wood, cotton is a major source of cellulose. Even though cotton is mostly used as a raw textile fiber in manufacturing of various textile products, significant amount of cotton (low quality cotton fibers) is wasted in the textile industry. Such low-quality cotton could be utilized as a premium source of cellulose in the preparation of value-added cellulose derived products after dissolution. However, the dissolution of cotton cellulose feedstock, in energy efficient, cost effective and environmentally friendly manner is more challenging compared to wood based cellulose (wood pulp and microcrystalline cellulose, MCC). Numerous studies have reported that the MW of cellulose is one of the key factors governing its dissolution. As the MW increases, the dissolution significantly decreases [15,16,17,18]. Inverse relationship between the MW of a polymer and its solubility in a solvent is attributed to the decrease in the entropic driving force contribution with increasing MW of the polymer in the dissolution process [16,19]. Studies have sought to enhance the dissolution of cellulose substrates by reducing the MW. Yang et al. reported that the dissolution of wood pulp was enhanced by a pretreatment with dilute H2SO4 (3 wt%) in NaOH/urea/water system as a result of a decrease in the MW of the wood pulp [17]. In other studies, cellulose was treated with more concentrated solutions of mineral acids (concentration of acid up to 37 wt%) and hydrolyzed cellulose samples of significantly lower MWs were obtained. Improved dissolution of hydrolyzed cellulose samples in NaOH/urea/ water system was attributed to the decrease in MW in hydrolyzed celluloses [20,21]. When cellulose is treated with mineral acids, its MW is reduced as a result of selective hydrolysis of the amorphous regions leaving crystalline regions intact. In the acid hydrolysis process, the degree of polymerization (DP) of cellulose decreases rapidly until it reaches the so-called “levelling-off” or “limiting” degree of polymerization (LODP) [22]. In general, drastic decrease of the MW of cellulose due to acid hydrolysis, especially when carried out to LODP might be disadvantageous because a decrease of molecular weight will result in a decrease in the mechanical strength of regenerated cellulosic materials (e.g., films and aerogels). However, achieving improved dissolution (in terms of time and concentration) of otherwise hard to dissolve cotton cellulose, by decreasing its molecular weight might still be beneficial to prepare regenerated cellulosic materials which do not require to be very high in strength for some specific application. Furthermore, improving the dissolution of cellulose by decreasing the molecular weight might be particularly a smart strategy when the dissolution is applied as a pretreatment to enhance enzymatic catalysis for biofuel production [23]. In a previous study, we showed that high MW cotton cellulose (DP > 4000) at a concentration as high as 3 wt% could be dissolved within 24 h using an ionic liquid based solvent system, BMIMAc/DMAc at ambient condition [24]. However, relatively shorter dissolution time is desirable to make the process competitive for potential industrial application. Therefore, in this study, we investigated the improvement in cellulose dissolution in terms of reduced time and higher concentration of high MW cotton cellulose using the same solvent system at ambient condition. Acid hydrolysis of cotton cellulose was carried out. The effect of hydrolysis on the MW and material properties of cotton cellulose was studied. Finally, the dissolution of hydrolyzed cotton was investigated using polarized light microscopy and rheological studies of solutions were also performed.
To the best of our knowledge, although there are numerous studies focused on improving cellulose dissolution by applying various pretreatments, studies on the dissolution of cotton cellulose especially of high MW are scant. Furthermore, the effect of hydrolysis on the dissolution of high MW cellulose (DP > 4000) such as raw cotton fibers at ambient temperature has not been reported. Waste or cotton fibers of low quality (from textile application perspective) were the source of cellulose used in this study. Significant amount of such inferior quality cotton along with waste is discarded in the textile industry. This study may further help elucidate the mechanism of the dissolution of cellulose, and it may lead to a new avenue for energy-saving conversions of low quality cotton as a cost effective source of cellulose as a raw material for the preparation of cellulose based-materials for nonconventional uses.

2. Materials and Methods

2.1. Materials

Raw cotton (cotton fiber waste) was obtained from the Fiber and Biopolymer Research Institute, Texas Tech University (Lubbock, TX, USA). Conventional scouring and bleaching treatments were applied to the raw cotton fibers to obtain purified cellulose [25]. The weight average MW of the purified cellulose was estimated to be 6.725 × 10 5 (DP~4150) using Gel Permeation Chromatography (GPC Viscotek TDAmax Model 305, Malvern, UK). Sulfuric acid (H2SO4, LC2555503, 96%) was purchased from LabChem (Zelienople, PA, USA). Other chemicals: N,N-dimethylacetamide (DMAc, 746460 Aldrich) and 1-Butyl-3-methylimidazolium acetate (BMIMAc, 39952 Aldrich) were purchased from Sigma Aldrich (St. Louis, MO, USA). No further purification was done and all the chemicals were used as received.

2.2. H2SO4 Hydrolysis

Scoured and bleached cotton was ground in a Wiley mill (Wiley Mini Mill 3383-L10: 115 V, 60 HZ, Thomas Scientific, Swedesboro, NJ, USA) to pass 20-mesh sieve. Hydrolysis of cotton was performed based on adapted standard procedures in the literature [6]. In brief, 11 g of purified and ground cotton was added in 100 mL of 63.5% H2SO4. The hydrolysis reaction was carried out at 45 °C for 1 h, 2 h, and 3 h, and afterwards the reaction was quenched by adding a large excess of DI water. Each mixture from corresponding reaction time was subsequently centrifuged at 3000 rpm for 15 min several times. The clear supernatant was decanted, and the pellet was re-dispersed by adding DI water before each successive centrifugation until the pellet and the clear supernatant could not be separated. Then, both the supernatant and the pellet were collected together and re-dispersed. The suspension was subsequently neutralized with 3M aqueous solution of KOH and dialyzed against DI water for at least three days. The DI water of the dialysis bath was changed several times in a day. The resultant suspension was ultrasonicated for 5 min and freeze-dried (FreeZone R Plus, Freeze Dry Systems, Labconco, Kansas City, MO, USA). After freeze drying, hydrolyzed cotton samples with sulfuric acid hydrolysis time of 1, 2, and 3 h were labelled as HC-1, HC-2, and HC-3 respectively. Freeze-dried (FD) hydrolyzed cotton cellulose was immediately used for dissolution with no further treatment.

2.3. Material Characterization

2.3.1. Gel Permeation Chromatography (GPC)

To perform GPC measurements, samples were first dissolved in DMAc/LiCl (8% LiCl, w/v). In a typical process, 20 mL DMAc was heated at 110 °C for 30 min and then cooled to 80 °C. Then, 100 mg (0.5%, w/v) of freshly freeze-dried cellulose was added with gentle stirring and heated for 30 min. Then, 1.6 g of oven-dry LiCl was added. Cellulose in DMAc/LiCl solution was heated under gentle stirring at 80 °C for another 3 h followed by cooling to 50 °C. The sample was maintained at 50 °C for 2 days to ensure complete dissolution. Next, the solution was diluted by adding 10 mL of DMAc. Dissolved samples were filtered into 1.5 mL sterile glass vials (Malvern, UK). PTFE disposable membrane filters with pores of 0.20 µm were used (Millex- FG, Millipore, Germany). Chromatographic analysis was performed using a GPC system (Model 305, Viscotek, Houston, TX, USA) equipped with an autosampler (Model VE 201, Viscotek, Houston, TX, USA). The GPC system contained a series of detectors namely: Refractive Index, viscometer, right angle light scattering, and low angle light scattering. Anhydrous DMAc/LiCl (5%, w/v) was used as a mobile phase. The flow rate was 1 mL/min. The injection volume was 100 µL and the elution was carried out at 50 °C. Data analysis was performed using OmniSEC GPC software version 5.00 (Malvern, UK).

2.3.2. Fourier Transform Infrared Spectroscopy (FTIR)

FTIR Spectrum-400 equipped with a universal attenuated total reflectance (UATR) accessory (Perkin Elmer, Waltham, MA, USA) was employed to acquire the spectra of the samples over the spectral range of 650 to 4000 cm−1. The spectral resolution was 4 cm−1 and 32 co-add scans were used to generate a spectrum. Optimum contact between the samples placed on the ZnSe-Diamond crystal stage and the incident infrared beam was maintained by using a “pressure arm” to hold the sample. Prior conditioning of samples was performed in an environment of 65 ± 2% relative humidity and 21 ± 1 °C for at least 48 h before the test. Perkin-Elmer software was used for baseline correction and normalization of the spectra.

2.3.3. X-ray Diffraction (XRD)

SmartLab XRD (Rigaku Corporation, Model HD 2711N) was used to perform wide angle X-ray scattering of the samples. X-rays of CuKα radiation (λ = 0.15406 nm) were generated at 40 kV and 44 mA. Scanning of the samples was performed between 10° and 50° two-theta in 2°/min stepwise. The crystallinity index (C.I.) was calculated using peak fitting method (Equation (1)). Fitting of the XRD patterns was performed using a peak fitting program (PeakFit v4.12, https://systatsoftware.com). Gaussian functions were assumed for each peak. Four crystalline peaks were assumed and one broad peak ~20 two theta was assigned as amorphous peak [26]. R2 of the fit above 95% was considered as good fit in all cases [27].
C . I .   =   ( A r e a   o f   c r y s t a l l i n e   p e a k s ) ( A r e a   o f   c r y s t a l l i n e   a n d   a m o r p h o u s   p e a k s ) × 100 % ,

2.3.4. Thermogravimetric Analysis (TGA)

Investigation of thermal stability of the samples was performed using a Pyris1TGA (PerkinElmer Shelton, CT, USA). Samples were heated under a N2 gas flow. Samples were burned in the heating range of 37 to 600 °C. The heating rate was 10 °C/min and a gas flow of 20 mL/min was maintained. Prior conditioning of samples was performed at 65 ± 2% relative humidity and 21 ± 1 °C for at least 48 h before the test. Pyris software was used to calculate the first derivatives of the thermograms (DTG) along with the weight loss percentages, and the decomposition temperatures of the samples.

2.4. Dissolution of Hydrolyzed Cotton Cellulose

Dissolution experiments in the BMIMAc/DMAc solvent system were carried out according to previously published method [24]. In a typical process, hydrolyzed cotton cellulose at a specified concentration (wt%) was slowly added to the solvent in a vial (BMIMAc/DMAc molar ratio: 1 to 1.4) under manual stirring. Then, the cellulose-solvent mixture was kept on the benchtop at ambient conditions (T ~25 °C). Parafilm was used to seal the vials to prevent moisture absorption. The maximum time for the dissolution was limited to 24 h. For HC-1, three different concentrations (1, 3, and 5%) were used while for HC-2 and HC-3 only one concentration (1%) was used.
The dissolution at higher temperatures (35 and 55 °C) was carried out by placing the dissolution vials in the oven maintained at specific temperature after mixing cellulose with BMIMAc/DMAc.

2.5. Monitoring the Dissolution of Hydrolyzed Cotton Cellulose in BMIMAc/DMAc

PLM images of hydrolyzed cotton cellulose solutions with different concentrations in BMIMAc/DMAc were obtained using Nikon Eclipse LV 100 microscope (Nikon Corporation, Tokyo, Japan) at different time intervals after the start of the dissolution process. To acquire an image of a sample at a given time, in a typical method, a drop of the sample was placed on a glass slide and covered with a cover slip, and the sample was observed under PLM at ambient temperature.

2.6. Rheological Study

AR 2000EX rheometer (TA Instruments, New Castle, Delaware, USA) with a Peltier temperature control system was used to investigate the rheological properties of mixtures of cellulose and BMIMAc/DMAc. 50-mm circular plate geometry was used and the working gap between the plates was 5 mm. The temperature ramp test was performed between 25 and 90 °C. The temperature was increased at a rate of 5 °C/min while maintaining a constant shear rate of 4 s−1. For the steady state flow test, a range of shear rate between 0.1 and 200 s−1 at 25 °C was applied. Both tests were performed after 24 h from the start of the dissolution process. All measurements were performed at least in triplicates.

3. Results and Discussion

3.1. Effect of H2SO4 Hydrolysis on the MW of Cotton Cellulose

In order to understand the effect of H2SO4 hydrolysis on the MW, molecular weight distributions (MWDs) of the original cotton cellulose and HC samples were determined (Figure 1). Cotton cellulose exhibits a broad MWD while all hydrolyzed samples exhibit narrow MWDs, which shift to significantly lower MW. Irrespective of the hydrolysis time, all HC samples display similar MWDs. The degree of polymerization (DP) of cellulose decreased ~10 times (from ~4150 to ~450) as a result of acid hydrolysis. Prolonged hydrolysis time (2 h and 3 h) had no impact on the MW compared to hydrolysis for 1 h (Table 1). These results are consistent with reported trends in the literature [28]. The observed relatively constant DP of ~450 for hydrolyzed cotton cellulose samples irrespective of the duration of the hydrolysis (1 h, 2 h, and 3 h) suggests that the LODP has been reached in our case.

3.2. FTIR Characterization of Hydrolyzed Cotton Samples

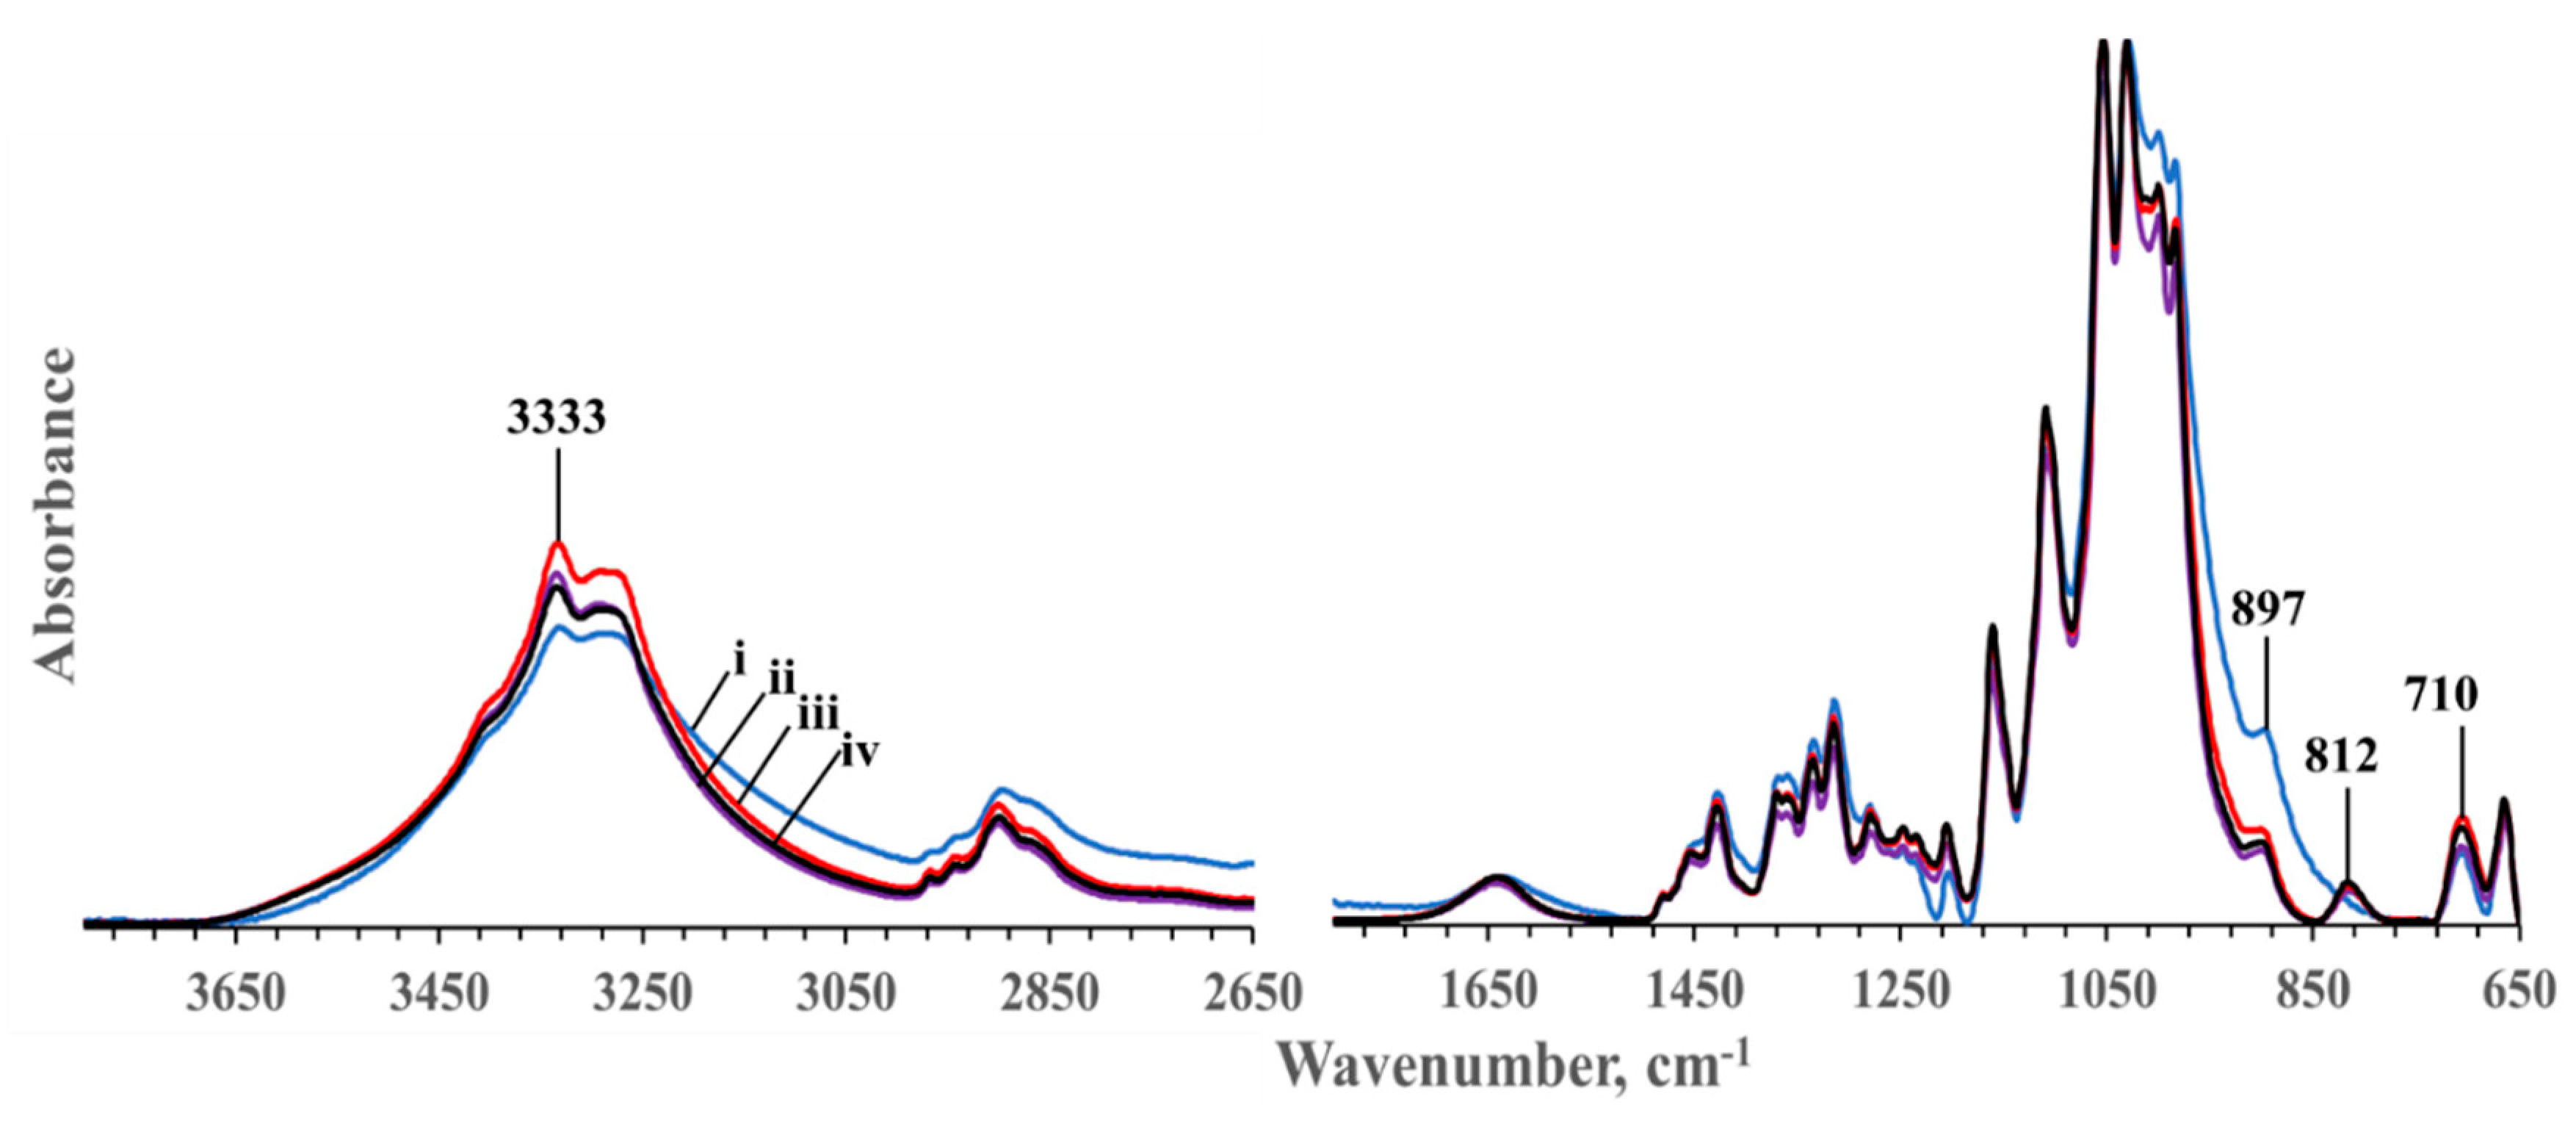
The effect of H2SO4 hydrolysis on the chemical composition of cotton cellulose was investigated using FTIR. Figure 2 shows the FTIR spectra of cotton prior to hydrolysis and the HC samples for different period of time. The spectrum of the original cotton cellulose (not hydrolyzed) is similar to the spectra of HC samples, which clearly indicates that the chemical structure of cotton cellulose was not impacted by acid hydrolysis. The vibration 897 cm−1, assigned to β-linkage in cellulose and designated as amorphous band in cellulose [29,30], becomes broader and decreases in intensity for all hydrolyzed cotton samples. These results indicate that the amorphous regions in cotton cellulose were removed and thus the crystallinity was increased during hydrolysis. Additional vibration 812 cm−1, visible in all HC samples, corresponds to the C-O-S vibration and is due to inevitable sulfonation via esterification during hydrolysis [30].

3.3. XRD Characterization

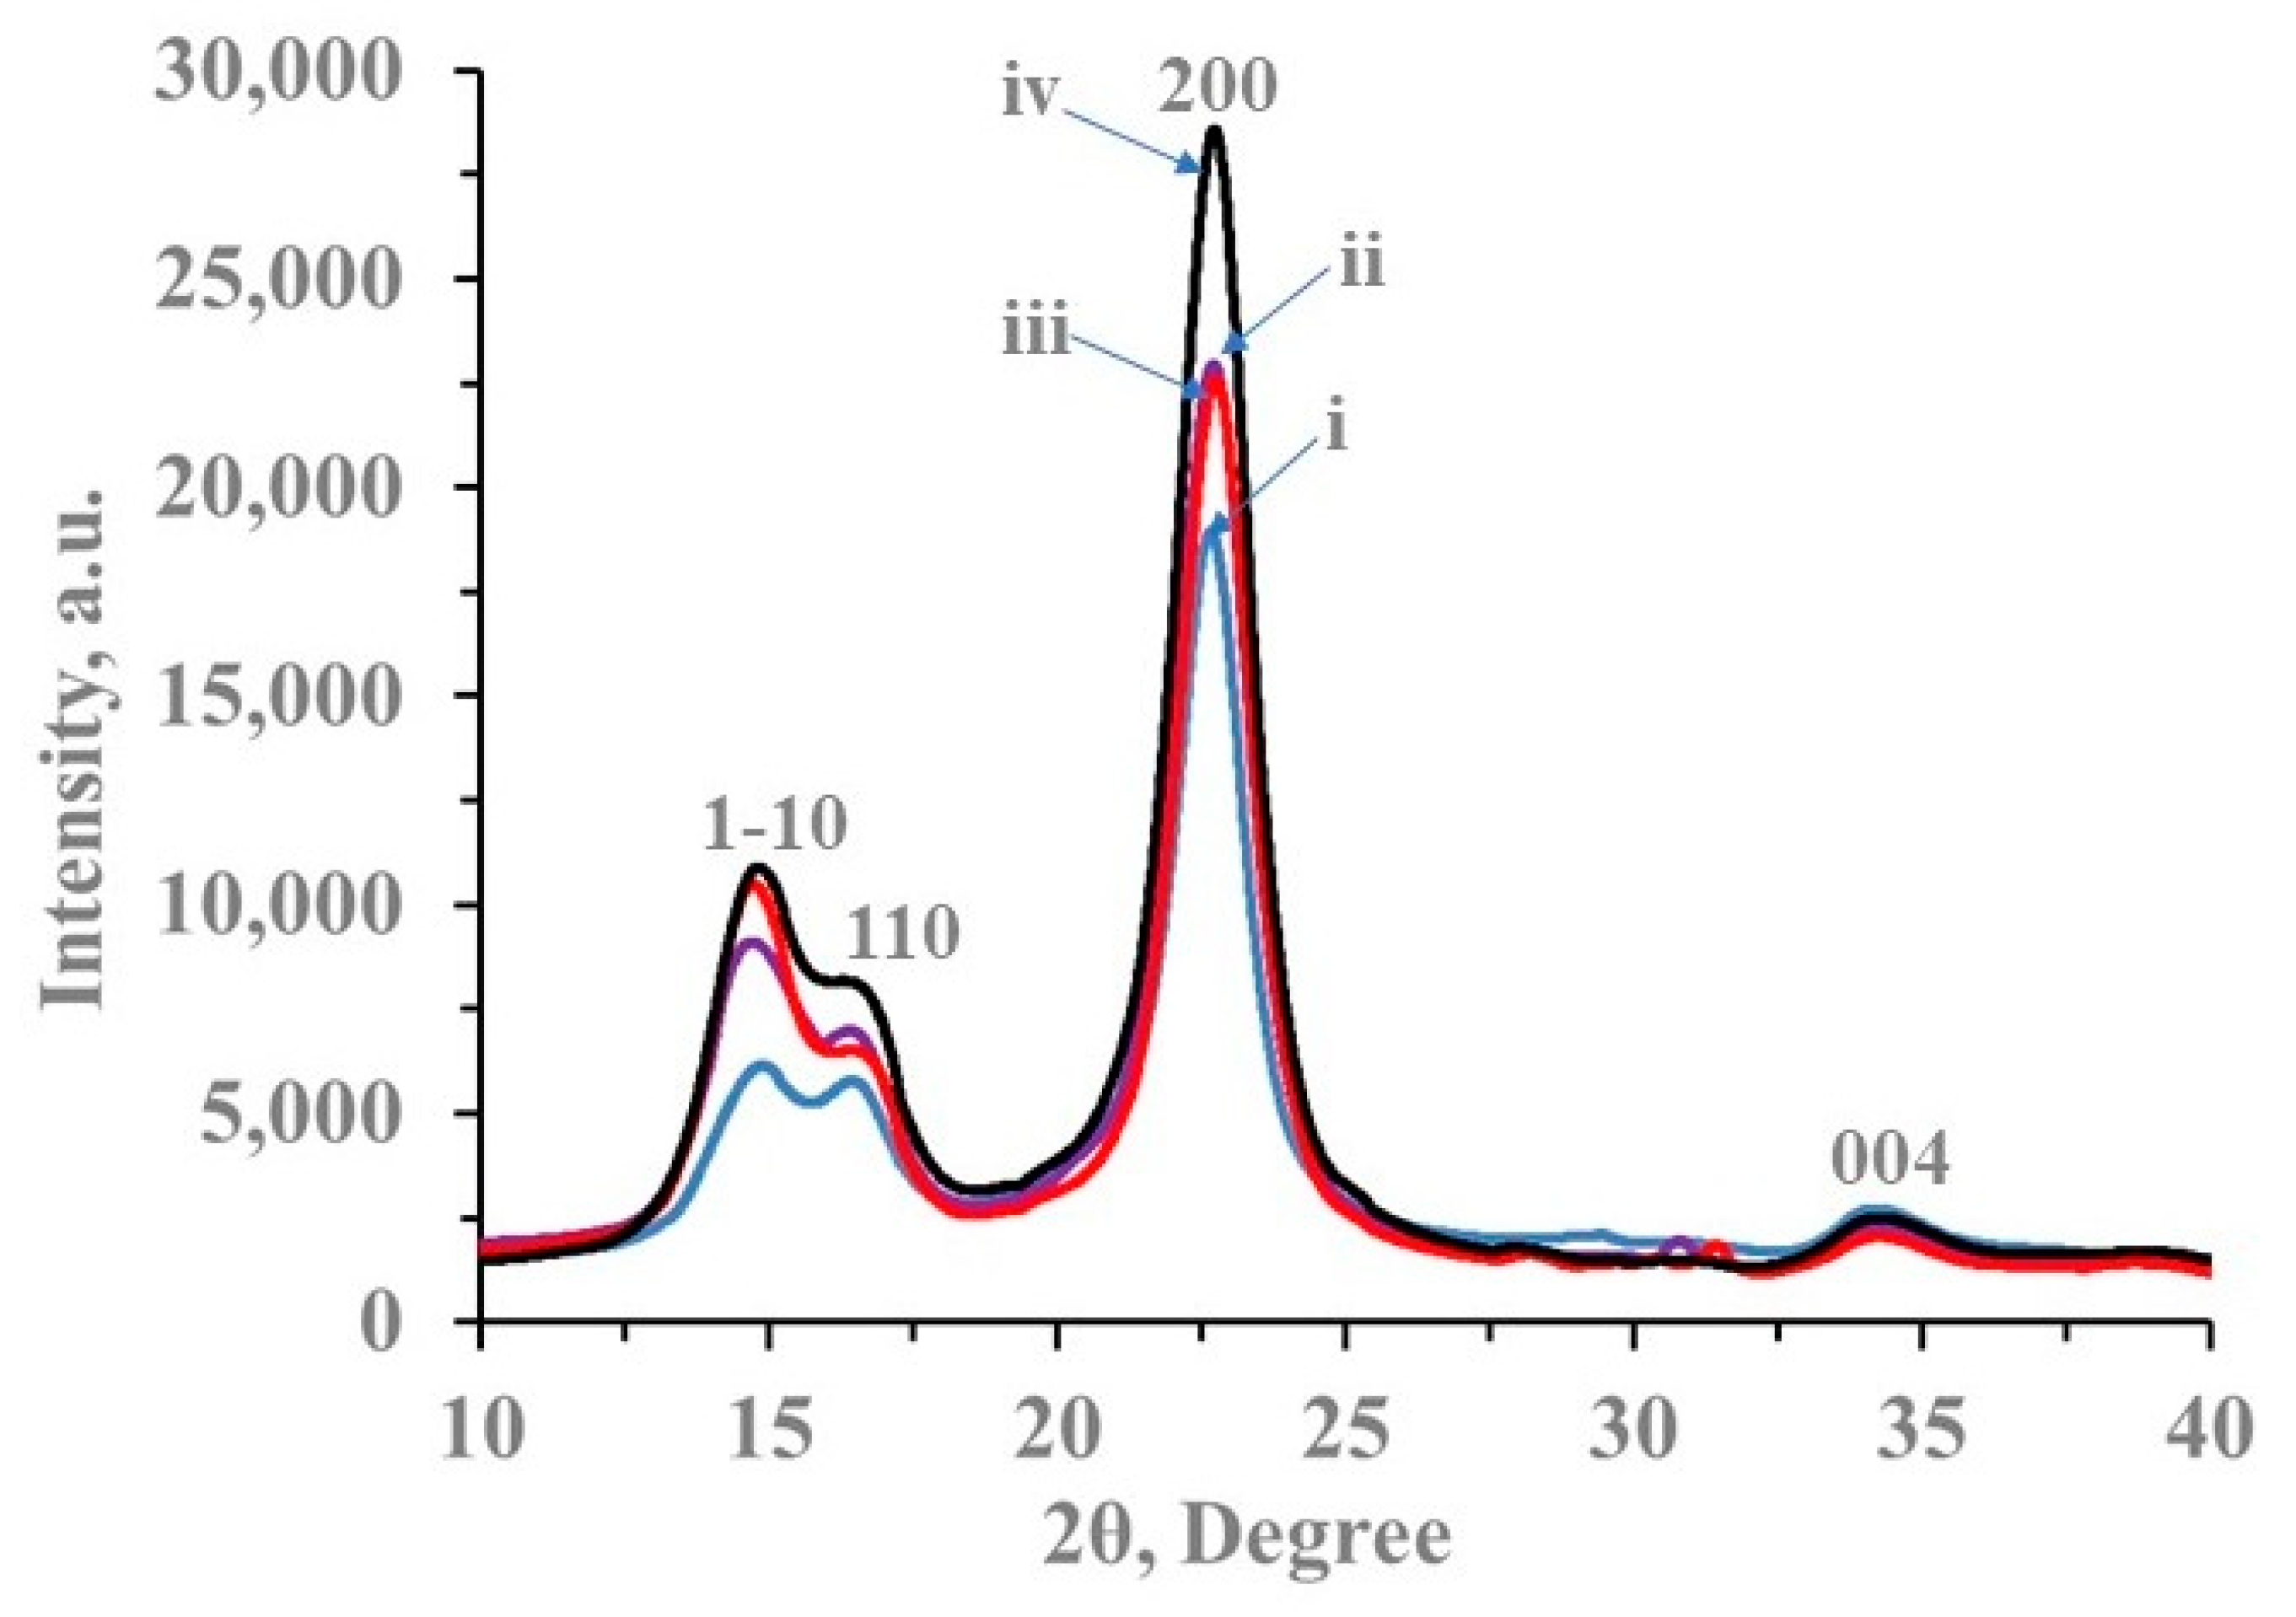
To obtain further information on the crystalline structure of H2SO4 hydrolyzed cotton cellulose samples, X-ray diffraction (XRD) was performed (Figure 3). The diffraction patterns show typical diffraction peaks at 2θ = 14.7, 16.5, 22.7, and 34.5° corresponding to the crystal lattices 1 1 ¯ 0 , 110 ,   200 , and 004 in native cellulose (Iβ) respectively [24,27,31,32]. The increased intensity of the diffraction peaks at 2θ = 14.7, 16.5, and 22.7° in HC samples compared to the original cotton indicates increased crystallinity in HC samples. These results corroborate the observation from FTIR that the crystallinity is increased due to the hydrolysis of the amorphous regions and cellulose crystal type is not changed in hydrolyzed cotton samples. Furthermore, crystallinity indices (C.I.) were calculated using peak deconvolution method [11]. The C.I. increased from 81% in the original cotton cellulose to 85, 93, and 85% in HC-1, HC-2, and HC-3, respectively. The lower value of C.I. of the HC-3 than the HC-2 (Table 2) suggests that there were some amorphous regions left after 1 h hydrolysis and those remnant amorphous regions were greatly removed after hydrolysis for 2 h leading to further increase in crystallinity of HC. However, extended hydrolysis after 2 h could cause peeling-off of crystalline sheets, thus leading to decreased C.I. in HC-3 as compared to HC-2. Despite higher crystallinity of the HC samples, TGA results showed that their thermal stability was decreased from ~370 °C to ~320 °C (Figure S2, Table S1) as compared to the original cotton cellulose due to the surface sulfate groups inevitably introduced during the hydrolysis reaction [33]. The sulfate groups have been reported to lower the activation energies of the degradation of cellulose nanocrystals prepared via H2SO4 hydrolysis of native cellulose [34].

3.4. Dissolution of Hydrolyzed Cotton Cellulose over Time at Ambient Conditions

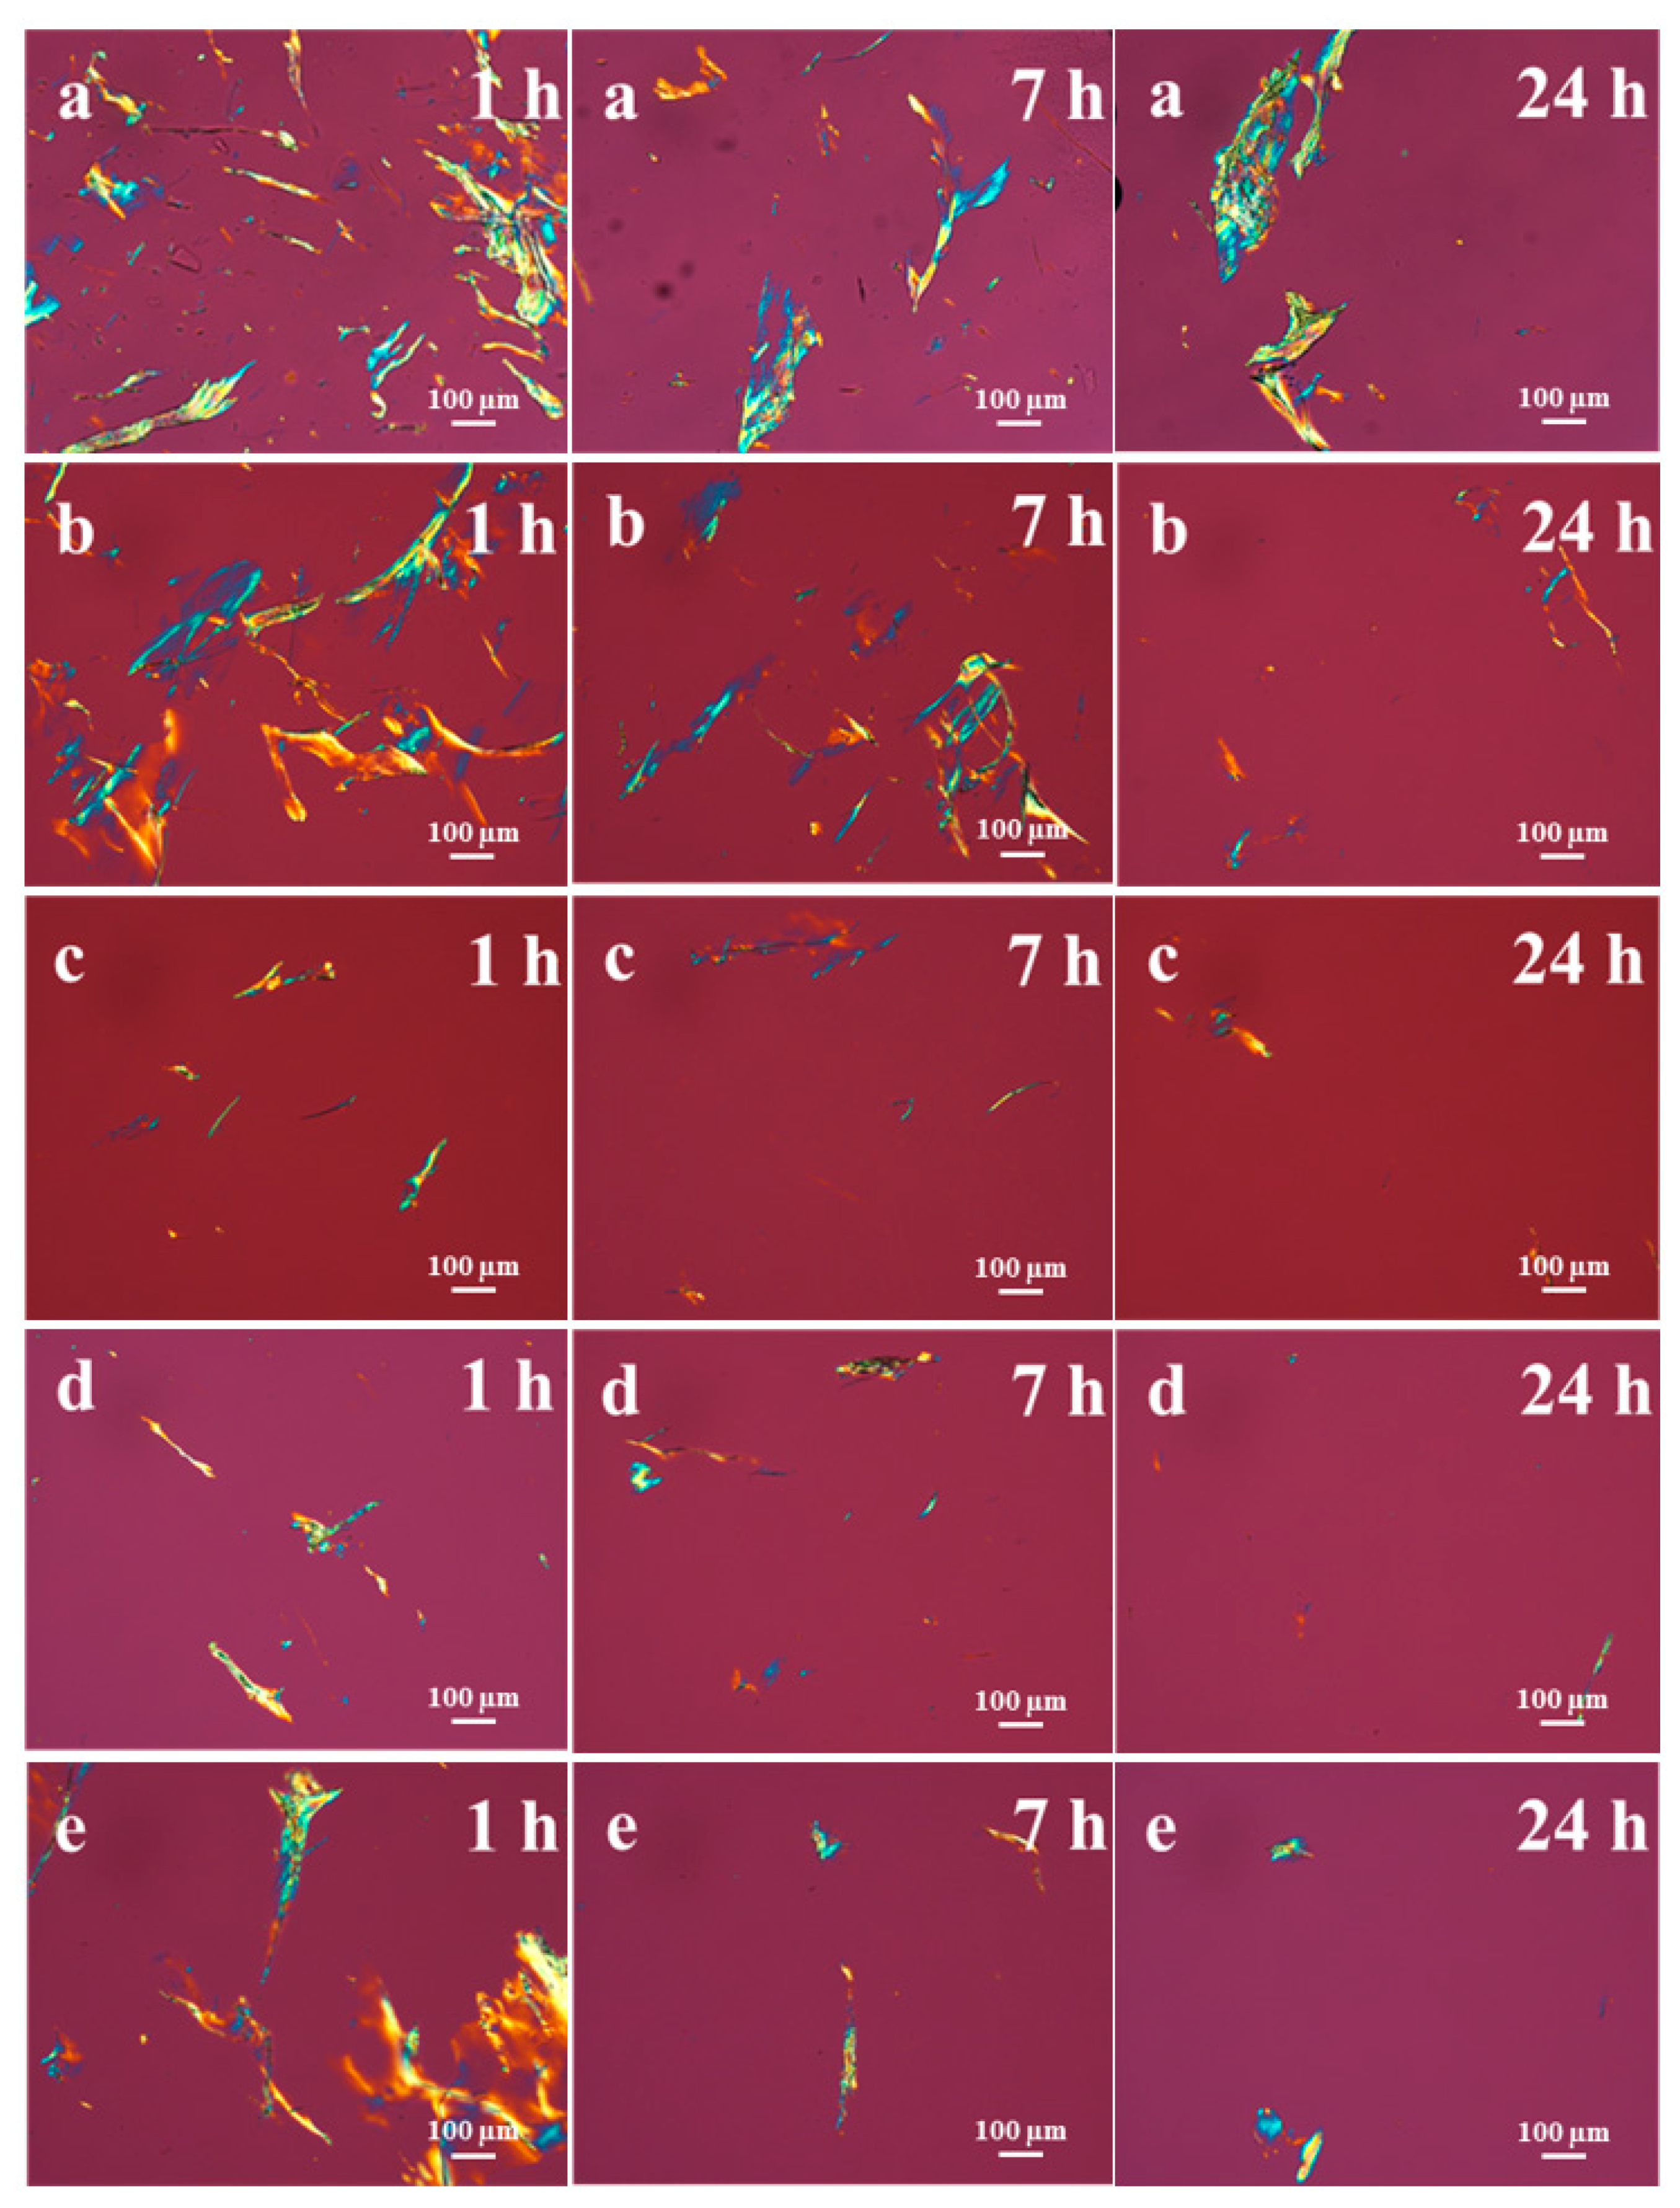
The dissolution of HC samples in BMIMAc/DMAc was investigated using PLM. Figure 4 shows representative PLM images of HC at various concentrations in BMIMAc/DMAc at different times after the start of the dissolution process at ambient conditions. As the images below show, there is an effect of time and concentration on the dissolution of HC (Figure 4). For a specific concentration, less fibers become visible over time as the dissolution progresses. The comparison of images of different concentrations shows that as the concentration decreases, few fibers are visible at 7 h and 24 h (Figure 4, images: a-c). Regardless of the hydrolysis time (1 h, 2 h, and 3 h), all hydrolyzed samples display similar dissolution behavior (Figure 4, images: c-e) at a specific concentration (1%). This is consistent with the results of MW and material characterization. All HC samples did not exhibit significant differences in their DP values (~450), MWDs (Figure 1, Table 1), and material properties especially the crystalline structure (Figure 3). These parameters are the most important factors influencing cellulose dissolution.
Results from our previous study showed that high MW cotton cellulose in BMIMAc/DMAc up to 3% concentration is completely dissolved within 24 h at ambient conditions [24]. Figure 5 shows representative PLM images of the original cotton (not hydrolyzed) at 5% concentration in BMIMAc/DMAc at different times after the start of the dissolution process in identical dissolution conditions. As the images show when compared to the same concentration of hydrolyzed cotton (HC-1, Figure 4a), it is obvious that the dissolution of hydrolyzed cotton is not improved. Since the MW of HC samples is ~10 times lower than the original cotton, improvement in dissolution due to acid hydrolysis, with respect to kinetics and concentration, compared to the original cotton was expected. However, fiber clumps even at 1% concentration, although significantly smaller than after 1 and 7 h dissolution, are still visible after 24 h for HC samples (Figure 4). This indicates that improvement in dissolution of high MW cotton cellulose might not be achieved by using acid hydrolysis in BMIMAc/DMAc solvent system at ambient conditions. Despite drastic decrease in MW of cotton cellulose, and thus favorable entropic gain for dissolution in a solvent, after hydrolysis, the solubility of HC samples could not be improved compared to raw cotton (not hydrolyzed). This could be due to a number of reasons. Acid hydrolyzed cellulose generally leads to low MW cellulose products, such as cellulose nanocrystals (CNCs). It is well known that HC, such as CNCs, has a strong tendency to self-assemble and strongly agglomerate after drying [35]. Homogenous re-dispersion of HC without aggregation, after drying, has been reported to be extremely difficult [36]. Surface modification of HC is usually exploited to facilitate their dispersion in a solvent [37]. It is clearly evident from Figure 4 that HC fibers have agglomerated (l h) contrary to the mesh of long individual fibers in the solvent for original cotton at identical time after the start of the dissolution process (Figure 5). Agglomeration and inhomogeneous dispersion of HC, in this case, likely made the diffusion of BMIMAc/DMAc more difficult to the inside of the polymeric network of cellulose at ambient temperature, thereby hindering the dissolution. Moreover, HC is mostly crystalline due to the removal of amorphous regions unlike the original cotton cellulose. The amorphous regions are more accessible to solvents and chemicals at the beginning and solvent molecules subsequently slowly diffuse to the inside of the entire polymeric network [38]. Therefore, it is logical to assume that the entropic gain for dissolution due to decreased DP for hydrolyzed cotton cellulose is possibly offset by increased crystallinity at ambient condition, because solvent molecules have lower kinetic energy and are unable to penetrate the crystalline regions in the HC at ambient conditions.

3.5. Rheological Behavior of Hydrolyzed Cotton Solutions in BMIMAc/DMAc

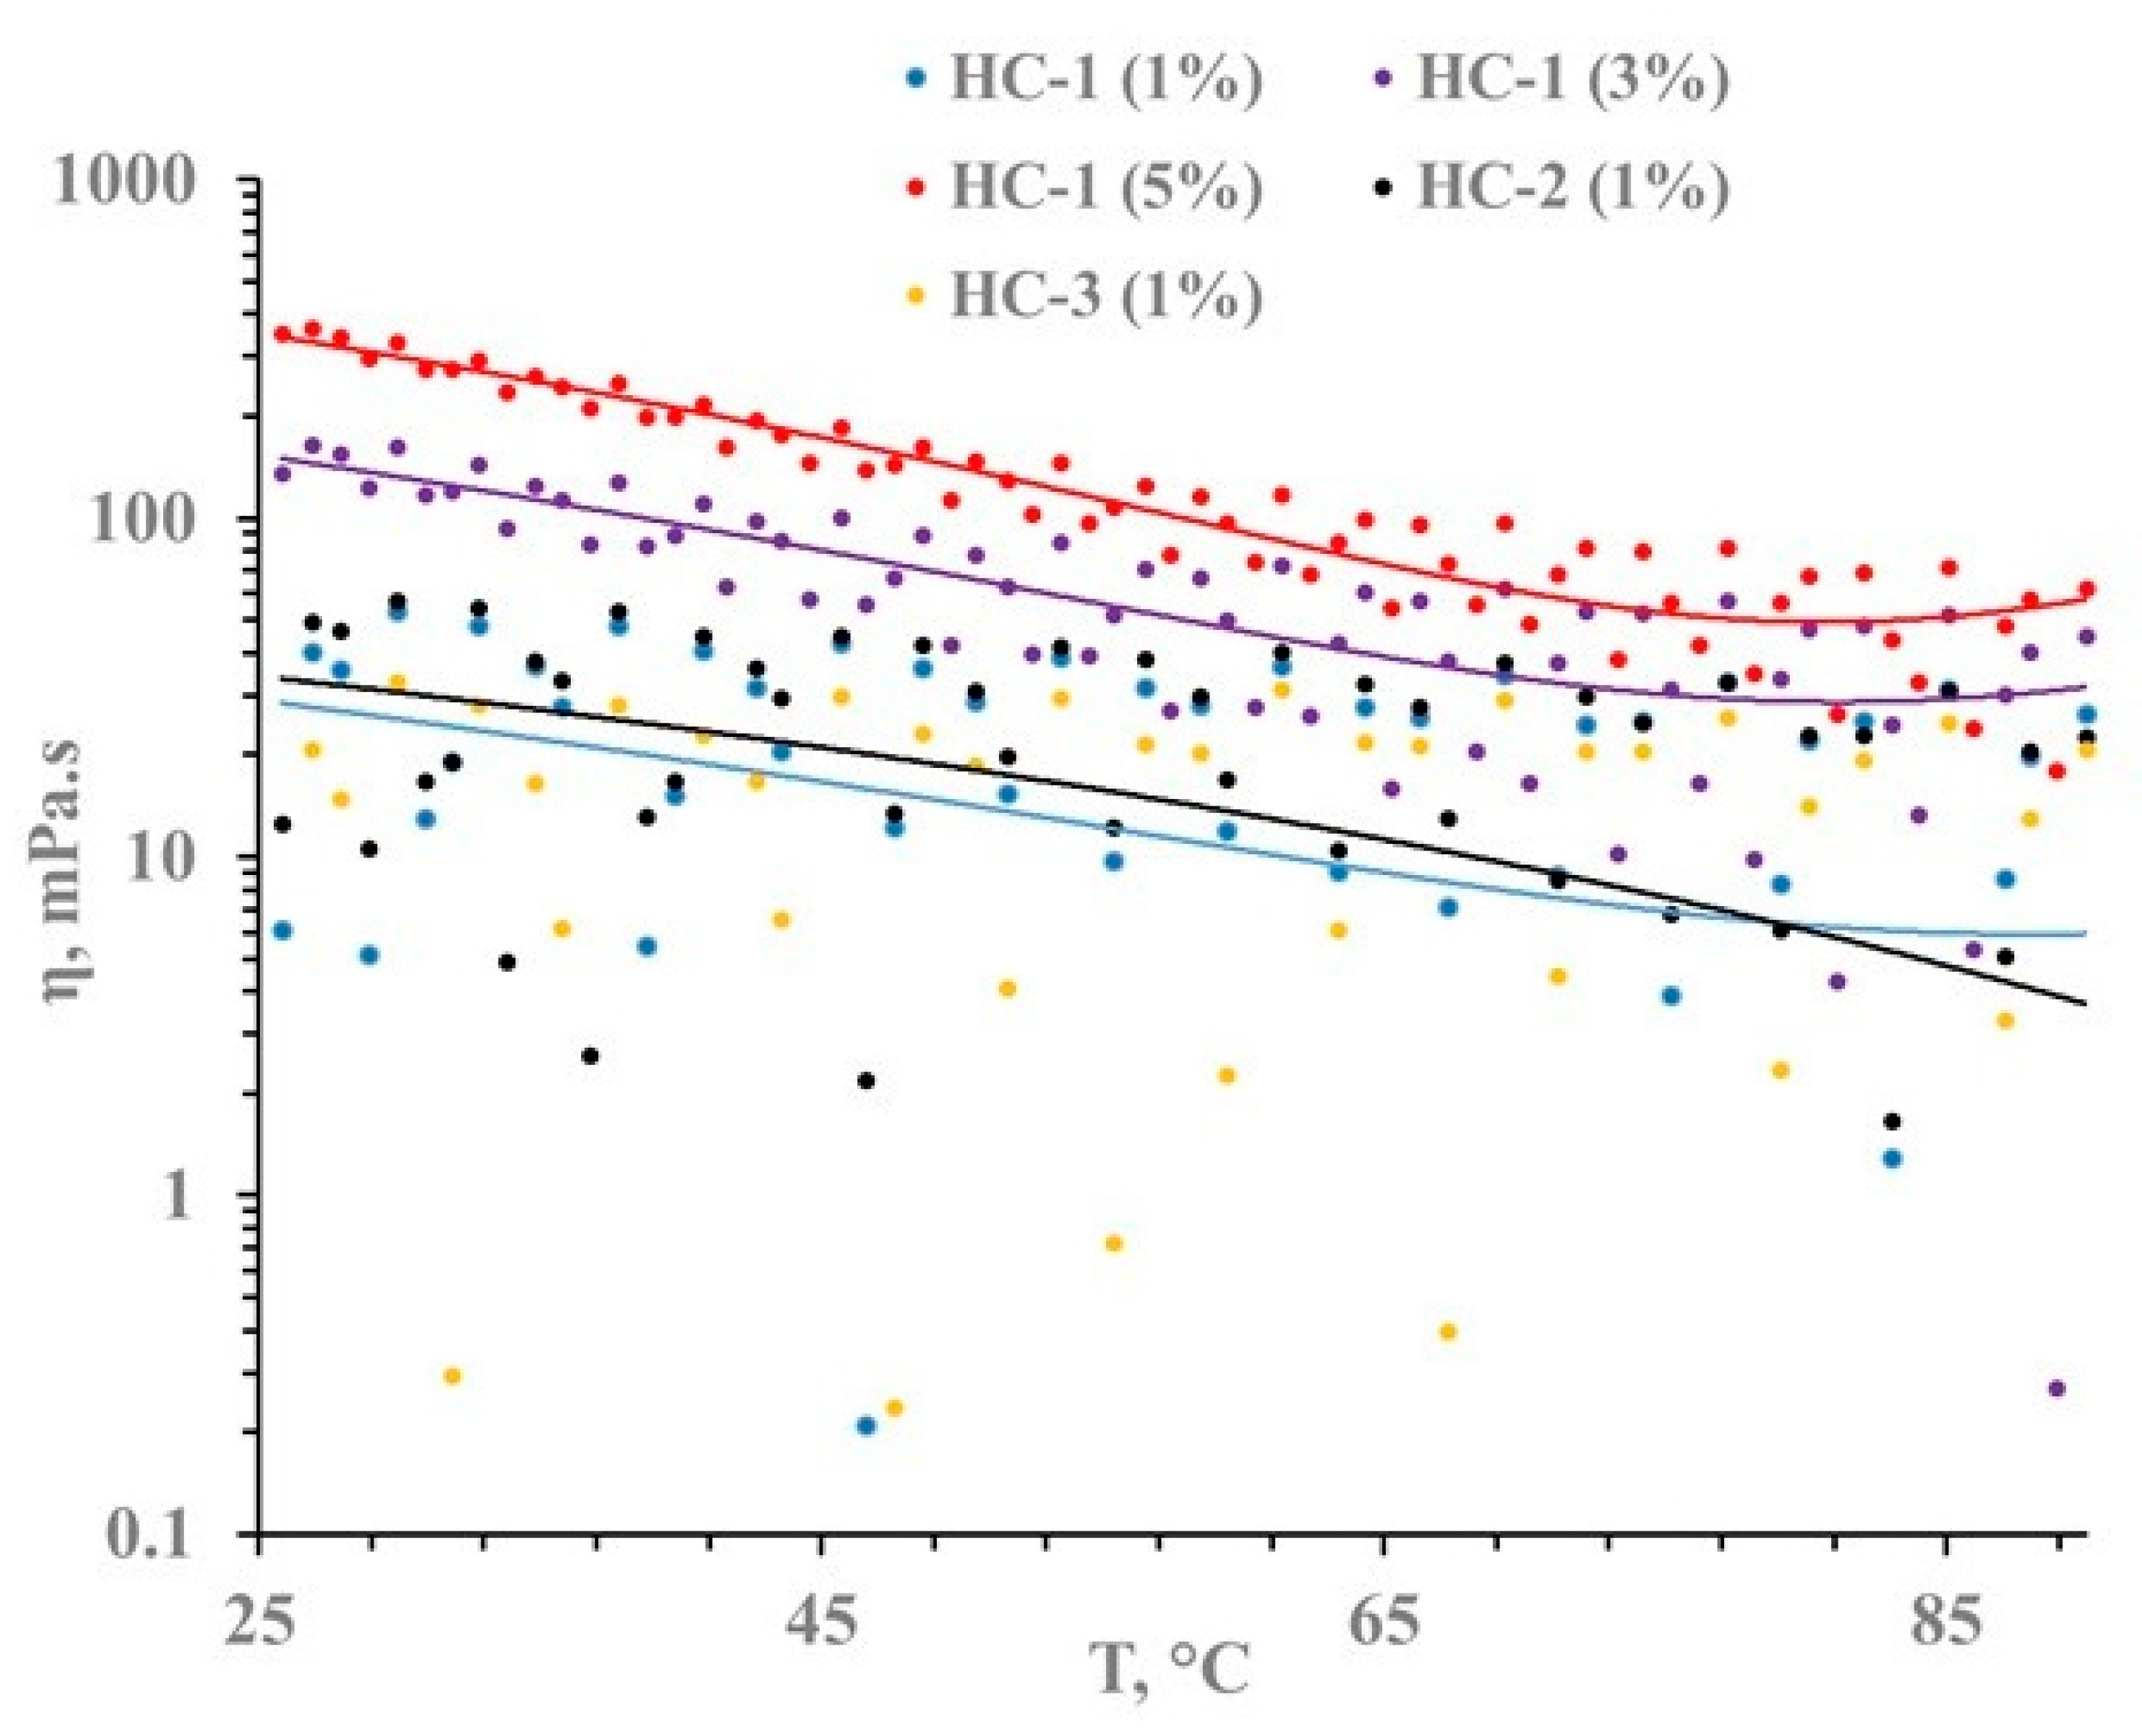
Temperature ramp and steady flow measurement were performed to study the rheological properties of samples (different HC/solvent solutions). The temperature dependence of the viscosity of hydrolyzed cotton cellulose solutions are shown in Figure 6. For all samples with higher cellulose content (HC-1, 3% and HC-1, 5%), the viscosity continuously decreases as the temperature increases. This behavior is a typical rheological response of polymeric suspensions, solutions, and melts. Increased mobility of cellulose polymer chains at higher temperature results in a decrease in the viscosity of the solutions [39]. However, no decrease in viscosity is observed for samples with lower concentration of cellulose (all HC samples, 1% concentration). There is also high fluctuations among data points. The observed phenomena for HC samples of 1% concentration could possibly be due to very limited polymer chain entanglements in the solution as a result of limited dissolution. As Figure 6 shows, the viscosity of the solution increases as the concentration of HC in the solvent increases. It is due to the increase in entanglements of the cellulose polymer chains with increasing concentration. Figure 7 shows the viscosity as a function of shear rate both in logarithmic scale for different hydrolyzed cotton solutions along with the original cotton cellulose solutions. Data for the lower shear rate is not shown as the observed instabilities of flow curves at lower shear rates could arise from instrumental effect not from the behavior of the solution [40]. It can be observed that the original cotton cellulose solutions at each concentration display resemblance to pseudo-plastic fluid, a typical behavior of polymer solutions or melts [41]. However, for HC solutions, the flow curves are largely flat with no or negligible change in viscosity with increasing shear rate which could be indicative of less cellulose polymer chain entanglements due to limited dissolution. This explanation is consistent with results obtained from PLM observation, which shows the presence of certain amount of undissolved cellulose fibers in the solution of hydrolyzed cotton even at 1% concentration after 24 h dissolution while our previous study showed the absence of undissolved cellulose fibers in cotton cellulose solutions (concentration ≤3%) indicating that the dissolution of hydrolyzed cotton was not improved in BMIMAc/DMAc as compared to the original cotton at ambient conditions [24].

3.6. Dissolution of Hydrolyzed Cotton Cellulose over Time at Increased Temperature

The above results showed that the decrease in MW did not facilitate the dissolution of hydrolyzed cotton cellulose as compared to the original cotton cellulose at ambient conditions in BMIMAc/DMAc. We attributed the observed phenomena to increased crystallinity of the hydrolyzed cotton samples and their agglomeration after drying, both of which contribute to the hindrances in diffusion of the BMIMAc/DMAc to the interior of the polymeric network of cellulose especially at ambient conditions. If that is the case, when the mobility of the solvent molecules is increased, enhanced dissolution is expected. To test this hypothesis, we investigated the dissolution of hydrolyzed cotton cellulose (HC-1) at 5% concentration at increased temperatures. Figure 8 shows representative PLM images of hydrolyzed cotton (HC-1) at 5% concentration in BMIMAc/DMAc at different times after the start of the dissolution process at 35 °C. It is evident from the images that the dissolution of hydrolyzed cellulose is greatly enhanced especially after 7 h and 24 h at 35 °C compared to the dissolution at ambient temperature (Figure 4). Further increase of the dissolution temperature to 55 °C leads to a pronounced enhancement in the dissolution of hydrolyzed cotton cellulose as almost no undissolved cellulose is visible after 1 h dissolution (Figure 9). Taken together, these results corroborate our hypothesis that improving the physical properties of cellulose including fiber aggregating status and solvent diffusivity in the bulk cellulose in the solution, and cellulose crystallinity are critical compared to reducing the MW of cellulose for improving the dissolution of high molecular weight cellulose under mild conditions. Therefore, disrupting cellulose fiber agglomeration and reducing its crystallinity should be good strategies to dissolve high molecular weight cellulose under mild conditions when acid hydrolysis pretreatment is applied. Additionally, using aqueous based solvents might also be a good strategy. When aqueous based solvents are used (e.g., NMMO), the need for drying of hydrolyzed cellulose is eliminated, and thus agglomeration of hydrolyzed cellulose during drying can be avoided [42].

4. Conclusions

Sulfuric acid hydrolysis of high MW cotton cellulose (DP > 4000) was carried out to obtain hydrolyzed cotton cellulose (HC) samples. The effect of acid hydrolysis on the MW and material properties of cotton cellulose was studied using GPC, FTIR, XRD, and TGA, respectively. The dissolution process of HC samples in BMIMAc/DMAc solvent system under mild conditions was illustrated and the rheological properties of HC solutions were also studied. The acid hydrolysis of cotton cellulose significantly resulted in the reduction of its MW by 10 times, while the crystallinity of HC samples was increased. It was found that the reduction of the MW of cellulose did not lead to an improvement of the dissolution at room temperature. However, increasing the dissolution temperature to 35 °C and 55 °C led to a significant improvement in the dissolution of HC samples. This result indicates that the physical properties of cellulose play an important role in the dissolution of cellulose under mild conditions compared to the MW. Fiber agglomeration and increased crystallinity of HC samples may hinder the solvent diffusion. When the dissolution temperature increases, the thermal mobility of the solvent molecules increases and the fiber aggregation is disrupted, the diffusion of the solvent inside the polymeric network of cellulose is accelerated, which leads to improvement in dissolution. Therefore, improvements in the dissolution of high molecular weight cellulose under mild conditions using acid hydrolysis should minimize the agglomeration and increase the re-dispersion of hydrolyzed cellulose (e.g., surface modification).

Supplementary Materials

The following are available online at https://www.mdpi.com/2079-6439/9/1/5/s1, Figure S1: TGA thermograms of cotton and hydrolyzed cotton samples: (i) cotton, (ii) HC-1, (iii) HC-2, (iv) HC-3, Figure S2: DTG curves of cotton and hydrolyzed cotton samples: (i) cotton, (ii) HC-1, (iii) HC-2, (iv) HC-3. Table S1: Weight loss and cellulose decomposition temperature of cotton and hydrolyzed cotton samples.

Author Contributions

The authors contributed equally. All authors have read and agreed to the published version of the manuscript.

Funding

This research received no external funding.

Institutional Review Board Statement

Not applicable.

Informed Consent Statement

Not applicable.

Data Availability Statement

Please refer to suggested Data Availability Statements in section “MDPI Research Data Policies” at https://www.mdpi.com/ethics.

Acknowledgments

The authors would like to thank Tanya Jackson and Erandi Rajakaruna for their kind technical assistance.

Conflicts of Interest

The authors declare no conflict of interest.

References

  1. Moon, R.J.; Martini, A.; Nairn, J.; Simonsen, J.; Youngblood, J. Cellulose nanomaterials review: Structure, properties and nanocomposites. Chem. Soc. Rev. 2011, 40, 3941–3994. [Google Scholar] [CrossRef] [PubMed]
  2. Klemm, D.; Heublein, B.; Fink, H.P.; Bohn, A. Cellulose: Fascinating biopolymer and sustainable raw material. Angew. Chemie. Int. Ed. 2005, 44, 3358–3393. [Google Scholar] [CrossRef] [PubMed]
  3. Hu, Y.; Catchmark, J.M. Formation and characterization of spherelike bacterial cellulose particles produced by acetobacter xylinum JCM 9730 strain. Biomacromolecules 2010, 11, 1727–1734. [Google Scholar] [CrossRef] [PubMed]
  4. Acharya, S.; Abidi, N.; Rajbhandari, R.; Meulewaeter, F. Chemical cationization of cotton fabric for improved dye uptake. Cellulose 2014, 21, 4693–4706. [Google Scholar] [CrossRef]
  5. Wang, S.; Lu, A.; Zhang, L. Recent advances in regenerated cellulose materials. Prog. Polym. Sci. 2016, 53, 169–206. [Google Scholar] [CrossRef]
  6. Hu, Y.; Abidi, N. Distinct chiral nematic self-assembling behavior caused by different size-unified cellulose nanocrystals via a multistage separation. Langmuir 2016, 32, 9863–9872. [Google Scholar] [CrossRef]
  7. Hu, Y.; Catchmark, J.M.; Zhu, Y.; Abidi, N.; Zhou, X.; Wang, J.; Liang, N. Engineering of porous bacterial cellulose toward human fibroblasts ingrowth for tissue engineering. J. Mater. Res. 2014, 29, 2682–2693. [Google Scholar] [CrossRef]
  8. Hu, Y.; Catchmark, J.M. In vitro biodegradability and mechanical properties of bioabsorbable bacterial cellulose incorporating cellulases. Acta Biomater. 2011, 7, 2835–2845. [Google Scholar] [CrossRef]
  9. Hu, Y.; Catchmark, J.M.; Vogler, E.A. Factors impacting the formation of sphere-like bacterial cellulose particles and their biocompatibility for human osteoblast growth. Biomacromolecules 2013, 14, 3444–3452. [Google Scholar] [CrossRef]
  10. Hu, Y.; Li, S.; Jackson, T.; Moussa, H.; Abidi, N. Preparation, Characterization and Cationic Functionalization of Cellulose-Based Aerogels for Wastewater Clarification. J. Mater. 2016, 2016, 1–10. [Google Scholar] [CrossRef] [Green Version]
  11. Hu, Y.; Zhu, Y.; Ruan, C.; Pan, H.; Catchmark, J.M. Bioabsorbable cellulose composites prepared by an improved mineral-binding process for bone defect repair. J. Mater. Chem. B 2016, 4, 1235–1246. [Google Scholar] [CrossRef] [PubMed]
  12. Glasser, W.G.; Atalla, R.H.; Blackwell, J.; Brown, M.M.; Burchard, W.; French, A.D.; Klemm, D.O.; Nishiyama, Y. About the structure of cellulose: Debating the Lindman hypothesis. Cellulose 2012, 19, 589–598. [Google Scholar] [CrossRef]
  13. Medronho, B.; Romano, A.; Miguel, M.G.; Stigsson, L.; Lindman, B. Rationalizing cellulose (in)solubility: Reviewing basic physicochemical aspects and role of hydrophobic interactions. Cellulose 2012, 19, 581–587. [Google Scholar] [CrossRef]
  14. Fukaya, Y.; Hayashi, K.; Wada, M.; Ohno, H. Cellulose dissolution with polar ionic liquids under mild conditions: Required factors for anions. Green Chem. 2008, 10, 44. [Google Scholar] [CrossRef]
  15. Chen, J.; Guan, Y.; Wang, K.; Zhang, X.; Xu, F.; Sun, R. Combined effects of raw materials and solvent systems on the preparation and properties of regenerated cellulose fibers. Carbohydr. Polym. 2015, 128, 147–153. [Google Scholar] [CrossRef]
  16. Lindman, B.; Medronho, B. The Subtleties of Dissolution and Regeneration of Cellulose: Breaking and Making Hydrogen Bonds. Bio. Res. 2015, 10, 3811–3814. [Google Scholar] [CrossRef]
  17. Shi, Z.; Yang, Q.; Kuga, S.; Matsumoto, Y. Dissolution of Wood Pulp in Aqueous NaOH/Urea Solution via Dilute Acid Pretreatment. J. Agric. Food Chem. 2015, 63, 6113–6119. [Google Scholar] [CrossRef]
  18. Qi, H.; Chang, C.; Zhang, L. Effects of temperature and molecular weight on dissolution of cellulose in NaOH/urea aqueous solution. Cellulose 2008, 15, 779–787. [Google Scholar] [CrossRef]
  19. Medronho, B.; Lindman, B. Brief overview on cellulose dissolution/regeneration interactions and mechanisms. Adv. Colloid Interface Sci. 2015, 222, 502–508. [Google Scholar] [CrossRef]
  20. Trygg, J.; Fardim, P. Enhancement of cellulose dissolution in water-based solvent via ethanol-hydrochloric acid pretreatment. Cellulose 2011, 18, 987–994. [Google Scholar] [CrossRef]
  21. Gong, X.; Wang, Y.; Tian, Z.; Zheng, X.; Chen, L. Controlled production of spruce cellulose gels using an environmentally “green” system. Cellulose 2014, 21, 1667–1678. [Google Scholar] [CrossRef]
  22. Battista, O.A.; Coppick, S.; Howsmon, J.A.; Morehead, F.F.; Sisson, W.A. Level-off degree of polymerization-relation to polyphase structure of cellulose fibers. Ind. Eng. Chem. 1956, 48, 333–335. [Google Scholar] [CrossRef]
  23. Satari, B.; Karimi, K.; Kumar, R. Cellulose Solvent-Based Pretreatment for Enhanced Second-Generation Biofuel Production: A Review; Royal Society of Chemistry: London, UK, 2019; Volume 3, ISBN 8415683111. [Google Scholar]
  24. Acharya, S.; Hu, Y.; Abidi, N. Mild condition dissolution of high molecular weight cotton cellulose in 1-butyl-3-methylimidazolium acetate/N,N-dimethylacetamide solvent system. J. Appl. Polym. Sci. 2018, 135, 9. [Google Scholar] [CrossRef]
  25. Hebeish, A.; Hashem, M.; Shaker, N.; Ramadan, M.; El-Sadek, B.; Hady, M.A. New development for combined bioscouring and bleaching of cotton-based fabrics. Carbohydr. Polym. 2009, 78, 961–972. [Google Scholar] [CrossRef]
  26. Park, S.; Baker, J.O.; Himmel, M.E.; Parilla, P.A.; Johnson, D.K. Cellulose crystallinity index: Measurement techniques and their impact on interpreting cellulase performance. Biotechnol. Biofuels 2010, 3, 1–10. [Google Scholar] [CrossRef] [PubMed] [Green Version]
  27. Acharya, S.; Hu, Y.; Moussa, H.; Abidi, N. Preparation and characterization of transparent cellulose films using an improved cellulose dissolution process. J. Appl. Polym. Sci. 2017, 134, 1–12. [Google Scholar] [CrossRef]
  28. Palme, A.; Theliander, H.; Brelid, H. Acid hydrolysis of cellulosic fibres: Comparison of bleached kraft pulp, dissolving pulps and cotton textile cellulose. Carbohydr. Polym. 2016, 136, 1281–1287. [Google Scholar] [CrossRef] [Green Version]
  29. Abidi, N.; Cabrales, L.; Haigler, C.H. Changes in the cell wall and cellulose content of developing cotton fibers investigated by FTIR spectroscopy. Carbohydr. Polym. 2014, 100, 9–16. [Google Scholar] [CrossRef]
  30. Gu, J.; Catchmark, J.M.; Kaiser, E.Q.; Archibald, D.D. Quantification of cellulose nanowhiskers sulfate esterification levels. Carbohydr. Polym. 2013, 92, 1809–1816. [Google Scholar] [CrossRef]
  31. Liu, X.; Pang, J.; Zhang, X.; Wu, Y.; Sun, R. Regenerated cellulose film with enhanced tensile strength prepared with ionic liquid 1-ethyl-3-methylimidazolium acetate (EMIMAc). Cellulose 2013, 20, 1391–1399. [Google Scholar] [CrossRef]
  32. Ruan, C.; Zhu, Y.; Zhou, X.; Abidi, N.; Hu, Y.; Catchmark, J.M. Effect of cellulose crystallinity on bacterial cellulose assembly. Cellulose 2016, 23, 3417–3427. [Google Scholar] [CrossRef]
  33. Oh, S.Y.; Yoo, D., II; Shin, Y.; Kim, H.C.; Kim, H.Y.; Chung, Y.S.; Park, W.H.; Youk, J.H. Crystalline structure analysis of cellulose treated with sodium hydroxide and carbon dioxide by means of X-ray diffraction and FTIR spectroscopy. Carbohydr. Res. 2005, 340, 2376–2391. [Google Scholar] [CrossRef] [PubMed]
  34. Roman, M.; Winter, W.T. Effect of sulfate groups from sulfuric acid hydrolysis on the thermal degradation behaviour of bacterial cellulose. Biomacromolecules 2004, 5, 1671–1677. [Google Scholar] [CrossRef] [PubMed]
  35. Ljungberg, N.; Bonini, C.; Bortolussi, F.; Boisson, C.; Heux, L.; Cavaillé, J.Y. New nanocomposite materials reinforced with cellulose whiskers in atactic polypropylene: Effect of surface and dispersion characteristics. Biomacromolecules 2005, 6, 2732–2739. [Google Scholar] [CrossRef] [PubMed]
  36. Habibi, Y.; Lucia, L.A.; Rojas, O.J. Cellulose nanocrystals: Chemistry, self-assembly, and applications. Chem. Rev. 2010, 110, 3479–3500. [Google Scholar] [CrossRef]
  37. Siqueira, G.; Kokkinis, D.; Libanori, R.; Hausmann, M.K.; Gladman, A.S.; Neels, A.; Tingaut, P.; Zimmermann, T.; Lewis, J.A.; Studart, A.R. Cellulose Nanocrystal Inks for 3D Printing of Textured Cellular Architectures. Adv. Funct. Mater. 2017, 27, 1604619. [Google Scholar] [CrossRef]
  38. Cuissinat, C.; Navard, P. Swelling and dissolution of cellulose Part I: Free floating cotton and wood fibres in N-Methylmorpholine-N-oxide-Water Mixtures. Macromol. Symp. 2006, 244, 1–18. [Google Scholar] [CrossRef]
  39. Al-Shammari, B.; Al-Fariss, T.; Al-Sewailm, F.; Elleithy, R. The effect of polymer concentration and temperature on the rheological behavior of metallocene linear low density polyethylene (mLLDPE) solutions. J. King Saud Univ. Eng. Sci. 2011, 23, 9–14. [Google Scholar] [CrossRef] [Green Version]
  40. Skvortsov, I.Y.; Malkin, A.Y.; Kulichikhin, V.G. Self-Oscillations Accompanying Shear Flow of Colloidal and Polymeric Systems. Reality and Instrumental Effects. Colloid J. 2019, 81, 176–186. [Google Scholar] [CrossRef]
  41. Gericke, M.; Schlufter, K.; Liebert, T.; Heinze, T.; Budtova, T. Rheological Properties of Cellulose/Ionic Liquid Solutions: From Dilute to Concentrated States. Biomacromolecules 2009, 10, 1188–1194. [Google Scholar] [CrossRef]
  42. Zhang, S.; Chen, C.; Duan, C.; Hu, H.; Li, H.; Li, J.; Liu, Y.; Ma, X.; Stavik, J.; Ni, Y. Regenerated cellulose by the lyocell process, a brief review of the process and properties. BioResources 2018, 13, 1–16. [Google Scholar]
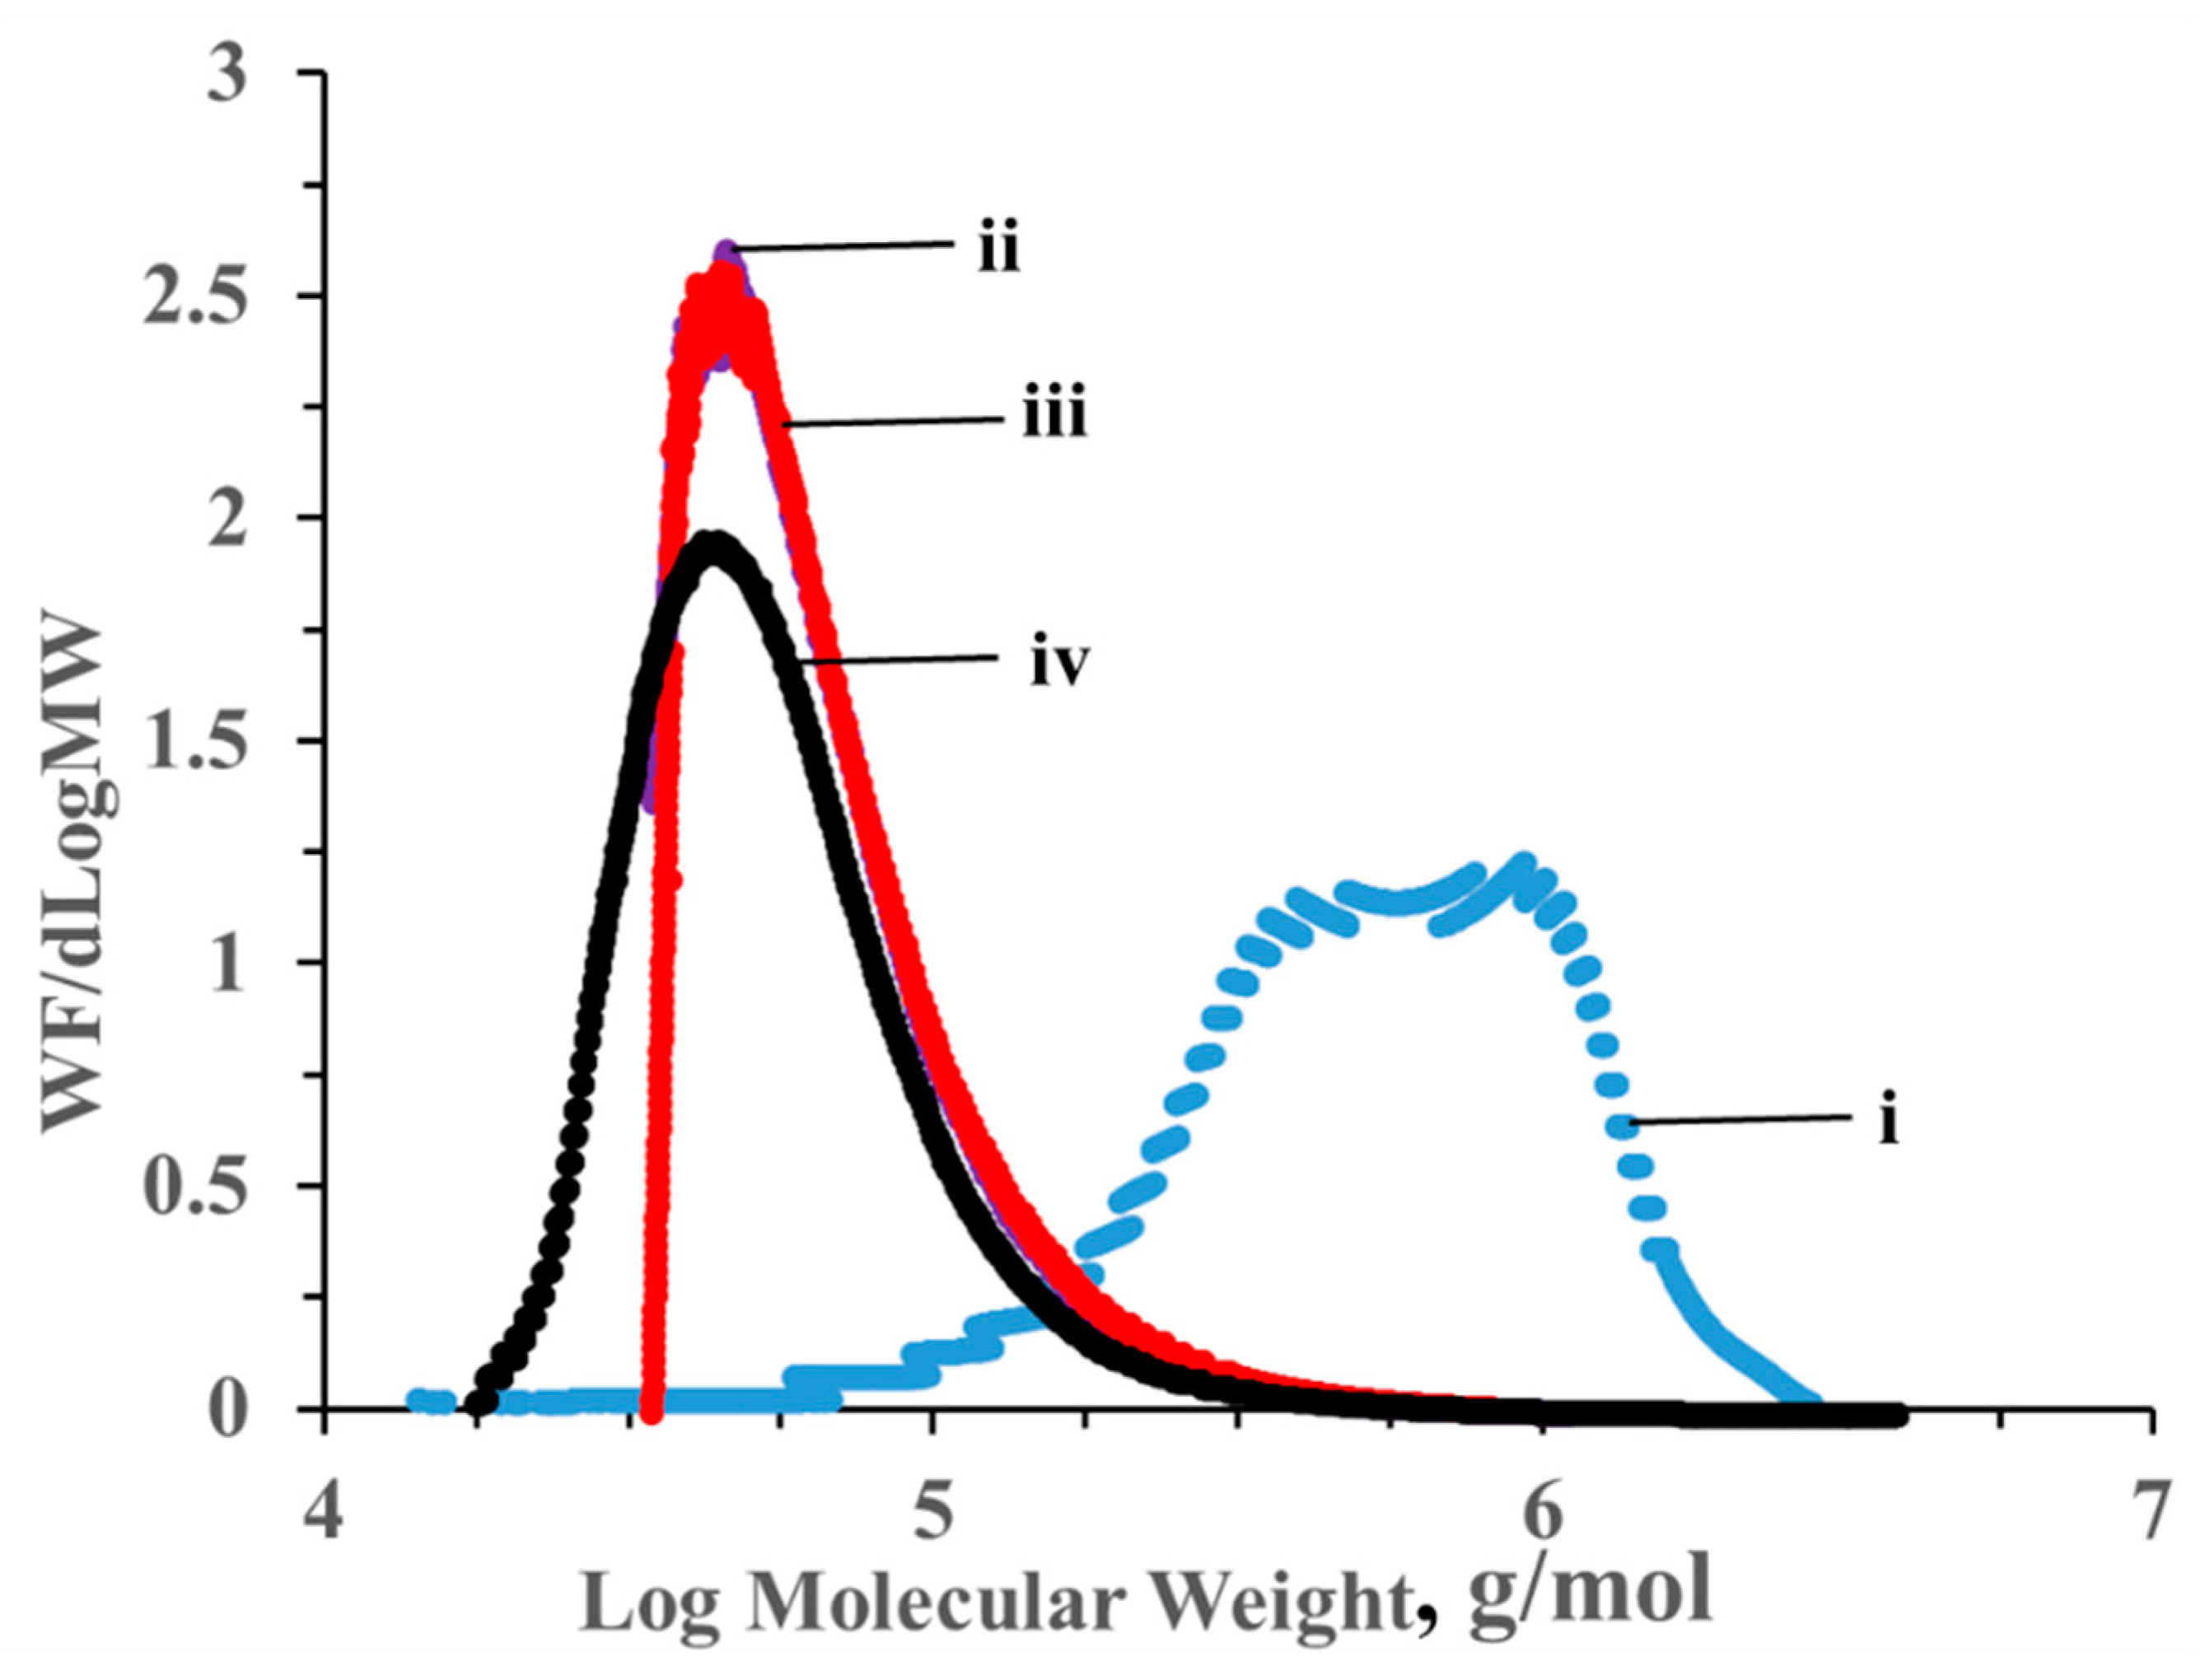
Figure 1. Molecular weight distributions (MWDs) of cotton and hydrolyzed cotton samples: (i) Cotton, (ii) HC-1, (iii) HC-2, (iv) HC-3.
Fibers 09 00005 g001
Figure 2. FTIR spectra of cotton and hydrolyzed cotton samples: (i) Cotton, (ii) HC-1, (iii) HC-2, (iv) HC-3.
Fibers 09 00005 g002
Figure 3. XRD patterns of cotton and hydrolyzed cotton samples: (i) Cotton, (ii) HC-1, (iii) HC-2, (iv) HC-3.
Fibers 09 00005 g003
Figure 4. Polarized light microscopy (PLM) images of hydrolyzed cotton samples dissolved at different times in BMIMAc/DMAc at ambient temperature: (a) HC-1 (5%), (b) HC-1 (3%), (c) HC-1 (1%), (d) HC-2 (1%), (e) HC-3 (1%).
Fibers 09 00005 g004
Figure 5. PLM image of cotton (not hydrolyzed) dissolved at different times in BMIMAc/DMAc at ambient temperature (cellulose concentration = 5%).
Fibers 09 00005 g005
Figure 6. Temperature dependence of viscosity for different solutions of hydrolyzed cotton cellulose in BMIMAc/DMAc at ambient temperature. The lines are drawn to show the general trend. For HC-3, no trend line is drawn due to high variability among data points.
Fibers 09 00005 g006
Figure 7. Viscosity as a function of shear rate for different solutions of cotton and hydrolyzed cotton cellulose in BMIMAc/DMAc at ambient temperature.
Fibers 09 00005 g007
Figure 8. PLM images of hydrolyzed cotton (HC-1) dissolution at different times in BMIMAc/DMAc at 35 °C (cellulose concentration = 5%).
Fibers 09 00005 g008
Figure 9. PLM image of hydrolyzed cotton (HC-1) dissolution in BMIMAc/DMAc at 55 °C (cellulose concentration = 5%).
Fibers 09 00005 g009
Table 1. Molecular weight (MW) and degree of polymerization (DP) of cotton and hydrolyzed cotton samples.
SampleWeight Average Molecular Weight (MW), DaDegree of Polymerization (DP)
Cotton672,500 ± 25,3004152 ± 156
HC-173,900 ± 4100456 ± 26
HC-273,5004 ± 4200454 ± 26
HC-371,600 ± 2900442 ± 18
Table 2. Crystallinity indices (C.I.) of cotton and hydrolyzed cotton samples.
SampleCrystallinity Index (C.I.), %
Cotton81
HC-185
HC-293
HC-385
Publisher’s Note: MDPI stays neutral with regard to jurisdictional claims in published maps and institutional affiliations.