Article

Concentration-Dependent Association of Flavylium Chloride with Differential Hydroxy Moieties in Ethanol

1
Department of Chemistry, St. Joseph’s College, 245 Clinton Ave., Brooklyn, NY 11205, USA
2
Department of Chemistry, York College-CUNY, 94-20 Guy R. Brewer Blvd., Jamaica, NY 11451, USA
*
Author to whom correspondence should be addressed.
Colorants 2022, 1(1), 20-37; https://doi.org/10.3390/colorants1010004
Submission received: 1 October 2021 / Revised: 6 December 2021 / Accepted: 14 December 2021 / Published: 23 December 2021

Abstract

:
Flavylium ions (6a6e) were synthesized using Aldol condensation to compare the spectroscopic properties caused by the different numbers and locations of hydroxy groups on the flavylium cations (AH+). Without the addition of acid, increasing the concentration of flavylium ions to 10 mM in ethanol led to the following observation. The flavylium ions with the least number of OH groups (6a and 6b) showed a change in peak at higher concentrations, whereas 6c and 6d did not show the same degree of change in their 1H-NMR signals. This suggests an equilibrium that shifts the isomers B, CE, and Cz more towards the flavylium ion with more OH groups even at low concentrations. One possibility for the cause of this shift is that the flavylium ions become more stable through aggregation. In addition to the NMR results, the UV measurements confirmed that isomers with fewer OH groups showed a more dramatic shift towards the flavylium ion at higher concentrations. Using modeling data at DFT//B3LYP/6311**G(d) level, the self-association was investigated to show that the hydrogen bonding of OH groups is the main player but cannot stabilize entirely without the presence of the chloride ion in the complex.

1. Introduction

The flavylium cation ring (AH+) in anthocyanidin is arguably the most versatile natural dye molecule [1,2,3,4,5,6,7,8,9,10,11,12,13,14,15,16,17,18]. It is composed of a positively charged aromatic pyrylium ring (C ring) with an additional ring (A ring) to form an effective benzopyrylium conjugated π system, similar to the coumarin and naphthalene π systems. Then a single bond from C2 on the electron-deficient pyrylium ring holds a benzene ring for an even more extensive conjugation system. The naturally occurring anthocyanins have a different number of hydroxy groups and alkoxy groups commonly on 3, 5, 7, 3′, 4′, and 5′ (red fonts in Figure 1). Hydroxy groups on 7 and 4′ have significantly lower pKa values than regular phenols due to the electron-deficient pyrylium ring. Additionally, the combination of the hydroxy groups at different locations on the flavylium rings exhibit varying photochemical and photophysical properties. The unique structure gives rise to a vast range of applications, primarily due to pH-sensitive changes of color and structure. This is explained by the acidic OHs and the vulnerability of the C ring to the nucleophilic attack on C2 and C4. The optical property from change-responsive absorption and emissions within the visible range of the colored flavylium ion ring allows for light-harvesting applications such as dye-sensitized solar cells (DSSCs) and recent medical applications (i.e., imaging, protein/DNA sensors, optical diagnostic agents, photodynamic therapy, and cancer therapy). Moreover, the flavylium derivatives show pharmaceutical potential, including antibacterial activity, antioxidant capability, and drug delivery systems [19,20,21,22,23,24,25,26,27,28,29].
Furthermore, the substituted flavylium (AH+) undergoes a complex equilibrium with a hydrated compound (B, hemiketal) and its isomers: CZ (Z-chalcone), and CE (E-chalcone), responding to conditions like pH and concentration, as shown in Figure 1. The acidic pH heavily favors AH+, and the stability of each compound in the equilibrium depends on other factors, such as temperature, metal chelation, intramolecular associations, and intermolecular associations with other compounds. Surprisingly, the role of each hydroxy and alkoxy group in the natural structure of anthocyanin for spectroscopic property, stability, and equilibrium distribution is not fully understood. For example, Dangles et al. reported that the presence of 3′4′-dihydroxy AH+ ions lacking the o-glycosyloxy group at C3 makes the flavylium less prone to water addition at C2, which decreases the shift toward the hemiketal form (B), as concluded from their UV spectroscopy experiment to study critical isomerization [30,31]. Moreover, the role of the counterions in solution has been widely ignored in the field, while the x-ray structure revealed the significance of anionic counterions is near the electron-deficient pyrylium ring [32].
Over the past decades, flavylium derivatives have become widespread in different areas [33,34,35,36,37,38,39,40,41,42,43,44], leading to subsequent studies about synthesizing new forms or even chemical properties (i.e., thermodynamics and kinetics [45,46,47]). However, flavylium’s widespread influence is not reflected in chemical studies that speak to the relationship between its derivatives’ structure and function, such as the effects of substituents on the equilibrium of the derivatives, especially in non-aqueous solutions.
The instability of flavylium ions makes researching them complicated and hinders the application of this promising natural compound. Thus, in the present study, for an aqueous solution of flavylium derivatives including anthocyanin, anthocyanidin, and their derivatives, pH adjustment (usually closer to 1) was utilized to manipulate the equilibrium to stabilize AH+ and reduce the interference of other compounds from the equilibrium, as shown in Figure 1. The stabilization (PE decrease) of the anthocyanin structure has been extensively explored by using co-pigmentation to enhance the stability of the AH+ state in the equilibrium. A colorless co-pigment such as cinnamic acid is introduced to cause intermolecular interaction with flavylium cation due to greater lipophilicity. As a result, the equilibrium favors the flavylium cation, and a resulting color intensification can be observed via charge transfer [48,49,50,51]. Dangles et al. also, using the 4′7-dihydroxy-AH+ ion, reported that the metal ion-binding intensifies the color and stabilizes the flavylium cation structure [52]. Other successful methods have involved chemical transformations of anthocyanins into more stable structures and encapsulations of the ionic structure to prevent the flavylium cation’s contact with water [53]. Recently, it has been proposed that self π-stacking is another mechanism to improve stability. Many researchers have used NMR, UV, and other instruments at varying pH levels in a D2O/DMSO solvent mixture at various concentrations and temperatures to show that the self-association mechanism is horizontal and vertical due to H-bonding [54,55,56]. They found that a concentration increase promotes self-association in aqueous solvents based on the chemical shift value changes of 1H-NMR. The glucoside moiety was not responsible for the self-association, but rather the core flavylium ion rings at pH = 1.
Since the self-association property in aqueous solution has been reported as the key to lowering the potential energy in aggregation, we first aimed to systematically understand the effect of the number and position of hydroxy groups on flavylium ions without glucoside moiety at different concentrations, especially in a non-aqueous solution, ethanol. Although it is usually studied in the following conditions, the application of the flavylium-containing dyes should not be limited to an aqueous solution or acidic condition. Also, there are new synthetic flavylium ions that are much more lipophilic than anthocyanin. Ethanol shows different solubility and stability for flavylium chloride salt and other relevant compounds. Thus, our investigation focused on intermolecular interactions affecting the stability of flavylium ions in aggregation using UV–visible light for low concentrations and 1H-NMR spectroscopy for high concentrations. We expect that this investigation will provide insight into whether a pH-driven reaction is the only source for the low energy level of the flavylium ion or the intermolecular interaction in aggregation also contributes to the stability. The effect of hydroxy groups on their molecular orbitals and self-assembly modes were correlated with modeling studies using the Gaussian 95 package (Wallingford, CT, USA) at DFT//B3LYP/6311**G(d) level.

2. Materials and Methods

Reagents and solvents were purchased from Fisher scientific (Waltham, MA, USA) as reagent-grade and used without further purification. 1H- and 13C-NMR spectra were recorded on a Bruker DPX 400 MHz FT NMR with QNP probe (Billerica, MA, USA). HRMS and MS analyses were performed on Agilent 6520 Q-TOF (Santa Clara, CA, USA). UV-Vis spectra were acquired using a JASCO V-650 spectrophotometer (Oklahoma City, OK, USA).

General Procedure

5.2 mmol of two reactants (aldehyde and ketone) were dissolved in 14 mL of dry ethyl acetate, and the mixture was cooled by placing the beaker in a salt ice bath (CaCl2: Ice = 1:2.5) until the temperature reached −10 °C. Sulfuric acid (100 mL) was dropped on NaCl(s) (120 g) to generate dry HCl gas, and the gas was bubbled in the mixture for 1 h at −10 °C. The reaction mixture was stirred at room temperature for 24 h. The product was obtained by filtration [57].
4′-Hydroxy flavylium ion (6a)
2-Hydroxy-benzaldehyde (0.635 g, 5.2 mmol) (1) and 1-(4-Hydroxy-phenyl)-ethanone (0.708 g, 5.2 mmol) (4) were used as the reactants to synthesize product 6a (Orange solid, 1.010 g, 3.9 mmol, 75.0%).
1H-NMR (EtOD-d6, 400 MHz): δ (ppm) 7.12 (d, J = 9.5 Hz, 2H), 7.86 (t, J = 6.0 Hz, 1H), 8.18 (t, J = 5.8 Hz, 1H), 8.24 (d, J = 5.3 Hz, 2H), 8.58 (d, J = 8.3 Hz, 2H), 8.69 (d, J = 8.3 Hz, 1H), 9.23 (d, J = 8.3 Hz, 1H). 13C-NMR (EtOD-d6, 100 MHz): δ (ppm) 115.90, 116.05, 117.51, 119.07, 121.91, 130.33, 131.56, 131.71, 132.30, 135.09, 135.93, 139.04, 156.26, 163.67, 170.23. HRMS (ESI) calcd. 223.08 for C15H11O2+: found (M+) 223.0752.
4′,7-Dihydroxy flavylium ion (6b)
2,4-Dihydroxy-benzaldehyde (0.718 g, 5.2 mmol) (2) and 1-(4-Hydroxy-phenyl)-ethanone (0.708 g, 5.2 mmol) (4) were used as the reactants to synthesize product 6b (Orange solid, 1.180 g, 4.3 mmol, 82.7%).
1H-NMR (EtOD-d6, 400 MHz): δ (ppm) 7.08 (d, J = 8.6 Hz, 2H), 7.36 (dd, J = 8.8 Hz, 2.2 Hz, 1H), 7.48 (d, J = 2.1 Hz, 1H), 8.13 (d, J = 8.6 Hz, 1H), 8.33 (d, J = 7.6 Hz, 1H), 8.39 (d, J = 7.6 Hz, 2H), 9.06 (d, J = 8.6 Hz, 1H). 13C-NMR (EtOD-d6, 100 MHz): δ (ppm) 102.52, 112.12, 117.50, 118.41, 119.56, 121.08, 132.65, 132.79, 153.09, 158.72, 167.15, 169.00, 172.25. HRMS (ESI) calcd. 239.07 for C15H11O3+: found (M+) 239.0706.
3′,4′,7-Trihydroxy flavylium ion (6c)
2,4-Dihydroxy-benzaldehyde (0.718 g, 5.2 mmol) (2) and 1-(3,4-Dihydroxy-phenyl)-ethanone (0.791 g, 5.2 mmol) (5) were used as the reactants to synthesize product 6c (Red solid, 1.050 g, 3.6 mmol, 69.2%).
1H-NMR (EtOD-d6, 400 MHz): δ (ppm) 7.04 (d, J = 8.6 Hz, 1H), 7.34 (dd, J = 8.9 Hz, 2.2 Hz, 1H), 7.42 (d, J = 1.6 Hz, 1H), 7.81 (d, J = 2.3 Hz, 1H), 7.96 (dd, J = 8.6 Hz, 2.4 Hz, 1H), 8.09 (d, J = 8.9 Hz, 1H), 8.23 (d, J = 8.8 Hz, 1H), 8.97 (d, J = 8.8 Hz, 1H). 13C-NMR (EtOD-d6, 100 MHz): δ (ppm) 103.32, 113.31, 116.04, 117.76, 119.11, 120.87, 121.69, 125.97, 133.41, 148.08, 153.38, 157.11, 159.28, 169.32, 172.90. HRMS (ESI) calcd. 255.07 for C15H11O4+: found (M+) 255.0656.
4′,7,8-Trihydroxy flavylium ion (6d)
2,3,4-Trihydroxy-benzaldehyde (0.801 g, 5.2 mmol) (3) and 1-(4-Hydroxy-phenyl)-ethanone (0.708 g, 5.2 mmol) (4) were used as the reactants to synthesize product 6d (Red solid, 1.340 g, 4.6 mmol, 88.5%).
1H-NMR (EtOD-d6, 400 MHz): δ (ppm) 7.07 (d, J = 9.0 Hz, 2H), 7.41 (d, J = 8.8 Hz, 1H), 7.66 (d, J = 8.8 Hz, 1H), 8.29 (d, J = 8.8 Hz, 1H), 8.45 (d, J = 8.9 Hz, 2H), 9.02 (d, J = 8.8 Hz, 1H). 13C-NMR (EtOD-d6, 100 MHz): δ (ppm) 112.52, 118.44, 119.95, 120.58, 120.88, 123.44, 133.91, 134.79, 147.21, 154.67, 157.70, 168.14, 173.05. HRMS (ESI) calcd. 255.07 for C15H11O4+: found (M+) 255.0655.
3′,4′,7,8-Tetrahydroxy flavylium ion (6e)
2,3,4-Trihydroxy-benzaldehyde (0.801 g, 5.2 mmol) (3) and 1-(3,4-Dihydroxy-phenyl)-ethanone (0.791 g, 5.2 mmol) (5) were used as the reactants to synthesize product 6e (Red solid, 1.20 g, 3.9 mmol, 75.0%).
1H-NMR (EtOD-d6, 400 MHz): δ (ppm) 7.04 (d, J = 8.6 Hz, 1H), 7.39 (d, J = 7.5 Hz, 1H), 7.61 (d, J = 7.5 Hz, 1H), 7.91 (d, J = 2.1 Hz, 1H), 8.01 (dd, J = 8.6 Hz, 2.5 Hz, 1H), 8.19 (d, J = 9.6 Hz, 1H), 8.94 (d, J = 6.4 Hz, 1H). 13C-NMR (EtOD-d6, 100 MHz): δ (ppm) 111.74, 115.34, 116.72, 118.71, 119.28, 120.25, 122.16, 125.19, 133.78, 146.02, 147.30, 152.88, 156.26, 156.51, 172.03. HRMS (ESI) calcd. 271.06 for C15H11O5+: found (M+) 271.0604.

3. Results and Discussion
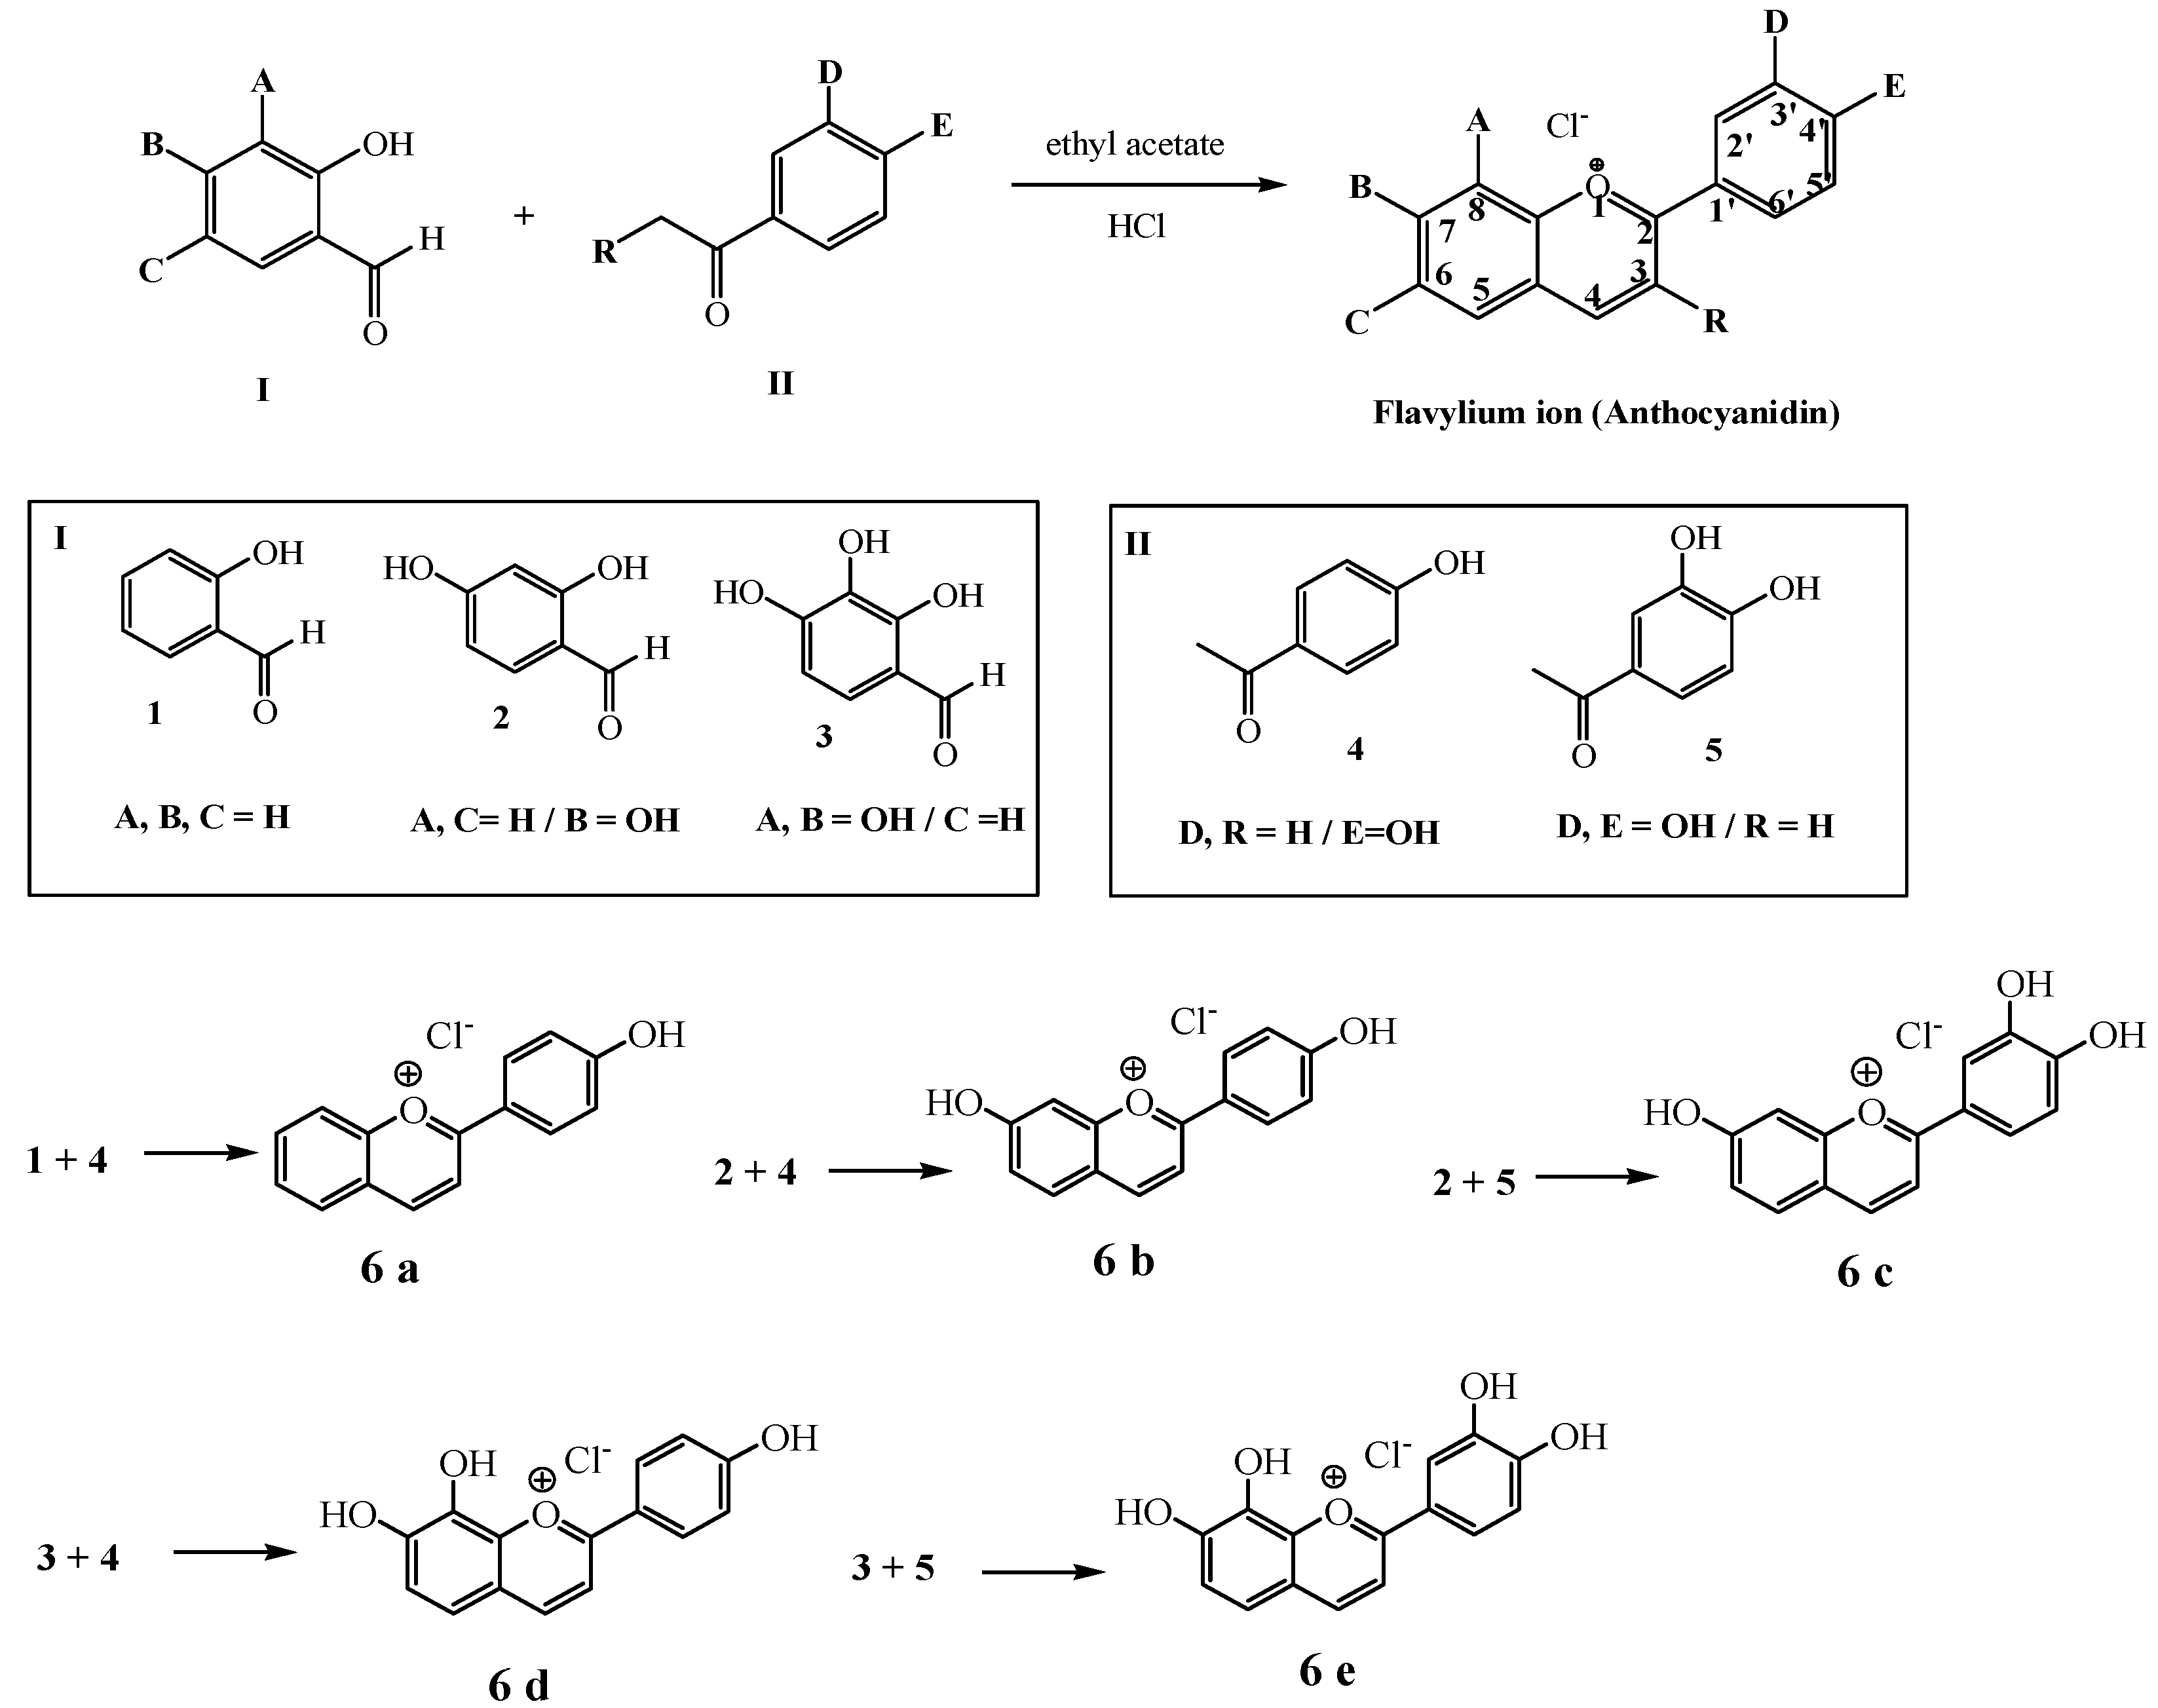
3.1. Synthesis

The aldehyde in box I reacted with the ketone in box II in dry ethyl acetate under acidic conditions to form corresponding anthocyanidins (6a6e) using Aldol condensation [31]. Three aldehyde compounds—2-Hydroxy-benzaldehyde (1), 2,4-Dihydroxy-benzaldehyde (2), and 2,3,4-Trihydroxy-benzaldehyde (3)—and two ketone compounds—1-(4-Hydroxy-phenyl)-ethanone (4) and 1-(3,4-Dihydroxy-phenyl)-ethanone (5)—were used as shown in Figure 2. Five known anthocyanidins were synthesized with one to four hydroxy groups at different positions of the flavylium structure: a hydroxyl group on 4′ carbon (6a) [58], two hydroxyl groups on 4′ and 7 (6b) [52], three hydroxyl groups on 3′, 4′, and 7 (6c) [58], three hydroxyl groups on 4′, 7, and 8 (6d) [59], and four hydroxyl groups on 3′, 4′, 7, and 8 (6e) [59]. These known compound structures were elucidated by 1H-NMR spectroscopy, UV-visible spectroscopy, and high-resolution mass spectrometry (HRMS) compared to published data. All compounds give the exact mass units that agree with the calculated masses for each flavylium ion moiety: 223.0752 (C15H11O2+, 6a), 239.0706 (C15H11O3+, 6b), 255.0656 (C15H11O4+, 6c), 255.0655 (C15H11O4+, 6d), and 271.0604 (C15H11O5+, 6e).

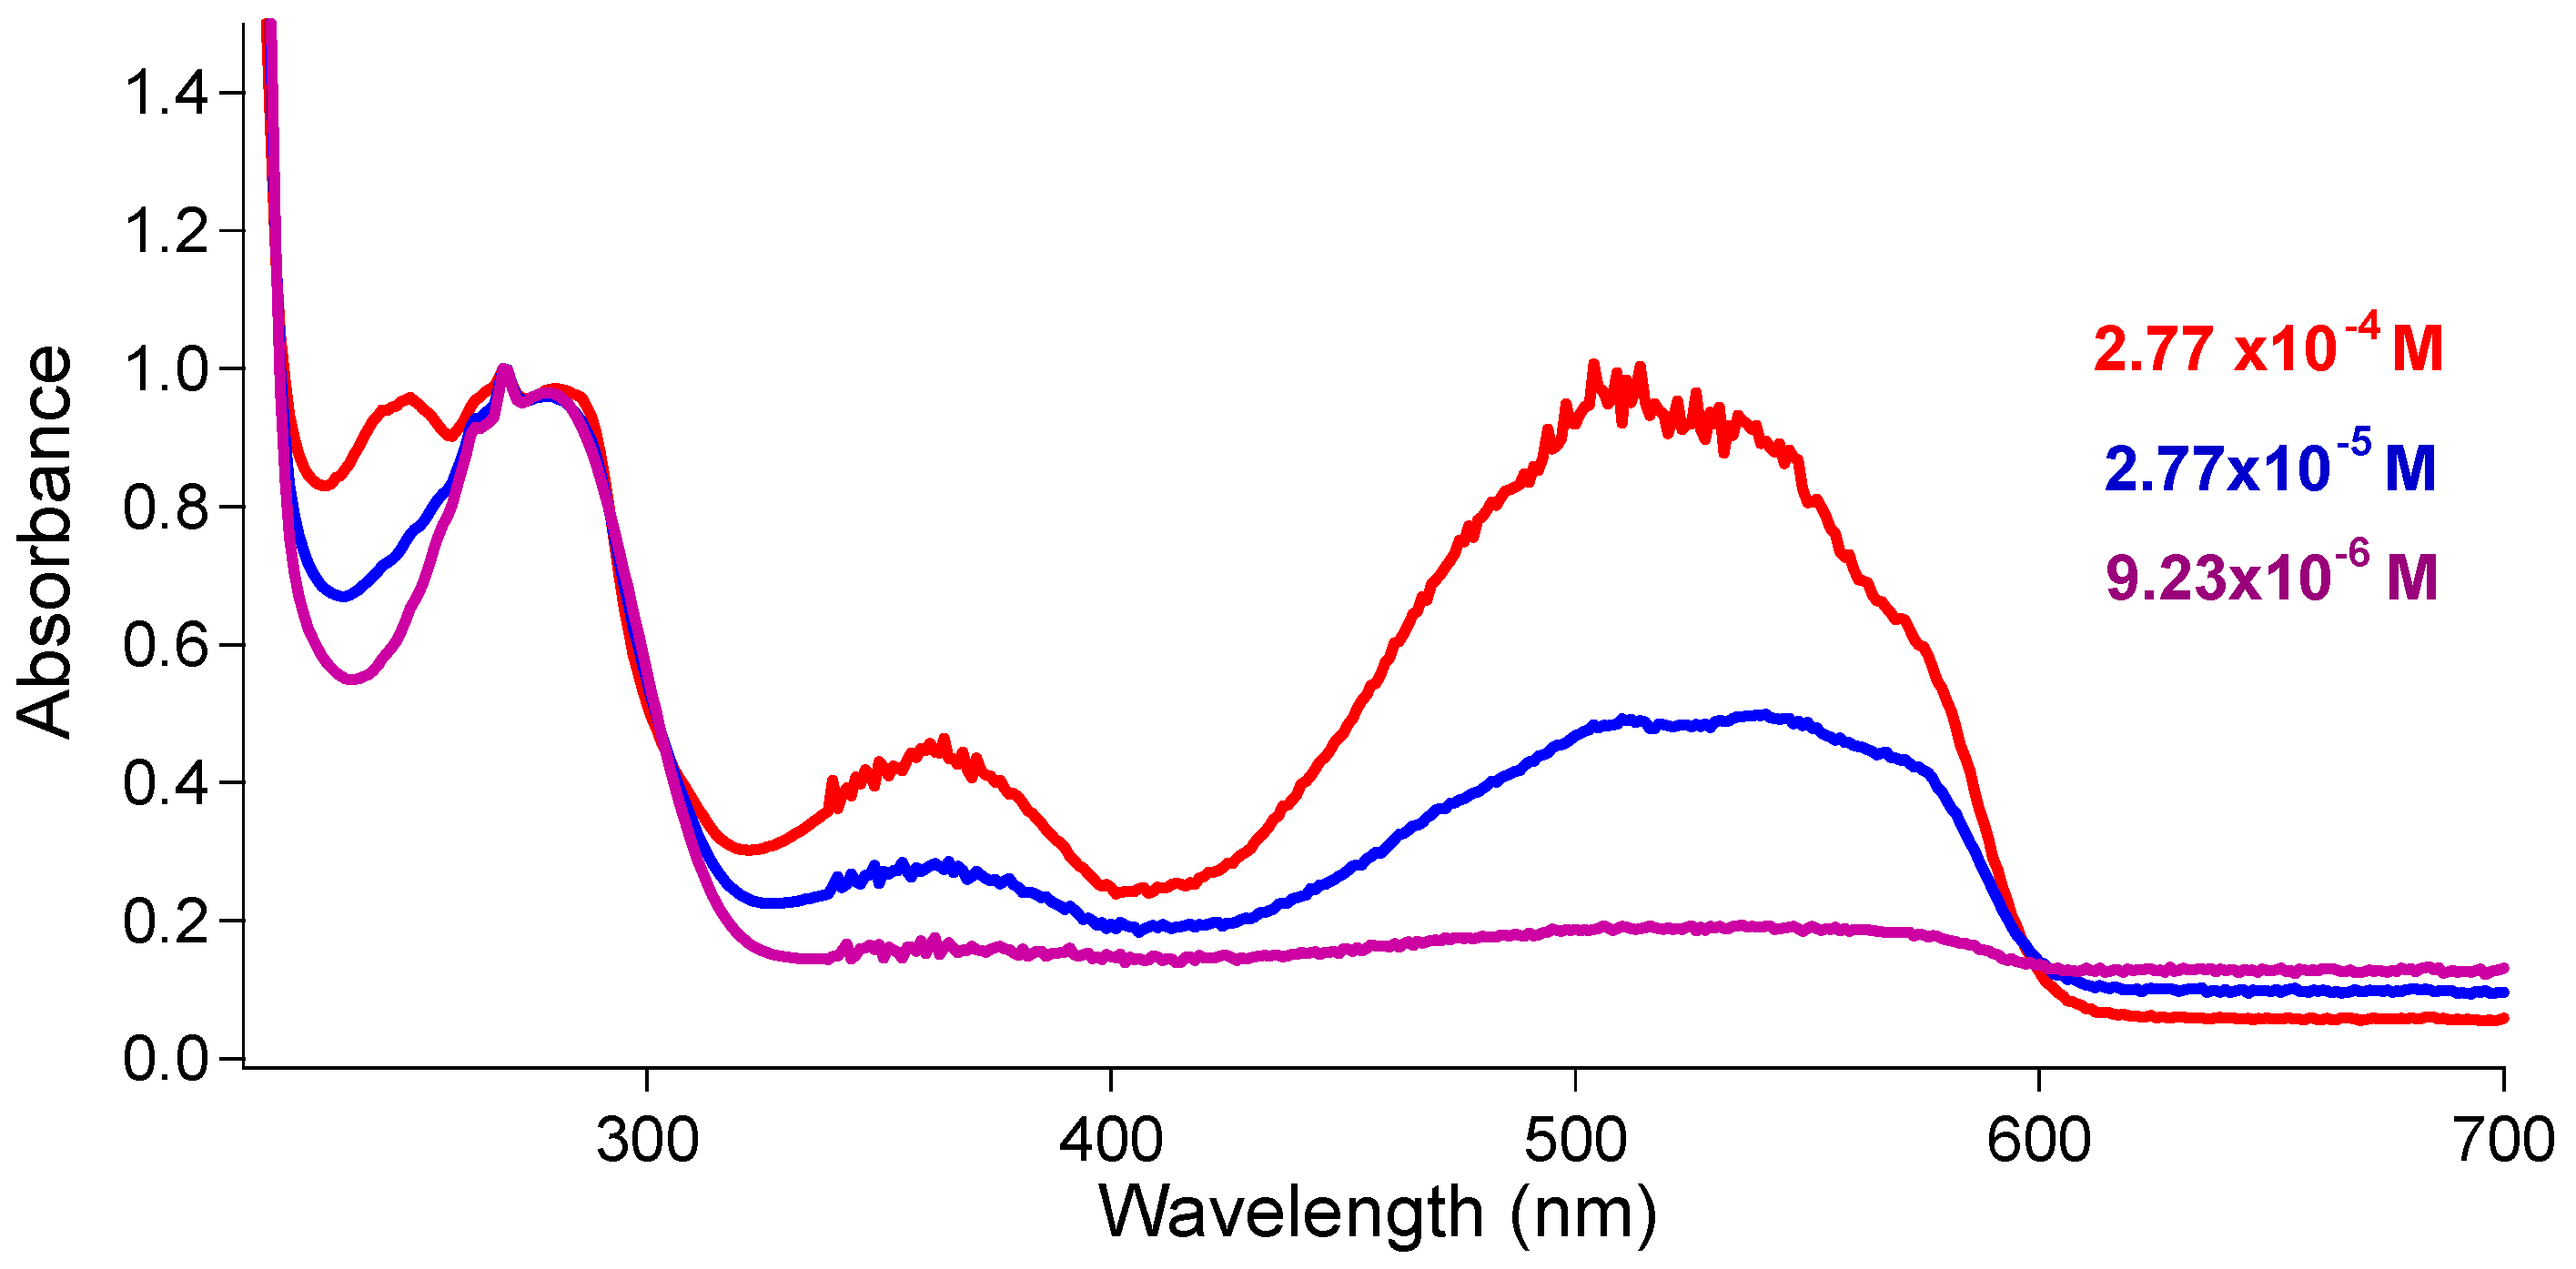
3.2. Effect of HCl on UV–Vis Spectra of 6a6e in Ethanol

The samples in this paper showed lower solubility (~0.1 mM) in water and much higher solubility (over 10 mM) in ethanol. Concentrations above 0.1 mM showed overly saturated UV peaks, whereas concentrations below 0.1 mM showed too much noise for the NMR studies. For all tested concentrations for both the UV–vis and NMR analysis, the quinonoidal base (A), flavylium ion (AH+), hemiketal (B), and chalcones (CZ, CE) were found in different ratios. This suggests that the equilibrium between these species takes place in ethanol, similarly to reports in the literature regarding the reaction in water, as mentioned above. The aqueous solutions of samples (6a6e) around 0.1 mM gave a pH of 6.5–6.7; therefore, it is understandable to have intense peaks over 500 nm, corresponding to the quinonoidal base forms (A). A pH adjustment to 1 using concentrated HCl formed the expected peaks for flavylium ions, as reported in the literature. This shows the samples (6a6e) follow the well-established paradigm of flavylium ions in both water and water-DMSO solutions.
The UV–visible spectra of samples (6a6e) in ethanol are given in graph A of Figure 3, and are similar to the spectrum patterns seen in water. However, it must be noted that the intensity of the graphs for 6a and 6b was reduced to better compare the spectra. Then, the addition of 3% HCl w/w or the injection of dry HCl gas into the solutions forced the formation of corresponding flavylium ions, as shown in the spectra in B of Figure 3. The peaks around 280 nm, especially significant for 6a and 6b, can be attributed to hemiketal (B) and the peaks around 380 nm to chalcones. The compounds with more OH (6c6e) showed significant peaks around 580 nm, attributed to the neutral quinonoid base (A), and around 500 nm for the flavylium ion. Therefore, it is feasible that AH+ and its conjugate base, the neutral quinonoid base form (A) of 6c, 6d, and 6e, are relatively more stable than those of 6a and 6b in ethanol.
Interestingly, when the concentration of 6b (Figure 4) is raised from ~10 μM to ~0.1 mM in ethanol, without the addition of HCl, the peak at 500 nm (AH+) grows more rapidly compared to the hemiketal peak around 280 nm. Furthermore, the increased ratio at 280 nm is 2.3-fold compared to the 12-fold increase at 504 nm for the flavylium ion. When Fernandes et al. observed self-association with NMR, the concentration was around 1 mM for their glycosylated flavylium at pH = 1 in water-DMSO solution. [56] Thus, at the highest concentration of UV (2.77 × 10⁻⁴ M), the flavylium absorption increase clearly appears to be more than just the concentration increase (as expected by Beer’s Law), but not high enough to make the flavylium the dominant species as observed in NMR (10 mM). It is possible that the aggregation favors the flavylium form over other compounds due to their flat structure and polarity.

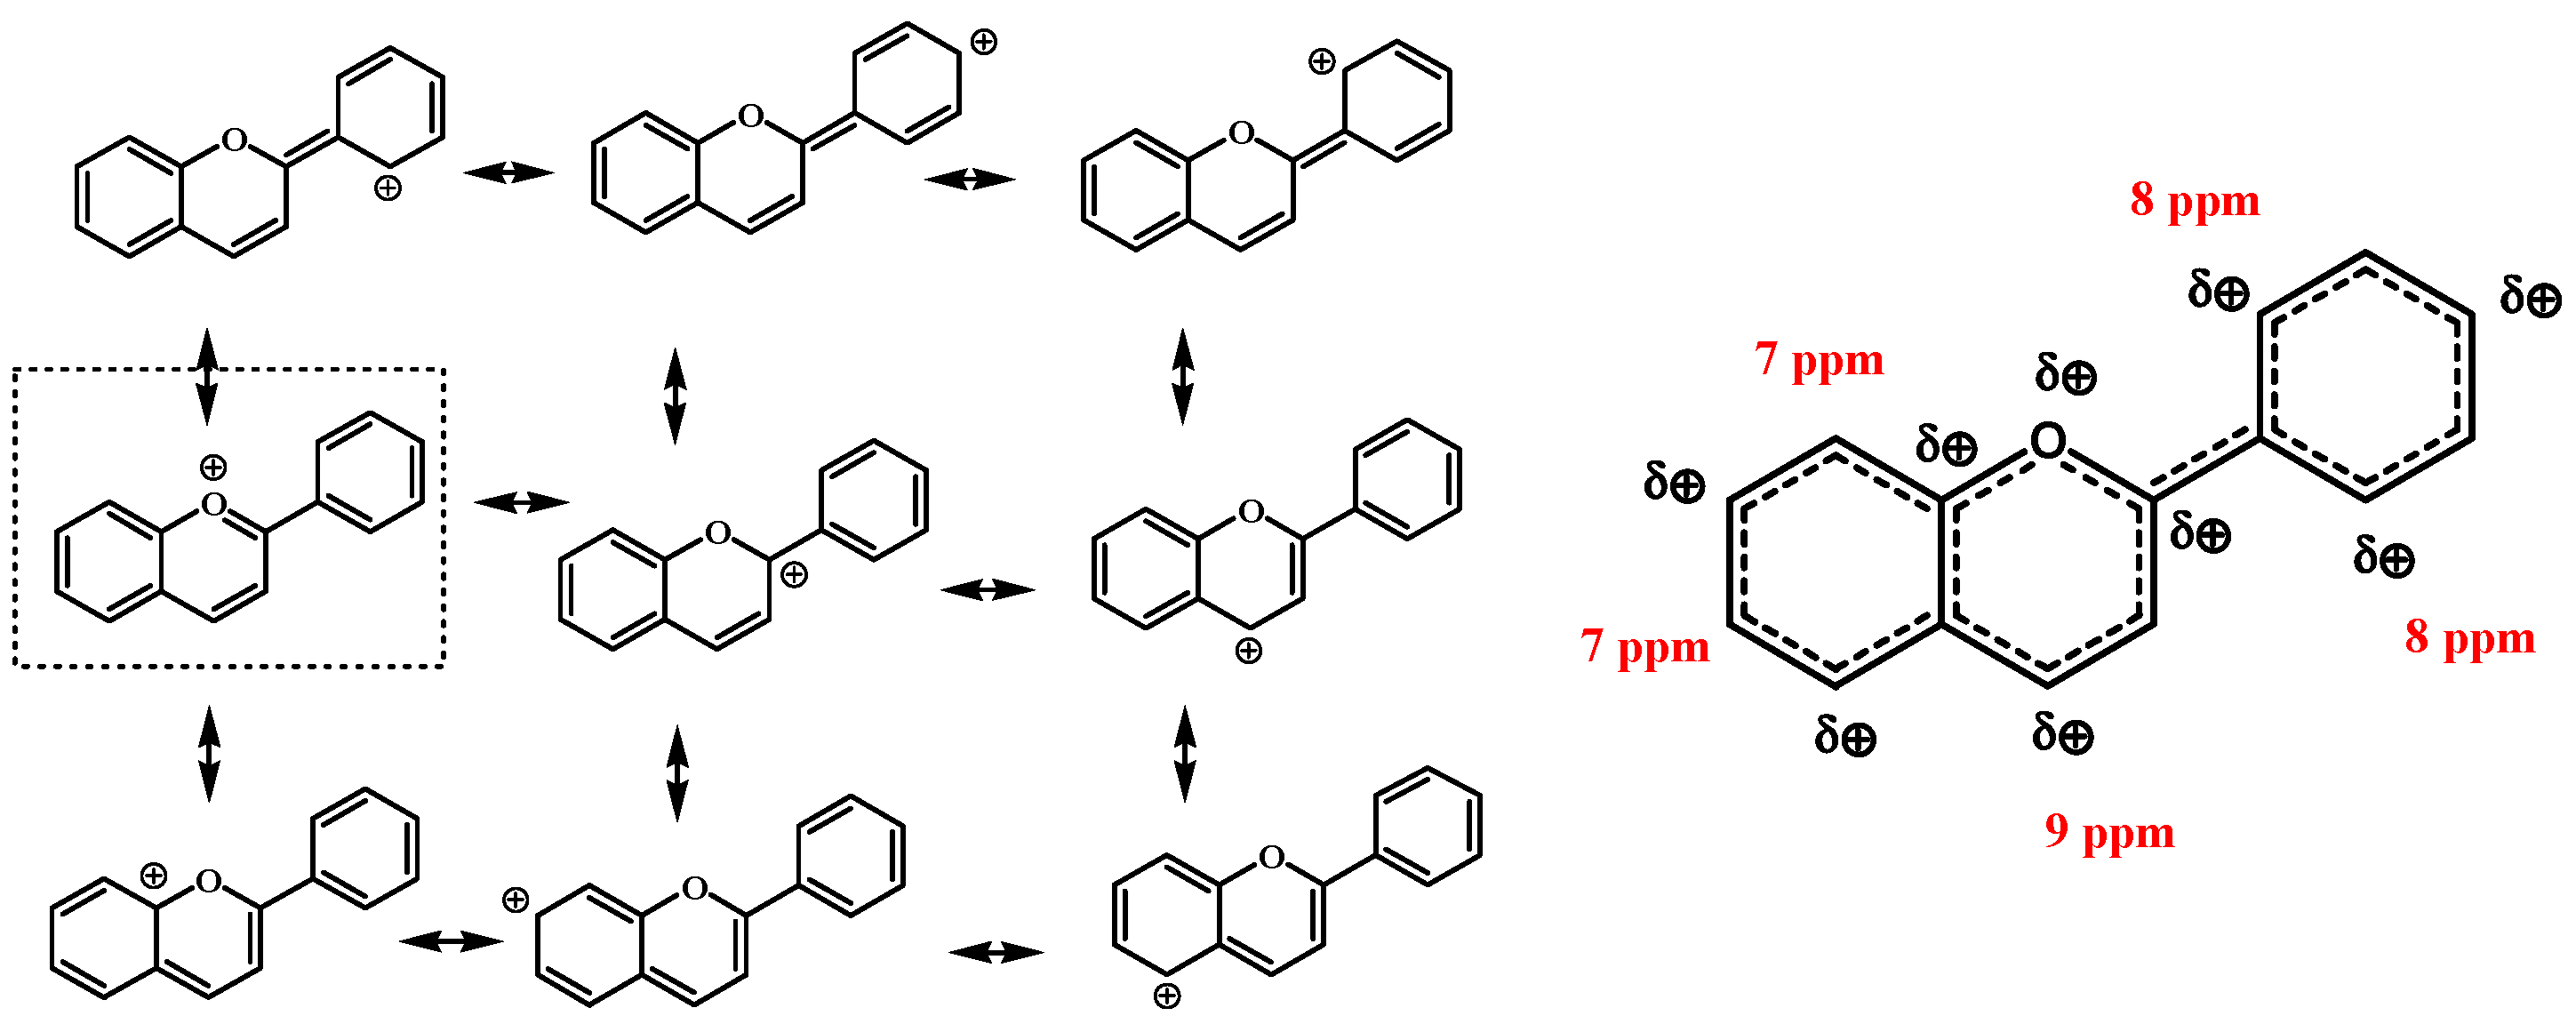
3.3. NMR Chemical Shift and Electron Density

The idea found above (additional formation of flavylium over concentration increments) was further confirmed by the NMR study at a much high concentration. Generally, as shown in Figure 5, the chemical shifts move upfield as more hydroxy groups are placed on the ring due to the shielding from the resonance effect of OH groups. For example, the most deshielded hydrogen on C4 moved gradually from 9.2 ppm (6a) to 8.9 ppm (6e), while the most shielded hydrogen on C5′ moved from 7.1 ppm (6a) to 7.0 ppm (6e). Likewise, the hydrogen on C4 of 6a with no electron-donating OH on the benzopyrylium moiety showed a relatively downfield peak around 9.2, compared to the rest of the ions (6b6e with two or more OH groups substituted with a bezopyrylium ring). Table 1 highlights the data for 6e as an example. The calculated charge of the oxygen on the pyrylium ring in 6e is partially positive, at 0.145, while the hydrogen of OHs is around 0.4, and hydrogens on the ring carbons are around 0.2–0.35. Thus, the hydrogen on C4 is usually the most deshielded on 1H-NMR and the one with the most partial positive charge from the calculation with 6e. However, there were opposite correlations when relating the chemical shift values of 1H-NMR and 13C-NMR and charge distribution. The hydrogen on C3 had a less positive charge than hydrogens on C5 and C6 of the benzopyrylium moiety, which does not correlate with the 1H-NMR chemical shift for the H on C3 (8.2 ppm), compared to 7.6 and 7.4 ppm for hydrogens on C5 and C6. Meanwhile, the resonance structures of the flavylium ion in Figure 6 show that C4, C5, C7, C2′, C4′and C6′ bore higher positive charges, which clarifies a significantly smaller partial positive charge on the oxygen in the C ring; however, it still fails to correlate with the calculated charges. For example, one of the highest positive charges should be on the hydrogen of C6′ from the resonance, but the calculated charge was the least positive, although it supports the highly deshielded signal at 8 ppm. This discrepancy prompted us to look into self-aggregation as the crucial element behind [60,61,62].

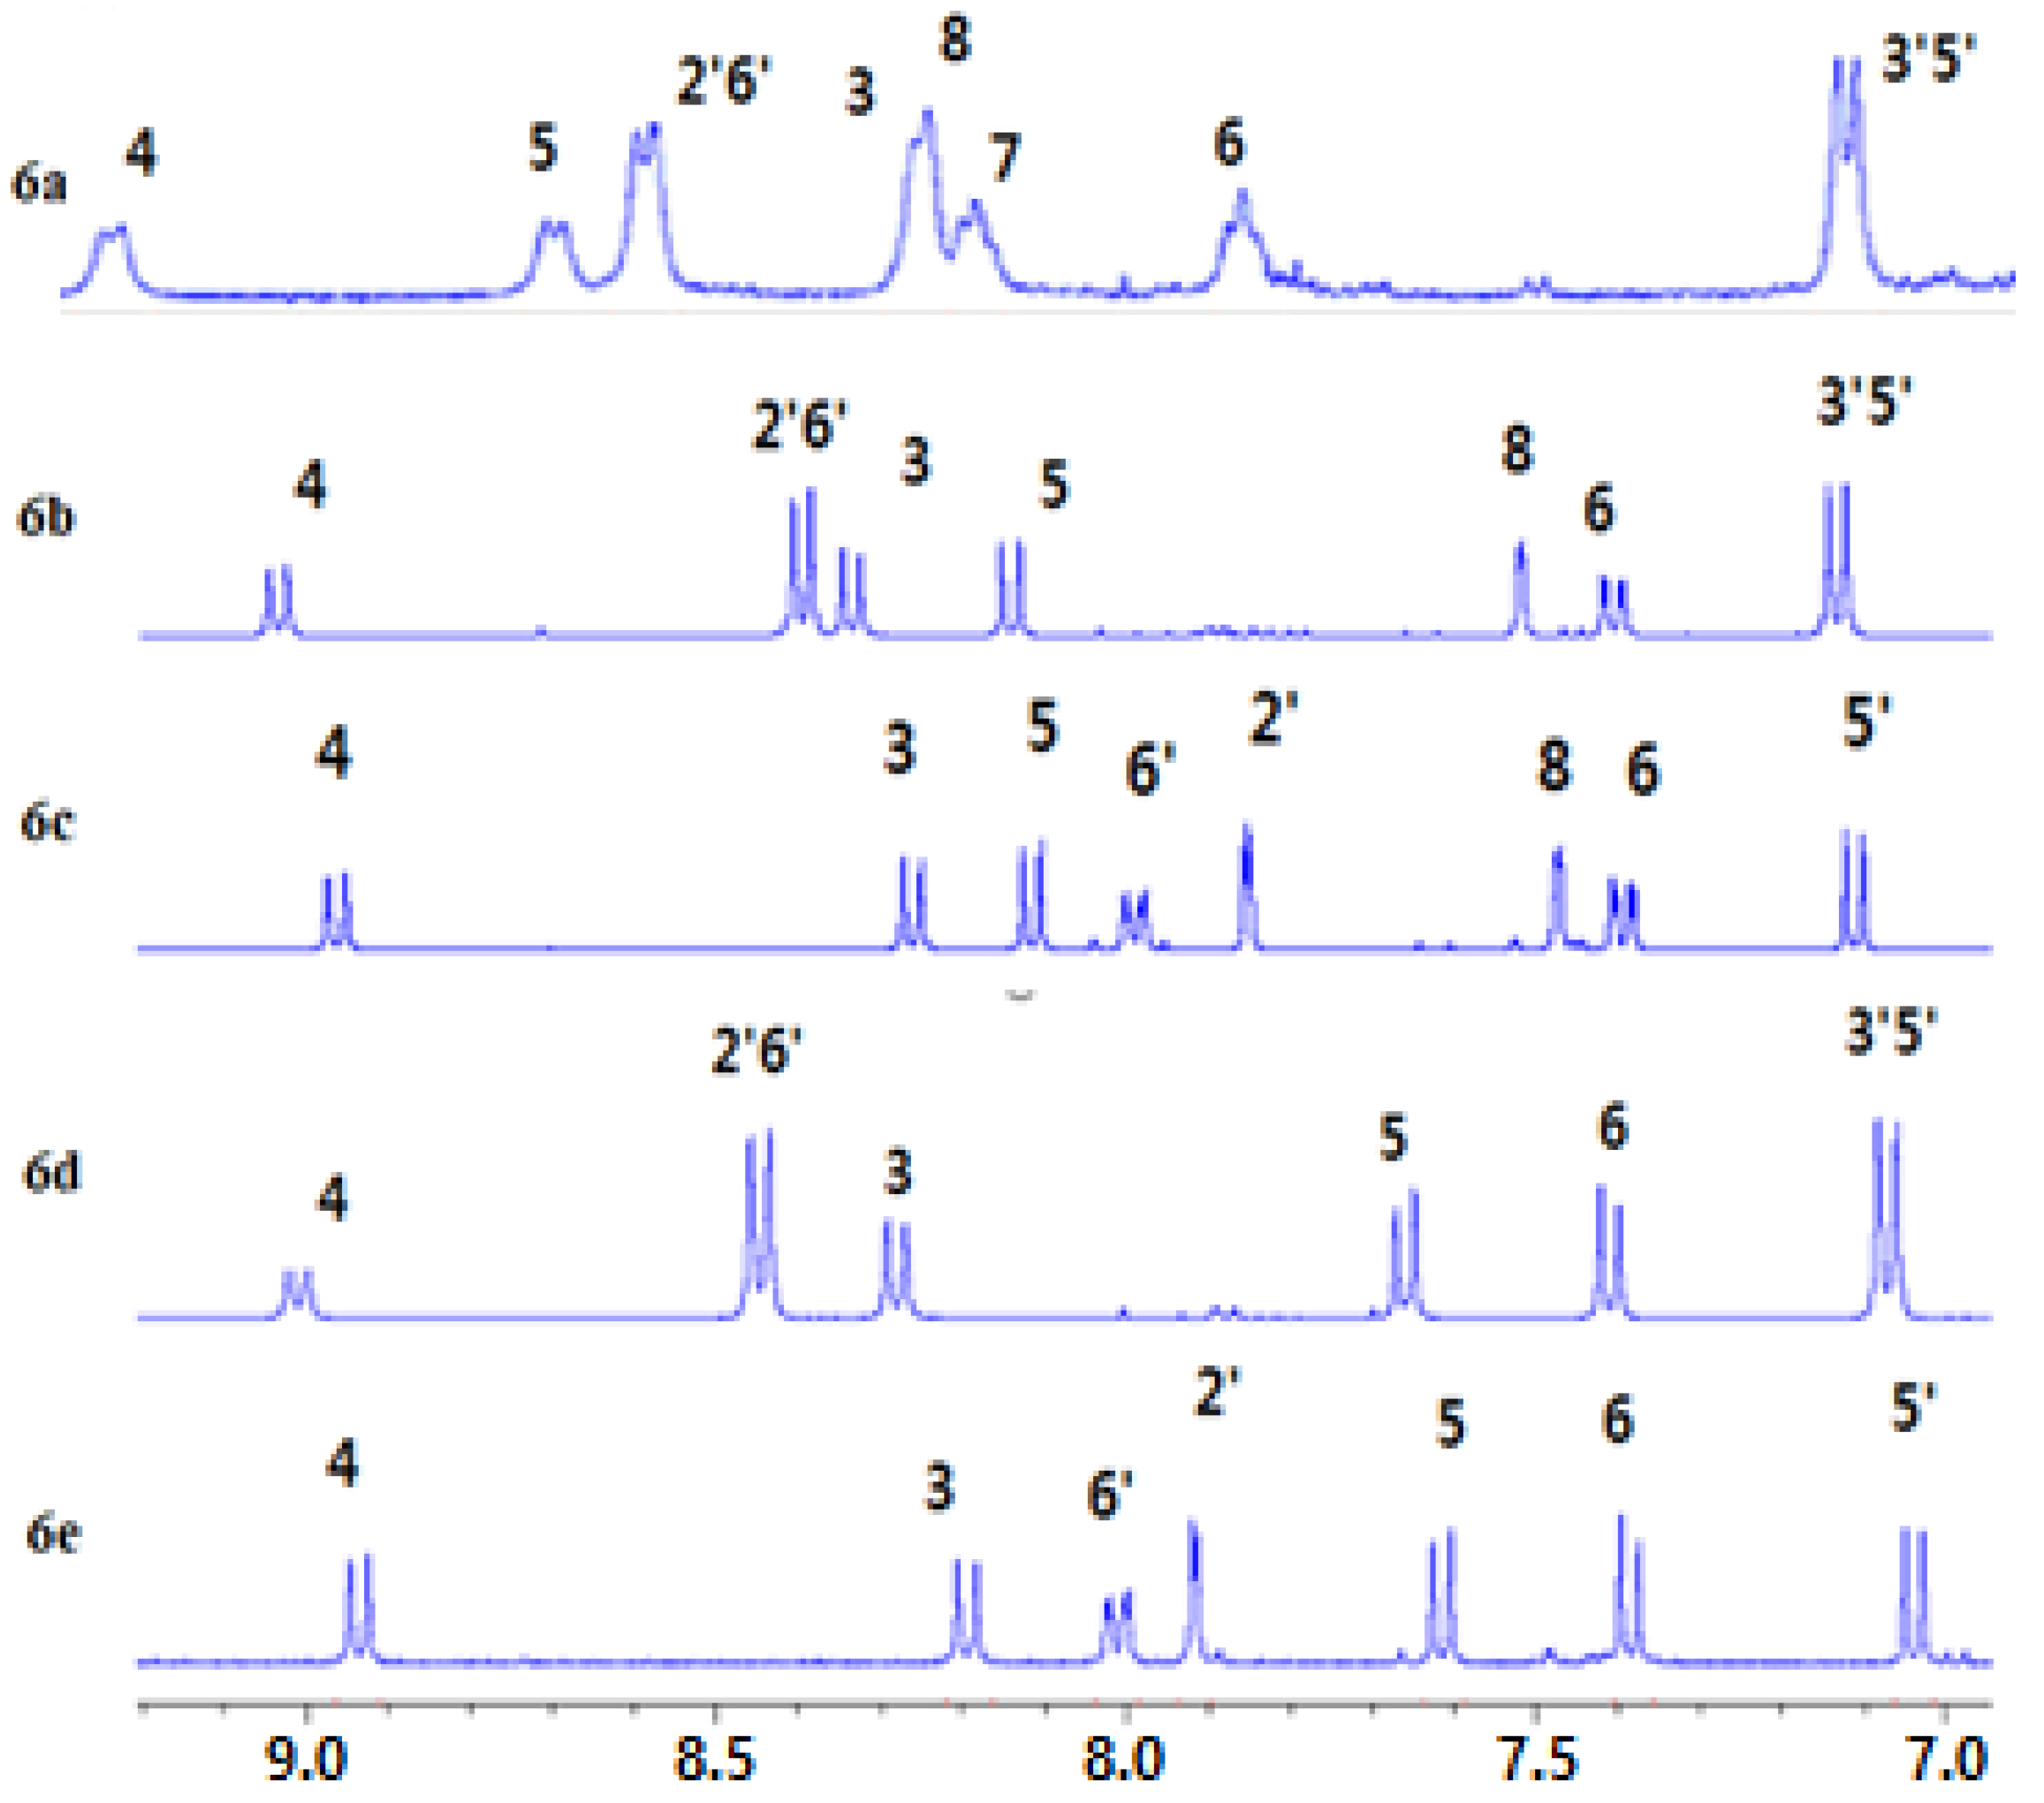
3.4. 1H-NMR Chemical Shift Measuring Concentration Dependency of Ions

The 1H-NMR spectra of samples (6a6d) were each compared at two different concentrations, ~0.1 mM/~1 mM for the low concentration, ~10 mM for the high concentration, in Figure 7. Aside from the assigned peaks for the flavylium ring hydrogens (Figure 5), the remaining unassigned weak signals in the range of 7.6–8 ppm are attributed to the low concentration hemiketal and chalcone isomers for spectra of 6b6d (Figure 5). In general, the peaks appear to be sensitive to an increase in the concentration of flavylium ions in the 1H-NMR spectra (6a6d). Compared to the low concentration spectra, the intensity diminishes for some peaks of hemiketal and its isomers. Additionally, although the changes are minor, comparing the chemical shifts of the same hydrogen at ~1 mM (except ~0.1 mM for 6a) and ~10 mM shows the peaks move more downfield from their locations at higher concentrations. This small detail could be a hint that explains the mode of self-assembly.
Meanwhile, the diminishing peaks of hemiketal and its isomers demonstrate that the ions (6a6d), especially ones with fewer hydroxy groups, are more sensitive to the concentration increase. For example, 6a, with a single OH, exhibited more change than others (6b6e) with more OHs. At higher concentrations, the flavylium was observed to become more stable than the hemiketal and chalcone, showing the significance of the concentration on the stability of the ion. There are claims in the literature that lipophilic interaction could be the cause of self-association, explaining the NMR observations recorded by [55,56]. Therefore, we investigated specific binding modes using Gaussian calculations.

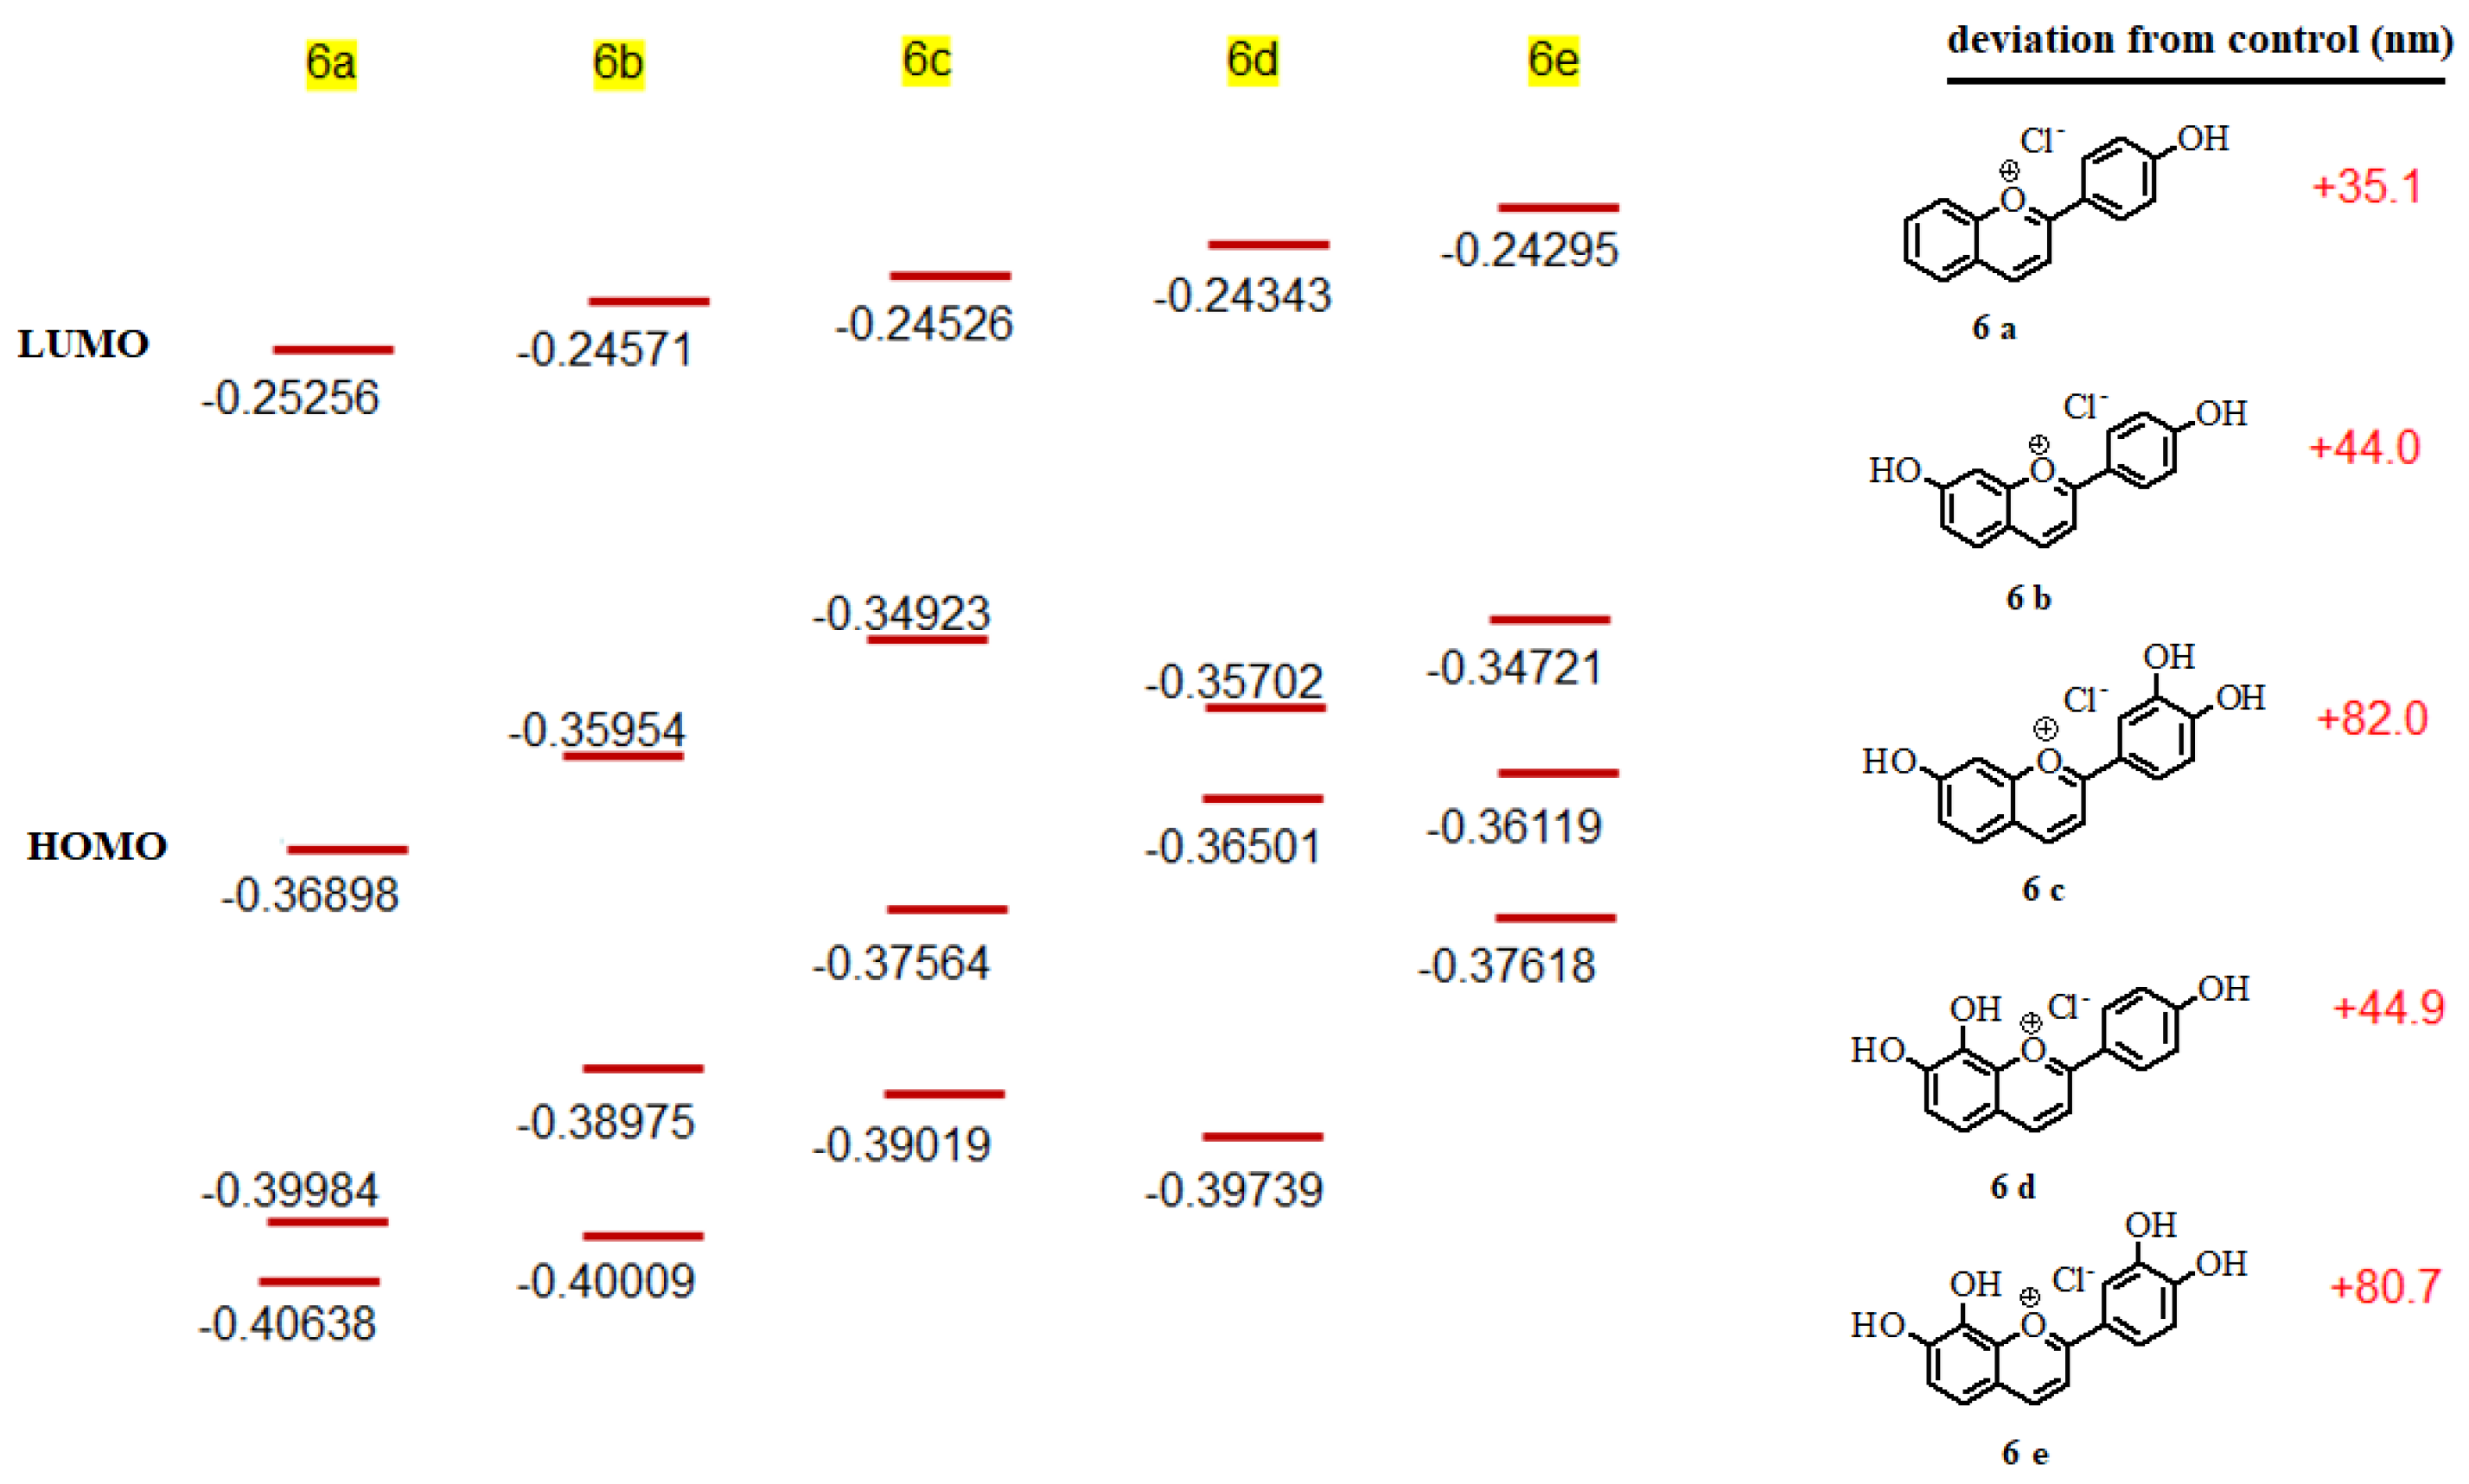
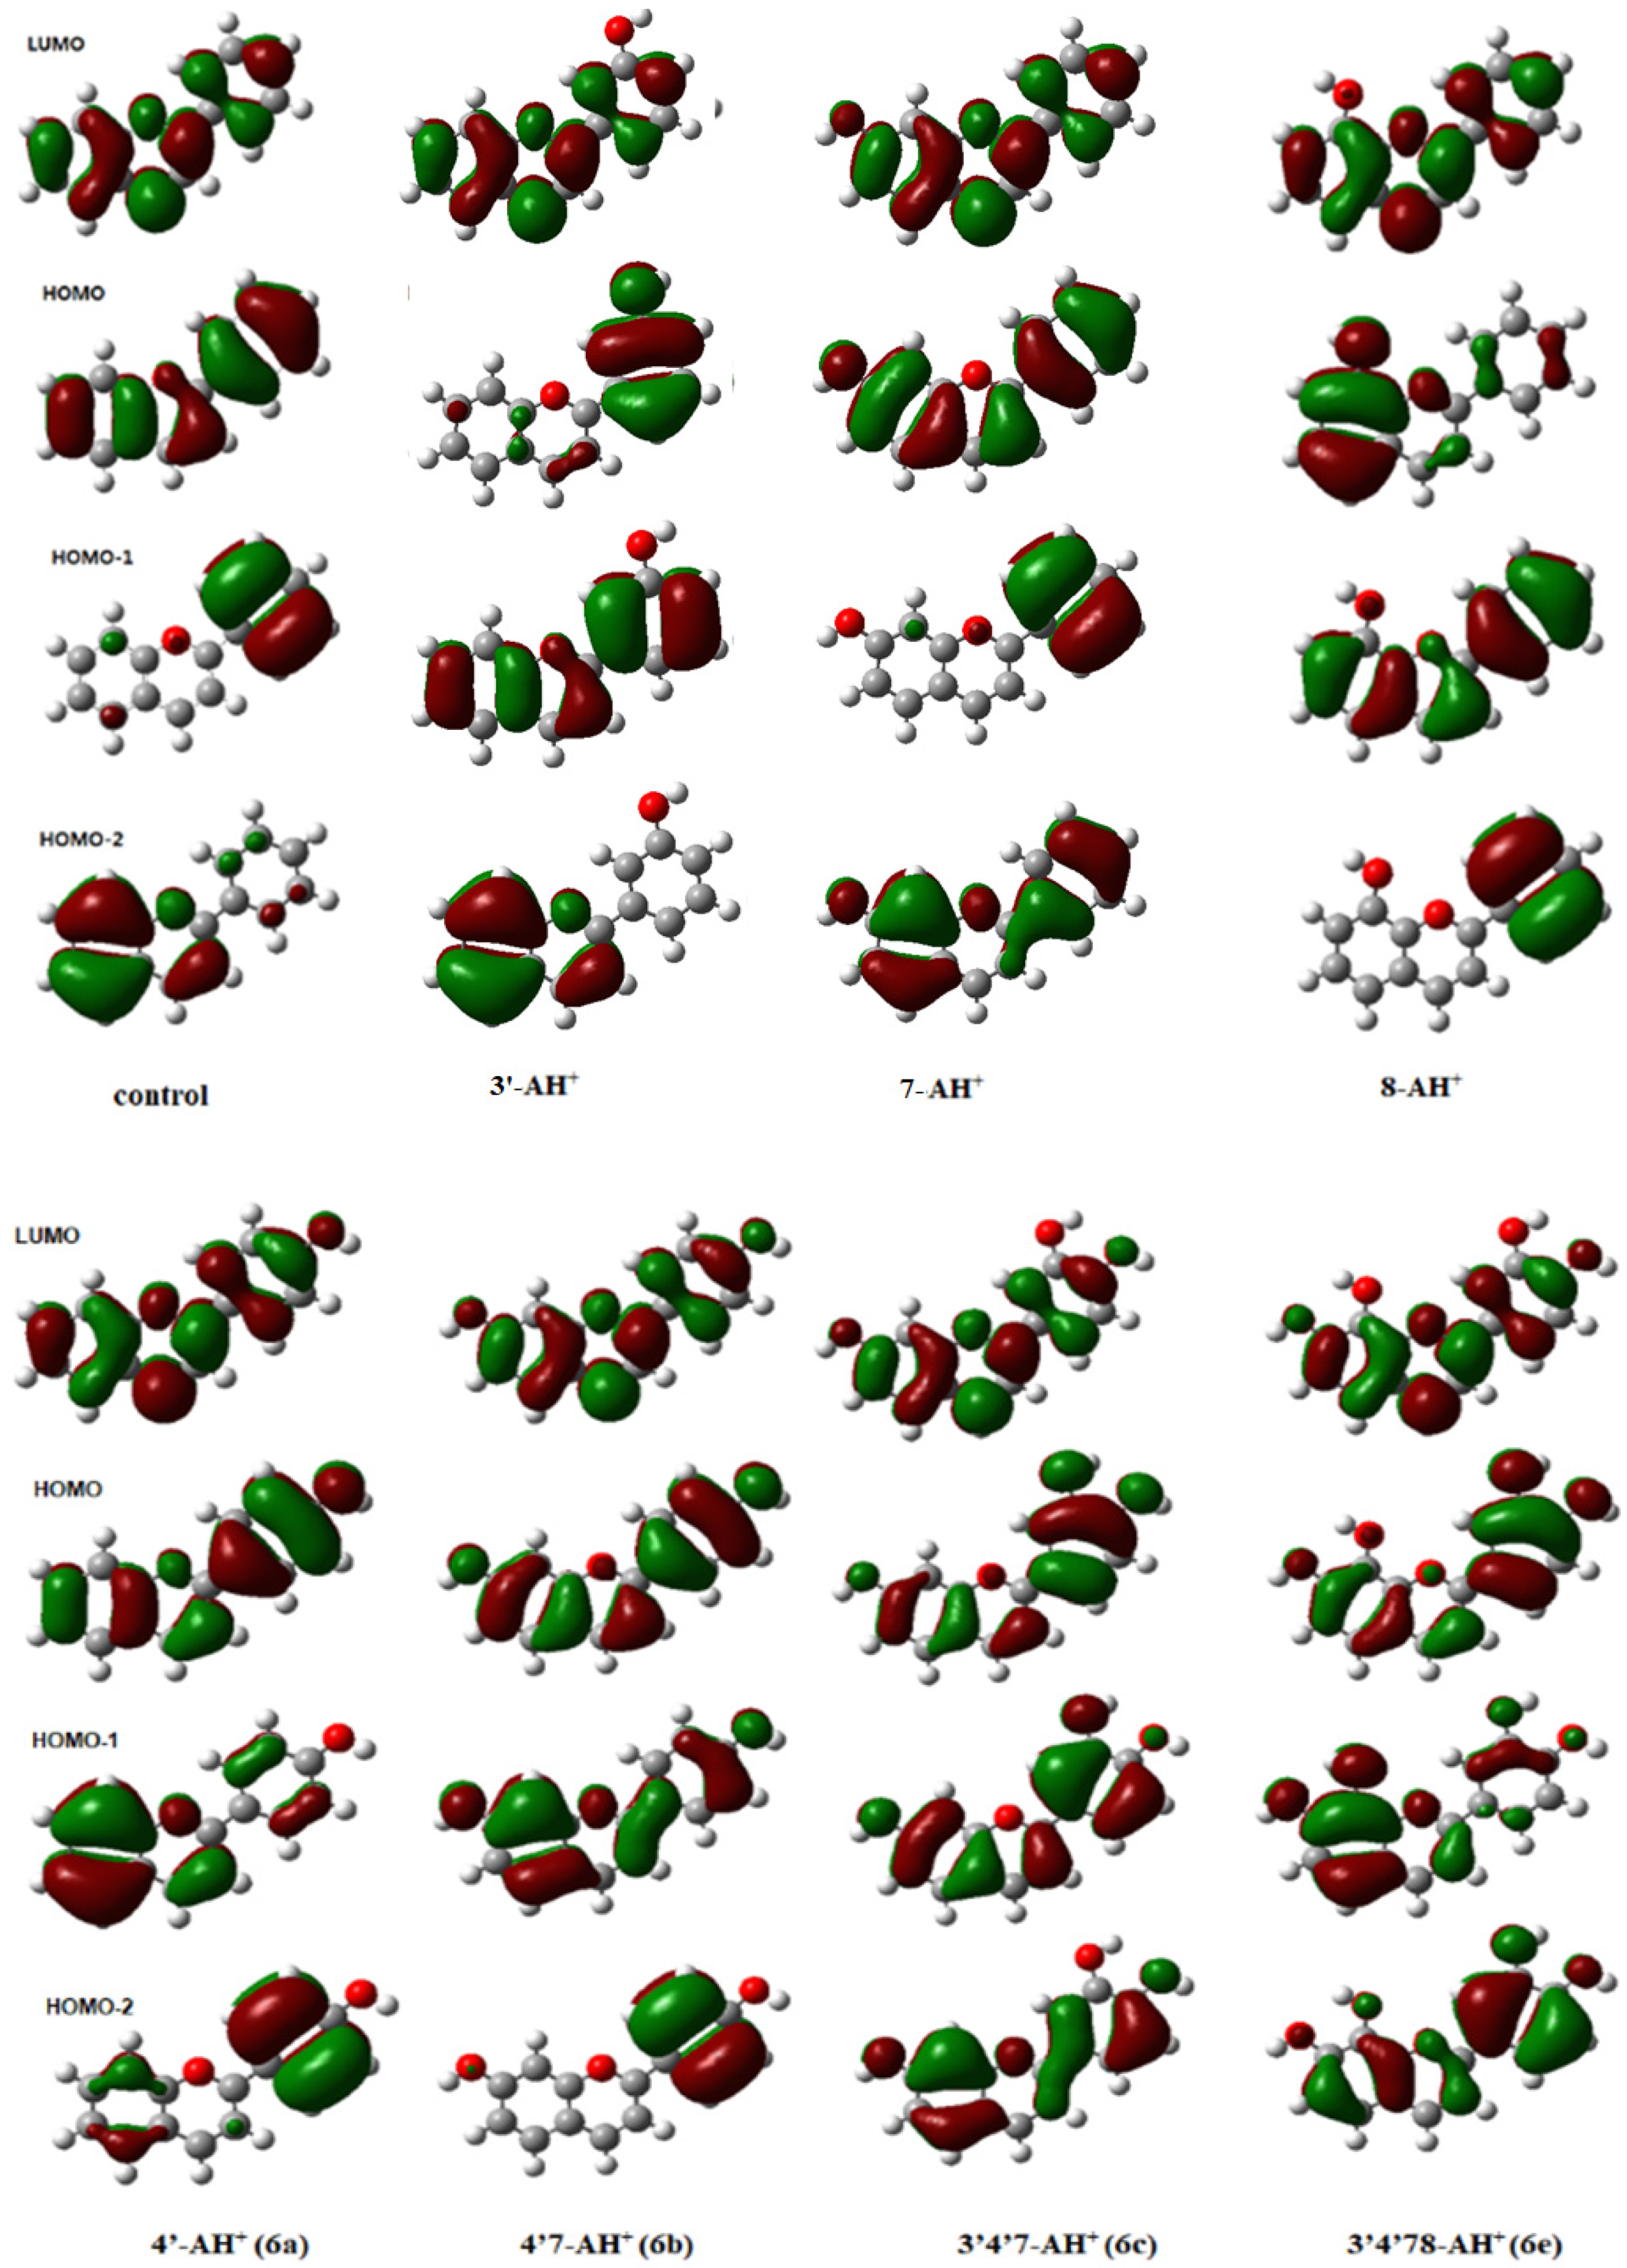
3.5. Correlation of UV Data and Calculation

Since natural flavylium ions have multiple substitutions of hydroxy and alkoxy, evaluating the effect of each OH group on the corresponding transition energy for the UV–visible spectrum and its color is not clearly understood. Therefore, the modeling was done with one OH group in every possible position to evaluate the hydroxy group’s effect on each position of the flavylium ion ring (control, 2′-AH+, 3′-AH+, 4′-AH+, 5′-AH+, 6′-AH+, 3-AH+, 4-AH+, 5-AH+, 6-AH+, 7-AH+, 8-AH+); the full diagram is available in the Supplementary Materials, and selected ones are shown in Figure 8A. The control refers to the flavylium ion without any substitution. The other 11 compounds, each with a different substitution position of OH, were assigned a name based on the carbon number of the substitution and “AH+” as the core flavylium structure. Thus, as per the first example (in Figure 8B), 2′-AH+ refers to the derivative with OH substituted on the 2′ position of the core flavylium ring (denoted as AH+). In addition, 6a6e were used for calculation, and the results are shown below in Figure 8 and Figure 9.
The Gaussian modeling showed that the three rings (A, B, and C) of the flavylium ions for all examined structures were flat. Only 2′-AH+ showed a 24.1° dihedral angle, while the corresponding ortho 6′-AH+ was flat. Moreover, hydrogens of the OHs were found on the plane with dihedral angles of about 0°. Thus, it will only make sense when there is a strong resonance between rings B and C to overcome the rotational strain, considering biphenyl’s rotational barrier is around 8 kJ/mol.
The energy levels in Figure 8 and Figure 9 are shown in Hartree for LUMO, HOMO, HOMO-1, and HOMO-2. The energy level of the LUMO+1 state is not shown because it is located much higher and would take significantly more energy to transition from bonding orbitals. The energy gaps for the transitions have been converted from Hartree to nanometers to facilitate comparison with the UV experimental data. In Table 2, the calculation at the DFT//B3LYPS/6311++G(d) level shows the absorption of the control at 356.2 nm (HOMO → LUMO), which is not in the range of the visible light. Likewise, the absorption wavelengths for the other compounds have been calculated. The deviations from the control values are shown in the chemical structures depicted in Figure 8 and Figure 9. For example, the energy gap of the OH substitution on C4′ (6a) was calculated to be 391.3 nm due to a 35.1 nm redshift from 356.2 nm (the control value for the transition from HOMO to LUMO). Therefore, the modeling calculations from Figure 8 for singly substituted flavyliums lead to two conclusive correlations: (1) the LUMO energy levels increased with a higher number of OH substitutions, and (2) the HOMO energy levels were very dependent on the OH position.
As per the observation above, substitution on 3′ and 5′ causes the narrowest energy gaps between HOMO and LUMO by over 80 nm with the calculated redshift. In the typical Woodward–Fieser additive rule for the UV–visible spectrum of an aromatic ring, over 80 nm is highly unusual for a neutral OH. The substitution on C4 is also interesting, because it shows a blueshift of 28.1 nm, which makes it an excellent electrophilic carbon for the dimerization reaction by nucleophiles. Unfortunately, the calculated energy gaps for our multi-substituted compounds do not correlate conveniently for empirical prediction like the typical Woodward–Fieser additive rule for the UV–visible spectrum. For example, 6c has three substitutions at 3′, 4′, and 7 causing an 82 nm redshift (calculated λmax = 438.2 nm) from the control (λmax = 356.2) (Figure 9). However, the data from Figure 8 reveals that substitution on 3′ alone gives an 80.5 nm redshift; thus, a greater shift is expected with two additional hydroxy groups. The data for the comparison of monomers of 6a6e are shown in Table 2: The calculated values for HOMO → LUMO for 6a6e are 391.3, 400.2, 438.2, 401.1, and 437.0, respectively, and the experimental λmax values are 451.5, 466.5, 497.5, 486.9, and 518.9, respectively.
In Figure 10, the molecular orbitals for LUMOs are similar amongst themselves. In contrast, the HOMO molecular orbitals show more fluctuation in shape for various substitutions, especially for the substitution on 3′ (not shown here, but similar to 5′) and 8-AH+. This is because the substitution on 3′ makes ring B dominate the HOMO orbital, and the substitution on 8 makes ring A dominate the HOMO orbital. Thus, the molecular orbital of HOMOs with substitution on 3′ (6c and 6e) has more contribution from the ring B, as shown at the bottom of Figure 10. This indicates that the 3′ substitution’s influence is more significant than that of 8. Meanwhile, the energy levels for HOMO-1 and HOMO-2 change the order substantially, depending on the substitution pattern.

3.6. Self-Aggregation

As hinted above by our experimental data and the plethora of evidence found in the literature, it is clear that some hypothetical driving forces for the aggregation of flavylium ions could be lipophilic interaction, π-stacking, or H-bonding. Despite these claims, at the low concentration, our NMR data indicated that the most lipophilic flavylium of the group, 6a, did not undergo self-assembly, whereas the more polar ions (6d and 6e) did. Furthermore, it should be noted that 6a and 6b had lower water solubility than 6d and 6e due to the number of OH groups on the AH+ structure. Thus, the more lipophilic characteristics of 6a and 6b do not agree with the hypothesis that lipophilic interaction is the main driving force for self-aggregation. Therefore, we investigated specific binding modes using Gaussian modeling.
Unlike a large portion of reports that use polar natural glycosylated anthocyanin, we utilized the artificial anthocyanidin’s core flavylium ion to discern the chemical properties that drive self-association without other polar moieties. The first attempts to use Gaussian software to achieve a strong enough π-stacking interaction between two control flavylium ions (without any hydroxy moieties) failed. Also, parallel π-stacking of our compounds, 6a6e, did not achieve stable states, which leads us to believe π-stacking is not the driving force. For the Gaussian modeling, the units of flavylium ions were put together in the single point calculations, which caused the energies to rise against this interaction mode at various distances; when the energy was minimized from the usual π-stacking distance, the rings were pulled away. Therefore, it can be asserted that H-bonds in π-stacking mode are also not the cause of successful self-aggregation. The most stable self-aggregation was formed when the counterion Cl was included in the complex of self-aggregation, as shown in Figure 11. While investigating the area where the chloride ion was most stable, it was found that it is surprisingly not very stable near the pyrylium’s positive oxygen or above the C ring where the oxonium and some carbons are positively charged. Instead, Cl had a stronger preference for H-bonding with OH; indicated that the hydroxy hydrogens prefer this bond over the bond with other hydroxy groups.
The dimers that showed a successful complex with chloride are shown in Figure 11. The dimer complex structures include two chlorides within hydrogen-bondings near the OH groups at 3′ and 4′ sides and 7 and 8 sides. Two flavylium ions units in the dimer complex had roughly a 120-degree angle in the energy-minimized structure, as shown in Figure 11. Moreover, as shown in Table 2, the hydrogen-bonded dimer model, except 6a, presented much better UV–visible spectrum data predictions than values from the monomers (6b6e). The corresponding molecular orbitals for dimers of 6b and 6c are shown in Figure 12. For example, compound 6b had absorption at 466.5 nm, and the monomer prediction by the modeling gives 400.2 nm for S1 transition (HOMO-LUMO), while the calculation (DFT//B3LYP/6311**G(d)) with the dimer model for S1 transition is 456.7 nm. Therefore, as our experimental data suggest above, the calculation results support the theory that the dimer of flavylium ions at high concentrations is more stable. This is because the dimerization lowers the energy of the AH+, which supports our working hypothesis regarding the equilibrium dynamics of the flavylium ion with the hemiketal and chalcone. Figure 13 summarizes the equilibrium, including our working hypothesis of the aggregation. At high pH levels, hemiketal and chalcones are more stable than flavylium ions; however, flavylium ions become more stable than other compounds at low pH levels, as reported in the literature. Additionally, our research shows that without pH adjustment, flavylium ions can become stabilized by association to shift the equilibrium in their favor at high concentrations.
In conclusion, it can be asserted that the increased stability of AH+ due to pH and other factors forces the equilibrium to move backward toward AH+ from other equilibrium compounds. The pH of samples in NMR and UV–visible experiments for this research were not adjusted to acidic to form assembly. Thus, our findings from the previous sections confirming the dimer-mode calculation can support the existence of this phenomenon even in ethanol. As addressed earlier, along with A and AH+, other compounds are in equilibrium in ethanol, with different distributions of each depending on the number and location of OH groups. As a result, the NMR and UV–visible spectral data showed that an increase in AH+ concentration was detected at an elevated concentration without altering other conditions. Thus, an equilibrium shift to AH+ may have caused the detected increase of AH+ concentration, due to its increased stability through dimer formation with hydrogen bonding among OH groups and chloride. Although there are still unanswered questions raised in the paper, this assembly model appears to predict the majority of experimental λmax at improved accuracy (Table 2).

Supplementary Materials

The following are available online at https://www.mdpi.com/article/10.3390/colorants1010004/s1, Figure S1: Mass spectrum of 6a, Figure S2: Mass spectrum of 6b, Figure S3: Mass spectrum of 6c, Figure S4: Mass spectrum of 6d, Figure S5: Mass spectrum of 6e, Figure S6: Energy levels (on the left, in Hartree) and energy gaps (in-set on the left, in nanometers for transitions from HOMO to LUMO) for the flavylium ions with one OH group, Figure S7: 13C-NMR spectrum of 6b in ethanol-d6, Figure S8: 13C-NMR spectrum of 6c in ethanol-d6, Figure S9: 13C-NMR spectrum of 6d in ethanol-d6, Figure S10: 13C-NMR spectrum of 6e in ethanol-d6, Figure S11. UV-vis spectra of 6a (normalized) in different concentrations in ethanol without HCl addition.

Author Contributions

A.P. carried out the synthesis and UV–visible spectra measurements of all compounds. J.I.L. performed Gaussian calculations and contributed to writing the manuscript. J.K. guided A.P. and performed NMR and concentration studies with NMR, and also contributed to writing the manuscript. All authors have read and agreed to the published version of the manuscript.

Funding

This research received no external funding. Instead, it was funded by Faculty Development Small Grants and the Chemistry Department at St. Joseph’s College.

Institutional Review Board Statement

Not applicable.

Informed Consent Statement

Not applicable.

Data Availability Statement

The data presented in this study are contained within the article and are available in the Supplementary Materials.

Acknowledgments

The authors thank Barney Yoo at Hunter College-CUNY for providing a high-resolution (Agilent 6520 Q-TOF) mass spectrometric analysis, and Gopal Subramaniam at Queens College-CUNY for assisting with the NMR measurements. The authors also thank Yarim Lee for proofreading this manuscript and the Department of Chemistry at York College for the facilities. We would also like to thank the Department of Chemistry and Biochemistry at Queens College-CUNY for allowing us to utilize the NMR facilities that made the research possible.

Conflicts of Interest

The authors declare no conflict of interest.

References

  1. Bridle, P.; Timberlake, C.F. Anthocyanins as natural food colours—Selected aspects. Food Chem. 1997, 58, 103–109. [Google Scholar] [CrossRef]
  2. Brouillard, R.; Figueiredo, P.; Elhabiri, M.; Dangles, O. Molecular Interactions of Phenolic Compounds in Relation to the Colour of Fruit and Vegetables. In Phytochemistry of Fruit and Vegetables; Tomas-Barberan, F.A., Robins, R.J., Eds.; Clarendon Press: Oxford, UK, 1997; Chapter 3; pp. 29–49. [Google Scholar]
  3. Veitch, N.C.; Grayer, R.J. Flavonoids and their glycosides, including anthocyanins. Nat. Prod. Rep. 2008, 25, 555–611. [Google Scholar] [CrossRef] [PubMed]
  4. Andersen, O.M.; Jordheim, M. Flavenoids, Chemistry, Biochemistry and Applications; Andersen, O.M., Markham, K.R., Eds.; CRC Press: Boca Raton, FL, USA, 2006; pp. 471–551. [Google Scholar]
  5. Hale, K.L.; Tufan, H.A.; Pickering, I.J.; George, G.N.; Terry, N.; Pilon, M.; Pilon-Smits, E.A.H. Anthocyanins facilitate tungsten accumulation in Brassica. Physiol. Plant 2002, 116, 351–358. [Google Scholar] [CrossRef] [Green Version]
  6. Takeda, K.; Osakabe, A.; Saito, S.; Furuyama, D.; Tomita, A.; Kojima, Y.; Yamadera, M.; Sakuta, M. Components of protocyanin, a blue pigment from the blue flowers of Centaurea cyanus. Phytochemistry 2005, 66, 1607–1613. [Google Scholar] [CrossRef] [PubMed]
  7. Yoshida, K.; Kitahara, S.D.; Ito, D.; Kondo, T. Ferric ions involved in the flower color development of the Himalayan blue poppy, Meconopsis grandis. Phytochemistry 2006, 67, 992. [Google Scholar] [CrossRef]
  8. Takeda, K. Blue metal complex pigments involved in blue flower color. Proc. Jpn. Acad. Ser. B Phys. Biol Sci 2006, 82, 142–154. [Google Scholar] [CrossRef] [Green Version]
  9. Onslow, M.W. The Anthocyanin Pigments of Plants; Cambridge University Press: Cambridge, MA, USA, 1916. [Google Scholar]
  10. Gould, K.S.; Lee, D.W. Anthocyanins in leaves and other vegetative organs: An introduction. Adv. Bot. Res. 2002, 37, 1–16. [Google Scholar] [CrossRef]
  11. Steyn, W.J.; Wand, S.J.E.; Holcroft, D.M.; Jacobs, G. Anthocyanins in Vegetative Tissues: A Proposed Unified Function in Photoprotection. New Phytol. 2002, 155, 349–361. [Google Scholar] [CrossRef]
  12. Gould, K.S. Nature’s Swiss Army Knife: The Diverse Protective Roles of Anthocyanins in Leaves. J. Biomed. Biotechnol. 2004, 5, 314–320. [Google Scholar] [CrossRef] [PubMed] [Green Version]
  13. Lima, A.A.; Sussuchi, E.M.; Giovani, W.F. Electrochemical and Antioxidant Properties of Anthocyanins and Anthocyanidins. Croat. Chem. Acta 2007, 80, 29–34. [Google Scholar]
  14. Gould, K.S.; McKelvie, J.; Markham, K.R. Do anthocyanins function as antioxidants in leaves? Imaging of H2O2 in red and green leaves after mechanical injury. Plant Cell Environ. 2002, 25, 1261–1269. [Google Scholar] [CrossRef]
  15. Hoch, W.A.; Singsaas, E.L.; McCown, B.H. Resorption protection. Anthocyanins facilitate nutrient recovery in autumn by shielding leaves from potentially damaging light levels. Plant Physiol. 2003, 133, 1296–1305. [Google Scholar] [CrossRef] [PubMed] [Green Version]
  16. Keskitalo, J.; Bergquist, G.; Gardeström, P.; Jansson, S. A Cellular Timetable of Autumn Senescence. Plant Physiol. 2005, 139, 1635–1648. [Google Scholar] [CrossRef] [Green Version]
  17. Feild, T.S.; Lee, D.W.; Holbrook, N.M. Why Leaves Turn Red in Autumn. The Role of Anthocyanins in Senescing Leaves of Red-Osier Dogwood. Plant Physiol. 2001, 127, 566–574. [Google Scholar] [CrossRef]
  18. Close, D.C.; Beadle, C.L. The ecophysiology of foliar anthocyanin. Bot. Rev. 2003, 69, 149–161. [Google Scholar] [CrossRef]
  19. Rechner, A.R.; Kroner, C. Anthocyanins and colonic metabolites of dietary polyphenols inhibit platelet function. Thromb Res. 2005, 116, 327–334. [Google Scholar] [CrossRef] [PubMed]
  20. Bell, D.R.; Gochenaur, K. Direct vasoactive and vasoprotective properties of anthocyanin-rich extracts. J. Appl. Physiol. 2006, 100, 1164–1170. [Google Scholar] [CrossRef] [PubMed] [Green Version]
  21. Toufektsian, M.C.; De Lorgeril, M.; Nagy, N.; Salen, P.; Donati, M.B.; Giordano, L.; Mock, H.-P.; Peterek, S.; Matros, A.; Petroni, K.; et al. Chronic dietary intake of plant-derived anthocyanins protects the rat heart against ischemia-reperfusion injury. J. Nutr. 2008, 138, 747–752. [Google Scholar] [CrossRef] [Green Version]
  22. Bontempo, P.; de Masi, L.; Carafa, V.; Rigano, D.; Scisciola, L.; Iside, C.; Grassi, R.; Molinari, A.M.; Aversano, R.; Nebbioso, A.; et al. Anticancer activities of anthocyanin extract from genotyped Solanum tuberosum L. “Vitelotte”. J. Funct. Foods 2015, 19, 584–593. [Google Scholar] [CrossRef] [Green Version]
  23. Faria, A.; Pestana, D.; Teixeira, D.; de Freitas, V.; Mateus, N.; Calhau, C. Blueberry anthocyanins and pyruvic acid adducts: Anticancer properties in breast cancer cell lines. Phytother Res. 2010, 24, 1862–1869. [Google Scholar] [CrossRef] [Green Version]
  24. Côté, J.; Caillet, S.; Doyon, G.; Dussault, D.; Sylvain, J.-F.; Lacroix, M. Antimicrobial effect of cranberry juice and extracts. Food Cont. 2011, 22, 1413–1418. [Google Scholar] [CrossRef]
  25. Puupponen-Pimiä, R.; Nohynek, L.; Meier, C.; Kahkonen, M.; Heinonen, M.; Hopia, A.; Oksman-Caldentey, K.-M. Antimicrobial properties of phenolic compounds from berries. J. Appl. Microbiol. 2001, 90, 494–507. [Google Scholar] [CrossRef]
  26. Bors, W.; Heller, W.; Michel, C.; Saran, M. Flavonoids as antioxidants: Determination of radical-scavenging efficiencies. Methods Enzymol. 1990, 186, 343–355. [Google Scholar] [PubMed]
  27. Wang, H.; Cao, G.; Prior, R.L. Oxygen radical absorbing capacity of anthocyanins. J. Agric. Food Chem. 1997, 45, 304–309. [Google Scholar] [CrossRef]
  28. Hardin, B.E.; Hoke, E.T.; Amstrong, P.B.; Yum, J.H.; Comte, P.; Torres, T.; Frechet, J.M.J.; Nazeeruddin, M.K.; Gratzel, M.; McGehee, M.D. Increased light harvesting in dye-sensitized solar cells with energy relay dyes. Nat. Photonics 2009, 3, 406–411. [Google Scholar] [CrossRef]
  29. Calogero, G.; Yum, H.J.; Sinopoli, A.; Di Marco, G.; Gratzel, M.; Nazeeruddin, M.K. Anthocyanins and betalains as light-harvesting pigments for dye-sensitized solar cells. Sol. Energy 2012, 86, 1563. [Google Scholar] [CrossRef]
  30. Dangles, O.; Fenger, J.A. The Chemical Reactivity of Anthocyanins and Its Consequences in Food Science and Nutrition. Molecules 2018, 23, 1970. [Google Scholar] [CrossRef] [PubMed] [Green Version]
  31. Mora-Soumille, N.; Al Bittar, S.; Rosa, M.; Dangles, O. Analogs of anthocyanins with a 3′,4′-dihydroxy substitution: Synthesis and investigation of their acid–base, hydration, metal binding and hydrogen-donating properties in aqueous solution. Dyes Pigm. 2013, 96, 7–15. [Google Scholar] [CrossRef]
  32. Roque, A.; Lodeiro, C.; Pina, F.; Maestri, M.; Dumas, S.; Passaniti, P.; Balzani, V. Multistate/Multifunctional Systems. A Thermodaynamic, Kinetc, and Photochemical Inverstigation of the 4’-Dimethylaminoflavylium Compound. J. Am. Chem. Soc. 2003, 125, 987–994. [Google Scholar] [CrossRef]
  33. Moncada, M.C.; Fernandez, D.; Lima, J.C.; Parola, A.J.; Lodeiro, C.; Folgosa, F.; Melo, M.J.; Pina, F. Multistate properties of 7-(N,N-diethylamino)-4′-hydroxyflavylium. An example of an unidirectional reaction cycle driven by pH. Org. Biomol. Chem. 2004, 2, 2802–2808. [Google Scholar] [CrossRef]
  34. Giestas, L.; Folgosa, F.; Lima, J.C.; Parola, A.J.; Pina, F. Bio-Inspired Multistate Networks Responsive to Light, pH and Thermal Inputs–An Example of a Multistate System Operating Through Different Algorithms. Eur. J. Org. Chem. 2005, 19, 4187–4200. [Google Scholar] [CrossRef]
  35. Furtado, P.; Figueiredo, P.; Chaves das Neves, H.; Pina, F. Photochemical and thermal degradation of anthocyanidins. Photochemical and thermal degradation of anthocyanidins. J. Photochem. Photobiol. A 1993, 75, 113–118. [Google Scholar] [CrossRef]
  36. Alejo-Armijo, A.; Parola, A.J.; Pina, F. pH-Dependent Multistate System Generated by a Synthetic Furanoflavylium Compound: An Ancestor of the Anthocyanin Multistate of Chemical Species. ACS Omega 2019, 4, 4091–4100. [Google Scholar] [CrossRef] [Green Version]
  37. Brouillard, R.; Iacobucci, G.A.; Sweeny, J.G. Chemistry of anthocyanin pigments. 9. UV-visible spectrophotometric determination of the acidity constants of apigeninidin and three related 3- deoxyflavylium salts. J. Am. Chem. Soc. 1982, 104, 7585–7590. [Google Scholar] [CrossRef]
  38. Melo, M.J.; Moura, S.; Roque, A.; Maestri, M.; Pina, F. Photochemistry of luteolinidin: “Write-lock-read-unlock-erase” with a natural compound. J. Photochem. Photobiol. A 2000, 135, 33–39. [Google Scholar] [CrossRef]
  39. Gomes, R.; Diniz, A.M.; Jesus, A.; Parola, A.J.; Pina, F. The synthesis and reaction network of 2-styryl-1-benzopyrylium salts: An unexploited class of potential colorants. Dyes Pigm. 2009, 81, 69–79. [Google Scholar] [CrossRef]
  40. Cabrita, L.; Petrov, V.; Pina, F. On the thermal degradation of anthocyanidins: Cyanidin. RSC Adv. 2014, 4, 18939–18944. [Google Scholar] [CrossRef]
  41. Sweeny, J.G.; Iacobucci, G.A. Effect of Substitution on the Stability of 3-Deoxyanthocyanidins in Aqueous Solutions. J. Agric. Food Chem. 1983, 31, 531–533. [Google Scholar] [CrossRef]
  42. Gavara, R.; Petrov, V.; Pina, F. Characterization of the 4’- Hydroxynaphthoflavylium Network of Chemical Reactions. Photochem. Photobiol. Sci. 2010, 9, 298–303. [Google Scholar] [CrossRef]
  43. Petrov, V.; Diniz, A.M.; Cunha-Silva, L.; Parola, A.J.; Pina, F. Kinetic and thermodynamic study of 2’-hydroxy-8-methoxyflavylium. Reaction network interconverting flavylium cation and flavanone. RSC Adv. 2013, 3, 10786–10794. [Google Scholar] [CrossRef]
  44. Pina, F.; Melo, M.J.; Laia, C.A.T.; Parola, A.J.; Lima, J.C. Chemistry and Applications of Flavylium Compounds: A Handful of Colours. Chem. Soc. Rev. 2012, 41, 869–908. [Google Scholar] [CrossRef] [PubMed]
  45. Forino, M.; Gambuti, A.; Luciano, P.; Moio, L. Malvidin-3-O-glucoside Chemical Behavior in the Wine pH Range. J. Agric. Food Chem. 2019, 67, 1222–1229. [Google Scholar] [CrossRef] [PubMed]
  46. McClelland, R.A.; McGall, G.H. Hydration of the Flavylium Ion. 2. The 4’-Hydroxyflavylium Ion. J. Org. Chem. 1982, 47, 3730–3736. [Google Scholar] [CrossRef]
  47. Pina, F.; Roque, A.; Melo, M.J.; Maestri, M.; Belladelli, L.; Balzani, V. Multistate/Multifunctional Molecular-Level Systems: Light and pH Switching between the Various Forms of a Synthetic Flavylium Salt. Chem. Eur. J. 1998, 4, 1184–1191. [Google Scholar] [CrossRef]
  48. Quina, F.H.; Moreira, P.F., Jr.; Vautier-Giongo, C.; Rettori, D.; Rita, F.; Rodrigues, R.F.; Freitas, A.A.; Silva, P.F.; Maçanita, A.L. Photochemistry of anthocyanins and their biological role in plant tissues. Pure Appl. Chem. 2009, 81, 1687–1694. [Google Scholar] [CrossRef]
  49. Baranac, J.M.; Petranovic, N.A.; Dimitric-Markovic, J.M. Spectrophotometric study of anthocyan copigmentation reactions. 2. Malvin and the nonglycosidized flavone quercetin. J. Agric. Food Chem. 1997, 45, 1694–1697. [Google Scholar] [CrossRef]
  50. Lima, J.C.; Macanita, A.; Santos, H. Color stabilization of Malvidin 3-Glucoside: Self-aggregation of the Flavylium cation and copigmentation with the Z-Chalcone Form. J. Phys. Chem. B 1998, 102, 3578–3585. [Google Scholar]
  51. Ferreira da Silva, P.; Lima, J.C.; Quina, F.H.; Macüanita, A.L. Excited-state electron transfer in anthocyanins and related flavylium salts. J. Phys. Chem. A 2004, 108, 10133–10140. [Google Scholar] [CrossRef]
  52. Al Bittar, S.; Nathalie Mora, N.; Loonis, M.; Olivier Dangles, O. A simple synthesis of 3-deoxyanthocyanidins and their O-glucosides. Tetrahedron 2016, 72, 4294–4302. [Google Scholar] [CrossRef]
  53. Quina, F.H.; Pacheco da Silva, C.; Held, B.; Oliveira Silva, V. Challenges to the use of anthocyanins as natural coloring agents and antioxidants Abstracts of Papers. In Proceedings of the 250th ACS National Meeting & Exposition, Boston, MA, USA, 16–20 August 2015; p. 576. [Google Scholar]
  54. Asen, S.; Stewart, R.N.; Norris, K.H. Co-pigmentation of anthocyanins in plant tissues and its effect on color. Phytochemistry 1972, 11, 1139–1144. [Google Scholar] [CrossRef]
  55. Hoshino, T.; Matsumoto, U.; Goto, T.; Harada, N. Evidence for the self-association of anthocyanins IV. PMR spectroscopic evidence for the vertical stacking of anthocyanin molecules. Tetrahedron Lett. 1982, 23, 433–436. [Google Scholar] [CrossRef]
  56. Fernandes, A.; Natércia, F.; Brás, N.F.; Mateus, N.; de Freitas, V. A study of anthocyanin self-association by NMR spectroscopy. New J. Chem. 2015, 39, 2602–2611. [Google Scholar] [CrossRef]
  57. Dangles, O.; Elhajji, H. Synthesis of 3-Methoxy- and 3-(β-D-Glucopyranosyloxy) flavylium Ions. Influence of the flavylium substitution pattern on the reactivity of anthocyanins in aqueous solution. Helv. Chim. Acta 1994, 77, 1595–1610. [Google Scholar] [CrossRef]
  58. Freudenberg, V.K.; Weinges, K. Zur Kenntnis der Catechine und Catechingerbstoffe. Eur. J. Org. Chem. 1954, 590, 140–154. [Google Scholar] [CrossRef]
  59. George, F.; Fellague, T. Preparation of 3-Deoxyanthocyanidine Compounds and Their Use as Antimicrobial. Agents. Patent Number FR2855172, 26 November 2004. [Google Scholar]
  60. Saito, N.; Osawa, Y.; Hayashi, K. Platyconin, a new acylated anthocyanin in Chinese bell-flower, Platycodon grandiflorum. Phytochemistry 1971, 10, 445–447. [Google Scholar] [CrossRef]
  61. Hoshino, T. Self-association of flavylium cations of anthocyanidin 3,5-diglucosides studied by circular dichroism and 1H-NMR. Phytochemistry 1992, 31, 647–653. [Google Scholar] [CrossRef]
  62. Goulas, V.; Minas, I.S.; Kourdoulas, P.M.; Lazaridou, A.; Athanassios, N.; Molassiotis, A.N.; Gerothanassis, I.P.; Manganaris, G.A. 1H NMR Metabolic Fingerprinting to Probe Temporal Postharvest Changes on Qualitative Attributes and Phytochemical Profile of Sweet Cherry Fruit. Front. Plant Sci. 2015, 6, 959. [Google Scholar] [CrossRef] [Green Version]
Figure 1. Equilibrium of flavylium cation (AH+) with hemiketal (B) and its isomers.
Colorants 01 00004 g001
Figure 2. Synthetic scheme of artificial flavylium ions (6a6e).
Colorants 01 00004 g002
Figure 3. (A): UV spectra of 6a to 6e (~10−5 M) in ethanol immediately after dissolution. The curves of 6a and 6b are normalized. (B): UV-vis absorption of 6a to 6e in ethanol with dry HCl gas; 6a (ε = 8.84 × 103 cm−1 M−1, λmax = 452 nm, in 8.77 × 10⁻⁵ M), 6b (ε = 2.24 × 104 cm−1 M−1, λmax = 467 nm, in 5.30 × 10⁻⁵ M), 6c (ε = 8.77 × 104 cm−1 M−1, λmax = 498 nm, in 1.08 × 10⁻⁵ M), 6d (ε = 2.18 × 104 cm−1 M−1, λmax = 487 nm, in 4.90 × 10⁻⁵ M), 6e (ε = 4.45 × 104 cm−1 M−1, λmax = 519 nm, in 2.49 × 10⁻⁵ M).
Colorants 01 00004 g003
Figure 4. UV-vis spectra of 6b (normalized) in different concentrations in ethanol without HCl addition.
Colorants 01 00004 g004
Figure 5. Shifts of 1H-NMR peaks of 6a6e (10 mM) according to the numbers of OH substitution at a non-adjusted pH.
Colorants 01 00004 g005
Figure 6. Left: Elucidative resonance structures to clarify the 1H-NMR incongruency and Right: Hallmark chemical shifts of key hydrogens in flavylium ion.
Colorants 01 00004 g006
Figure 7. 1H-NMR results at two varying concentration scenarios [low concentration (~0.1 mM/~1 mM) and high concentration (~10 mM)] for flavylium ions (6a6d) at a non-adjusted pH.
Colorants 01 00004 g007
Figure 8. Energy levels (inset (A), in Hartree), examples of names (inset (B)), and energy gaps (inset (C), in nanometers for transitions from HOMO to LUMO) for the flavylium ions with one OH group. Numbers on the graph for energy levels are in Hartree, while numbers on the flavylium ions are converted to nanometers. Example structures and name symbols (on the right).
Colorants 01 00004 g008
Figure 9. Energy levels (on the left, in Hartree) and energy gaps (on the right, in nanometers for transitions from HOMO to LUMO) of flavylium ions with more than one OH group. Numbers on the graph for energy levels are in Hartree, while numbers on the flavylium ions are converted to nanometers.
Colorants 01 00004 g009
Figure 10. Closely lying MOs: Top (control, 3′-, 7-, 8-AH+ s, respectively)-Etotal (a.u.): −653.3544562, −728.5897841, −728.6023369, −728.5948221; Dipolemoment (Debye): 1.9592, 2.89, 3.4968, 2.26/Bottom (6a, 6b, 6c, and 6e respectively)-Etotal (a.u.): −728.603786, −803.851154, −879.0948916, −954.3353535; Dipolemoment (Debye): 2.8593, 4.2601, 5.1206, 5.0396.
Colorants 01 00004 g010
Figure 11. Self-association of dimers for AH+Cl (6a, 6b, 6c, and 6e).
Colorants 01 00004 g011
Figure 12. Molecular orbitals of dimers of 6b and 6c.
Colorants 01 00004 g012
Figure 13. Overall equilibrium scheme by various forms of 6b.
Colorants 01 00004 g013
Table 1. Chemical shifts of 1H-NMR and 13C-NMR and charge distribution from Gaussian calculations of the 3′,4′,7,8-tetrahydroxy flavylium ion (6e).
Location on Ring1H-NMR (ppm)13C-NMR (ppm)Charge Distribution on H (AO)Charge Distribution on C (AO)
38.21460.251−0.1015
48.91330.353−0.940
57.61560.294−0.582
67.41110.2760.114
2′7.9116.70.350−0.167
5′7.0115.30.298−0.205
6′8.0125.20.198−0.734
Table 2. UV–visible experimental data and calculated energy gaps of monomers and dimers (6a6e).
CompoundsExp. Ab (nm)Calc. (nm) MonomersCalc. (nm) Dimers
6a451.5391.3664.5 *
6b466.5400.2456.7
6c497.5438.2493.3 *
6d486.9401.1464.0
6e518.9437.0499.7 *
* Data from DFT//B3LYP/321G.
Publisher’s Note: MDPI stays neutral with regard to jurisdictional claims in published maps and institutional affiliations.

