Article

Following the Light: Use of Multimodal Imaging and Fiber Optic Spectroscopy to Evaluate Aging in Daylight Fluorescent Artists’ Pigments

Garman Art Conservation Department, SUNY-Buffalo State, 1300 Elmwood Ave, Buffalo, NY 14222, USA
*
Author to whom correspondence should be addressed.
Colorants 2022, 1(2), 208-225; https://doi.org/10.3390/colorants1020013
Submission received: 11 February 2022 / Revised: 16 May 2022 / Accepted: 18 May 2022 / Published: 23 May 2022
(This article belongs to the Special Issue Colorants: Ancient and Modern)

Abstract

:
Daylight fluorescent artists’ colors have been well established as fugitive. Upon exposure to light, these vibrant colors can fade and exhibit color shifts. Artwork containing these fluorescent colorants presents complex challenges for art conservators faced with conserving these inherently problematic materials. This paper examined nine fluorescent colorants obtained from Kremer Pigmente, referred to the previous literature and research, and attempted to quantify the visual and photographic observations of fading and color changes. It provides additional information that could be useful in considering conservation documentation and treatment. Fiber optic spectroscopy using ultraviolet and visible light sources was used to measure the spectral shifts of the colorants before and after exposure to light. The fluorescent colors exhibited alterations in intensity coupled with primary peak shifts in the spectrum corresponding to the optical fading and color shifts. Multimodal imaging was executed to analyze the pigments in different regions of the spectrum before and after aging, which has not been documented before with these fluorescent colorants. Imaging in various regions of the spectrum indicated differences in absorption and reflectance between the pigments as captured by a modified camera. The results were compared to recently published research including the identification of the dyes present in the Kremer line of pigments. Multimodal imaging and fiber optic spectroscopy provided valuable information for future documentation and conservation of artworks containing these colorants. Specifically, these non-invasive techniques provide a method to document and identify the spectral changes between the aged and unaged pigment, graph and predict the direction of overall color change, and provide useful data for establishing future conservation treatment protocols.

1. Introduction

1.1. Historic and Artistic Use

Daylight fluorescent colors are commonly known under the tradename Day-Glo©, after the Day-Glo Color Corporation [1]. These colorants were a chance twentieth-century discovery by American scientists Robert and Joseph Switzer. After conducting several experiments with materials in their family’s pharmacy, the brothers found they could use the fluorescent materials to enhance magic shows performed by Joseph Switzer [2,3]. They subsequently established their first company, Fluor-S-Art Co., in 1934, which later became Switzer Brothers Inc. founded in 1946 [2]. The bright colorants were instantly successful, and there are now many production companies worldwide. Due to their high visibility, daylight fluorescent colors were initially developed for industrial and military use [4]. In particular, fluorescent orange was used in preventing US aircraft collisions [2]. These vibrant colors were eventually adapted and incorporated into artist materials. “Black light” mural paintings were popular in theater decor in the 1940s and 1950s. Though not many have survived, one prominent example of such decor is the fluorescent murals in the auditorium of the Alameda Theatre in San Antonio, Texas [5]. Artists such as Frank Stella, Peter Halley, Andy Warhol, and James Rosenquist used daylight fluorescent paints in their artworks, some as early as the 1960s, not long after the paints were introduced to the market. The trend and desire for their use in artwork remained constant, and the 21st-century sale and use of fluorescent paint for artwork remain ever available and popular. As artists continue to use these colorants, there will inevitably be an increase in their presence in museum collections. The reality of fluorescent paint use by collectable artists was reiterated at recent American Institute for Conservation (AIC) annual conferences in 2015 and 2018. Presentations by Beckett, Holden, and Smith in 2015 [6], and De Winter in 2018 [7], illustrated some of the problems associated with these artworks and highlighted the additional challenges in instances where such works are intended to be viewed under both normal illumination and ultraviolet (UV) radiation for their exaggerated optical effects over typically long-term museum display. When initially applied, daylight fluorescent colors exhibit a bright, glowing appearance even under normal illumination. Due to their transparency, their vividness is increased in applications over a white ground and is decreased in applications applied over a darker ground. When viewed under UV radiation or “black light”, the excitation of the colorants creates an intense luminous effect, as though the pigments themselves are a light source.

1.2. Composition

Contrary to their common description as “pigments”, fluorescent colorants are manufactured using fluorescent dyes cast into resins and subsequently reduced into pigment-sized particles (Figure 1). It is common to have a mixture of several dyes and additives in a single commercial color.
According to Kremer Pigmente, the encapsulating resin in the Kremer line of dyes is sulfonamide-paraformaldehyde resin [8]. The overall dye component of pigments is low (typically below 5%) due to the quenching at higher concentrations, which results in decreased fluorescence [9]. The dye-containing resin powders can be purchased and mixed with binding media for painting by artists themselves or can be purchased pre-made in various commercially available formulations around the world, including by artist material manufacturers Golden, Liquitex, Lefranc & Bourgeois, One Shot, Krylon, Radiant, Day-Glo, and Tri-Art. Companies also purchase pigments from other manufacturers; for example, Sobeck et al. [10] reported that Kremer purchases pigments from Radiant Corporation. The colorants are manufactured to be suited to a variety of binding media including oil, acrylic, watercolor, and gouache.
Optical brighteners are also added to the colorants during the manufacturing process, though they are not necessarily listed in the product information [10,11]. Optical brighteners have been previously extracted in all the Kremer fluorescent pigments [11]. Previous research identified the specific dyes, optical brighteners, and UV absorbers used by several different manufacturers in creating their fluorescent pigments [10,12,13,14]. As indicated by Sobeck et al. [10], the dyes in the Kremer line of pigments are identified as various combinations of the following: Sulforhodamine B (SRB), Rhodamine 6GD (R6GD), Rhodamine 6G (R6G), Rhodamine 3 B (R3B), Solvent Yellow 172 (SY172), and optical brighteners Fluorescent Brightener 61 (FB61) and Fluorescent Brightener 184 (FB184), as well as the UV absorber Benzophenone-3 (BP3). Additionally, phthalo pigments (PB15: 3 and PG7) are used alongside optical brighteners to achieve the colors in the blue and green pigments [10,13,15]. The fluorescent green contains the SY172 yellow dye, whereas the fluorescent blue contains no fluorescent colorants but only optical brighteners to achieve the vivid effect. Similarly, the fluorescent white pigment in the Kremer line relies on an optical brightener for fluorescence [10]. The dye and optical brighteners identified in the Kremer fluorescent pigments are summarized in Table 1.
Other studies addressing fluorescent colorants include Francone et al. [16], who looked at the identification of fluorescent colorants through Raman spectroscopy, and Boscacci et al. [14], who also looked at the composition of Flasche Fluo paints with SERS and TLC, identifying some dye constituents and highlighting the issue of inpainting challenges. Longoni et al. [17] analyzed Italian pop paintings on aluminum, identifying fluorescent colorants alongside more traditional pigments. Though analysis methods can be similar, fluorescent colorants have not been as extensively analyzed as traditional pigments or historical artists’ materials, which feature prominently in published research and databases. Examples of analysis methods to look at traditional pigments and to create various databases include FORS, online FT-Raman and dispersive Raman, XRF, attenuated total reflectance and total reflectance infrared spectroscopies, and XRD [17,18,19,20,21].

1.3. Fading and Color Shifts

While initially extremely bright, fluorescent artist materials are widely known to exhibit poor lightfastness and color shifts over time. Previous studies have indicated lightfastness of less than the International Standards Organization (ISO) Blue Wools Standards (BWS) 1 for many of the fluorescent colorants on artwork [11,22]. This is particularly problematic as the change in brightness and color negatively impacts the appearance of the artwork, altering the artist’s initial intent. Application of a UV-inhibiting varnish can reduce the rate of fading and is recommended to artists by manufacturers [8,23]. A UV-inhibiting varnish, however, also reduces the fluorescence of the paints under UV radiation, which is problematic for some artwork designed for maximum effect when viewed under blacklight conditions. As previously indicated, the presence of multiple dyes and additives within a single commercial color is very common. Many of the colorants experience color shifts as they fade as the multiple dyes exhibit preferential fading [12,24]. Several studies have explored fluorescent colorants and their fading behavior [12,13,24,25,26] as well as case studies of treatments [5,11]. Conners-Rowe et al. [24] found that photochemical deterioration occurs and results in one of two things: (1) the most unstable dye fading, disrupting the energy transfer between two different dyes, resulting in a different color; or (2) the additive fluorescent emission is reduced to a single emission characteristic of the original hue. Hinde and Nel (2008) [25] characterized the absorption and fluorescence spectra of the Day-Glo range of fluorescent pigments. Further research by Hinde et al. [12] has shown that the multiple dyes present also differ in their spectral responses. The fluorescent emission of some of these constituent dyes may alternatively be used, in part, to excite another individual dye through energy transfer [12]. Not all manufacturers use the same dyes in the same combination or concentrations, or they may use several combinations of already combined colors. Manufacturers can also adjust their recipes over time, though some paints can also remain unchanged for many years, such as the Flashe Fluo by Lefranc & Bourgeois [16]. Artists themselves can also blend colors, deliberately or inadvertently overlapping fluorescent materials with non-fluorescent materials, making it difficult to characterize the dyes present or estimate the potential fading of the overall pigment.

1.4. Documentation and Compensation for Loss

The conservation of artwork containing fluorescent pigments is complex due to their inherent vice. The absorbance properties of the pigments and the radiation exposure levels define their stability and degradation. As such, over the course of conservation treatments, the documentation and color matching on artwork exhibiting damages or losses are particularly problematic, especially if there is a need to consider a match in more than one region of the spectrum. Ethical conservation practice and compensation for loss include the ability to accurately differentiate or document the original artwork as well as areas of subsequent inpainting. Documentation of the fluorescent colorants poses a challenge in photography due to the high levels of fluorescence generated. For example, Figure 2 illustrates Kremer Fluorescent Golden Orange, as imaged under UV radiation.
The images were processed according to the UV Innovations™ Target-UV™ standards for “Ultra” fluorescence and processing [27]. The standard was designed as a tool to create clear and consistent results in fluorescence photography. In this case, the image was excessively bright, appearing much different than the actual sample. The image as processed indicated overexposure; thus, to more accurately document the colors, a second image was captured at a deliberately reduced exposure to regain the details in the overexposed regions.
Mimetic color matching in areas of loss in an artwork containing fluorescent materials can only be achieved with the use of fluorescent inpainting. In some instances, it is possible to adequately match the fluorescence of an area of loss on a fluorescent-containing artwork by employing dilutions of the same fluorescent colorants, though previous studies have indicated this is only successful with certain colors that do not exhibit color shifts upon aging [24]. A recent analysis and conservation treatment of a painted leather jacket designed by Stephen Sprouse at the Indianapolis Museum of Art (IMA) explored pre-fading of inpainting pigments and dilution of fluorescent pigments as means to achieve a color match in both normal illumination and UV radiation during their treatment of a daylight fluorescent jacket; however, as the authors noted, this was a single yellow pigment [11].
Likewise, although expected, it can be difficult to determine a suitable method of inpainting to differentiate areas of compensation for loss. As Conners-Rowe et al. mentioned, “In undertaking such a repair, maintaining distinctness of the inpainting from the original paint is a formidable challenge” [24]. Creating a deliberately shy or textured fill or relying solely on a difference in solubility and strong documentation could be a viable option in some circumstances, although it may not necessarily be desirable in some cases. The above-mentioned case study at the IMA mentioned shortwave UV radiation (UVC) as a method of excitation for the fluorescent colorants, causing them to emit a different spectral response, which could indicate areas of inpainting—the study is clear in that this is not ideal or sustainable as exposure to UVC can cause the fluorescent colorants to fade faster [6]. Earlier research by Whitmore et al. [28] indicated that exposure to UVA causes the colorants to fade approximately 10% faster than illumination by visible light.
The use of imaging methodologies to document conservation, condition, and treatment is particularly useful and part of ethical conservation practice. Fluorescent paints used in artwork are typically designed to be viewed in normal illumination and frequently under blacklight (UVA-emitting light sources), allowing the colors to glow. This can also be observed in some non-fluorescent pigments, such as Indian Yellow, which exhibits bright yellow UVA-induced visible fluorescence [29]. For the fugitive fluorescent pigments meant to be seen in both normal and blacklight, this excludes the use of these two lighting conditions as an ideal for documenting compensation for loss. Reflected infrared (RIR) imaging and visible-induced infrared luminescence (IRLUM) are additional techniques employed by conservators to document artwork and can help to see beyond the upper layers of paint (in the case of RIR) and how the pigments respond to varying levels of excitation energy. IR luminescence follows the same principle as visible fluorescence, with visible light as the excitation energy causing materials to emit IR energy, instead of emitting human-observable visible light [30]. Typically, this is used in combination with other techniques to help visually distinguish between pigments. For example, pigments that exhibit IR luminescence include cadmium pigments, kaolin, and Egyptian blue, known to exhibit intense IR luminescence [31,32].

1.5. Current Study

The current study evaluated fluorescent colorants and their spectral responses before and after they were exposed to light in a Q-sun xenon-arc test chamber. The techniques used were multimodal imaging (MMI) and quantitative measurements with fiber optic spectroscopy. Fiber optic spectroscopy (reflectance and emission) was used to look at the changes in the spectral response of the pigments and quantify the visually observed changes witnessed by the camera and the human eye in normal and ultraviolet illumination. MMI imaging was conducted to characterize the optical behavior (as captured by a camera) of the pigments in different regions of the spectrum. Kremer daylight fluorescent pigments were chosen as they are a common supplier of artist materials and are easily purchased online as well as in store in North America and Europe. Kremer pigments are supplied by Radiant Color NV (part of the Day-Glo Color Corporation) and are similar in chemical make-up [10]. Radiant Color also mentions that it is the “World’s Largest Manufacturer of Daylight Fluorescent Pigments” [33].
Recent research in fluorescing artifact analysis has chosen to use the broader term luminescence over fluorescence as unknown materials may be both fluorescent and phosphorescent [34]. No previous research on the pigments in this study has shown evidence of phosphorescence; thus, in the current study, the term fluorescence is used.

2. Materials and Methods

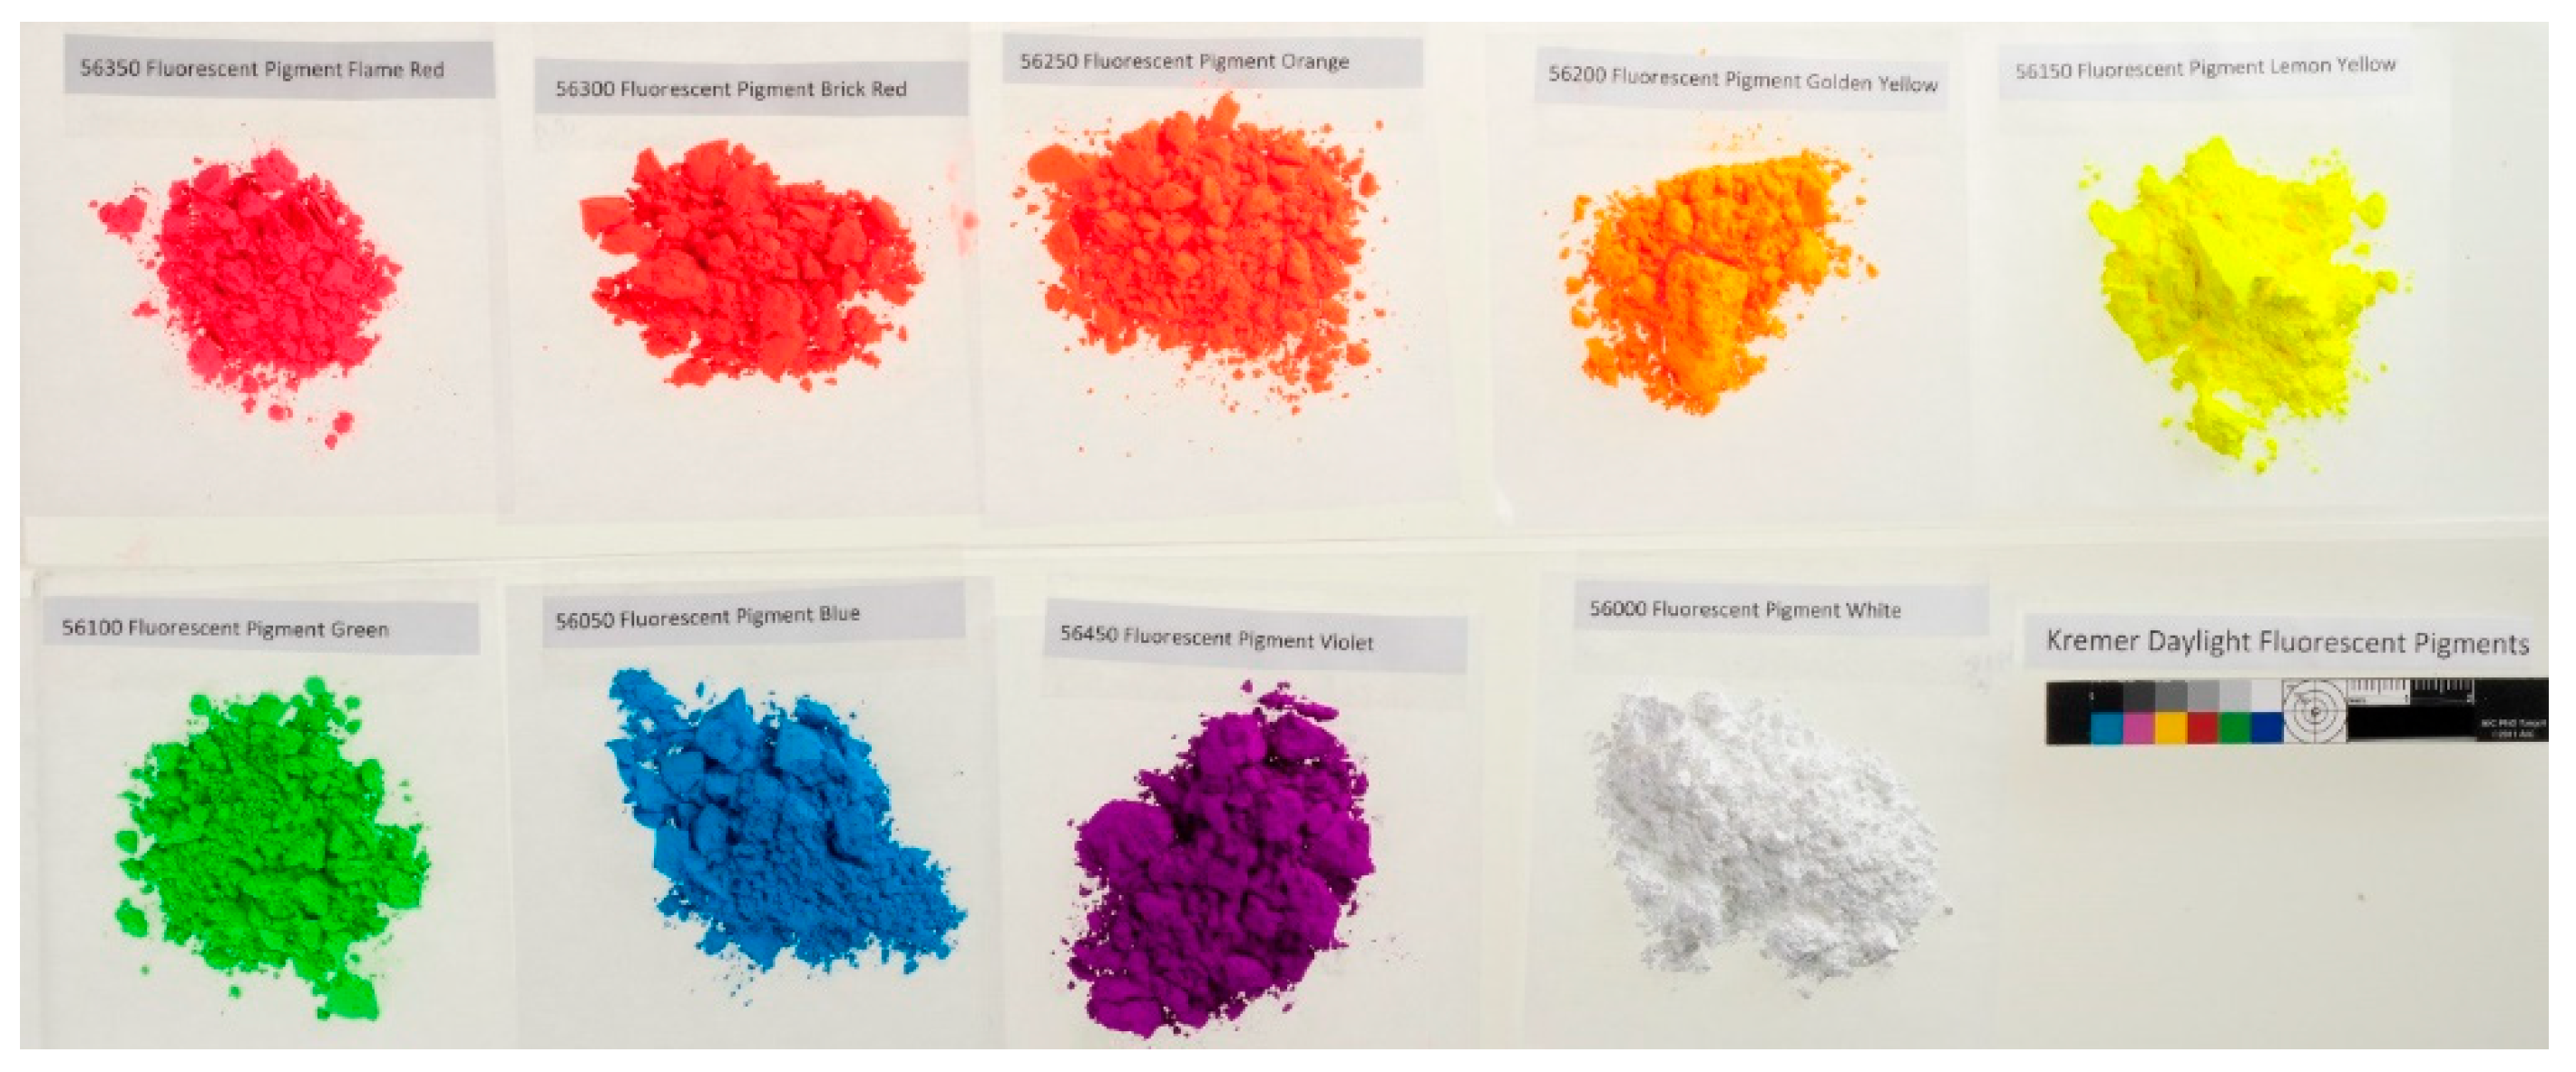
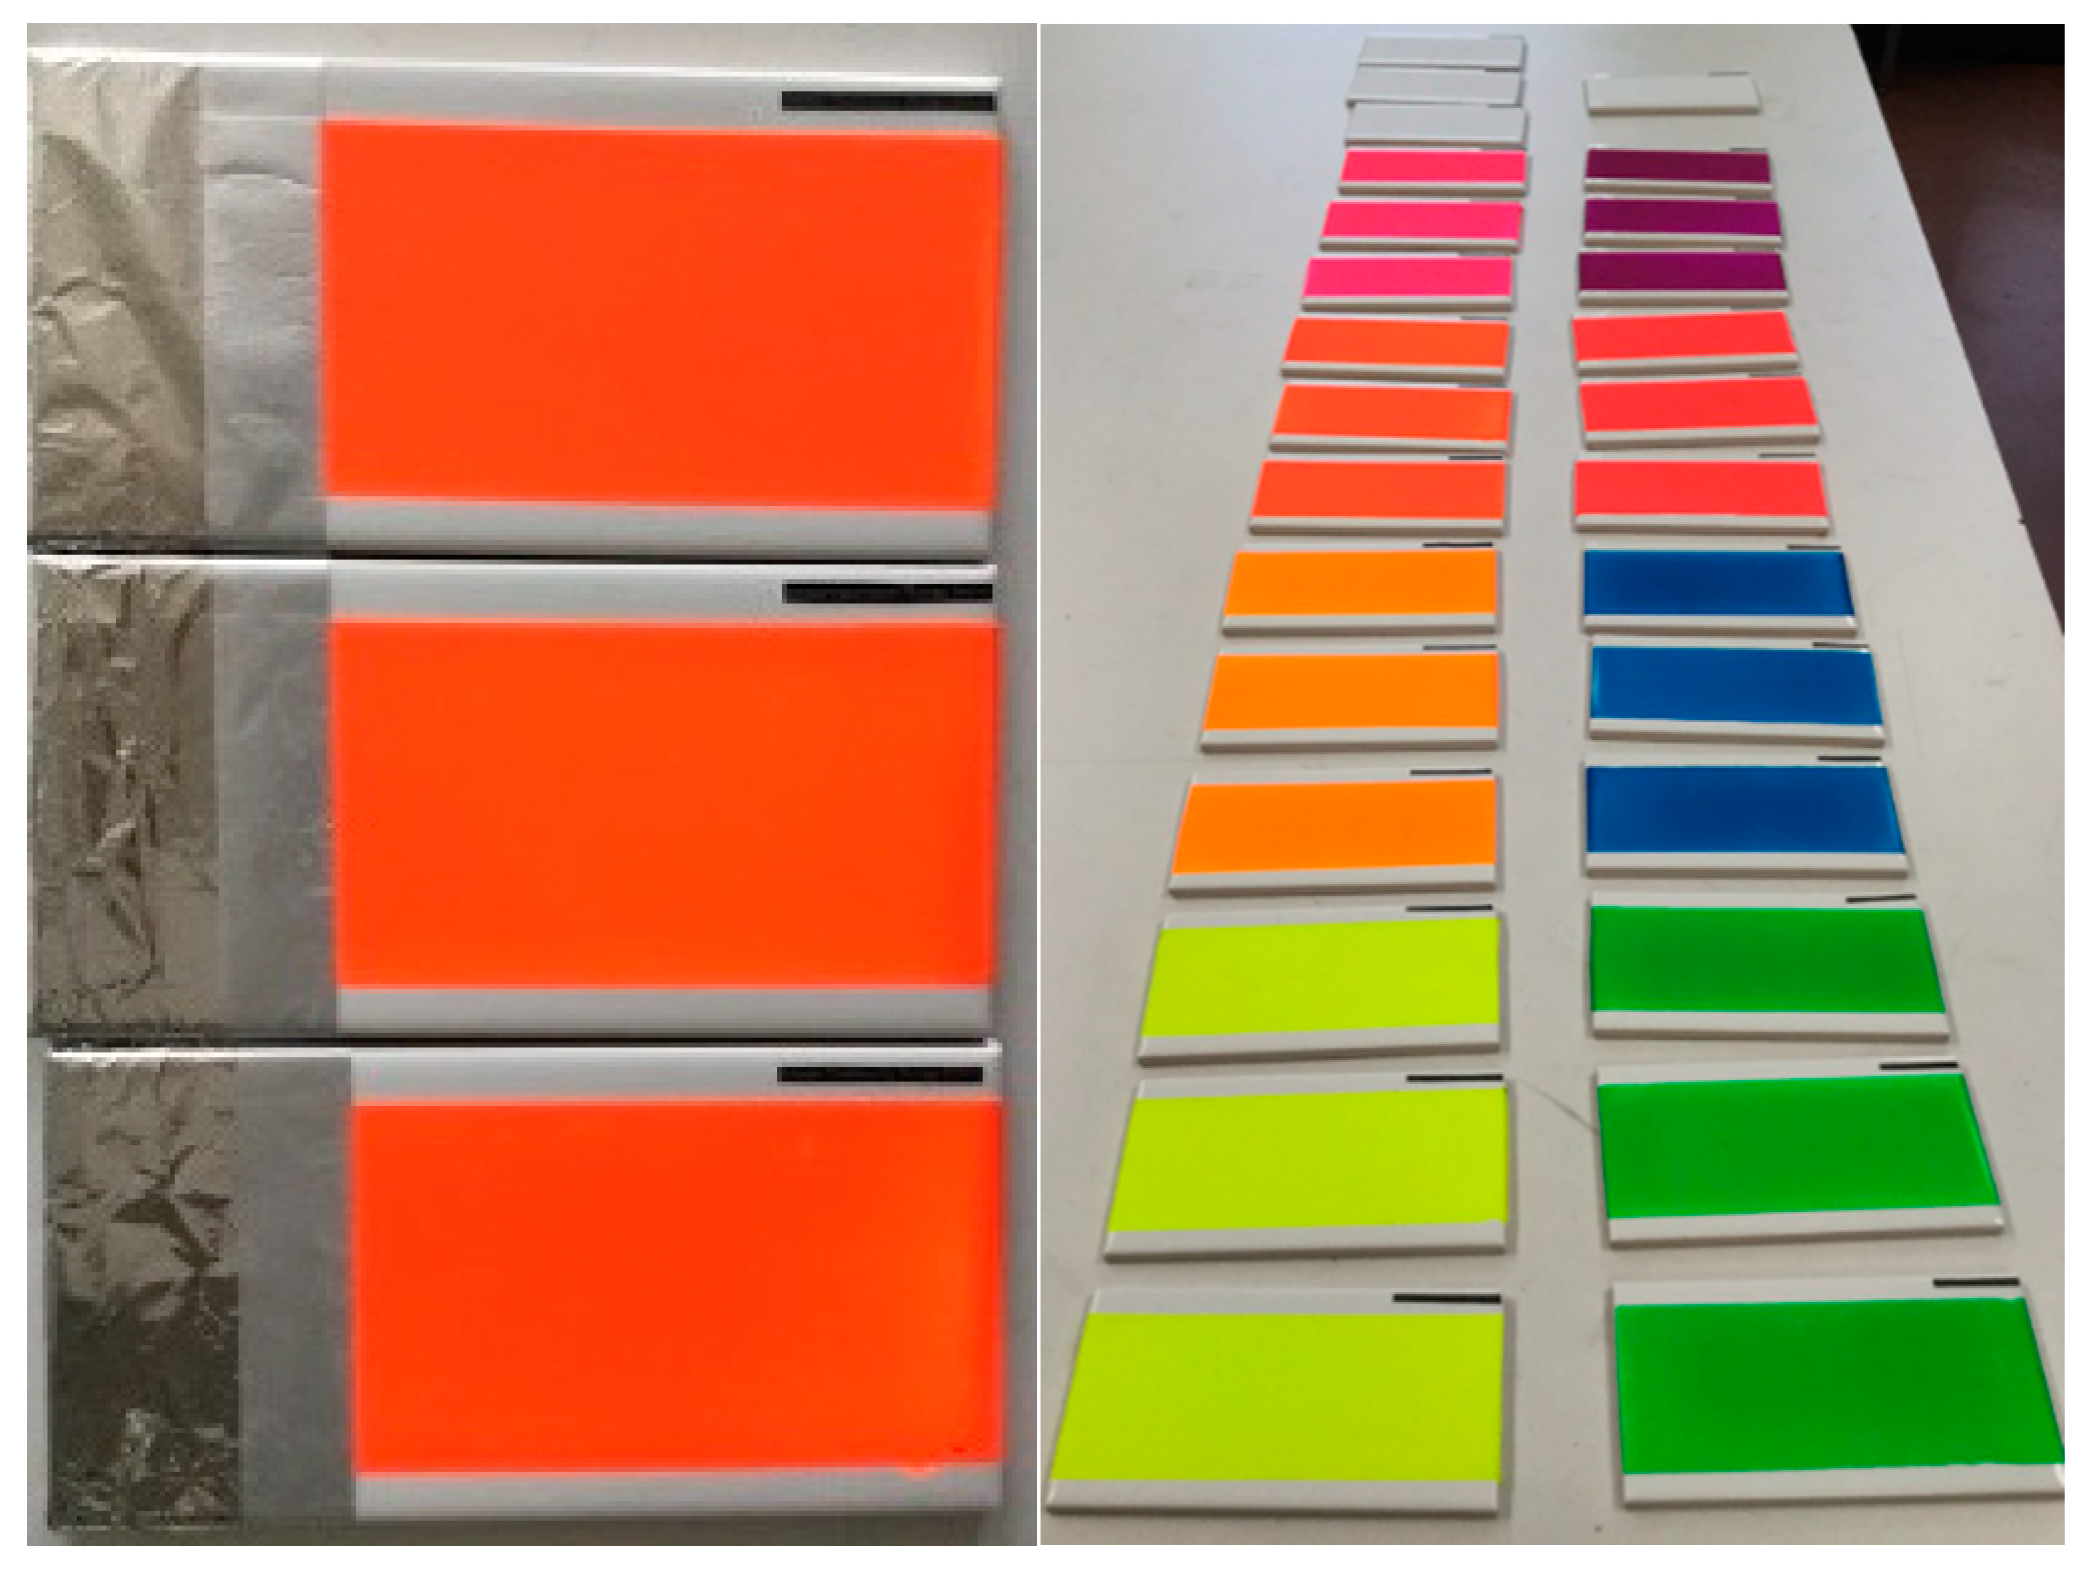
2.1. Pigments and Sample Preparation
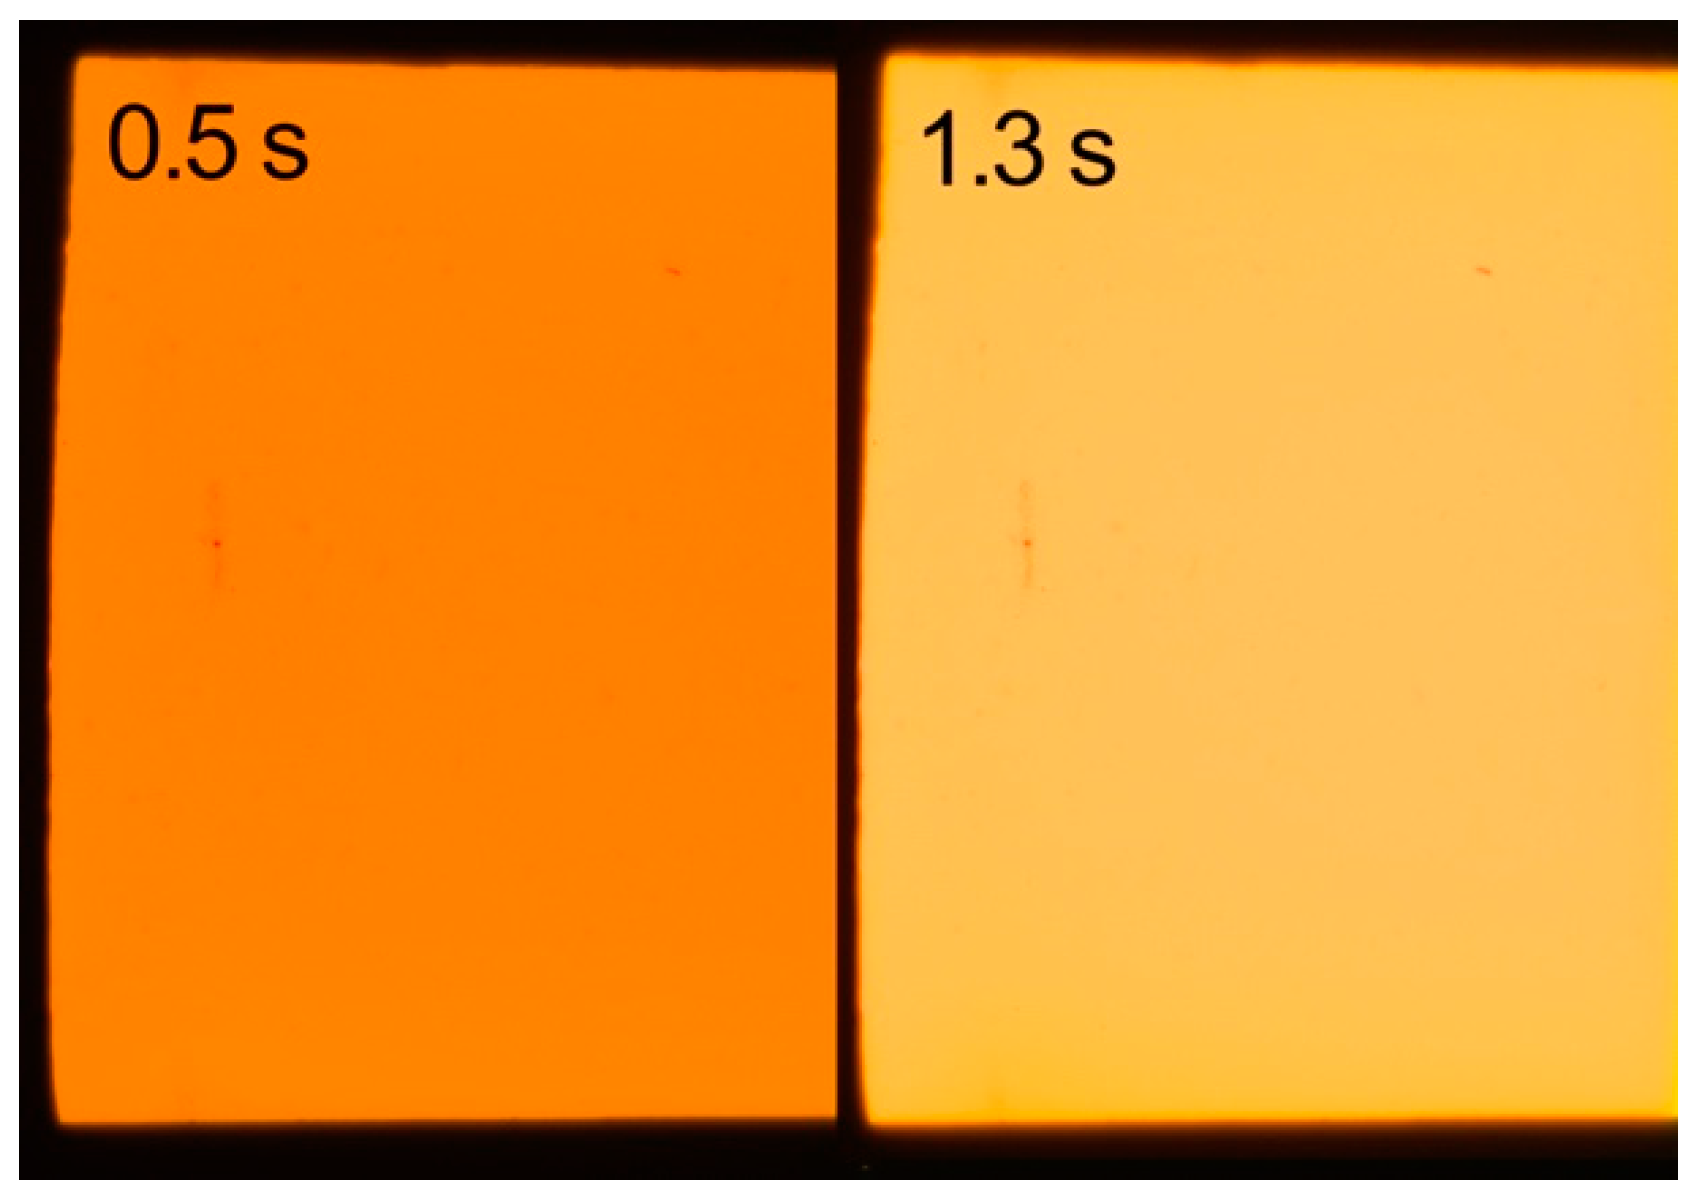
To control variables for this study, dry fluorescent pigments were used both without a binder and with a binder. Nine daylight fluorescent artists’ pigments were purchased from Kremer Pigmente (https://shop.kremerpigments.com/us/, New York, NY, USA) (Brick Red 56300, Flame Red 56350, Orange 56250, Golden Orange 56200, Lemon Yellow 56150, Green 56100, Blue 56050, Violet 56450, and White 56000) (Figure 1). White ceramic tiles (Restore Bright White 3 in. × 6 in. Ceramic Modular Wall Tile #734647960556 purchased from Home Depot (Buffalo, NY, USA) were used as the substrate. The tiles were chosen for their lack of UV-induced visible fluorescence under UV radiation and for their white color which would enhance the transparent fluorescent colorants. Additionally, the tiles are even, smooth, readily available, economical, and easy to clean. Samples with a binder were custom-mixed. The powdered colorants were mixed using a palette knife with Golden Acrylic Matte Medium purchased from Golden Artist’s Colors, Inc. (https://www.goldenpaints.com/, New Berlin, NY, USA) as a binder. The binder was chosen for its transparency, common availability as an artists’ medium, quick drying rate, lack of toxicity, and initial solubility in water. An amount of 2 g of dry pigment was mixed with 10 g of acrylic medium. An additional 1 mL of deionized water was used to improve the wetting of the pigments and prevent the drying of the acrylic medium during mixing. Scotch tape with a thickness of 0.058 mm was applied to either edge of the tile for a neat and even application. The paint was drawn down over the white tile using an aluminum spatula. The wet-film thickness was 0.058 mm, and the paint film covered an area on the tile of 6 cm × 15 cm (with minor variations). The samples were created in a room with low lighting and dried in the dark. Once dry, the samples were covered with aluminum foil on one side to prevent light exposure in this area (Figure 3). After aging, the aluminum foil was removed to allow analysis and imaging. Samples were stored in the dark between analyses.
Three sample sets were created of the complete range of nine colorants on tiles using the above-mentioned method.
Binderless samples were prepared to conduct MMI on the pigments without the binder present. Powdered samples of each pigment were applied to a modified white artists’ board purchased from Hyatt’s All Things Creative (Buffalo, NY, USA). The artists’ board was chosen for its white color and lack of UV-induced visible fluorescence when exposed to UV radiation. Half of the artists’ board was coated with Golden acrylic black matte paint to include the variable of a dark background as the pigments are known to be transparent. As the powdered colorants are finely ground, they were wetted with water and ethanol to facilitate application and were subsequently applied to the artists’ board by brush, overlapping both white and black regions in a circle with an approximate diameter of 0.75 cm. This method resulted in a powdery spot of each colorant on top of the white artists’ board, overlapping with the black acrylic paint. Wetting the pigments temporarily with ethanol formed a more cohesive spot. The thickness of the powder could not be measured and varied slightly for each sample.

2.2. Light Exposure

Samples in binding media were placed in a Q-Sun xenon test chamber and aged using ASTM D4303-06 Test Method D- Exposure in a humidity-controlled xenon-arc device simulating daylight filtered through window glass [35]. This test method can be used to evaluate the lightfastness of materials. While it does not mimic exact museum conditions, accelerated aging simulates changes that can be reasonably expected. Filtered radiation from the xenon-arc chamber was employed using the following parameters: 0.9 W/(m2 nm) at 420 nm. The humidity range was 36–44% RH, and the temperature range was 60–65 °C. The approximate correlation to museum conditions (assuming a diurnal cycle of 12 h of light followed by 12 h of dark) is 1500 days (or just over 4 years) in museum lighting conditions. Samples were placed horizontally in the chamber and rotated every 24 h over the course of 10 days (240 h) to ensure an even distribution throughout the chamber during the course of aging in case of any anomalies in light exposure. A Blue Wools Standard (BWS) card was purchased from TALAS: Conservation, Archival & Bookbinding Supplies online (https://www.talasonline.com/, Brooklyn, NY, USA). The BWS was placed in the chamber as a measure of exposure and comparative lightfastness. The BWS standard comprises eight dyed sections of cloth each having a known fading rate, which are used to measure lightfastness ranging between ISO 1 and ISO 8, with 8 being the most stable [36].

2.3. Fiber Optic Spectroscopy

Fiber optic spectroscopy was conducted on the aged and unaged samples in binding media. Fiber optic spectroscopy was not conducted on the binderless samples as the powder form of the pigments was easily disturbed and would contaminate the instrument.
Fiber optic reflectance spectroscopy (FORS) is a widely used non-invasive technique to analyze materials and assist in the identification of pigments, colorants, and binders in artwork by assessing their spectral responses [37]. The reflectance spectrum is obtained by illuminating the samples with full-spectrum light and capturing the diffuse spectral response (intensity vs. wavelength). A diffuse Spectralon standard with greater than 95% reflectivity from 250 to 2200 nm was used to calibrate the system prior to collecting spectra. An Ocean Insights (Ocean Insights, Largo, FL, USA) HL-2000-HP-FSHA tungsten halogen light source (360–2400 nm emission) coupled to a Vis–NIR fiber optic cable was used to illuminate the samples. An Ocean Optics (Ocean Optics Inc., Largo, FL, USA) SD-2000 Spectrometer (0.6 nm spatial resolution) using a Vis–NIR fiber optic cable was employed to capture the reflectance from a range of 400–875 nm. The integration time was 1.5 ms per scan, and 50 total scans were averaged.
In addition to using FORS to collect reflected color measurements, the fiber optic system was also employed to measure UV-induced fluorescence emission, resulting shifts in the highest peak fluorescence emission wavelength, and the percent intensity of fluorescence emission. A tightly banded 365 nm LED excitation source (12 nm FWHM) coupled to an Ocean Insight LSM power source provided illumination. A UV–Vis fiber optical cable fitted with a BG-38 filter was used to illuminate the sample. A diffuse Spectralon standard with greater than 95% reflectivity from 250 to 2200 nm was used to calibrate the system prior to collecting spectra. The system was run at between 2 mA and 5 mA depending on the reflective response of the pigment sample, resulting in arbitrary units being used for comparisons of intensity. An Ocean Optics SD-2000 Spectrometer using a Vis–NIR fiber optic cable was employed to capture the emission (captured between 400 and 875 nm). The integration time was 1.5 ms per scan, and 50 total scans were averaged.
For both collection methods, a reflectance fiber optic probe holder (Ocean Insights) was used to position the fiber optic cables at a 90-degree angle for illumination and a 45-degree angle to capture the reflectance intensity and fluorescence emission. The fixed configuration of the probe holder held the fiber optic cables in position, preventing any movements and unwanted specular reflections. All data were collected using Ocean Optics Oceanview software. Data were smoothed by 10 pt, plotted, and interpreted using Origin software.
Resulting color measurements were calculated based on the spectral response using ColorCalculator version 7.77 (OSRAM SYLVANIA, Inc., Beverly, MA, USA) and reported in u’v’ values. These u’v’ values were converted to x, y values and then plotted on a CIE 1931 (x, y) color space chromaticity diagram. Table 2 summarizes the spectroscopy instrumentation, settings, and data collection methods for convenience.

2.4. Multimodal Imaging

MMI was conducted on samples with binding media (aged and unaged) and on samples without binding media (unaged). MMI consists of a combination of imaging and lighting techniques that can be compiled to photographically capture how a particular material or paint responds and whether it emits, reflects, absorbs, and/or transmits in the visible or non-visible regions of the electromagnetic spectrum [30]. The nine colorants (with binder and aged, with binder and unaged, and without binder) were imaged using the following imaging techniques and following the workflow: normal illumination (NORM); long-wave ultraviolet-induced visible fluorescence (UV–Vis); reflected long-wave ultraviolet (RUVA); visible-induced near-infrared luminescence (IRLUM); and reflected near-infrared (RIR). Imaging was completed on a copy stand with the camera positioned directly above the samples. Image processing for exposure values was completed with the AIC PhD target and the UV Innovations™ Target-UV™ and executed in Adobe Bridge according to AIC standards [38,39]. Normal illumination imaging was conducted with a Nikon D810 UV–Vis–IR modified camera (MaxMax, https://maxmax.com/, Carlstadt, NJ, USA) with a 60 mm apochromatic Coastal Optical lens (Jenoptik: https://www.jenoptik.us/), two Profoto D1 500 W lamps (B&H Foto and Electronics Corp., https://www.bhphotovideo.com/, New York, NY, USA) positioned at 25-degree angles, and an X-Nite CC1 filter (MaxMax, https://maxmax.com/, Carlstadt, NJ, USA). RUVA and UV–Vis imaging was conducted using a Nikon D810 and two longwave UVA lamps (Low-pressure Mercury UVA lamp peak/368 nm, 250 W purchased from UV Systems, Inc., https://www.uvsystems.com/, Renton, WA, USA), positioned at 45-degree angles on either side of the sample. An X-Nite CC1, PECA 918 (PECA Products Inc., http://www.ir-uv.com/918.html), and Kodak Wratten 2E filter (Kodak, https://www.kodak.com) were used for UV–Vis. For RUVA, an X-Nite CC1 and BW 403 filter (B & H Foto and Electronics Corp. https://www.bhphotovideo.com/, New York, NY, USA) were used. For both RUVA and UV–Vis, the UV lamps were turned on one hour prior to imaging to warm up and create a uniform light source, demonstrated to achieve more consistent results [40]. To prevent unnecessary fading and protect the samples, the samples were only exposed to any lighting including UV during the brief time of the image capture; at other times, they were covered with a black foam board. During the imaging process, the pigments exhibited such bright fluorescence that processing them with the UV Innovations™ Target-UV™ Ultra setting still provided overexposed images [41]. As a result, the exposure time was reduced from 1.3 s to 0.5 s for Golden Orange and to 0.6 s for all other colorants to obtain usable and more accurate images. Figure 2 illustrates the overexposure and reduction in exposure time as well as the differences in color related to exposure. IRLUM imaging uses visible light as the source of excitation energy and captures the emission of IR energy [30]. Imaging was conducted using a Nikon D810 and one Powersmith Work LED light filtered with two 6 ½″ × 6 ½″ 3 mm-thick Schott BG 38 filters (Edmund Optics Inc., https://www.edmundoptics.com/). RIR imaging was conducted with a Nikon D 810 with X-Nite 715 nm, 850 nm, and 1000 nm filters, each separately (MaxMax, https://maxmax.com/, Carlstadt, NJ, USA). Two Profoto D1 500W lights were used. The lighting angle was 25 degrees on each side. Table 3 summarizes the settings and instrumentation for convenience.

3. Results and Discussion

3.1. Light Exposure Results

Exposure in the Q-Sun xenon test chamber using ASTM D4303-06 Test Method D indicated a lightfastness equivalent to ISO BWS 2 or lower for all colorants other than the White. All colorants other than the White displayed obvious optical differences in brightness, with some also exhibiting a color change. The fading of BWS 2 is equivalent to 800,000 lux hours. The BWS was analyzed by visual inspection, and the results are consistent with previous research showing the poor lightfastness of fluorescent colorants [11,22]. Visual observations of the aged and unaged colorants are further discussed in the Imaging Results section.

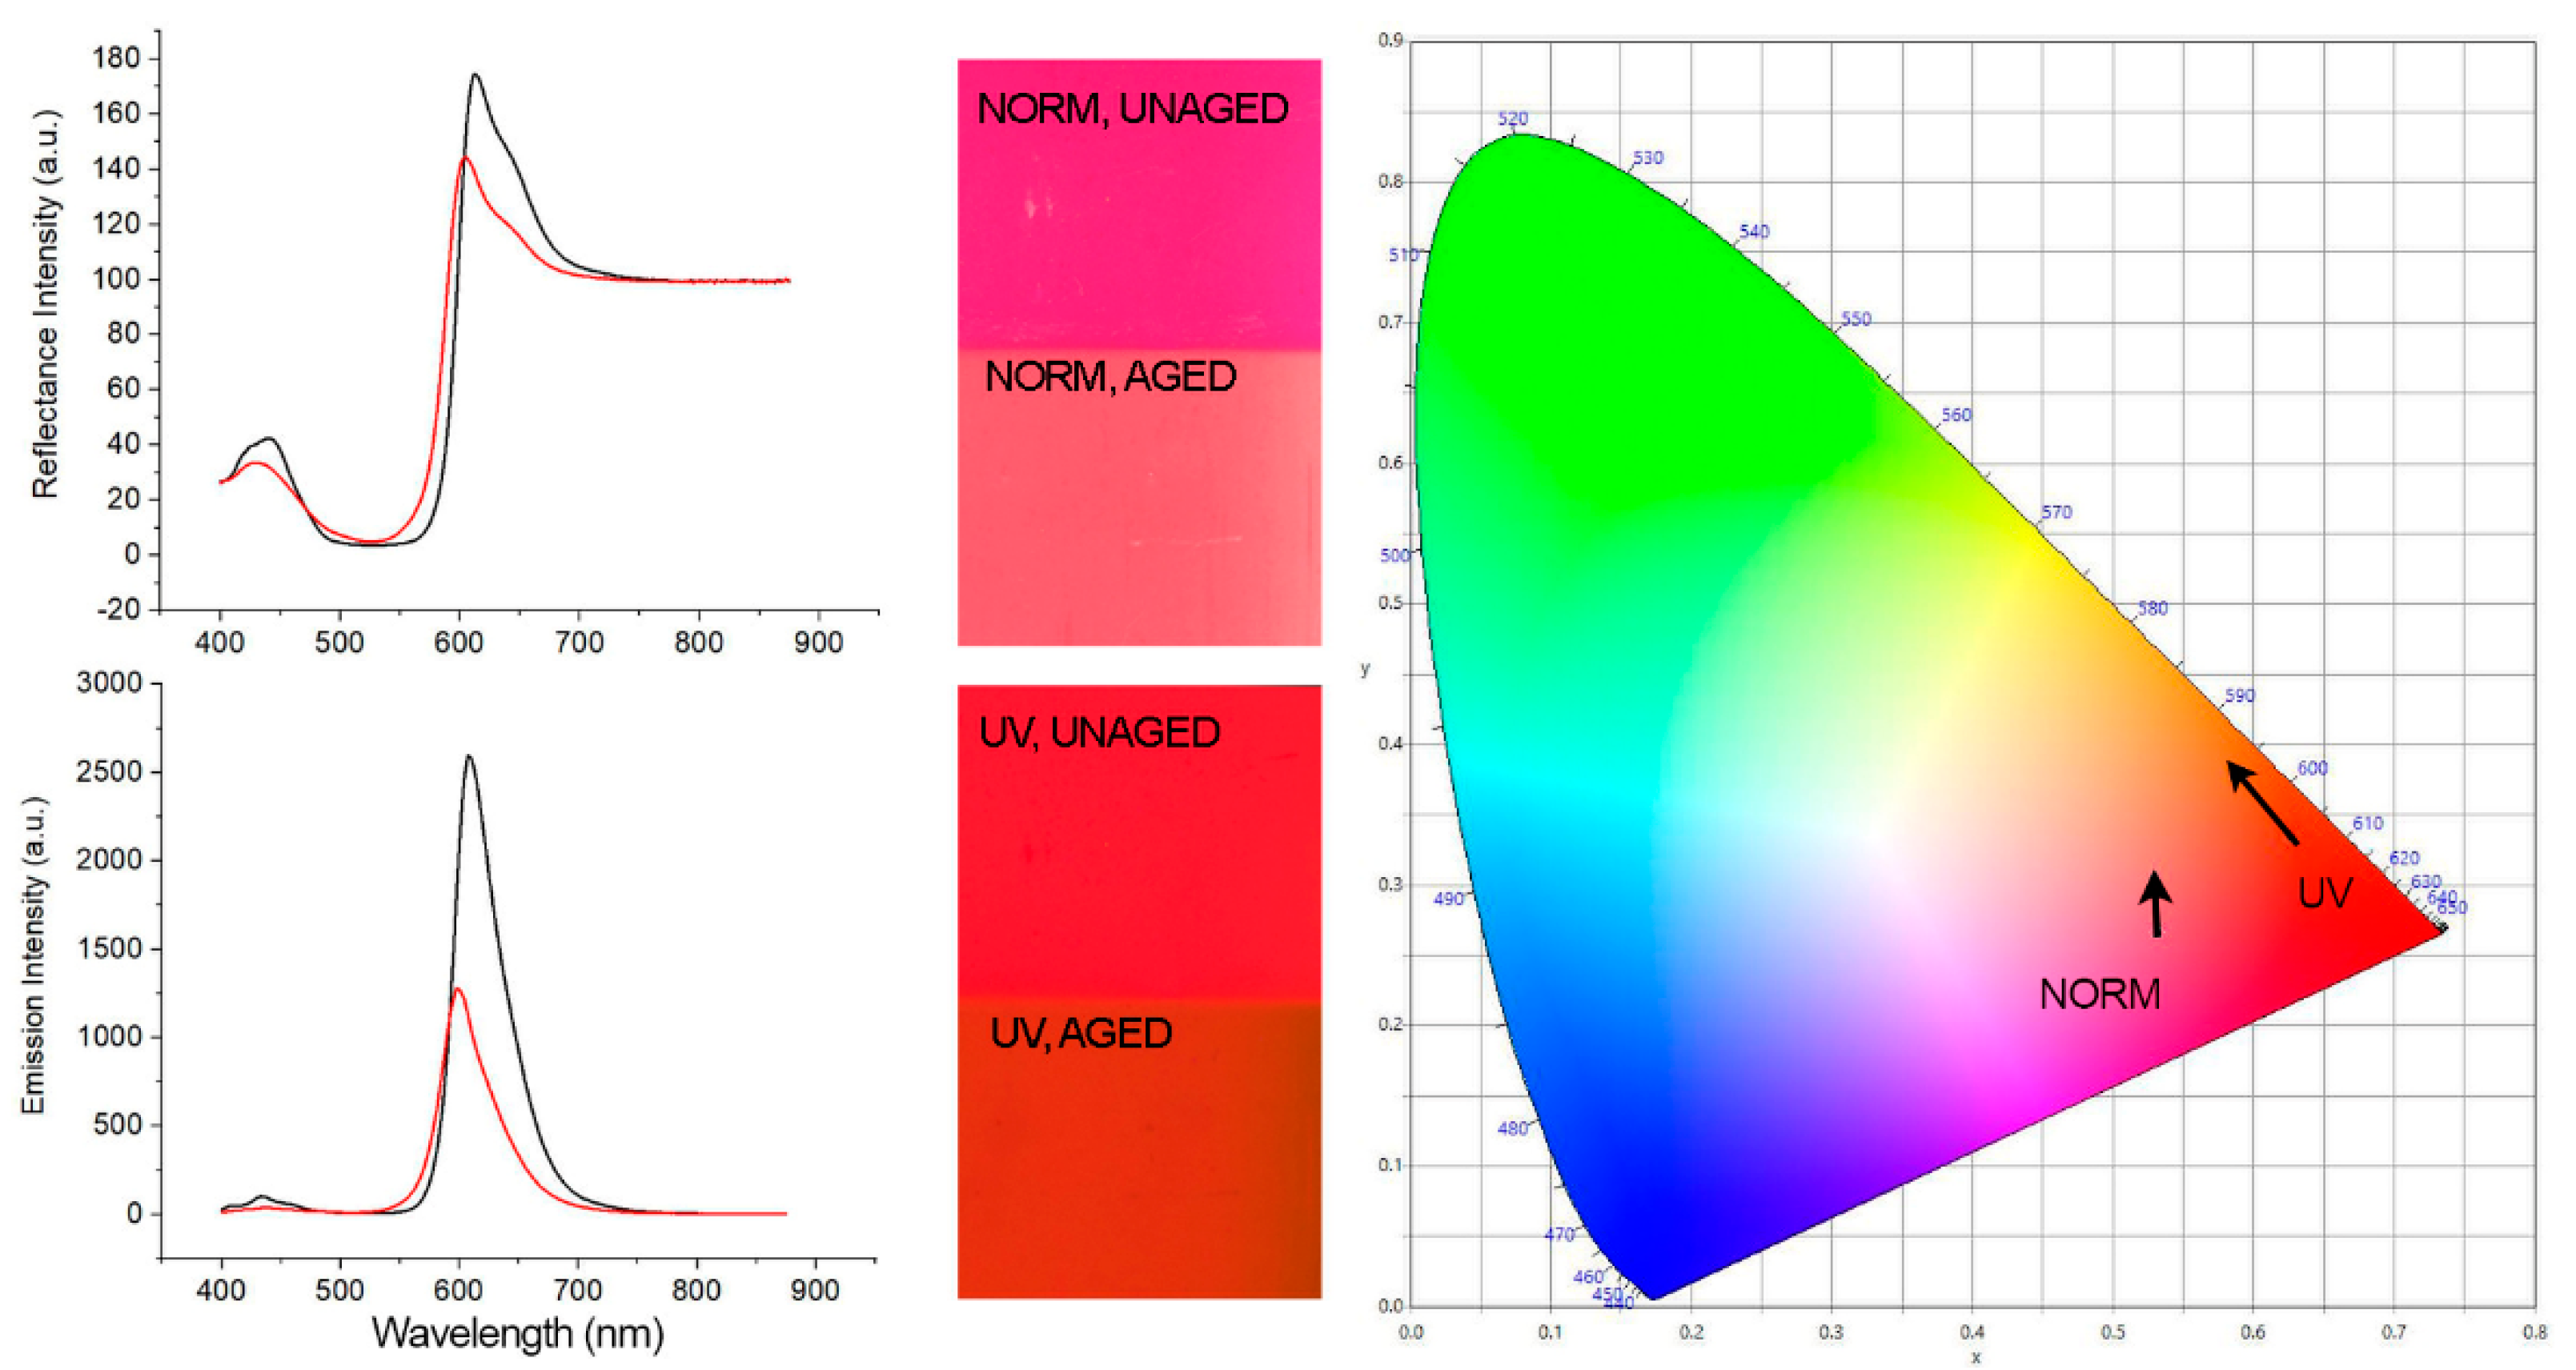
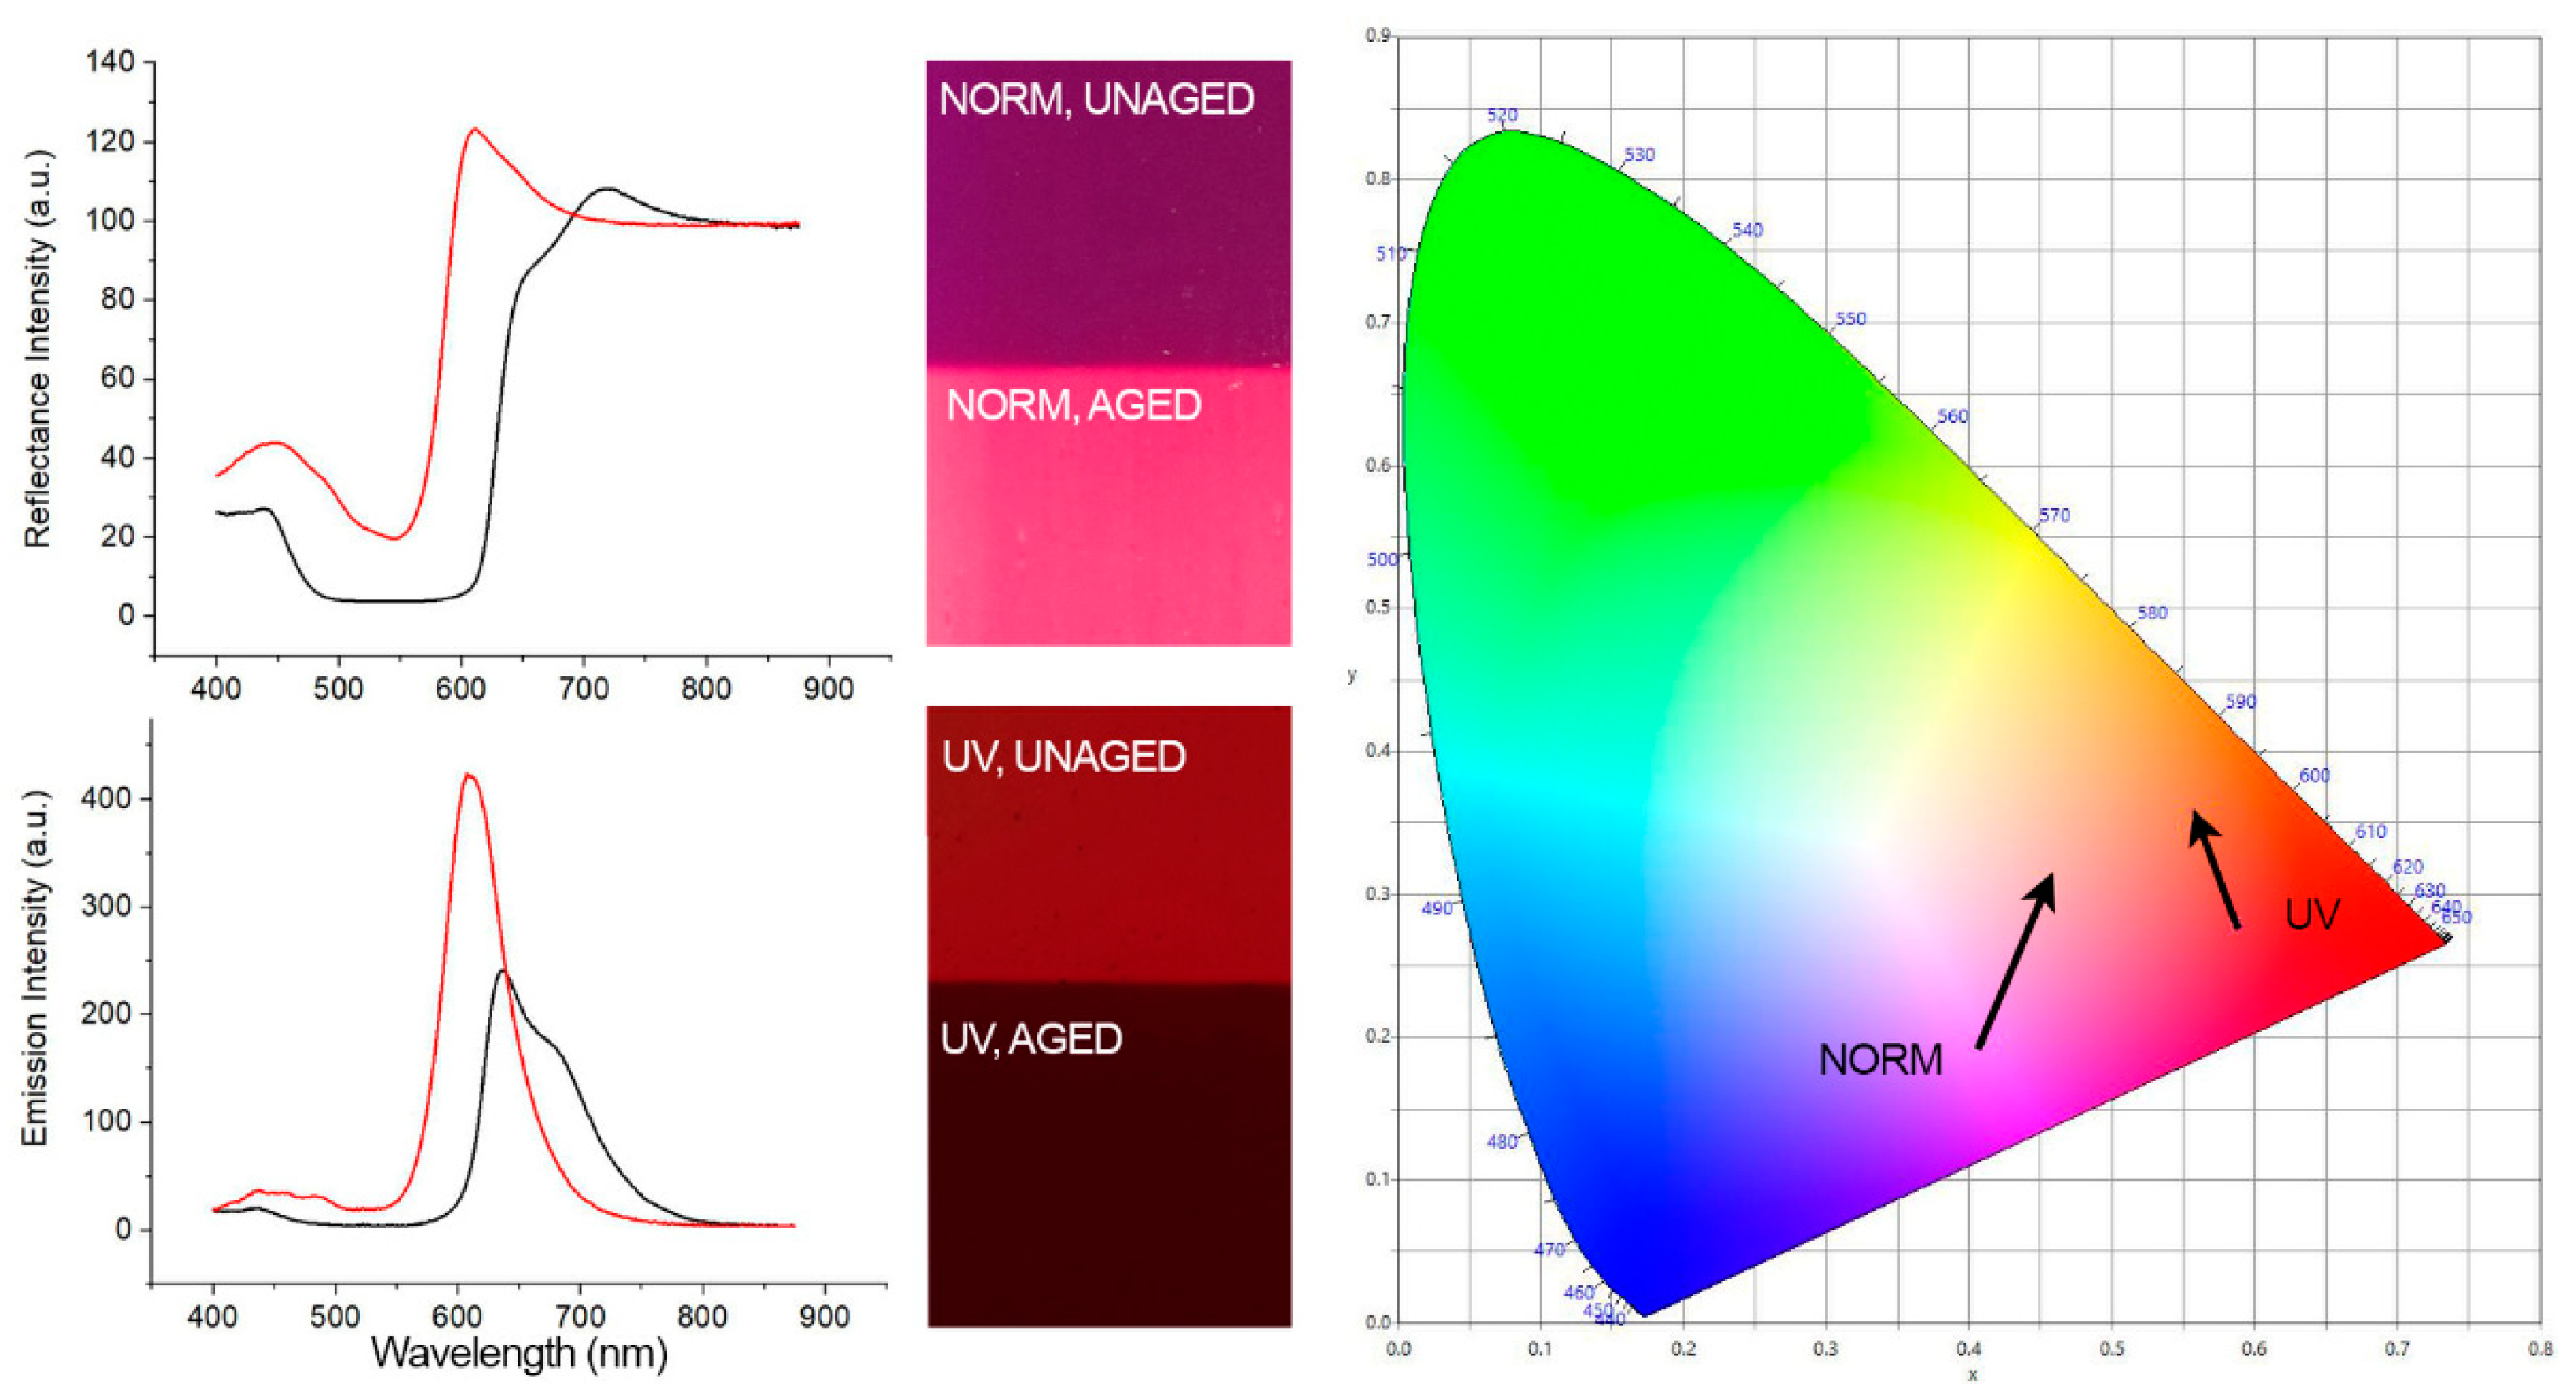
3.2. Spectroscopy Results

Fiber optic spectroscopy recorded the spectra from both the unfaded and faded paint samples. The spectral shifts and changes in the overall reflective intensity/fluorescence emission associated with each sample were determined (Table 4 and Table 5). To indicate the directional change measured, the data were plotted on a CIE 1931 (x, y) color space chromaticity diagram with the direction of color change indicated. The associated visual images of the pigments are also provided for reference (Figure 4, Figure 5, Figure 6, Supplementary Materials Figures S1–S6).
All the samples investigated showed distinct changes except for the White pigment which had no perceivable alteration under both lighting conditions. Correspondingly, all of the pigments displayed a shift in their primary peak wavelength position under both methods of illumination. Typically, there was a blue shift in the primary peak after fading, except for the Blue under full-spectrum illumination which had a red shift in the primary peak (+14 nm). The highest intensity peak for the Violet using FORS was associated with a dye having a peak emission spectrum at ~720 nm. The unknown dye is more fugitive than other components, and after aging, both the UV illumination fiber optic spectroscopy and FORS showed no measurable peak present. For this sample, the peak associated with the highest intensity after fading was used for measuring the total spectral shift in the sample. In all other cases, the peak shift was less than 20 nm, and the overall spectral alteration was significant. The largest spectral shift occurred in the Violet, while other than White (which exhibited no discernable shift), the smallest shift was in the Green (−3 nm under full-spectrum illumination, and −5 nm under UV illumination).
In addition to the shift in the peak position, a clear change in intensity was measured. In most cases, there was a noticeable decrease measured; however, for both the Violet and Green illuminated with UV, the intensity increased, indicating a brightening of the pigment during aging. This could also indicate that the transparency increased or an opacifying agent used reduced in effectiveness, resulting in the white background of the ceramic tile having an increased effect on the spectra. The resulting spectra and CIE 1931 (x, y) color space chromaticity diagrams were compared to the MMI results, quantifying the intensity and color shifts that were captured by the camera (Figure 4, Figure 5, Figure 6, Supplementary Materials Figures S1–S6).

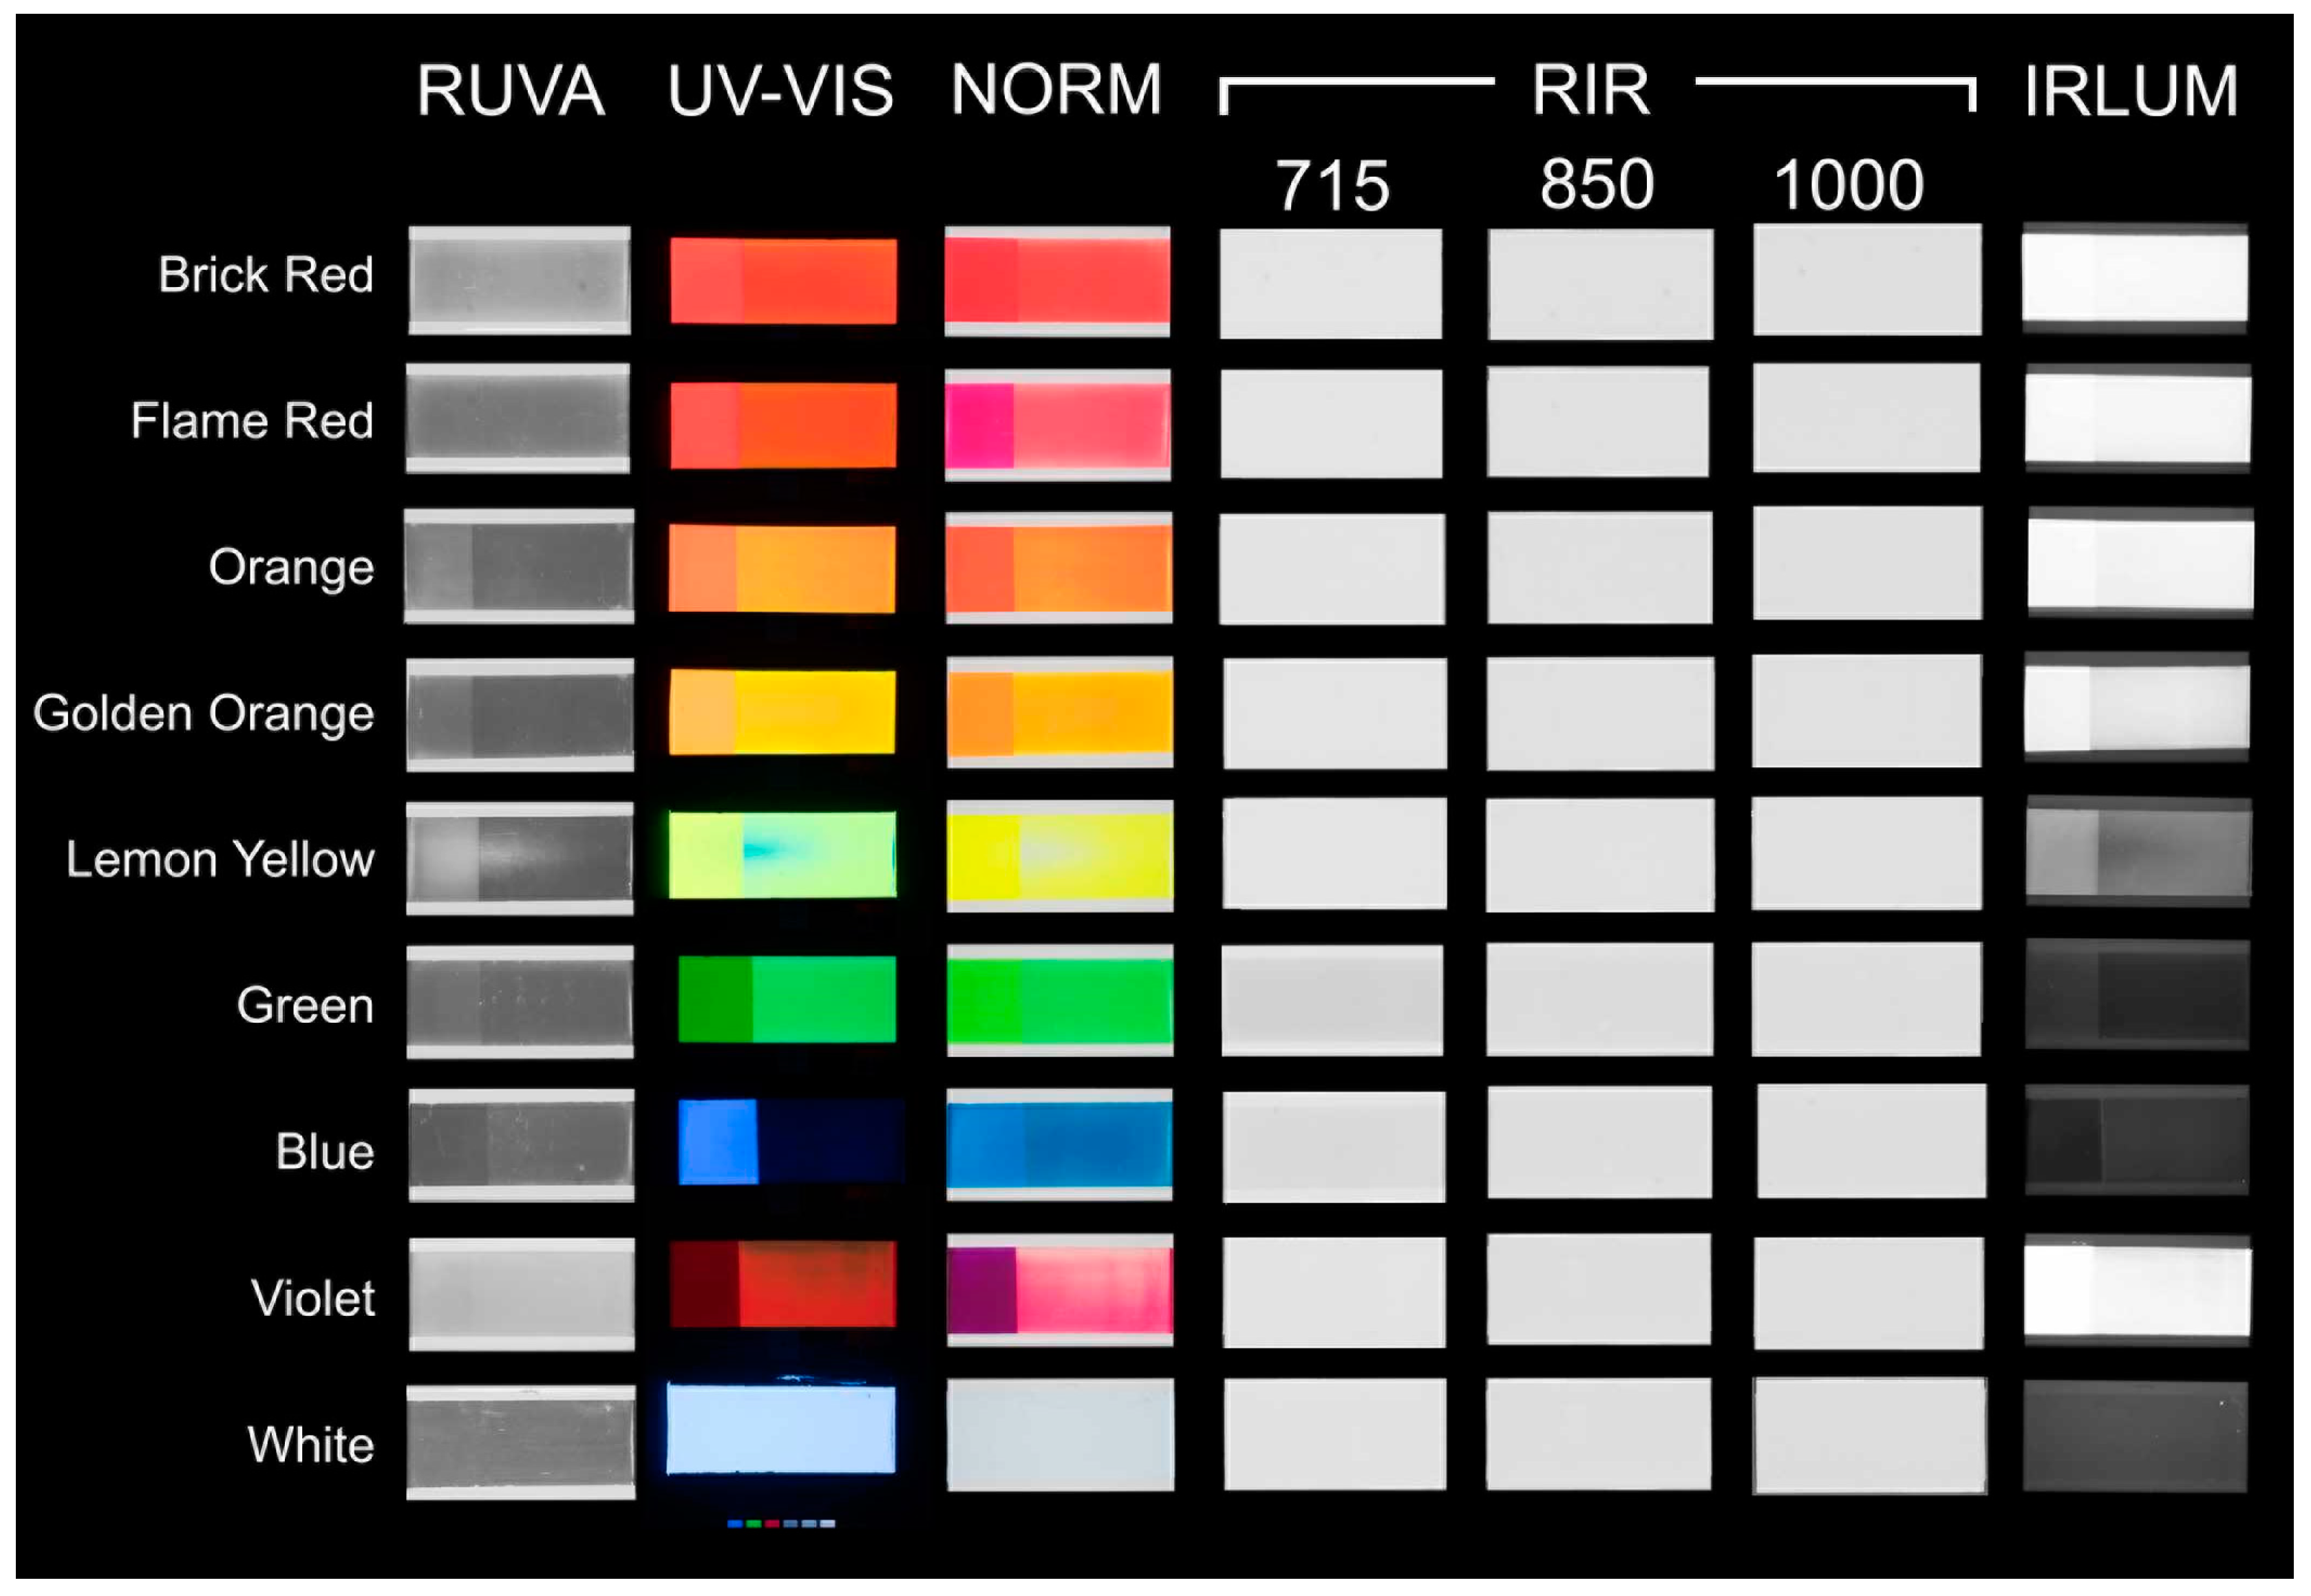
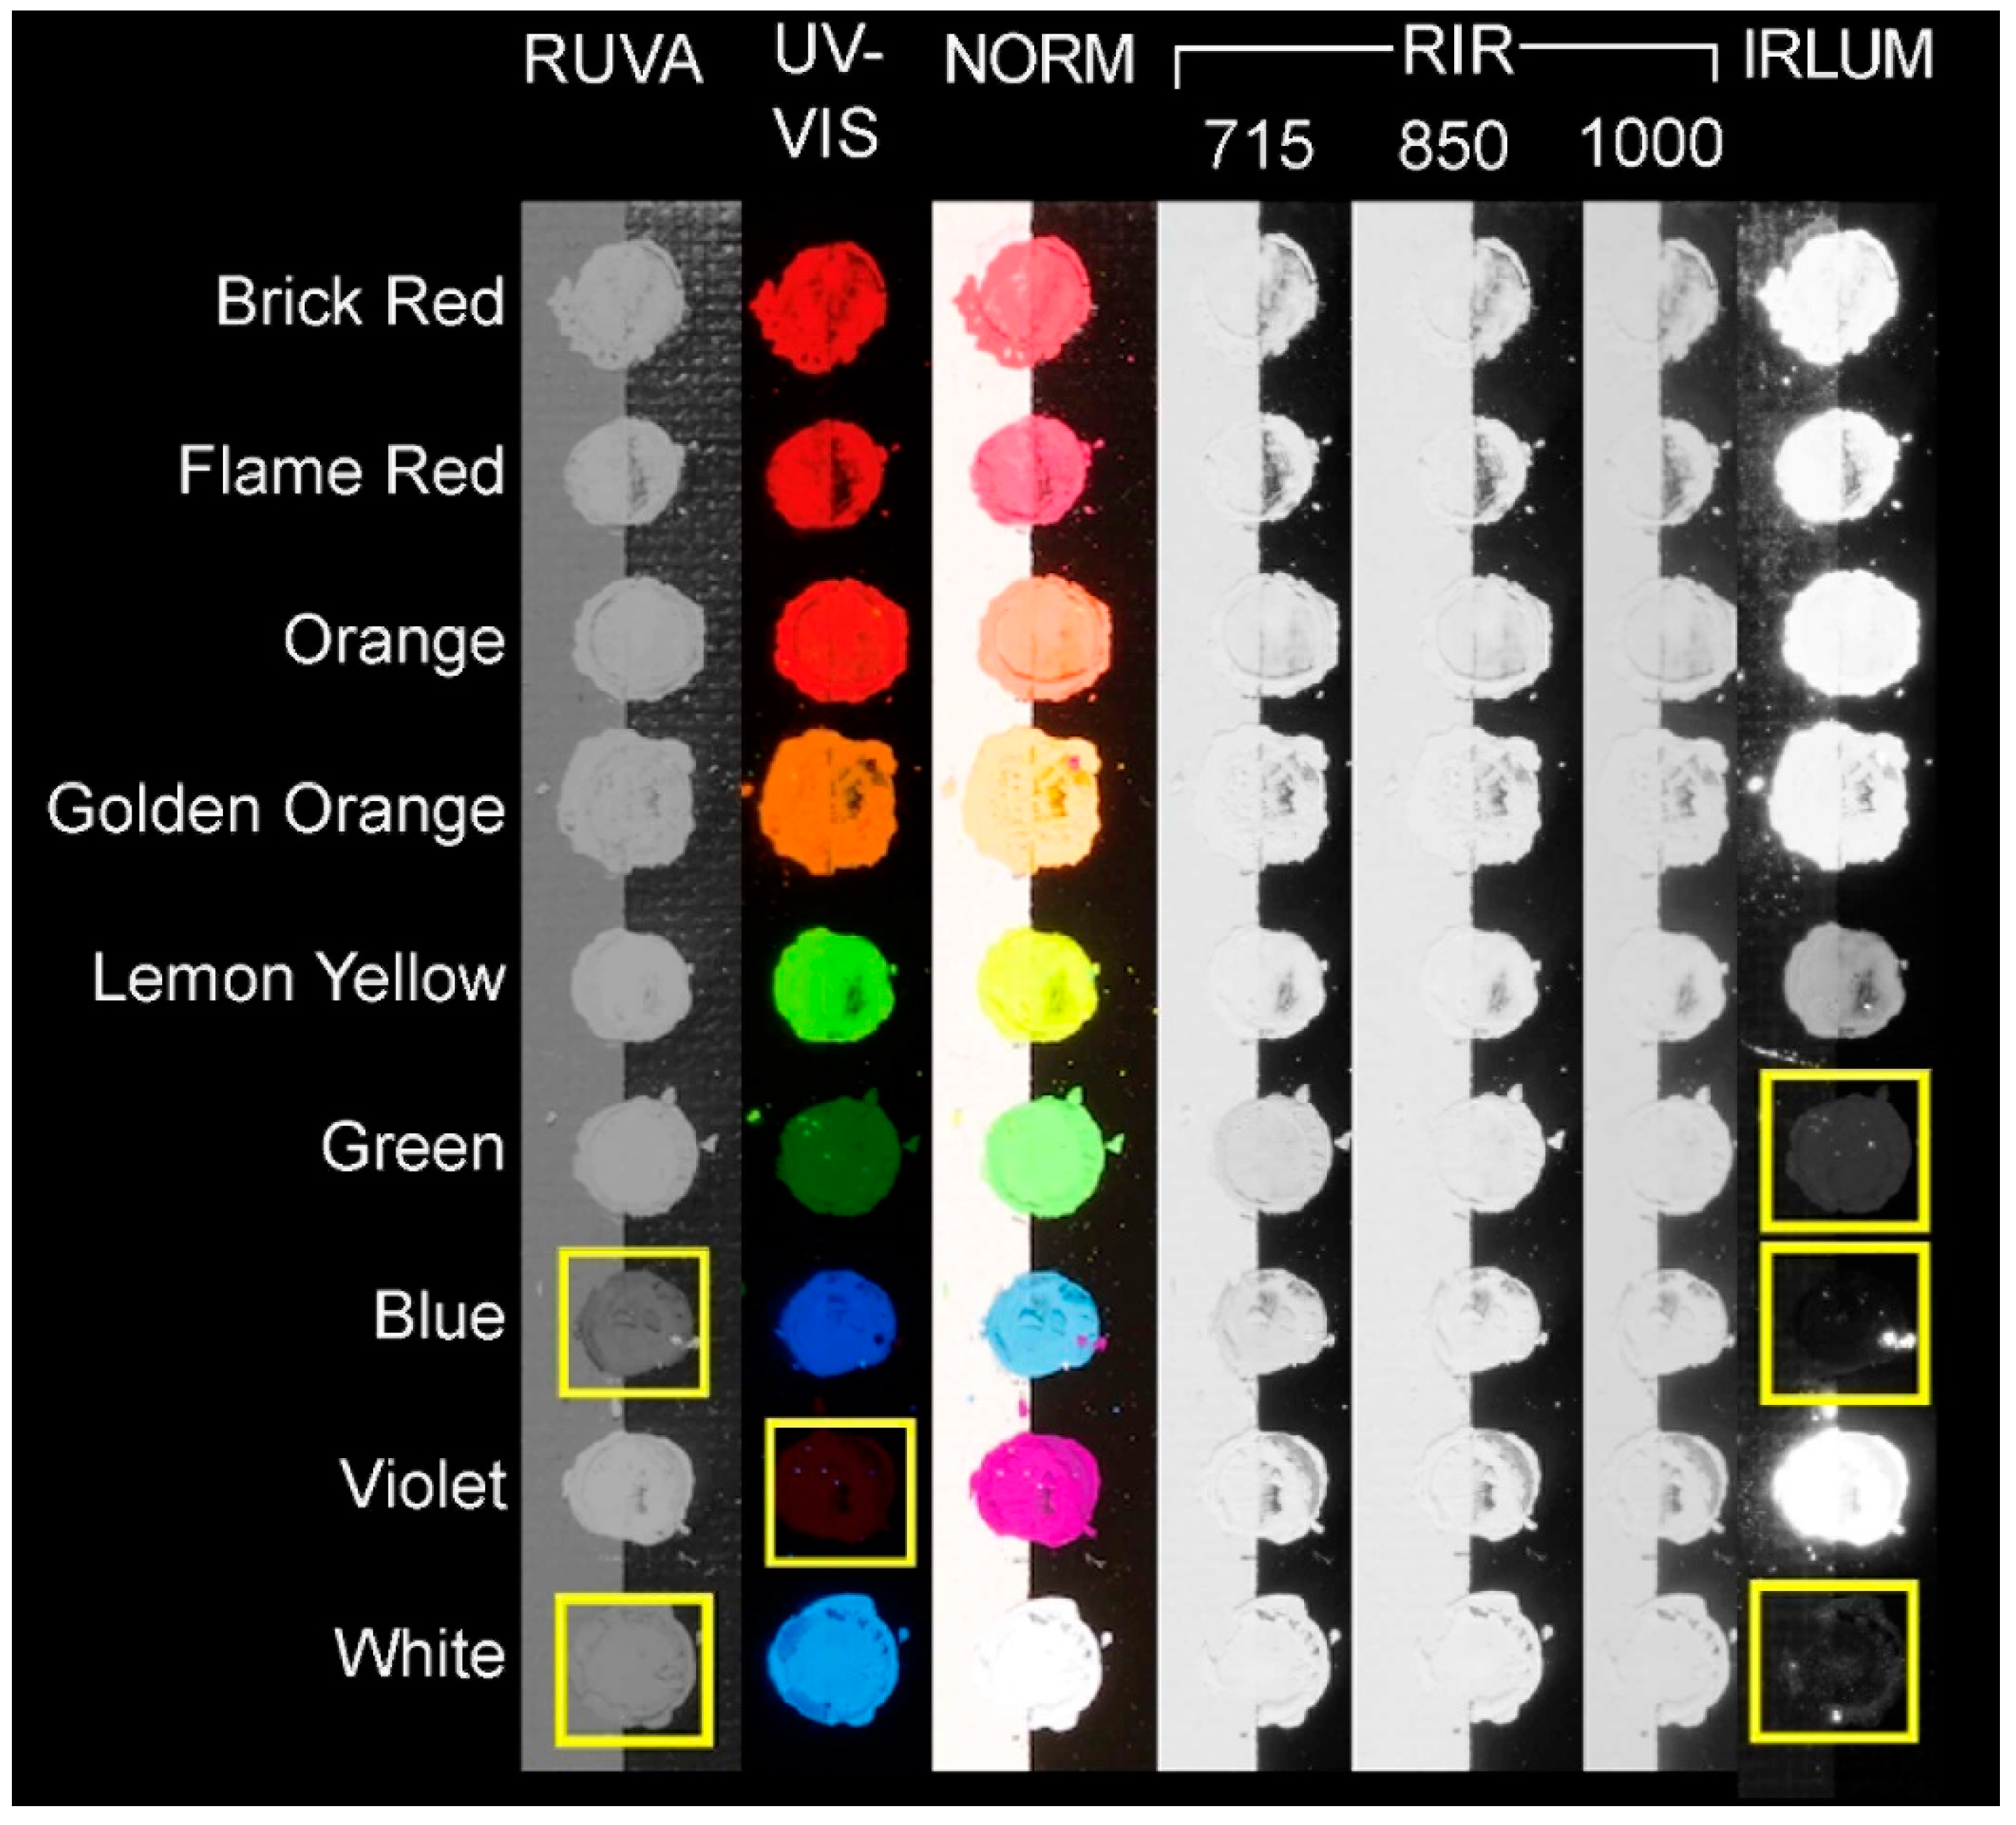
3.3. Imaging Results

3.3.1. Normal Illumination

Imaging under normal illumination revealed fading and loss of fluorescence in the aged samples. This was visually perceptible in all samples, except for the White (Figure 7).
The White did not exhibit any changes. The aged Green exhibited darkening due to the initial loss of fluorescence that occurs upon aging, causing the paint to appear darker before it later fades. This is consistent with observations noted in previous research [10,11]. The aged Violet exhibited dramatic fading and a shift in color upon aging. The binderless unaged samples exhibited similar results to the unexposed samples with a binder (Figure 8). In areas where the pigment was thinner, the black background of the binderless samples could be seen.

3.3.2. UV-Induced Visible Fluorescence

The UV–Vis imaging results indicate that the Brick Red, Flame Red, Orange, Golden Orange, Lemon Yellow, and White initially exhibited vibrant UV–Vis fluorescence. The Green, Blue, and Violet exhibited less fluorescence by comparison. Upon aging, the Brick Red, Flame Red, Orange, Golden Orange, Lemon Yellow, and Blue demonstrated a decrease in their fluorescence. The Blue exhibited a dramatic reduction in UV–Vis fluorescence, appearing very dark. The Green and Violet appeared to be brighter after aging, likely due to the same preferential fading of one colorant as mentioned previously. Finally, the White remained the same (Figure S6). Sobeck et al. [10] reported that the Violet in the Kremer pigment line contains an unknown dye in addition to the same dyes (although in varying amounts) found in the Flame Red, Brick Red, Orange, and Golden Orange. One possibility for the increase in the Violet UV–Vis fluorescence after aging is the preferential fading of one of the dye components or fading related to the unknown dye, as seen in the FORS analysis.

3.3.3. Reflected Ultraviolet Imaging

The RUVA imaging results indicate that the Blue and White exhibited less reflected UVA than all other pigments (Figure 7 and Figure 8). This was most noticeable in the unaged dry pigments. The Orange, Golden Orange, Lemon Yellow, and Green exhibited less reflected UVA upon aging. The Blue exhibited an increase in reflectance upon aging. The Brick Red, Flame Red, Violet, and White exhibited minimal change in RUVA before and after aging.

3.3.4. Reflected Infrared Imaging

RIR revealed that all samples (with and without a binder, aged and unaged) exhibited similar infrared reflectance at the 715 nm, 850 nm, and 1000 nm wavelengths (Figure 7 and Figure 8). At 715 nm, a slight absorption was noted in the Green and Blue samples, indicated by a slightly gray shading in the RIR image (Figure 8). Though not prominent, this could be related to the inclusion of phthalo pigments in the composition of the colorants, as phthalo blue and phthalo green exhibit less absorption and more reflectance at higher wavelengths [18].

3.3.5. Infrared Luminescence Imaging

IRLUM imaging recorded some differences in the spectral responses of the pigments. Notably, the Green, Blue, and White exhibited very weak luminescence. The Lemon Yellow exhibited weak luminescence. The Brick Red, Flame Red, Orange, Golden Orange, Lemon Yellow, and Violet all exhibited strong infrared luminescence, with the Violet exhibiting the strongest. In comparing the infrared luminescence of the pigments with the known dyes in the literature, the pigments that luminesce strongly also contain the three rhodamine dyes SRB, R6GD, and R3B. The Lemon Yellow is not composed of the same dyes, containing instead SY172, and it exhibited weak infrared luminescence (Figure 7 and Figure 8).

3.4. Conservation Implications

MMI and fiber optic spectroscopy results highlight the problems in considering conservation documentation and treatment. The thickness of the paint film and the concentration of the fluorescent colorants can affect the resulting reflectance, particularly where more than one dye colorant is used to achieve the final enriched color, as discussed by Conners-Rowe et al. [24]. Both the fiber optic spectroscopy results and the MMI reflect the specific concentration of the pigment and the thickness of the paint film used in the custom-prepared samples. Fiber optic spectroscopy analysis provides some indication as to the direction of fading and, when combined with CIE diagrams, can give an indication as to the potential future color shift. Artists custom mixing their own combinations of fluorescent paints with or without additional non-fluorescing artists’ materials will invariably change how the overall paint films change in color and spectral response.
Adaptations may be required to accurately image the fluorescent colorants, beyond the current imaging processing standards available for use in conservation. Thorough documentation of the implementation of any such adjustments is recommended regardless to accurately reproduce before-and-after images of artwork. The adjustment of the exposure time was used in this study to reduce the overexposure caused by the intense fluorescence which would render the image data useless. The RIR (850 nm and 1000 nm) and IRLUM imaging results are also useful for conservation, as the colorants have not been documented this way in previous studies. The possibilities include adding a deliberately infrared-absorbing pigment or a luminescing/non-luminescing pigment to areas of inpainting, effectively tagging the area of compensation to create a means of differentiating areas of inpainting from original materials by imaging. For example, chrome yellow does not luminesce, while cadmium yellows luminesce, yet they exhibit the same yellow tone in UV–Vis fluorescence [31]. The RIR results are particularly useful, being uniform across the range of fluorescent pigments, so an added infrared-absorbing material would be readily discernible upon imaging. A preliminary experiment was conducted by the authors using the Lemon Yellow, carbon black, and RIR imaging. Figure 9 shows the images of the test both under normal illumination and using RIR imaging.
The preliminary test indicated that an absorbing material such as carbon black can be easy to add and is easily identifiable in the RIR image; however, it is also readily apparent in normal viewing conditions. In the case where a color match is required such as when mimetic inpainting is the desired outcome, a more detailed study is required to achieve a proper color in normal viewing conditions as well as under UV radiation. Documentation and compensation for loss are critical in conservation, yet as this study reveals, they are particularly problematic for artworks where fluorescent colorants are used.

4. Conclusions

MMI and fiber optic spectroscopy provide a better understanding of the behavior of fluorescent colorants and the problems associated with documenting and with conservation treatment. The fiber optic spectroscopy results provide possible ways to predict the direction of the color shift as the pigments fade, shifting towards warmer or cooler tones, and to quantify the results obtained by imaging. Regardless of the exposure time adjustments required for imaging, fiber optic spectroscopy clearly determined the characteristic spectral peak changes that occurred. Plotting the resulting spectra on a CIE 1931 (x, y) color space chromaticity diagram suggests the potential overall color change due to fading. MMI identified the absorption and reflectance of the colorants in the regions of the spectrum from RUVA, UV–Vis, NORM, RIR, and IRLUM. Particularly useful are the results observed using RIR and IRLUM. The reflectance and luminescence properties could be exploited in conservation treatment or for documentation purposes. One possibility could include tagging inpainting, although such a study is only preliminary. This study provides unique spectral and imaging information that serves to better the understanding of fluorescent materials used in artwork, and highlights the difficulties related to documentation and preservation. It serves to inform conservation practices and reveals the need for continued future study of fluorescent artists’ materials.

Supplementary Materials

The following supporting information can be downloaded at: https://www.mdpi.com/article/10.3390/colorants1020013/s1, 1—Figures S1–S6, 2—Raw Data File.

Author Contributions

Conceptualization, F.B.; methodology, F.B. and A.S.; software, F.B. and A.S.; validation, F.B. and A.S.; formal analysis, F.B. and A.S.; investigation, F.B. and A.S.; data curation, F.B. and A.S.; writing—original draft preparation, F.B.; writing—review and editing, F.B. and A.S. All authors have read and agreed to the published version of the manuscript.

Funding

This research received no external funding.

Institutional Review Board Statement

Not applicable.

Informed Consent Statement

Not applicable.

Data Availability Statement

Not applicable.

Acknowledgments

The authors wish to extend their thanks to Glennis Rayermann for her assistance with the fiber optic spectroscopy, Rebecca Ploeger for her assistance with the Q-Lab Aging Chamber, associate Jiuan Jiuan Chen for her assistance and expertise in the imaging and for establishing the imaging protocols, Nicole Schmidt for conducting the initial fiber optic spectroscopy tests, and Kate Aguirre for her assistance with imaging.

Conflicts of Interest

The authors declare no conflict of interest.

References

  1. DayGlo Color Corp. It’s Color. Only Better. Available online: https://www.dayglo.com/ (accessed on 27 January 2022).
  2. Lindblom, K. DayGlo Fluorescent Pigments: Brighter, Longer Lasting Color; American Chemical Society, Office of Communications, National Historic Chemical Landmarks: Washington, DC, USA, 2012.
  3. Baker, T.T. Fluorescent inks and paints. J. R. Soc. Arts 1951, 99, 763–776. [Google Scholar]
  4. Sexton, J.M.; Messier, P.; Chen, J.J.; Messier, J.M.S.P.; Chen, J.J. Development and Testing of a Fluorescence Standard for Documenting Ultraviolet Induced Visible Fluorescence. In Proceedings of the 42nd Annual Meeting of the American Institute for Conservation, San Francisco, CA, USA, 31 May 2014; pp. 28–31. [Google Scholar]
  5. Tsang, J.; Eleni Pinchin, S.; Almond, K.; Tumosa, C.S. Conservation of Murals in the Alameda Theatre: Reviving Former Cutting-Edge Fluorescent Paint and Black-Light Technology. Stud. Conserv. 2004, 49, 185–188. [Google Scholar] [CrossRef]
  6. Beckett, F.; Holden, A.; Smith, G.D. Seeing the Light: Conservation and Exhibition of a 1980s Day-Glo Painted Leather Jacket. In Proceedings of the AIC 43th Annual Meeting, Miami, FL, USA, 14 May 2015. [Google Scholar]
  7. De Winter, S. The Day Day-Glo Loses Its Glo (w): An Interdisciplinary Approach in Conserving Artworks Containing Daylight Fluorescent Paints. In Proceedings of the AIC 46th Annual Meeting, Houston, TX, USA, 1 June 2018. [Google Scholar]
  8. Kremer Pigmente GmbH & Co Daylight Fluorescent Pigments. Available online: https://shop.kremerpigments.com/us/shop/pigments/pearlescent-effect-pigments/daylight-fluorescent-pigments/ (accessed on 20 January 2022).
  9. Streitel, S.G. Fluorescent Pigments (Daylight). In Kirk-Othmer Encyclopedia of Chemical Technology; John Wiley & Sons, Ltd.: Hoboken, NJ, USA, 2009; pp. 1–25. ISBN 978-0-471-23896-6. [Google Scholar]
  10. Sobeck, S.J.S.; Chen, V.J.; Smith, G.D. Shedding Light on Daylight Fluorescent Artists’ Pigments, Part 1: Composition. J. Am. Inst. Conserv. 2021, 1–19. [Google Scholar] [CrossRef]
  11. Beckett, F.; Holden, A.; Smith, G.D. Seeing the Light: Research, Conservation and Exhibition of a 1980s Daylight Fluorescent Painted Leather Jacket Designed by Sprouse and Painted by Castronovo. J. Am. Inst. Conserv. 2019, 58, 233–247. [Google Scholar] [CrossRef]
  12. Hinde, E.; Nel, P.; Sloggett, R.; Roberts, A. Fluorimetric Analysis of the Constituent Dyes within Daylight Fluorescent Pigments: Implications for Display and Preservation of Daylight Fluorescent Artwork. J. Am. Inst. Conserv. 2013, 52, 97–106. [Google Scholar] [CrossRef]
  13. Fremout, W.; Saverwyns, S. Characterization of Daylight Fluorescent Pigments in Contemporary Artists’ Paints by Raman Spectroscopy. In Proceedings of the 11th Infrared and Raman Users Group Conference, Museum of Fine Arts, Boston, MA, USA, 5–7 November 2014; p. 39. [Google Scholar]
  14. Boscacci, M.; Francone, S.; Galli, K.; Bruni, S. The Brightest Colors: A Fourier-Transform Raman, Surface-Enhanced Raman, and Thin-Layer Chromatography-Surface-Enhanced Raman Spectroscopy Study of Fluorescent Artists’ Paints. J. Raman Spectrosc. 2020, 51, 1108–1117. [Google Scholar] [CrossRef]
  15. Campanella, B.; Botti, J.; Cavaleri, T.; Cicogna, F.; Legnaioli, S.; Pagnotta, S.; Poggialini, F.; Poli, T.; Scalarone, D.; Palleschi, V. The Shining Brightness of Daylight Fluorescent Pigments: Raman and SERS Study of a Modern Class of Painting Materials. Microchem. J. 2020, 152, 104292. [Google Scholar] [CrossRef]
  16. Francone, S.; Bruni, S.; Zaffino, C.; Galli, K.; Guglielmi, V.; Boscacci, M. The Issue of Metamerism in Mario Agrifoglio’s Paintings. Identification of Fluorescent Pigments through Raman Spectroscopy to Define a Methodology for Retouching. Postprints RECH4 Croatia 2017, 212–217. [Google Scholar]
  17. Longoni, M.; Cicala, N.; Guglielmi, V.; Poldi, G.; Bruni, S. The Art of Everyday Objects: A Non-Invasive In Situ Investigation of Materials and Techniques of Italian Pop Art Paintings on Aluminium. Heritage 2022, 5, 3. [Google Scholar] [CrossRef]
  18. Cosentino, A. Identification of Pigments by Multispectral Imaging; A Flowchart Method. Herit. Sci. 2014, 2, 8. [Google Scholar] [CrossRef] [Green Version]
  19. Castro, K.; Pérez-Alonso, M.; Rodríguez-Laso, M.D.; Fernández, L.A.; Madariaga, J.M. On-Line FT-Raman and Dispersive Raman Spectra Database of Artists’ Materials (e-VISART Database). Anal. Bioanal. Chem. 2005, 382, 248–258. [Google Scholar] [CrossRef] [PubMed]
  20. Festa, G.; Scatigno, C.; Armetta, F.; Saladino, M.L.; Ciaramitaro, V.; Nardo, V.M.; Ponterio, R.C. Chemometric Tools to Point Out Benchmarks and Chromophores in Pigments through Spectroscopic Data Analyses. Molecules 2022, 27, 163. [Google Scholar] [CrossRef] [PubMed]
  21. Hochleitner, B.; Desnica, V.; Mantler, M.; Schreiner, M. Historical Pigments: A Collection Analyzed with X-Ray Diffraction Analysis and X-ray Fluorescence Analysis in Order to Create a Database. Spectrochim. Acta Part B At. Spectrosc. 2003, 58, 641–649. [Google Scholar] [CrossRef]
  22. Sobeck, S.J.S.; Smith, G.D. Shedding Light on Daylight Fluorescent Artists’ Pigments, Part 2: Spectral Properties and Light Stability. J. Am. Inst. Conserv. 2022, 1–17. [Google Scholar] [CrossRef]
  23. Golden Artist Colors, Inc. Available online: https://www.goldenpaints.com/products/colors/fluorescent---phosphorescent-colors (accessed on 24 January 2022).
  24. Connors-Rowe, S.A.; Morris, H.R.; Whitmore, P.M. Evaluation of Appearance and Fading of Daylight Fluorescent Watercolors. J. Am. Inst. Conserv. 2005, 44, 75–94. [Google Scholar] [CrossRef]
  25. Hinde, E.; Nel, P. A Novel Technique for the Photography of Daylight Fluorescent Artwork. In Proceedings of the ICOM Committee for Conservation, ICOM-CC, 15th Triennial Conference, New Delhi, India, 22–26 September 2008; Volume 1, pp. 475–483. [Google Scholar]
  26. Ellis, M.H.; Chao, E. Daylight Fluorescent Colors as Artistic Media. In The Broad Spectrum: Studies in the Materials, Techniques, and Conservation of Color on Paper; Archetype Publications: London, UK, 2002; pp. 160–166. [Google Scholar]
  27. UV InnovationsTM: Ultraviolet Photography Standards. Available online: https://www.uvinnovations.com (accessed on 20 January 2022).
  28. Whitmore, P.M.; Pan, X.; Bailie, C. Predicting The Fading of Objects: Identification of Fugitive Colorants Through Direct Nondestructive Lightfastness Measurements. J. Am. Inst. Conserv. 1999, 38, 395–409. [Google Scholar] [CrossRef]
  29. Ploeger, R.; Shugar, A.; Smith, G.D.; Chen, V.J. Late 19th Century Accounts of Indian Yellow: The Analysis of Samples from the Royal Botanic Gardens, Kew. Dyes Pigments 2019, 160, 418–431. [Google Scholar] [CrossRef]
  30. Chen, J.J.; Smith, T.J. Documentation of Salted Paper Prints with a Modified Digital Camera. J. Am. Inst. Conserv. 2020, 59, 271–285. [Google Scholar] [CrossRef]
  31. Bridgman, C.F.; Gibson, H.L. Infrared Luminescence in the Photographic Examination of Paintings and Other Art Objects. Stud. Conserv. 1963, 8, 77–83. [Google Scholar] [CrossRef]
  32. Kakoulli, I.; Radpour, R.; Lin, Y.; Svoboda, M.; Fischer, C. Application of Forensic Photography for the Detection and Mapping of Egyptian Blue and Madder Lake in Hellenistic Polychrome Terracottas Based on Their Photophysical Properties. Dyes Pigments 2017, 136, 104–115. [Google Scholar] [CrossRef]
  33. Dayglo Radiant Color, Manufacturer of Daylight Fluorescent Pigments. Available online: http://test.dayglo.com/radiant/company/about-radiant-color/ (accessed on 20 January 2022).
  34. Picollo, M.; Stols-Witlox, M.; Fuster-López, L. (Eds.) Introduction to the Volume. In UV-Vis Luminescence Imaging Techniques; CONSERVATION 360°; Editorial; Universitat Politècnia de València: Valencia, Spain, 2019; pp. 11–18. [Google Scholar]
  35. ASTM D4303-06; Standard Test Methods for Light Fastness of Colorants Used in Artists’ Materials. Micom Laboratories: Dorval, QC, Canada, 2006.
  36. Feller, R.L.; Johnston-Feller, R.M. Use of the International Standards Organization’s Blue-Wool Standards for Exposure to Light. I. Use as an Integrating Light Monitor for Illumination under Museum Conditions. In Proceedings of the Preprints of Papers Presented at the Sixth Annual Meeting of the American Institute for Conservation, Fort Worth, TX, USA, 1–4 June 1978; pp. 73–80. [Google Scholar]
  37. Picollo, M.; Bacci, M.; Casini, A.; Lotti, F.; Porcinai, S.; Radicati, B.; Stefani, L. Fiber Optics Reflectance Spectroscopy: A Non-Destructive Technique for the Analysis of Works of Art. In Optical Sensors and Microsystems; Springer: Berlin/Heidelberg, Germany, 2002; pp. 259–265. [Google Scholar]
  38. Warda, J.; Frey, F.; Heller, D.; Kushel, D.; Vitale, T.; Weaver, G. Digital Imaging Workflow for Treatment Documentation. AIC Guide to Digital Photography and Conservation Documentation, 3rd ed.; AIC: Washington, DC, USA, 2017. [Google Scholar]
  39. Kushel, D. Photographic Techniques for Conservation. In AIC Guide to Digital Photography and Conservation Documentation; Warda, J., Frey, F., Heller, D., Kushel, D., Vitale, T., Weaver, G., Eds.; AIC: Washington, DC, USA, 2011. [Google Scholar]
  40. Chen, J.J.; Ersenkal, A.; Walters, G. Characterizing Different UVA Lamps. In Proceedings of the AIC 47th Annual Meeting, Uncasville, CT, USA, 16 May 2019. [Google Scholar]
  41. McGlinchey Sexton, J.; Messier, P. Permanence of the Target-UVTM and UV-GrayTM 2015. Available online: https://www.uvinnovations.com/_files/ugd/750e25_77a29ae0fb3a459b9fe83189272b9bf1.pdf (accessed on 20 May 2022).
Figure 1. Daylight fluorescent pigments from Kremer in powder form, imaged with normal illumination against a whitebox.
Colorants 01 00013 g001
Figure 2. UV-induced visible fluorescence images of the same sample of Golden Orange with the only difference being the exposure time (0.5 s left; 1.3 s right).
Colorants 01 00013 g002
Figure 3. Sample preparation of the Kremer Fluorescent Orange (left) and all nine pigments (right) in Golden Acrylic Matte Medium prepared on white ceramic tiles.
Colorants 01 00013 g003
Figure 4. (Left) Spectra of Kremer Flame Red unaged (black line) and aged (red line) showing a visible-induced spectral shift and UV-induced (λ exc. = 365 nm) spectral shift. (Center) Corresponding images of the samples realized using an RGB imaging system as described in the imaging section. (Right) CIE 1931 (x, y) color space chromaticity diagram detailing the visual color changes indicated by the direction of arrows.
Colorants 01 00013 g004
Figure 5. (Left) Spectra of Kremer Orange unaged (black line) and aged (red line) showing a visible-induced spectral shift and UV-induced (λ exc. = 365 nm) spectral shift. (Center) Corresponding images of the samples realized using an RGB imaging system as described in the imaging section. (Right) CIE 1931 (x, y) color space chromaticity diagram detailing the visual color changes indicated by the direction of arrows.
Colorants 01 00013 g005
Figure 6. (Left) Spectra of Kremer Violet unaged (black line) and aged (red line) showing a visible-induced spectral shift and UV-induced (λ exc. = 365 nm) spectral shift. (Center) Corresponding images of the samples realized using an RGB imaging system as described in the imaging section. (Right) CIE 1931 (x, y) color space chromaticity diagram detailing the visual color changes indicated by the direction of arrows.
Colorants 01 00013 g006
Figure 7. Imaging results showing tiles with fluorescent pigments arranged by imaging technique and by color (each tile consists of the unaged section on the left and the aged section on the right).
Colorants 01 00013 g007
Figure 8. Kremer dry pigments (unaged) with no binder arranged by imaging technique (including filter cut-off in nm for RIR and IRLUM) and pigment color (red to violet). Pigments exhibiting significant differences in the spectral response captured by the camera are indicated by yellow rectangles.
Colorants 01 00013 g008
Figure 9. Inpainting test using carbon black in Aquazol binder over the top of Kremer fluorescent Lemon Yellow. RIR (upper) and NORM (lower) images of the same test.
Colorants 01 00013 g009
Table 1. Summary of Kremer fluorescent colorants with known dyes and optical brighteners (after Sobeck et al. [10]).
Fluorescent ColorantKnown Dyes and Optical Brighteners
Brick Red 56300SRB, R6GD, R6G, R3B, SY172, FB 184, BP3
Flame Red 56350SRB, R6GD, R6G, R3B, SY172, FB 184, BP3
Orange 56250SRB, R6GD, R3B, SY172, FB 184, BP3
Golden Orange 56200SRB, R6GD, R6G, R3B, SY172, FB 184, BP3
Lemon Yellow 56150SY172, FB 184, BP3
Green 56100SY 172, FB 61
Blue 56050FB 61
Violet 56450SRB, R6GD, R3B, FB 61, BP3, unknown (1)
White 56000FB 184
Table 2. Summary of fiber optic spectroscopy instrumentation, settings, and data collection.
SpectroscopyExcitation
Source, Geometry
Capture and GeometryIntegration Time, ScansData Collection, Interpretation
Method 1:
FORS: Full-spectrum-induced reflectance
Ocean Insights HL-2000-HP-FSHA tungsten halogen light source Vis–NIR (400–2400 nm) fiber optic cable, 90-degree angleOcean Optics SD-2000 Fiber Optic Spectrometer using a Vis–NIR fiber optic cable, 45-degree angle1.5 ms/scan,
50 scans
Ocean Optics Oceanview software, Origin software, ColorCaculator
Method 2:
Fiber optic UV-induced fluorescence emission
Ocean Insight LSM power source 365 nm LED UV–Vis–NIR (360–2400 nm) fiber optic with BG-38 filter, 90-degree angle, run between 2 mA and 5 mAOcean Optics SD-2000 Fiber Optic Spectrometer using a Vis–NIR fiber optic cable, 45-degree angle1.5 ms/scan,
50 scans
Ocean Optics Oceanview software, Origin software, ColorCalculator
Table 3. Summary of multimodal imaging techniques, instrumentation, and settings.
TechniqueCameraLensIllumination/
Excitation Source
Filters on Lens
NORMNikon D810, modified UV–Vis–IR DSLR cameraCoastal Optics UV–Vis–IR 60 mm lens (apochromatic lens)Profoto D1 500 W electronic flash, 25° angle to copy stand surface, one on each side for balanced illuminationX-Nite CC1
UVA–VisNikon D810, modified UV–Vis–IR DSLR cameraCoastal Optics UV–Vis–IR 60 mm apochromatic lensUV Systems SuperBright UVA, peak 368 nm, 45° angle to copy stand surface, one on each side for balanced illuminationKodak 2E + PECA 918 + X-Nite CC1
RUVANikon D810, modified UV–Vis–IR DSLR cameraCoastal Optics UV–Vis–IR 60 mm apochromatic lensUV Systems SuperBright UVA, peak 368 nm, 45° angle to copy stand surface, one on each side for balanced illuminationB + W 403 and X-Nite CC1
RIRNikon D810, modified UV–Vis–IR DSLR cameraCoastal Optics UV–Vis–IR 60 mm apochromatic lensProfoto D1 500 W electronic flash, 25° angle to copy stand surface, one on each side for balanced illuminationX-Nite 715, X-Nite 850, and X-Nite 1000
IRLUMNikon D810, modified UV–Vis–IR DSLR cameraCoastal Optics UV–Vis–IR 60 mm apochromatic lens1 Powersmith 50 W LED + Schott BG38 filter (6 mm-thick), axial position to subjectX-Nite 715, X-Nite 850, and X-Nite 1000
Table 4. Summary of FORS (full-spectrum illumination) results for each pigment sample (unaged and aged): maximum intensity, percent difference (in a.u., arbitrary units), highest peak, and total shift of the highest peak.
Fluorescent Colorant Maximum Intensity in a.u. (Unaged, Aged)Percent Difference (%)Highest Peak (nm)
(Unaged, Aged)
Total Shift in nm
Brick Red 56300170−13.53619−9
147608
Flame Red 56350174−17.24613−9
144604
Orange 56250188−19.68608−10
151598
Golden Orange 56200182−19.78596−11
146585
Lemon Yellow 56150159−13.84524−11
137513
Green 56100121−11.57517−3
107514
Blue 5605083−31.3345414
57468
Violet 564508713.89652−40
123612
White 5600012304430
123443
Table 5. Summary of emission results (λexc. = 365 nm) for each pigment sample (aged and unaged): maximum intensity, percent difference (in a.u., arbitrary units), highest peak, and total shift of the highest peak.
Fluorescent Colorant
(λexc. = 365 nm)
Maximum
Intensity in a.u. (Unaged, Aged)
Percent Difference (%)~Highest Peak (nm)
(Unaged, Aged)
Total Shift in nm
Brick Red 563002850−42.95615−8
1626607
Flame Red 563502592−50.81608−9
1275599
Orange 562503049−22.20604−13
2372591
Golden Orange 562003788−11.77591−18
3342573
Lemon Yellow 56150
Aged (3 mA *)
3620−19.17520−19
2926501
Green 56100806147.02516−5
1991511
Blue 56050
aged (3 mA *)
3819−97.28453−10
104443
Violet 5645024274.79636−28
423608
White 56000
aged (2 mA *)
383204410
3832441
* Reduction in mA noted per pigment as required due to the extreme intensity.
Publisher’s Note: MDPI stays neutral with regard to jurisdictional claims in published maps and institutional affiliations.

