Abstract
The surface of polypropylene (PP) was modified with fluorine gas at 25 °C and 10–380 Torr for 1 h. The surface roughness of the fluorinated PP samples was approximately two times larger than that (5 nm) of the untreated sample. The results of Fourier transform infrared spectroscopy and X-ray photoelectron spectroscopy showed that the bonds (e.g., -C-C- and -CHx) derived from raw PP decreased and were converted into fluorinated bonds (e.g., -CFx) after surface fluorination. These fluorinated bonds showed higher electronegativity according to the zeta potential results. Fluorinated PP could be stained with the methylene blue basic dye because of the increased surface roughness and the negatively charged surface.
1. Introduction
Polymers are some of the most used materials in daily life, because of their light weight, affordability, and useful mechanical and chemical properties. Many types of polymers with desirable properties have been developed and produced [1,2,3]. Among them, polypropylene (PP) is an olefin polymer of great commercial importance because of its low cost and many attractive properties [4,5]. As a saturated hydrocarbon, PP has a low surface energy and is classified as a nonspecific adsorbent, indicating its poor wettability by water and very low adsorptive and adhesive properties in relation to polar liquid [6]. PP cannot be dyed by conventional methods because of its high crystallinity and its nonpolar aliphatic structure that does not contain reactive sites [7]. However, the main difficulty arises from the absence of sites in which hydrogen bonding or electrostatic attraction can occur. The surface of commercial PP plastic can be modified to solve this problem. For example, hydrophilic modifications are beneficial for dyeing, metal plating, and other coating needs [8,9,10]. Surface modification methods for hydrophilizing and roughening plastic surfaces include physical treatments, such as plasma [11], ozone [12], UV light [13], corona discharge [14], and wet chemical treatments [15], and ion irradiation [16]. However, such treatments are expensive and cannot be applied to complex geometries. In addition to these conventional chemical and physical methods, direct fluorination has been investigated [17,18]. This process involves a gas-phase chemical reaction between fluorine gas (F2) and the polymer surface. It is an effective chemical method for modifying and controlling the physicochemical surface properties of polymers. In a previous study, the surfaces of polyethylene terephthalate and polycarbonate (PC) were modified by direct fluorination to achieve high adhesion with plating and good dyability [19,20]. F2 has strong electronegativity and high chemical reaction capability, which enables the introduction of polar groups (e.g., –C–F covalent bonds) onto the polymer surface via free-radical substitution reactions [20]. In the pigment coloration process, a colorant, usually a pigment, is added to the molten polymer before the actual spinning process [21]. This method is called “solution dyeing” or “mass coloration.” This spin coloration of PP has been widely used for a long time. However, this method has disadvantages, such as difficulties in pigment agglomeration [22] and causing damage to thermally labile dyes at the high temperatures used for resin molding. We aimed to apply the surface fluorination method to PP materials as an alternative technique to overcome the disadvantages of conventional processing. Direct fluorination was successfully used for the surface modification of PP, leading to improved dyeing properties.
2. Materials and Methods
2.1. Surface Fluorination of Polycarbonate
PP plates (10 × 10 × 1.2 mm) were washed with ethanol to remove organic residues from the surface. F2 (99.5% purity) was produced via the electrolysis of a KF/HF mixture in an HF solution. The PP plates were placed in a nickel reaction vessel (24 mm × 32 mm × 5 mm) and held at 25 °C under vacuum (0.1 Pa) for 10 h to eliminate impurities from the system before use. The fluorination apparatus was described in a previous paper [23] by the current authors, which used a reaction temperature of 25 °C, gas pressure of 10–380 Torr, and a reaction time of 1 h. The samples and reaction conditions are listed in Table 1.

Table 1.
Sample name and fluorination conditions.
2.2. Material Characterization
The chemical compositions of the untreated and modified PP samples were determined by Fourier-transform infrared (FTIR) absorption spectroscopy (Nicolet 6700; Thermo Electron Scientific, Waltham, MA, USA). The analysis was conducted in transmittance mode at 650–4000 cm−1, from which 32 scans were acquired and air background removal was performed. The surface chemical states of untreated and modified PP samples were determined by X-ray photoelectron spectroscopy (XPS; JPS-9010, JOEL). All the binding energies were referenced to a carbon peak at 285.0 eV. The surface morphologies of untreated and modified PP samples were determined by a confocal laser scanning microscope (OLS5000; Olympus, Waltham, MA, USA), while the surface topography was evaluated by atomic force microscopy (AFM; Nanoscope IIIa, Digital Instruments, Tokyo, Japan). Scanning was conducted in the tapping mode within an area of 10 µm × 10 µm. The arithmetic mean surface roughness (Ra) was determined from the AFM roughness profile. The static water contact angles of the untreated and modified PP samples were measured at 25 °C using the sessile drop method. A 10 μL water droplet was used in a telescopic goniometer with a magnification power of 23× and a protractor with a graduation of 1° (Krüss G10, Hamburg, Germany). Five measurements were acquired at different surface locations on each sample to determine the average value (±2°). The zeta potential profiles of the PP samples were measured using a solid sample cell unit with a zeta potential device (Otsuka Electronics Co., Ltd., ElSZ-2, Osaka, Japan).
2.3. Dye Staining of Polypropylene
Methylene blue (MB; Fujifilm Wako Chemical Corp., Hirono, Fukushima, Japan) and acid orange 7 (O2: OrangeII; Nacalai Tesque, Inc., Kyoto, Japan), shown in Figure 1, were the representative basic and acidic dyes, respectively. Staining solutions of 0.4 g/L dye in ultrapure water were placed in a water bath at 80 °C, and the PP samples were immersed for 30 min. The PP samples were then washed with ultrapure water and air-dried. The surface staining of each sample was evaluated based on the S and N content determined by XPS.
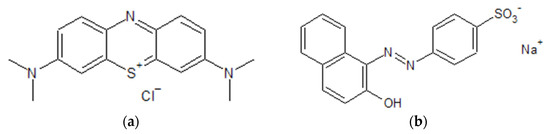
Figure 1.
Dye molecular structures of (a) methylene blue and (b) orange 2.
3. Results and Discussion
3.1. Effects of Fluorination on the Surface Morphology
Figure 2 shows the surface morphology and hydrophilicity of the untreated and fluorinated PP samples measured using confocal laser scanning microscopy (CLSM), AFM, and water contact angle test. Compared with the CLSM image of the untreated sample, the surfaces of the fluorinated samples did not change. The AFM image of the untreated sample showed a relatively flat and smooth surface with a low surface roughness of ~5.002 nm. However, the surface roughness of the fluorinated PP samples increased with increasing F2 gas pressure. The surface roughness of the F-380 sample was approximately 2.3 times higher than that of the untreated sample. Fine irregularities due to surface fluorination formed on the sample surface at the nanoscale level, but not at the microscale level. The water contact angle of the untreated PP sample was approximately 94°. The water contact angles of the PP samples fluorinated at 10–380 Torr were similar to that of the untreated sample.
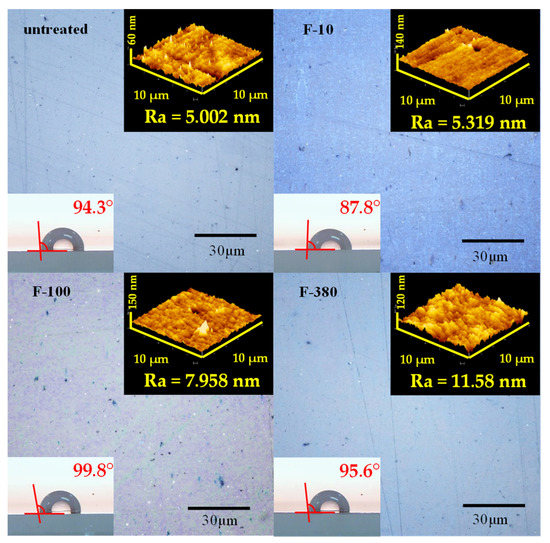
Figure 2.
CLSM, AFM, and contact angles of untreated and fluorinated samples.
3.2. Effects of Fluorination on the Surface Composition and Structure
Figure 3 shows the FTIR spectra of untreated and fluorinated PP samples. The spectrum of the untreated PP sample exhibited absorption bands at 2960 and 2950 cm−1 (-CH3, asymmetry), 2919 cm−1 (-CH2-, asymmetry), 2867 cm−1 (-CH3, symmetry), 2839 cm−1 (-CH2-, symmetry), 1458 cm−1 (-CH2-, bending), and 1376 cm−1 (-CH3, Wagging). After fluorination, absorption bands appeared at 700–770 cm−1 (-CF3) and 1000–1200 cm−1 (-CF, -CF2-). In contrast, the absorption intensity of the bonds derived from PP (e.g., -CH3, CH2) decreased. Fluorination at higher F2 gas pressures enhanced the peaks associated with fluorinated bonds (-CF, -CF2, -CF3), and weakened the peaks associated with PP. As the peaks of the -CH2- and -CH3 bonds almost disappeared in the fluorinated sample with a F2 gas pressure of 380 Torr (F-380), we considered that the fluorinated layer was formed up to the detection limit depth of several micrometers by FTIR. In other words, fluorination can decrease the crystallinity of the PP surface. As a result, as the F2 gas pressure increased, the formation rate of the fluorinated layer per unit time increased as the crystallinity of PP decreased.
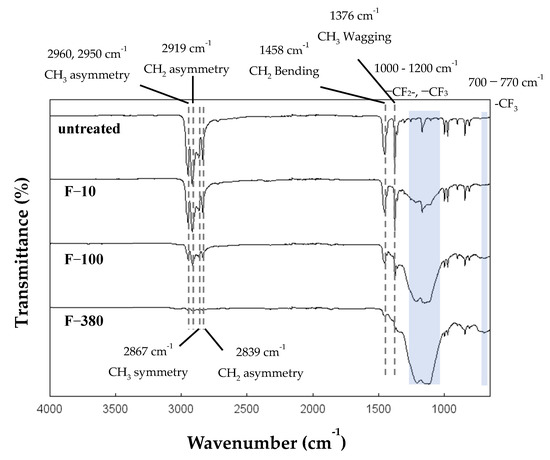
Figure 3.
FTIR spectra of untreated and fluorinated samples.
Figure 4 shows the C 1s, O 1s, and F 1s XPS spectra of untreated and fluorinated PP samples. The spectra of the untreated PP sample showed strong C–C bonding at 285.0 eV, which decreased after fluorination. The C–C bonds were converted into C–O (287.4 eV), -CHF- (289.5 eV), -CF2- (291.5 eV), and -CF3 (294.0 eV) in the fluorinated samples. Compared with the F-10 sample, the -CF3 peak increased in the F-100 and F-380 samples. The F 1s peaks were detected in all fluorinated samples. Similarly to C 1s peaks, the intensity of F 1s peaks increased in the F-100 and F-380 samples. To confirm the changes in the temporal composition content of each sample, the elemental composition contents (Table 2) of C, O, and F were evaluated according to the XPS results (Figure 4). After fluorination, the F content significantly increased with decreasing C content, which may lead to the formation of -C-Fx bonds with CF4 gasification.
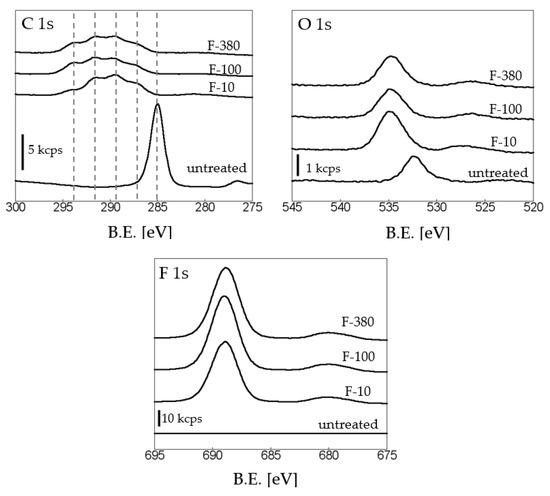
Figure 4.
XPS spectra of untreated and fluorinated PP samples.
Table 2.
Elemental composition contents of PP samples evaluated from XPS results.
Figure 5 shows the peak-fitting results for the C1s peak of fluorinated samples (Figure 4). The portion ratio (%) of each bond derived from Figure 5 is shown in Figure 6. After fluorination, the C–C bonds at 285 eV disappeared from all fluorinated samples. In the case of the F-10 sample, the C-O bond, -CHF-, -CF2-, and -CF3 were approximately 23%, 36%, 32%, and 9%, respectively. For the F-100 and F-380 samples, the percentages of C–O bonds decreased, and those of -CF3 bonds both increased to approximately 20%. There were no significant differences in the ratios of the peaks (CO, -CHF-, -CF2-, and -CF3) on the surfaces of the F-100 and F-380 samples. However, the AFM (Figure 2) and FTIR (Figure 3) results showed that the fluorination of the F380 sample may diffuse into the internal samples. Consequently, the C–C bonds on the untreated surface were converted into -C=O in the form of -C(=O)OH groups with moisture in air. The content of polar groups (-C-Fx) that induced hydrogen bond adsorption with water also increased after fluorination.
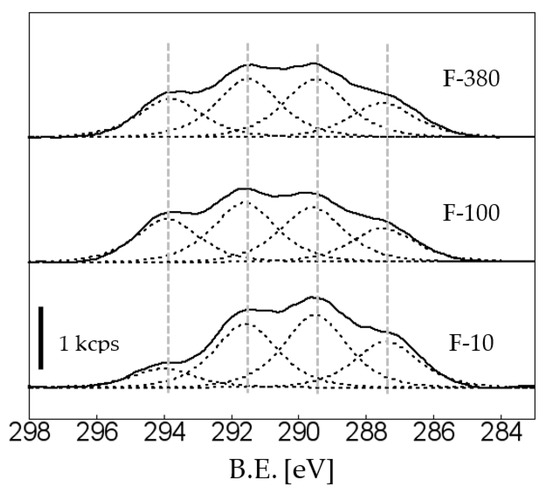
Figure 5.
C1s peak separation of F-10, F-100, and F-380 samples.
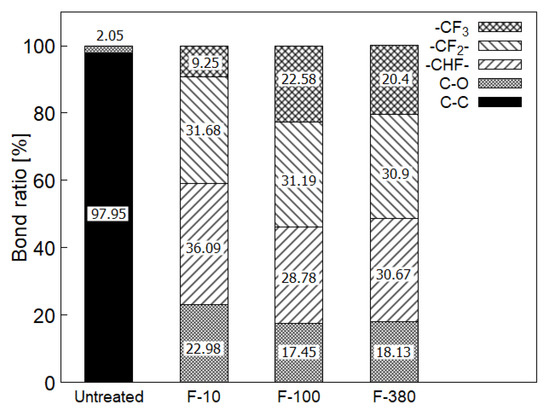
Figure 6.
Various bonds of untreated and fluorinated PP samples calculated from XPS results (Figure 5).
After surface fluorination, the number of bonds derived from PP decreased and were converted into fluorinated bonds (e.g., -CFx). The fluorinated bonds formed on the PP surface had higher electronegativity according to the zeta potential results (Figure 7). The zeta potential on the surface of the untreated sample was weakly negatively charged. With increasing F2 pressure, the zeta potential of the fluorinated samples tended to increase negatively, as shown in Figure 7. In particular, the zeta potential (−36.09 mV) of the F-380 sample was approximately 2.6 times higher than that of the untreated sample (−13.8 mV). This may be attributed to the increase in the number of polar groups (e.g., -CHF- and -C-Fx) on fluorinated samples. The negatively enhanced surface after fluorination corresponds to the results of a previous paper [20].
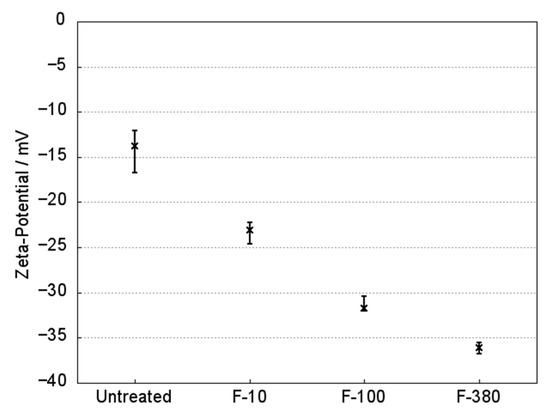
Figure 7.
Zeta potential of untreated and fluorinated PP samples with water at a constant pH of 7.0.
3.3. Dyeing of Surface-Modified PP Plates
Figure 8 shows the results of the dyeing tests on untreated and fluorinated PP samples. Dyeing tests were performed using MB and O2 solutions as the representative basic and acidic dyes, respectively. In the case of staining with (c) O2 acidic dye, no staining of fluorinated PP samples occurred. In contrast, staining occurred in untreated and fluorinated PP samples with (a) MB basic dye. In particular, the visible degree of deep coloring increased in the fluorinated samples. This was attributed to the surface state of fluorinated PP, in which F on the PP surface allowed for high electronegativity and acidity (Figure 7). Unlike the O2 dye, MB has cationic properties that allow easy adsorption on the negative surface of fluorinated PP samples via Coulomb attraction [24]. Thus, fluorinated PP samples can be effectively stained using basic dyes but not acid dyes. In the case of (b) using rhodamine B as the basic dye, staining was also achieved on fluorinated PP, similarly to that with MB.
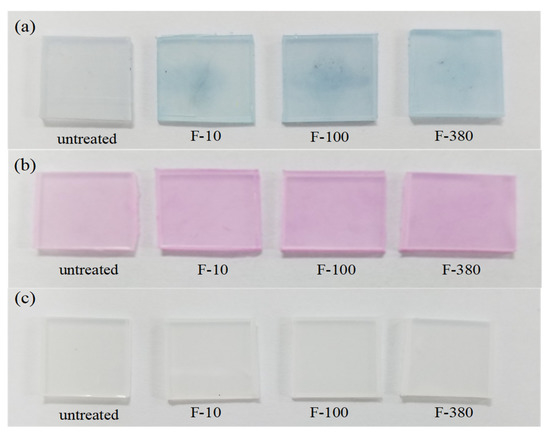
Figure 8.
Photographs of dye staining of the untreated and fluorinated PP samples with (a) methylene blue (MB), (b) rhodamine B, and (c) orange 2 (O2) solutions.
The exhaustion of MB and O2 dyes after surface staining of the PP samples was evaluated by XPS analysis (Figure 9 and Figure 10). The S content of the adsorbed MB and O2 dyes were determined according to the S 2p3/2 XPS spectra. As shown in Figure 9, the S 2p3/2 peak was detected in all samples. The intensity of the S 2p3/2 peak of the fluorinated PP samples was much higher than that of the untreated PP sample. As shown in Table 3, the S atomic percentages of the fluorinated samples were approximately 2.6 times higher than that of the untreated sample. From the results of the C 1s peak before and after staining with an MB solution, the intensity of carbon–fluorine bonds (e.g., -CFx) significantly decreased after staining with MB solution. The F atomic percentages were reduced by half, as indicated in Table 3. It may be considered that a substitution reaction between the MB dye and fluorine occurred in the fluorinated PP [25]. This enhanced the degree of dyeing of the PP samples by Coulomb attraction. In the case of the untreated PP sample, however, it may be attributed to physical absorption via Coulomb attraction between the positively charged dyes and the negatively charged PP surface. Comparing the dyeability with the fluorinated PP samples, the S content derived from MB in F-10 samples was higher than those of other fluorinated samples, as indicated in Table 3. The dyeability of F-10 samples seemed to be better than those of other things in this study. It may be reasoned for good wetting ability of F-10 samples having a lower contact angle with water (Figure 2). If there are changes in the staining conditions, such as staining time and temperature of the MB solution, however, the dyeability of F-380 samples may become superior to the dyeability others because of their higher surface roughness (Figure 2) and negative surface charge (Figure 7). In the case of staining with the O2 dye, no S 2p3/2 peak was observed in any of the samples, as shown in Figure 10. Table 4 indicates that there were almost no S 2p3/2 peaks in any of the samples. The C 1s peak after staining with O2 dye is similar to that before staining, as shown in Figure 10. Some fluorine atoms physically adsorbed on the internal PC decreased, presumably by the formation of HF in the staining process. The F atomic percentages decreased to below 10% after staining with O2 dye, as shown in Table 4. Although the PP resin is difficult to dye, staining with MB solution was achieved after surface fluorination owing to the formation of a dyeable layer. The formed fluoride layer had a high surface roughness and negative surface charge, which allowed the retention of MB molecules. In addition, the staining capacity of the PP surface can be controlled by adjusting the fluorination conditions.
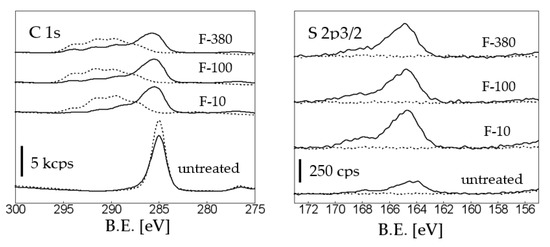
Figure 9.
XPS spectra of PP samples before and after staining with MB dye.
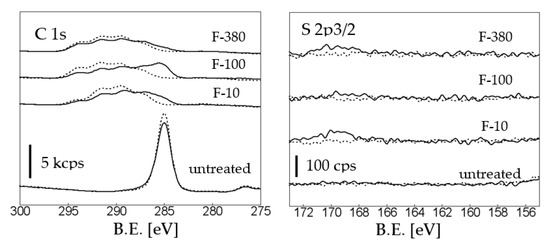
Figure 10.
XPS spectra of PP samples before and after staining with O2 dye. (Dotted line: before staining, solid line: after staining).
Table 3.
Atomic percentages of PP samples evaluated from XPS results (Figure 9).
Table 4.
Atomic percentages of PP samples evaluated from XPS results (Figure 10).
4. Conclusions
The surfaces of PP plates were successfully modified via fluorination treatment with F2 gas. Increasing the F2 pressure increased the surface roughness of the PP plates owing to the release of CF4 gas. Fluorination at higher F2 gas pressures enhanced the peaks associated with fluorinated bonds and weakened the peaks associated with PP. After surface fluorination, the bonds derived from PP were converted into polar groups (e.g., -C-Fx), which increased the electronegativity on the surface. In the dyeing test, the fluorinated PP samples stained with the MB basic dye exhibited deep coloring. They can be effectively stained using basic dyes but not acid dyes. It may be considered that a substitution reaction occurred between the MB dye and fluorine, which enhanced the degree of dyeing of PP samples by Coulomb attraction. Consequently, the dyeable surface of the PP resin was enhanced by surface fluorination owing to the increased surface roughness and the negatively charged surface.
Author Contributions
M.N. carried out the surface fluorination of all samples and wrote the manuscript. J.-H.K. conducted the XPS analysis of all the samples and contributed to the writing of the manuscript. S.Y. performed the FTIR analysis of all samples. The manuscript was written through the contributions of all the authors. All authors have read and agreed to the published version of the manuscript.
Funding
This study received no external funding.
Institutional Review Board Statement
Not applicable.
Informed Consent Statement
Not applicable.
Data Availability Statement
The data presented in this study are contained in the article.
Acknowledgments
The authors thank Fumihiro Nishimura for measuring the zeta potential. This work was financially supported by JSPS KAKENHI (grant number JP 20K05322).
Conflicts of Interest
The authors declare no conflict of interest.
References
- Anastasiadis, S.H. Development of functional polymer surfaces with controlled wettability. Langmuir 2013, 29, 9277–9290. [Google Scholar] [CrossRef] [PubMed]
- Mohamed, M.G.; EL-Mahdy, A.F.M.; Meng, T.S.; Samy, M.M.; Kuo, S.W. Multifunctional hypercrosslinked porous organic polymers based on tetraphenylethene and triphenylamine derivatives for high-performance dye adsorption and supercapacitor. Polymers 2020, 12, 2426. [Google Scholar] [CrossRef] [PubMed]
- Mohamed, M.G.; Tsai, M.Y.; Wang, C.F.; Huang, C.F.; Danko, M.; Dai, L.; Chen, T.; Kuo, S.W. Multifunctional polyhedral oligomeric silsesquioxane (POSS) based hybrid porous materials for CO2 uptake and iodine adsorption. Polymers 2021, 13, 221. [Google Scholar] [CrossRef] [PubMed]
- Hirai, S.; Phanthong, P.; Okubo, H.; Yao, S. Enhancement of the Surface Properties on Polypropylene Film Using Side-Chain Crystalline Block Copolymers. Polymers 2020, 12, 2736. [Google Scholar] [CrossRef]
- Hoff, A.; Jacobsson, S. Thermal oxidation of polypropylene in the temperature range of 120–280 °C. J. Appl. Polym. Sci. 1984, 29, 465–480. [Google Scholar] [CrossRef]
- Thakur, V.K.; Vennerberg, D.; Kessler, M.R. Green Aqueous Surface Modification of Polypropylene for Novel Polymer Nanocomposites. ACS Appl. Mater. Interfaces 2014, 6, 9349–9356. [Google Scholar] [CrossRef] [PubMed]
- Akrman, J.; Prikryl, J. Dyeing Behavior of Polypropylene Blend Fiber. I. Kinetic and Thermodynamic Parameters of the Dyeing System. J. Appl. Polym. Sci. 1996, 62, 235–240. [Google Scholar] [CrossRef]
- Tengsuwan, S.; Ohshima, M. Supercritical carbon dioxide-assisted electroless nickel plating on polypropylene—The effect of copolymer blend morphology on metal–polymer adhesion. J. Supercrit. Fluids 2014, 85, 123–134. [Google Scholar] [CrossRef]
- Shahidi, S.; Ghoranneviss, M.; Moazzenchi, B. Effect of using cold plasma on dyeing properties of polypropylene fabrics. Fibers Polym. 2007, 8, 123–129. [Google Scholar] [CrossRef]
- Burkinshaw, S.M.; Froehling, P.E.; Mignanelli, M. The effect of hyperbranched polymers on the dyeing of polypropylene fibres. Dye. Pigment. 2002, 53, 229–235. [Google Scholar] [CrossRef]
- Hachim, D.; Brown, B.N. Surface modification of polypropylene for enhanced layer by layer deposition of polyelectrolytes. J. Biomed. Mater. Res. A. 2018, 106, 2078–2085. [Google Scholar] [CrossRef] [PubMed]
- Walzak, M.J.; Flynn, S.; Foerch, R.; Hill, J.M. UV and ozone treatment of polypropylene and poly (ethylene terephthalate). J. Adhes. Sci. Technol. 1995, 9, 1229–1248. [Google Scholar] [CrossRef]
- Tanaka, S.; Naganuma, Y.; Kato, C.; Horie, K. Surface modification of vinyl polymers by vacuum ultraviolet light irradiation. J. Photopolym. Sci. Technol. 2003, 16, 165–170. [Google Scholar] [CrossRef]
- Strobe, M.; Jones, V.; Lyons, C.S.; Ulsh, M.; Kushner, M.J.; Dorai, R.; Branch, M.C. A Comparison of Corona-Treated and Flame-Treated Polypropylene Films. Plasmas Polym. 2003, 8, 61–95. [Google Scholar] [CrossRef]
- Blais, P.; Carlsson, D.J.; Csullog, G.W.; Wiles, D.M. The Chromic Acid Etching of Polyolefin Surfaces and Adhesive Bonding. J. Colloid Interface Sci. 1974, 47, 636–649. [Google Scholar] [CrossRef]
- Apel, P.Y.; Orelovich, O.L. Etching of submicron pores in thin polypropylene films irradiated with heavy ions. Nucl. Tracks Radiat. Meas. 1991, 19, 25–28. [Google Scholar] [CrossRef]
- Kharitonov, A.P.; Kharitonova, L.N. Surface modification of polymers by direct fluorination: A convenient approach to improve commercial properties of polymeric articles. Pure Appl. Chem. 2009, 81, 451–471. [Google Scholar] [CrossRef]
- Kirk, S.; Strobel, M.; Lee, C.; Pachuta, S.J.; Prokosch, M.; Lechuga, H.; Jones, M.E.; Lyons, C.S.; Degner, S.; Yang, Y.; et al. Fluorine plasma treatments of polypropylene films, 1-surface characterization. Plasma Process. Polym. 2010, 7, 107–122. [Google Scholar] [CrossRef]
- Kim, J.H.; Namie, M.; Yonezawa, S. Enhanced adhesion between polyethylene terephthalate and metal film by surface fluorination. Comp. Comm. 2018, 10, 205–208. [Google Scholar] [CrossRef]
- Kim, J.H.; Mishina, T.; Namie, M.; Nishimura, F.; Yonezawa, S. Effects of surface fluorination on the dyeing of polycarbonate (PC) resin. J. Coat. Technol. Res. 2021, 19, 617–624. [Google Scholar] [CrossRef]
- Geleji, F.; Selim, B.; Szabo, K. Pigmentation of polypropylene fibers. Faserforsch. Text. 1965, 16, 395–400. [Google Scholar]
- Assmann, K.; Schrenk, V. Develops new vehicle for dyeing polypropylene fibers. Int. Fiber J. 1997, 12, 44A. [Google Scholar]
- Kim, J.H.; Umeda, H.; Ohe, M.; Yonezawa, S.; Takashima, M. Preparation of pure LiPF6 using fluorine gas at room temperature. Chem. Lett. 2011, 40, 360–361. [Google Scholar] [CrossRef]
- Yamaguchi, S.; Minbuta, S.; Matsui, K. Adsorption of the cationic dye methylene blue on anodic porous alumina in sodium dodecyl sulfate solutions. Langmuir 2020, 36, 4592–4599. [Google Scholar] [CrossRef]
- Fumoto, I. Studies on dyeing of polyolefins. (1) Dyeing properties of fluorinated polypropylene fiber. Seni Gakkaishi 1965, 21, 590–597. [Google Scholar] [CrossRef][Green Version]


Publisher’s Note: MDPI stays neutral with regard to jurisdictional claims in published maps and institutional affiliations. |
© 2022 by the authors. Licensee MDPI, Basel, Switzerland. This article is an open access article distributed under the terms and conditions of the Creative Commons Attribution (CC BY) license (https://creativecommons.org/licenses/by/4.0/).