
Advancements in Cellular Imaging: Expanding Horizons with Innovative Dyes and Techniques


Abstract
:1. Introduction
2. Types of Voltage Sensitive Dyes
- (A)
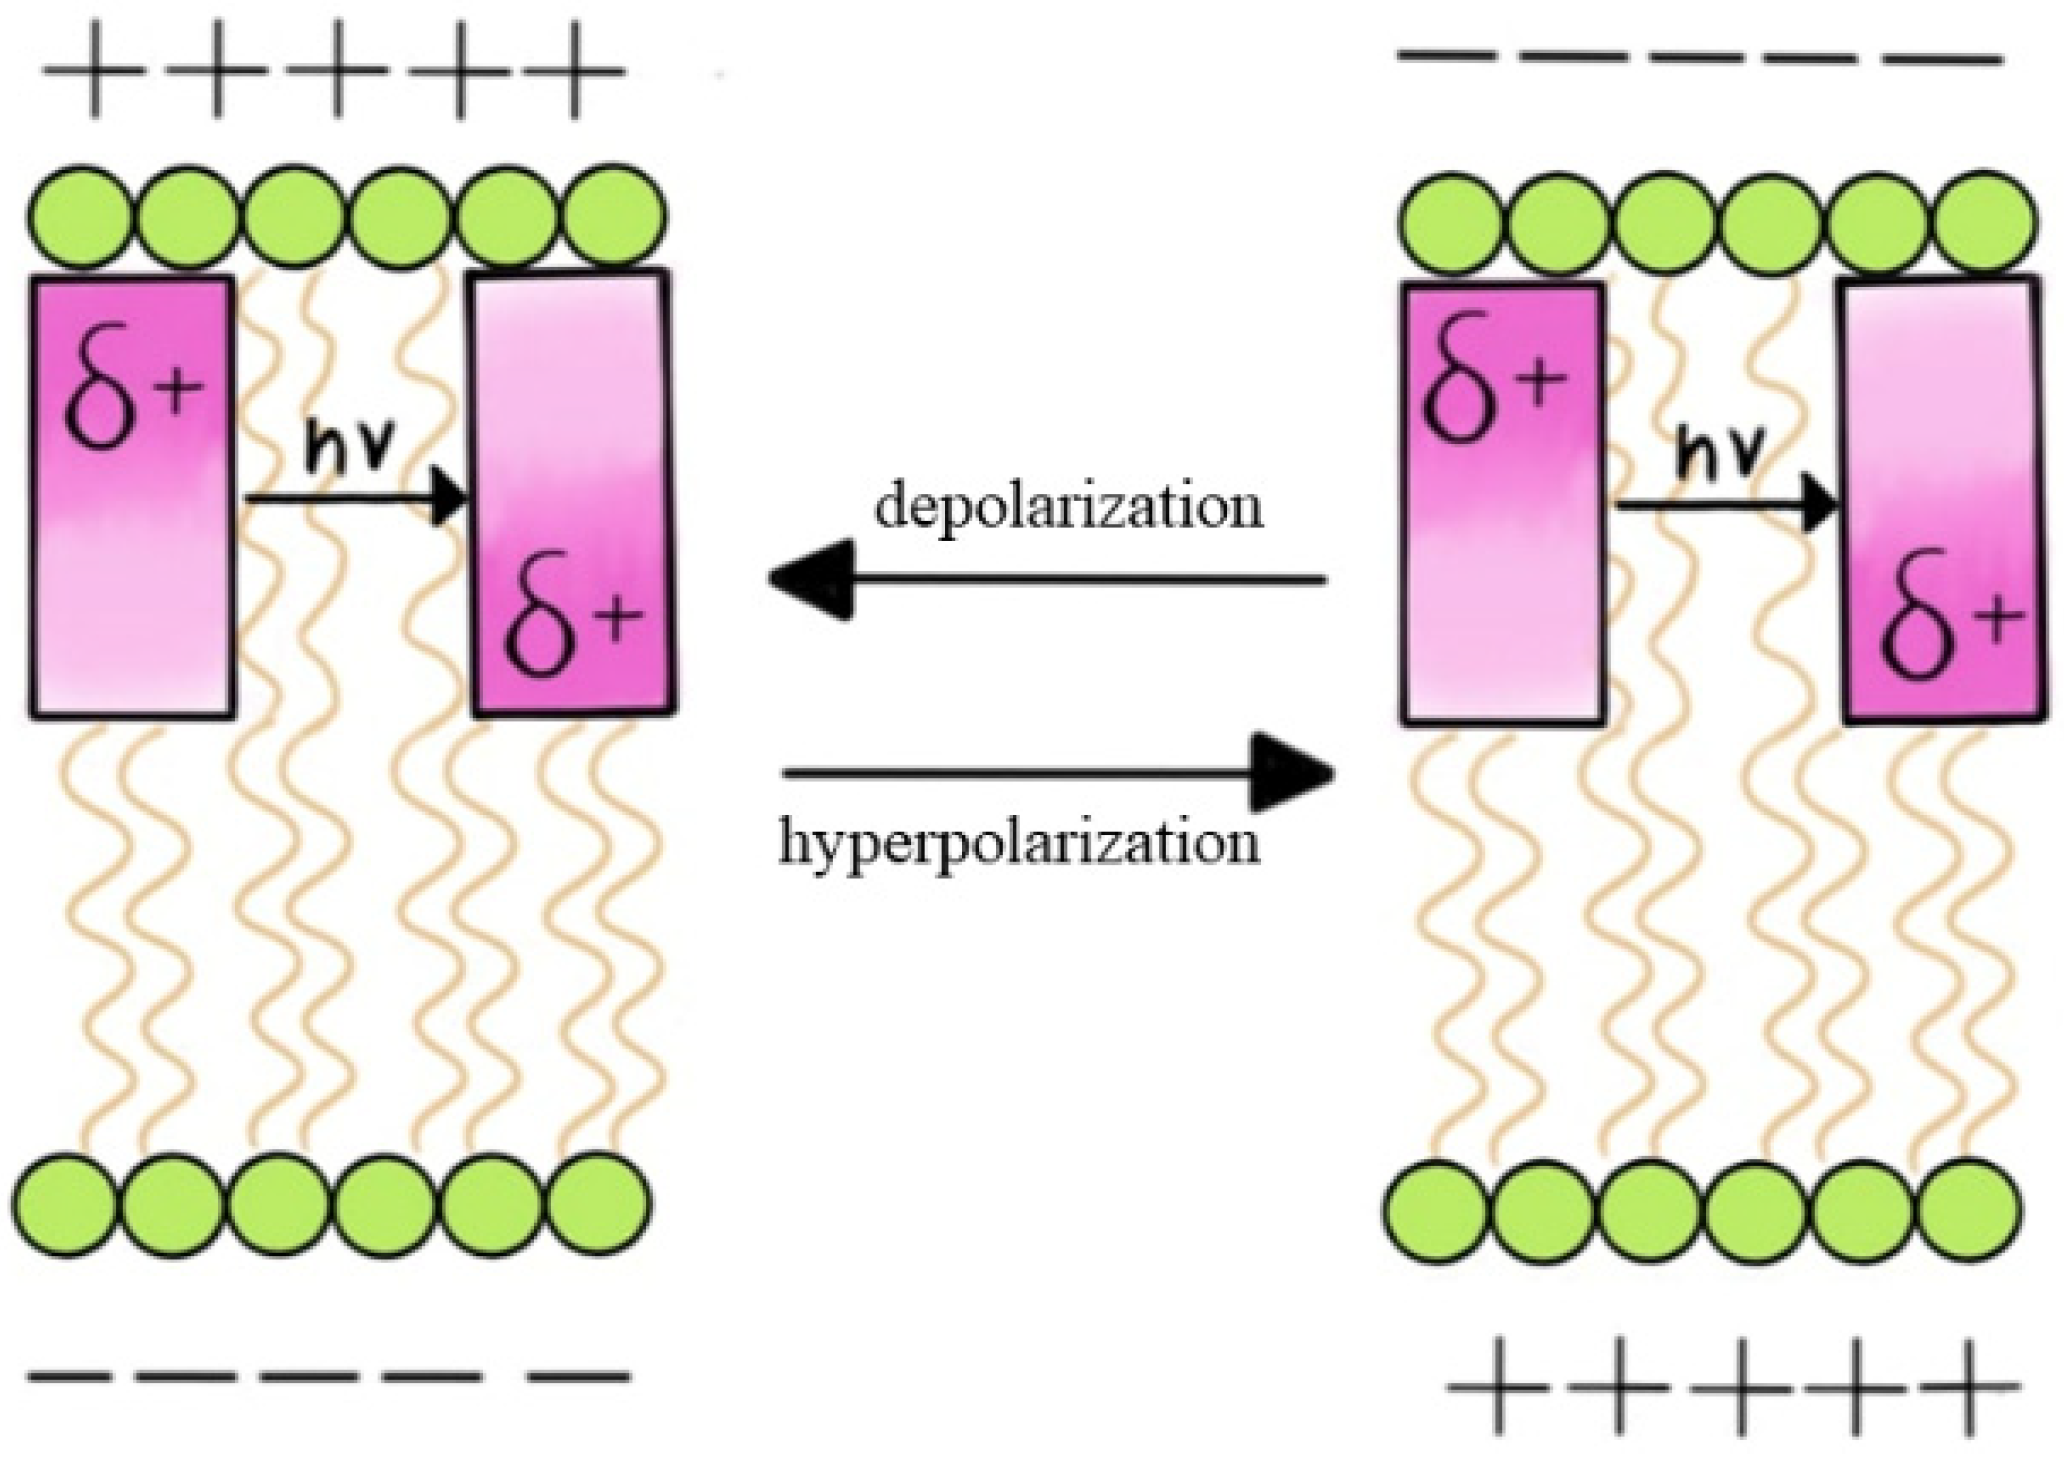
- Electrochromic Dyes:
- (B)
- Forster Resonance Energy Transfer (FRET)-based Dyes
- (C)
- Photoinduced Electron Transfer (PeT)-based Dyes
3. Mitochondrial Activity and Voltage-Sensitive Dyes
4. Voltage Sensitive Dyes and Ca2+ Dynamics
5. Voltage-Sensitive Dyes and Two-Photon Microscopy
6. Common Issue and Solutions During Imaging
6.1. Photobleaching
6.2. Autofluorescence
7. Dyes and Their Application in Neuroscience and Cell Biology
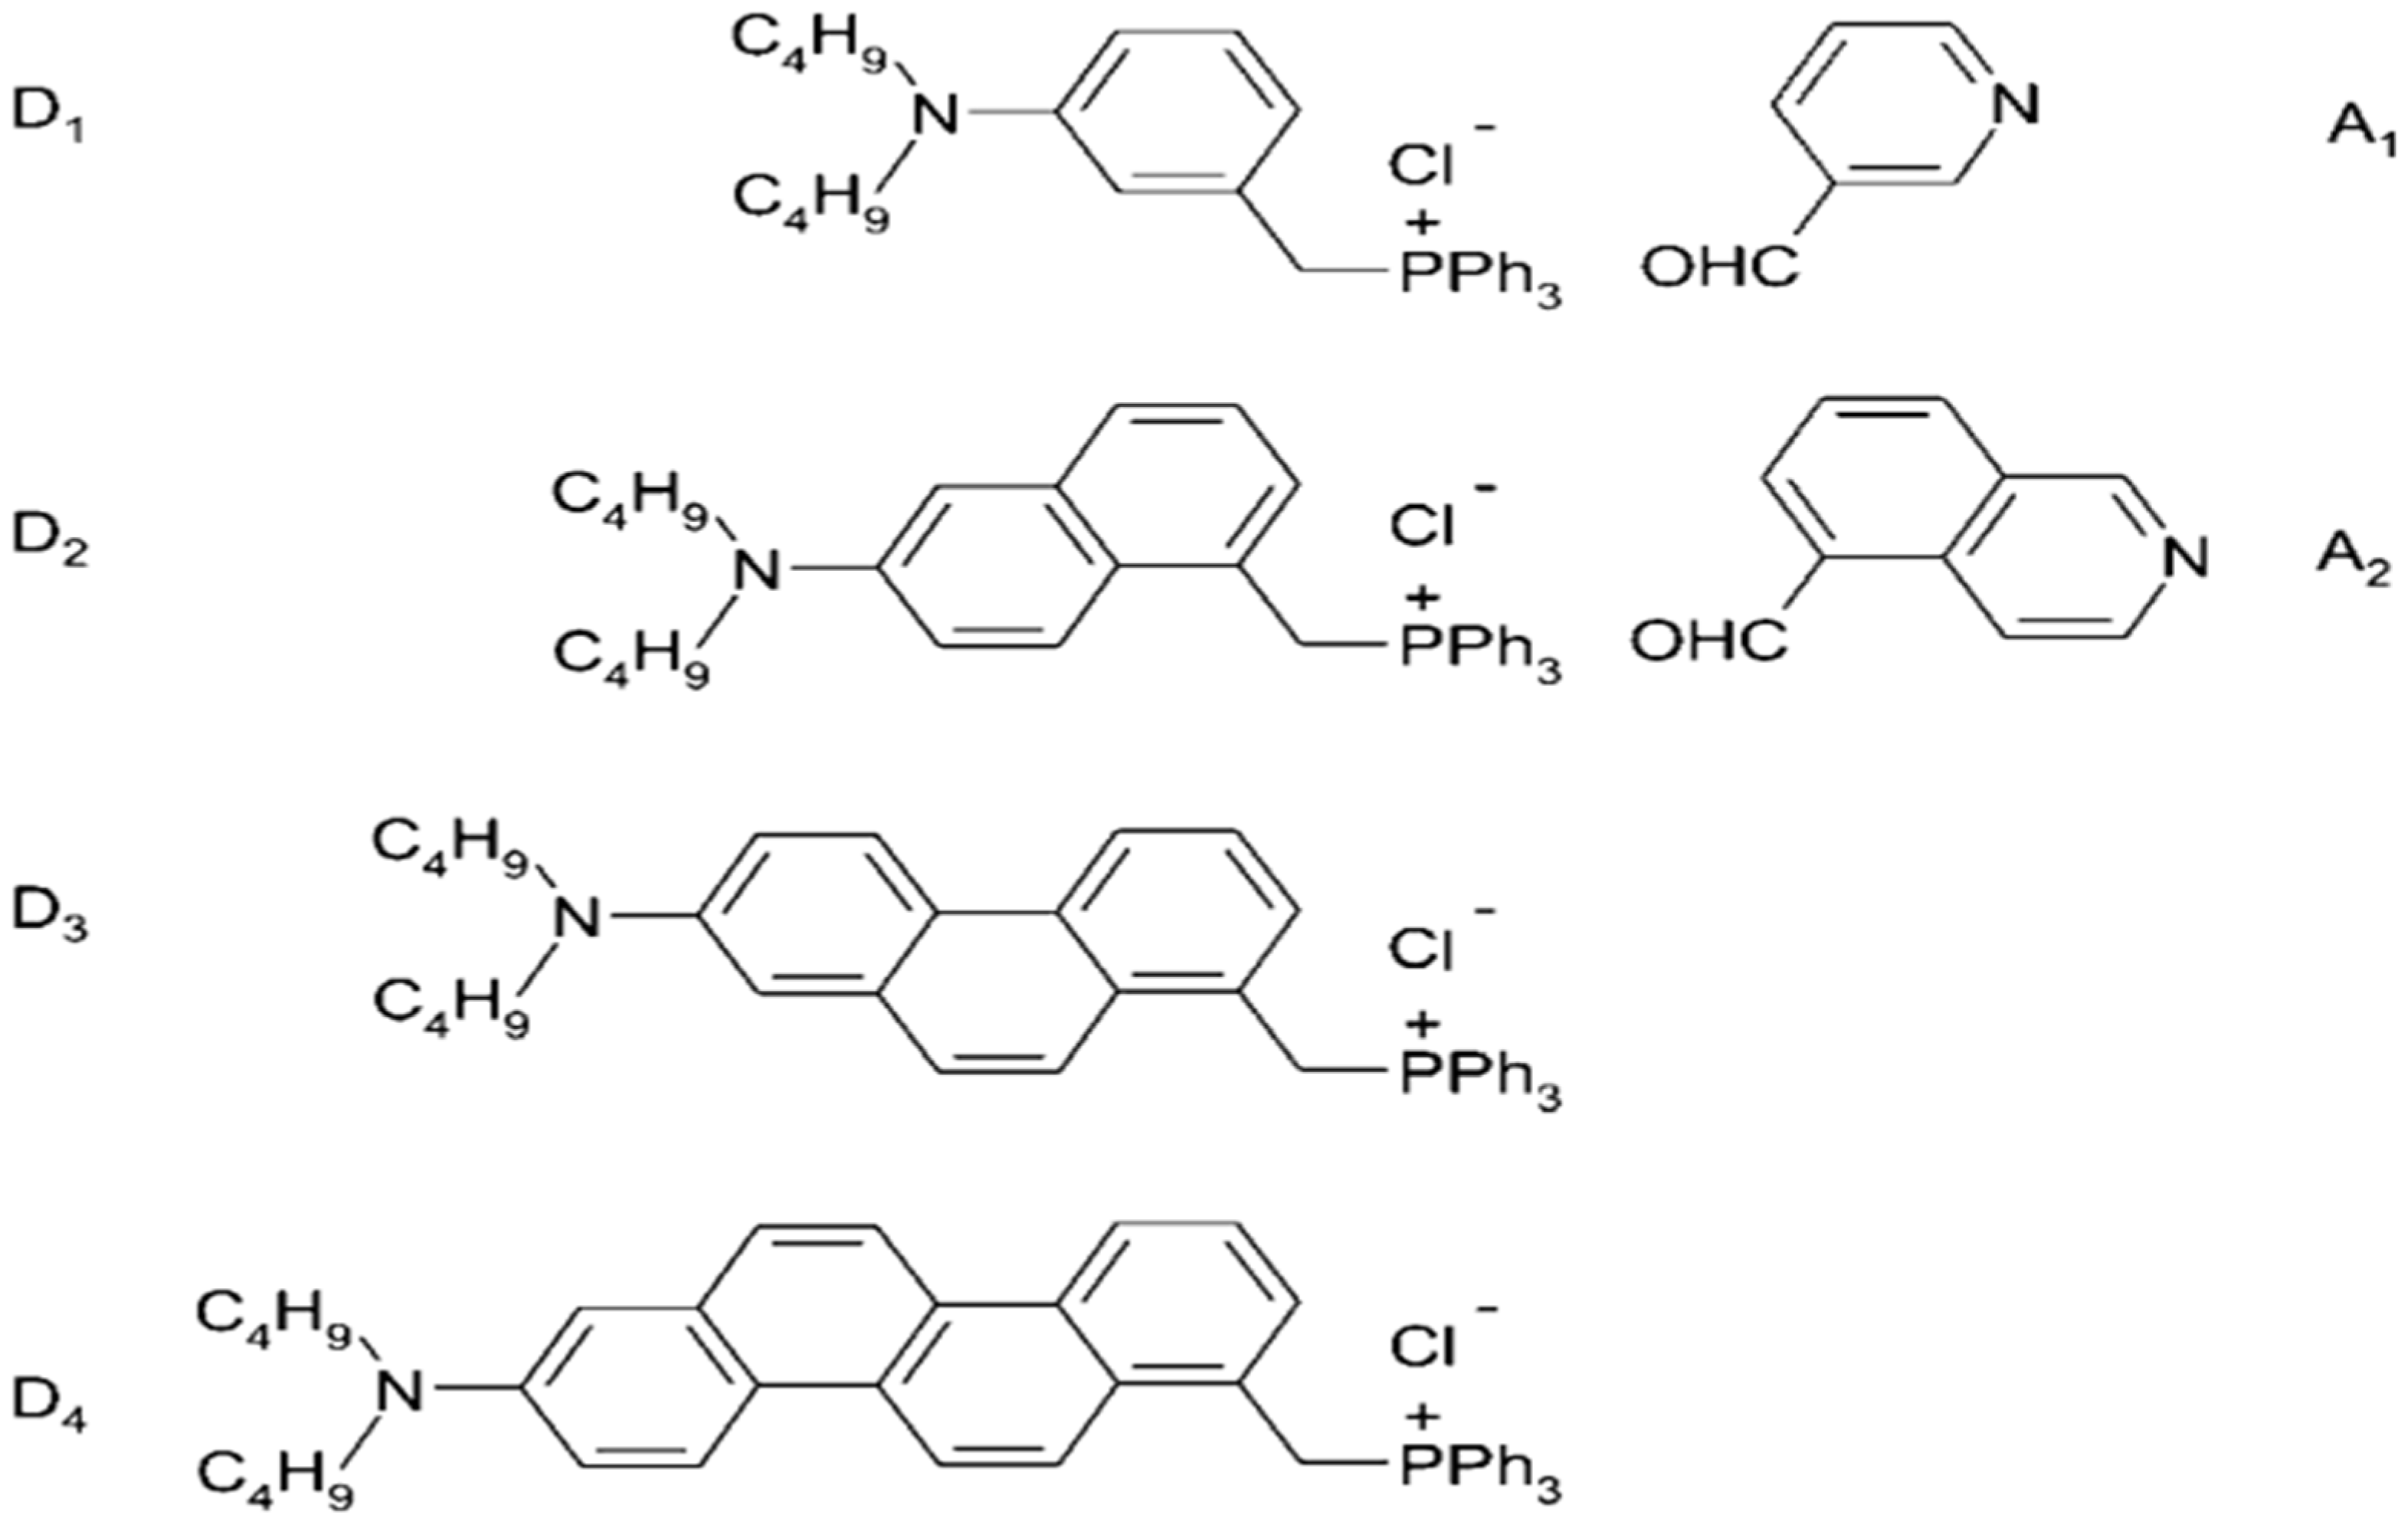
8. Synthesis of ANNINE and Chromene-Based VSDs
9. Recent Advances in Voltage-Sensitive Dyes
9.1. Enhancements in Sensitivity and Specificity
9.2. Expansion of Spectral Range
9.3. Genetically Encoded Voltage Indicators (GEVIs)
9.4. Applications in Cardiac Research
10. Future Perspectives of Voltage-Sensitive Dyes (VSDs)
11. Drawbacks of Chromene-Based and ANNINE Dyes
12. Conclusions
Author Contributions
Funding
Institutional Review Board Statement
Informed Consent Statement
Data Availability Statement
Conflicts of Interest
References
- Liu, P.; Miller, E.W. Electrophysiology, Unplugged: Imaging Membrane Potential with Fluorescent Indicators. Acc. Chem. Res. 2020, 53, 11–19. [Google Scholar] [CrossRef]
- Bean, B.P. The Action Potential in Mammalian Central Neurons. Nat. Rev. Neurosci. 2007, 8, 451–465. [Google Scholar] [CrossRef] [PubMed]
- Nikolaev, D.M.; Mironov, V.N.; Shtyrov, A.A.; Kvashnin, I.D.; Mereshchenko, A.S.; Vasin, A.V.; Panov, M.S.; Ryazantsev, M.N. Fluorescence Imaging of Cell Membrane Potential: From Relative Changes to Absolute Values. Int. J. Mol. Sci. 2023, 24, 2435. [Google Scholar] [CrossRef] [PubMed]
- Sundelacruz, S.; Levin, M.; Kaplan, D.L. Membrane Potential Controls Adipogenic and Osteogenic Differentiation of Mesenchymal Stem Cells. PLoS ONE 2008, 3, e3737. [Google Scholar] [CrossRef]
- Belle, M.D.C.; Diekman, C.O.; Forger, D.B.; Piggins, H.D. Daily Electrical Silencing in the Mammalian Circadian Clock. Science 2009, 326, 281–284. [Google Scholar] [CrossRef] [PubMed]
- Peterka, D.S.; Takahashi, H.; Yuste, R. Imaging Voltage in Neurons. Neuron 2011, 69, 9–21. [Google Scholar] [CrossRef] [PubMed]
- Djemai, M.; Cupelli, M.; Boutjdir, M.; Chahine, M. Optical Mapping of Cardiomyocytes in Monolayer Derived from Induced Pluripotent Stem Cells. Cells 2023, 12, 2168. [Google Scholar] [CrossRef] [PubMed]
- González, J.E.; Tsien, R.Y. Voltage Sensing by Fluorescence Resonance Energy Transfer in Single Cells. Biophys. J. 1995, 69, 1272–1280. [Google Scholar] [CrossRef] [PubMed]
- Fumoto, T.; Imato, K.; Ooyama, Y. Elucidation of a Detection Mechanism of a Fluorescent Sensor Based on Photo-Induced Electron Transfer for Water. New J. Chem. 2022, 46, 21037–21046. [Google Scholar] [CrossRef]
- Hutcheon, B.; Yarom, Y. Resonance, Oscillation and the Intrinsic Frequency Preferences of Neurons. Trends Neurosci. 2000, 23, 216–222. [Google Scholar] [CrossRef] [PubMed]
- Scaduto, R.C.; Grotyohann, L.W. Measurement of Mitochondrial Membrane Potential Using Fluorescent Rhodamine Derivatives. Biophys. J. 1999, 76, 469–477. [Google Scholar] [CrossRef]
- Clapham, D.E. Calcium Signaling. Cell 2007, 131, 1047–1058. [Google Scholar] [CrossRef] [PubMed]
- Russell, J.T. Imaging Calcium Signals in Vivo: A Powerful Tool in Physiology and Pharmacology. Br. J. Pharmacol. 2011, 163, 1605–1625. [Google Scholar] [CrossRef]
- Scherschel, J.A.; Rubart, M. Cardiovascular Imaging Using Two-Photon Microscopy. Microsc. Microanal. 2008, 14, 492–506. [Google Scholar] [CrossRef] [PubMed]
- Kee, M.Z.L.; Wuskell, J.P.; Loew, L.M.; Augustine, G.J.; Sekino, Y. Imaging Activity of Neuronal Populations with New Long-Wavelength Voltage-Sensitive Dyes. Brain Cell Biol. 2008, 36, 157–172. [Google Scholar] [CrossRef] [PubMed]
- Yan, P.; Acker, C.D.; Zhou, W.-L.; Lee, P.; Bollensdorff, C.; Negrean, A.; Lotti, J.; Sacconi, L.; Antic, S.D.; Kohl, P.; et al. Palette of Fluorinated Voltage-Sensitive Hemicyanine Dyes. Proc. Natl. Acad. Sci. USA 2012, 109, 20443–20448. [Google Scholar] [CrossRef] [PubMed]
- Ascoli, G.A.; Bezhanskaya, J.; Tsytsarev, V. Microscopy. In Encyclopedia of the Neurological Sciences; Elsevier: Amsterdam, The Netherlands, 2014; pp. 16–20. ISBN 978-0-12-385158-1. [Google Scholar]
- Li, J.-H.; Fan, L.-F.; Zhao, D.-J.; Zhou, Q.; Yao, J.-P.; Wang, Z.-Y.; Huang, L. Plant Electrical Signals: A Multidisciplinary Challenge. J. Plant Physiol. 2021, 261, 153418. [Google Scholar] [CrossRef] [PubMed]
- Chemla, S.; Chavane, F. Voltage-Sensitive Dye Imaging: Technique Review and Models. J. Physiol. 2010, 104, 40–50. [Google Scholar] [CrossRef] [PubMed]
- Miller, E.W. Small Molecule Fluorescent Voltage Indicators for Studying Membrane Potential. Curr. Opin. Chem. Biol. 2016, 33, 74–80. [Google Scholar] [CrossRef]
- Yu, Q.; Wang, X.; Nie, L. Optical Recording of Brain Functions Based on Voltage-Sensitive Dyes. Chin. Chem. Lett. 2021, 32, 1879–1887. [Google Scholar] [CrossRef]
- Ebner, T.J.; Chen, G. Use of Voltage-Sensitive Dyes and Optical Recordings in the Central Nervous System. Prog. Neurobiol. 1995, 46, 463–506. [Google Scholar] [CrossRef] [PubMed]
- Miller, E.W.; Lin, J.Y.; Frady, E.P.; Steinbach, P.A.; Kristan, W.B.; Tsien, R.Y. Optically Monitoring Voltage in Neurons by Photo-Induced Electron Transfer through Molecular Wires. Proc. Natl. Acad. Sci. 2012, 109, 2114–2119. [Google Scholar] [CrossRef] [PubMed]
- Bajar, B.T.; Wang, E.S.; Zhang, S.; Lin, M.Z.; Chu, J. A Guide to Fluorescent Protein FRET Pairs. Sensors 2016, 16, 1488. [Google Scholar] [CrossRef]
- Broussard, J.A.; Rappaz, B.; Webb, D.J.; Brown, C.M. Fluorescence Resonance Energy Transfer Microscopy as Demonstrated by Measuring the Activation of the Serine/Threonine Kinase Akt. Nat. Protoc. 2013, 8, 265–281. [Google Scholar] [CrossRef]
- Kiyokawa, E.; Aoki, K.; Nakamura, T.; Matsuda, M. Spatiotemporal Regulation of Small GTPases as Revealed by Probes Based on the Principle of Förster Resonance Energy Transfer (FRET): Implications for Signaling and Pharmacology. Annu. Rev. Pharmacol. Toxicol. 2011, 51, 337–358. [Google Scholar] [CrossRef] [PubMed]
- Miyawaki, A. Development of Probes for Cellular Functions Using Fluorescent Proteins and Fluorescence Resonance Energy Transfer. Annu. Rev. Biochem. 2011, 80, 357–373. [Google Scholar] [CrossRef] [PubMed]
- Cardullo, R.A. Theoretical Principles and Practical Considerations for Fluorescence Resonance Energy Transfer Microscopy. Methods Cell Biol. 2007, 81, 479–494. [Google Scholar] [CrossRef] [PubMed]
- Amero, C.; Schanda, P.; Durá, M.A.; Ayala, I.; Marion, D.; Franzetti, B.; Brutscher, B.; Boisbouvier, J. Fast Two-Dimensional NMR Spectroscopy of High Molecular Weight Protein Assemblies. J. Am. Chem. Soc. 2009, 131, 3448–3449. [Google Scholar] [CrossRef] [PubMed]
- Verma, A.K.; Noumani, A.; Yadav, A.K.; Solanki, P.R. FRET Based Biosensor: Principle Applications Recent Advances and Challenges. Diagnostics 2023, 13, 1375. [Google Scholar] [CrossRef]
- Han, Y.; Fan, X.; Sun, K.; Wang, X.; Wang, Y.; Chen, J.; Zhen, Y.; Zhang, W.; Hui, R. Hypertension Associated Polymorphisms in WNK1/WNK4 Are Not Associated with Hydrochlorothiazide Response. Clin. Biochem. 2011, 44, 1045–1049. [Google Scholar] [CrossRef] [PubMed]
- Li, Y.; Sun, C.; Song, P.; Ma, F.; Kungwan, N.; Sun, M. Physical Insight on Mechanism of Photoinduced Charge Transfer in Multipolar Photoactive Molecules. Sci. Rep. 2018, 8, 10089. [Google Scholar] [CrossRef]
- Wang, S.; Ren, W.X.; Hou, J.-T.; Won, M.; An, J.; Chen, X.; Shu, J.; Kim, J.S. Fluorescence Imaging of Pathophysiological Microenvironments. Chem. Soc. Rev. 2021, 50, 8887–8902. [Google Scholar] [CrossRef]
- Dey, D.; Sarangi, M.K.; Ray, A.; Bhattacharyya, D.; Maity, D.K. Excited State Hydrogen Bonding Fluorescent Probe: Role of Structure and Environment. J. Lumin. 2016, 173, 105–112. [Google Scholar] [CrossRef]
- Aigner, D.; Freunberger, S.A.; Wilkening, M.; Saf, R.; Borisov, S.M.; Klimant, I. Enhancing Photoinduced Electron Transfer Efficiency of Fluorescent pH-Probes with Halogenated Phenols. Anal. Chem. 2014, 86, 9293–9300. [Google Scholar] [CrossRef]
- Bojesomo, R.S.; Saleh, N. Photoinduced Electron Transfer in Encapsulated Heterocycles by Cavitands. Photochem. Photobiol. 2022, 98, 754–762. [Google Scholar] [CrossRef] [PubMed]
- Niu, H.; Liu, J.; O’Connor, H.M.; Gunnlaugsson, T.; James, T.D.; Zhang, H. Photoinduced Electron Transfer (PeT) Based Fluorescent Probes for Cellular Imaging and Disease Therapy. Chem. Soc. Rev. 2023, 52, 2322–2357. [Google Scholar] [CrossRef]
- Nolfi-Donegan, D.; Braganza, A.; Shiva, S. Mitochondrial electron transport chain: Oxidative phosphorylation, oxidant production, and methods of measurement. Redox Biol. 2020, 37, 101674. [Google Scholar] [CrossRef] [PubMed] [PubMed Central]
- Zhang, B.; Pan, C.; Feng, C.; Yan, C.; Yu, Y.; Chen, Z.; Guo, C.; Wang, X. Role of mitochondrial reactive oxygen species in homeostasis regulation. Redox Rep. 2022, 27, 45–52. [Google Scholar] [CrossRef] [PubMed] [PubMed Central]
- Zong, Y.; Li, H.; Liao, P.; Chen, L.; Pan, Y.; Zheng, Y.; Zhang, C.; Liu, D.; Zheng, M.; Gao, J. Mitochondrial dysfunction: Mechanisms and advances in therapy. Signal Transduct. Target. Ther. 2024, 9, 124. [Google Scholar] [CrossRef] [PubMed]
- Zorova, L.D.; Popkov, V.A.; Plotnikov, E.Y.; Silachev, D.N.; Pevzner, I.B.; Jankauskas, S.S.; Babenko, V.A.; Zorov, S.D.; Balakireva, A.V.; Juhaszova, M.; et al. Mitochondrial membrane potential. Anal. Biochem. 2018, 552, 50–59. [Google Scholar] [CrossRef] [PubMed] [PubMed Central]
- Shivling Mali, A.; Honc, O.; Hejnova, L.; Novotny, J. Opioids Alleviate Oxidative Stress via the Nrf2/HO-1 Pathway in LPS-Stimulated Microglia. Int. J. Mol. Sci. 2023, 24, 11089. [Google Scholar] [CrossRef]
- Nunnari, J.; Suomalainen, A. Mitochondria: In Sickness and in Health. Cell 2012, 148, 1145–1159. [Google Scholar] [CrossRef] [PubMed]
- De Souza Breda, C.N.; Davanzo, G.G.; Basso, P.J.; Câmara, N.O.S.; Moraes-Vieira, P.M.M. Mitochondria as central hub of the immune system. Redox Biol. 2019, 26, 101255. [Google Scholar] [CrossRef]
- Klier, P.E.Z.; Roo, R.; Miller, E.W. Fluorescent Indicators for Imaging Membrane Potential of Organelles. Curr. Opin. Chem. Biol. 2022, 71, 102203. [Google Scholar] [CrossRef] [PubMed]
- Carlson, G.C.; Coulter, D.A. In Vitro Functional Imaging in Brain Slices Using Fast Voltage-Sensitive Dye Imaging Combined with Whole-Cell Patch Recording. Nat. Protoc. 2008, 3, 249–255. [Google Scholar] [CrossRef] [PubMed]
- Pak, R.W.; Kang, J.; Boctor, E.; Kang, J.U. Optimization of Near-Infrared Fluorescence Voltage-Sensitive Dye Imaging for Neuronal Activity Monitoring in the Rodent Brain. Front. Neurosci. 2021, 15, 742405. [Google Scholar] [CrossRef]
- Yan, P.; Acker, C.D.; Biasci, V.; Judge, G.; Monroe, A.; Sacconi, L.; Loew, L.M. Near-Infrared Voltage-Sensitive Dyes Based on Chromene Donor. Proc. Natl. Acad. Sci. USA 2023, 120, e2305093120. [Google Scholar] [CrossRef]
- Salama, G.; Choi, B.-R.; Azour, G.; Lavasani, M.; Tumbev, V.; Salzberg, B.M.; Patrick, M.J.; Ernst, L.A.; Waggoner, A.S. Properties of New, Long-Wavelength, Voltage-Sensitive Dyes in the Heart. J. Membr. Biol. 2005, 208, 125–140. [Google Scholar] [CrossRef]
- Song, G.; He, H.; Chen, W.; Lv, Y.; Chu, P.K.; Wang, H.; Li, P. Reversibly Migratable Fluorescent Probe for Precise and Dynamic Evaluation of Cell Mitochondrial Membrane Potentials. Biosensors 2022, 12, 798. [Google Scholar] [CrossRef] [PubMed]
- Hernández-Juárez, C.; Calahorra, M.; Peña, A.; Jiménez-Sánchez, A. Fluorescent Probe as Dual-Organelle Localizer Through Differential Proton Gradients Between Lipid Droplets and Mitochondria. Anal. Chem. 2024, 96, 9262–9269. [Google Scholar] [CrossRef] [PubMed]
- Sivandzade, F.; Bhalerao, A.; Cucullo, L. Analysis of the Mitochondrial Membrane Potential Using the Cationic JC-1 Dye as a Sensitive Fluorescent Probe. Bio-Protocol 2019, 9, e3128. [Google Scholar] [CrossRef]
- Perry, S.W.; Norman, J.P.; Barbieri, J.; Brown, E.B.; Gelbard, H.A. Mitochondrial Membrane Potential Probes and the Proton Gradient: A Practical Usage Guide. BioTechniques 2011, 50, 98–115. [Google Scholar] [CrossRef]
- Baracca, A.; Sgarbi, G.; Solaini, G.; Lenaz, G. Rhodamine 123 as a Probe of Mitochondrial Membrane Potential: Evaluation of Proton Flux through F(0) during ATP Synthesis. Biochim. Biophys. Acta 2003, 1606, 137–146. [Google Scholar] [CrossRef]
- Manno, C.; Figueroa, L.; Fitts, R.; Ríos, E. Confocal Imaging of Transmembrane Voltage by SEER of Di-8-ANEPPS. J. Gen. Physiol. 2013, 141, 371–387. [Google Scholar] [CrossRef]
- Youngworth, R.; Roux, B. Simulating the Voltage-Dependent Fluorescence of Di-8-ANEPPS in a Lipid Membrane. J. Phys. Chem. Lett. 2023, 14, 8268–8276. [Google Scholar] [CrossRef]
- Ernst, P.; Kim, S.; Yang, Z.; Liu, X.M.; Zhou, L. Characterization of the Far-Red Fluorescent Probe MitoView 633 for Dynamic Mitochondrial Membrane Potential Measurement. Front. Physiol. 2023, 14, 1257739. [Google Scholar] [CrossRef] [PubMed]
- Creed, S.; McKenzie, M. Measurement of Mitochondrial Membrane Potential with the Fluorescent Dye Tetramethylrhodamine Methyl Ester (TMRM). Methods Mol. Biol. 2019, 1928, 69–76. [Google Scholar] [CrossRef]
- Kholmukhamedov, A.; Schwartz, J.M.; Lemasters, J.J. Isolated Mitochondria Infusion Mitigates Ischemia-Reperfusion Injury of the Liver in Rats: Mitotracker Probes and Mitochondrial Membrane Potential. Shock 2013, 39, 543. [Google Scholar] [CrossRef] [PubMed]
- Buravkov, S.V.; Pogodina, M.V.; Buravkova, L.B. Comparison of Mitochondrial Fluorescent Dyes in Stromal Cells. Bull. Exp. Biol. Med. 2014, 157, 654–658. [Google Scholar] [CrossRef]
- Neikirk, K.; Marshall, A.G.; Kula, B.; Smith, N.; LeBlanc, S.; Hinton, A. MitoTracker: A useful tool in need of better alternatives. Eur. J. Cell Biol. 2023, 102, 151371. [Google Scholar] [CrossRef] [PubMed]
- Wang, Q.; Zou, M.-H. Measurement of Reactive Oxygen Species (ROS) and Mitochondrial ROS in AMPK Knockout Mice Blood Vessels. Methods Mol. Biol. 2018, 1732, 507–517. [Google Scholar] [CrossRef] [PubMed]
- Roelofs, B.A.; Ge, S.X.; Studlack, P.E.; Polster, B.M. Low Micromolar Concentrations of the Superoxide Probe MitoSOX Un-couple Neural Mitochondria and Inhibit Complex IV. Free Radic. Biol. Med. 2015, 86, 250–258. [Google Scholar] [CrossRef]
- Krumschnabel, G.; Eigentler, A.; Fasching, M.; Gnaiger, E. Use of Safranin for the Assessment of Mitochondrial Membrane Potential by High-Resolution Respirometry and Fluorometry. Methods Enzymol. 2014, 542, 163–181. [Google Scholar] [CrossRef]
- Chowdhury, S.R.; Djordjevic, J.; Albensi, B.C.; Fernyhough, P. Simultaneous Evaluation of Substrate-Dependent Oxygen Consumption Rates and Mitochondrial Membrane Potential by TMRM and Safranin in Cortical Mitochondria. Biosci. Rep. 2015, 36, e00286. [Google Scholar] [CrossRef]
- Younes, N.; Alsahan, B.S.; Al-Mesaifri, A.J.; Da’as, S.I.; Pintus, G.; Majdalawieh, A.F.; Nasrallah, G.K. JC-10 Probe as a Novel Method for Analyzing the Mitochondrial Membrane Potential and Cell Stress in Whole Zebrafish Embryos. Toxicol. Res. 2022, 11, 77–87. [Google Scholar] [CrossRef] [PubMed]
- Sakamuru, S.; Attene-Ramos, M.S.; Xia, M. Mitochondrial Membrane Potential Assay. Methods Mol. Biol. 2016, 1473, 17–22. [Google Scholar] [CrossRef] [PubMed]
- Ramadass, R.; Bereiter-Hahn, J. How DASPMI Reveals Mitochondrial Membrane Potential: Fluorescence Decay Kinetics and Steady-State Anisotropy in Living Cells. Biophys. J. 2008, 95, 4068–4076. [Google Scholar] [CrossRef]
- McCracken, D.J.; Lovasik, B.P.; McCracken, C.E.; Caplan, J.M.; Turan, N.; Nogueira, R.G.; Cawley, C.M.; Dion, J.E.; Tamargo, R.J.; Barrow, D.L.; et al. Resolution of Oculomotor Nerve Palsy Secondary to Posterior Communicating Artery Aneurysms: Comparison of Clipping and Coiling. Neurosurgery 2015, 77, 931–939, discussion 939. [Google Scholar] [CrossRef]
- Swidah, R.; Ogunlabi, O.; Grant, C.M.; Ashe, M.P. N-Butanol Production in S. Cerevisiae: Co-Ordinate Use of Endogenous and Exogenous Pathways. Appl. Microbiol. Biotechnol. 2018, 102, 9857–9866. [Google Scholar] [CrossRef]
- Oh, J.; Lee, C.; Kaang, B.-K. Imaging and Analysis of Genetically Encoded Calcium Indicators Linking Neural Circuits and Behaviors. Korean J. Physiol. Pharmacol. 2019, 23, 237–249. [Google Scholar] [CrossRef] [PubMed]
- Aseyev, N.; Ivanova, V.; Balaban, P.; Nikitin, E. Current Practice in Using Voltage Imaging to Record Fast Neuronal Activity: Successful Examples from Invertebrate to Mammalian Studies. Biosensors 2023, 13, 648. [Google Scholar] [CrossRef]
- Grienberger, C.; Chen, X.; Konnerth, A. Dendritic Function In Vivo. Trends Neurosci. 2015, 38, 45–54. [Google Scholar] [CrossRef]
- Antic, S.D.; Empson, R.M.; Knöpfel, T. Voltage imaging to understand connections and functions of neuronal circuits. J. Neurophysiol. 2016, 116, 135–152. [Google Scholar] [CrossRef] [PubMed]
- Hochbaum, D.R.; Zhao, Y.; Farhi, S.L.; Klapoetke, N.; Werley, C.A.; Kapoor, V.; Zou, P.; Kralj, J.M.; Maclaurin, D.; Smedemark-Margulies, N.; et al. All-Optical Electrophysiology in Mammalian Neurons Using Engineered Microbial Rhodopsins. Nat. Methods 2014, 11, 825–833. [Google Scholar] [CrossRef]
- Piatkevich, K.D.; Jung, E.E.; Straub, C.; Linghu, C.; Park, D.; Suk, H.-J.; Hochbaum, D.R.; Goodwin, D.; Pnevmatikakis, E.; Pak, N.; et al. A Robotic Multidimensional Directed Evolution Approach Applied to Fluorescent Voltage Reporters. Nat. Chem. Biol. 2018, 14, 352–360. [Google Scholar] [CrossRef]
- Fisher, J.A.N.; Salzberg, B.M. Two-Photon Excitation of Fluorescent Voltage-Sensitive Dyes: Monitoring Membrane Potential in the Infrared. Adv. Exp. Med. Biol. 2015, 859, 427–453. [Google Scholar] [CrossRef] [PubMed]
- Karlstad, J.; Sun, Y.; Singh, B.B. Ca2+ Signaling: An Outlook on the Characterization of Ca(2+) Channels and Their Im-portance in Cellular Functions. Adv. Exp. Med. Biol. 2012, 740, 143–157. [Google Scholar] [CrossRef]
- Santofimia-Castaño, P.; Salido, G.M.; Gonzalez, A. Interferences of Resveratrol with Fura-2-Derived Fluorescence in Intracellular Free-Ca2+ Concentration Determinations. Cytotechnology 2016, 68, 1369–1380. [Google Scholar] [CrossRef] [PubMed]
- Tanaka, M.; Matsui, T. Methodologies for Investigating the Vasorelaxation Action of Peptides. In Biologically Active Peptides; Elsevier: Amsterdam, The Netherlands, 2021; pp. 255–274. ISBN 978-0-12-821389-6. [Google Scholar]
- Li, E.S.; Saha, M.S. Optimizing Calcium Detection Methods in Animal Systems: A Sandbox for Synthetic Biology. Biomolecules 2021, 11, 343. [Google Scholar] [CrossRef] [PubMed] [PubMed Central]
- Schneidereit, D.; Vass, H.; Reischl, B.; Allen, R.J.; Friedrich, O. Calcium Sensitive Fluorescent Dyes Fluo-4 and Fura Red under Pressure: Behaviour of Fluorescence and Buffer Properties under Hydrostatic Pressures up to 200 MPa. PLoS ONE 2016, 11, e0164509. [Google Scholar] [CrossRef]
- Gee, K.R.; Brown, K.A.; Chen, W.-N.U.; Bishop-Stewart, J.; Gray, D.; Johnson, I. Chemical and Physiological Characterization of Fluo-4 Ca2+-Indicator Dyes. Cell Calcium 2000, 27, 97–106. [Google Scholar] [CrossRef]
- Pydi, S.P.; Bhullar, R.P.; Chelikani, P. Constitutive activity of bitter taste receptors (T2Rs). In Advances in Pharmacology; Elsevier: Amsterdam, The Netherlands, 2014; pp. 303–326. [Google Scholar] [CrossRef]
- Shen, Y.; Dana, H.; Abdelfattah, A.S.; Patel, R.; Shea, J.; Molina, R.S.; Rawal, B.; Rancic, V.; Chang, Y.-F.; Wu, L.; et al. A Genetically Encoded Ca2+ Indicator Based on Circularly Permutated Sea Anemone Red Fluorescent Protein eqFP578. BMC Biol. 2018, 16, 9. [Google Scholar] [CrossRef] [PubMed]
- Berlin, S.; Carroll, E.C.; Newman, Z.L.; Okada, H.O.; Quinn, C.M.; Kallman, B.; Rockwell, N.C.; Martin, S.S.; Lagarias, J.C.; Isacoff, E.Y. Photoactivatable Genetically Encoded Calcium Indicators for Targeted Neuronal Imaging. Nat. Methods 2015, 12, 852–858. [Google Scholar] [CrossRef] [PubMed]
- Cho, J.; Swanson, C.J.; Chen, J.; Li, A.; Lippert, L.G.; Boye, S.E.; Rose, K.; Sivaramakrishnan, S.; Chuong, C.; Chow, R.H. The GCaMP-R Family of Genetically Encoded Ratiometric Calcium Indicators. ACS Chem. Biol. 2017, 12, 1066–1074. [Google Scholar] [CrossRef] [PubMed]
- Drummond, R.M.; Mix, T.C.; Tuft, R.A.; Walsh, J.V.; Fay, F.S. Mitochondrial Ca2+ Homeostasis during Ca2+ Influx and Ca2+ Release in Gastric Myocytes from Bufo Marinus. J. Physiol. 2000, 522 Pt 3, 375–390. [Google Scholar] [CrossRef] [PubMed]
- Grynkiewicz, G.; Poenie, M.; Tsien, R.Y. A new generation of Ca2+ indicators with greatly improved fluorescence properties. J. Biol. Chem. 1985, 260, 3440–3450. [Google Scholar] [CrossRef] [PubMed]
- Tischbirek, C.; Birkner, A.; Jia, H.; Sakmann, B.; Konnerth, A. Deep Two-Photon Brain Imaging with a Red-Shifted Fluorometric Ca2+ Indicator. Proc. Natl. Acad. Sci. USA 2015, 112, 11377–11382. [Google Scholar] [CrossRef]
- Lock, J.T.; Parker, I.; Smith, I.F. A Comparison of Fluorescent Ca2+ Indicators for Imaging Local Ca2+ Signals in Cultured Cells. Cell Calcium 2015, 58, 638–648. [Google Scholar] [CrossRef] [PubMed]
- Tada, M.; Takeuchi, A.; Hashizume, M.; Kitamura, K.; Kano, M. A Highly Sensitive Fluorescent Indicator Dye for Calcium Imaging of Neural Activity in Vitro and in Vivo. Eur. J. Neurosci. 2014, 39, 1720–1728. [Google Scholar] [CrossRef] [PubMed]
- Bannwarth, M.; Correa, I.R.; Sztretye, M.; Pouvreau, S.; Fellay, C.; Aebischer, A.; Royer, L.; Rois, E.; Johnsson, K. Indo-1 Derivatives for Local Calcium Sensing. ACS Chem. Biol. 2009, 4, 179–190. [Google Scholar] [CrossRef]
- Ryan, J.; Urayama, P. Characterizing the dual-wavelength dye indo-1 for calcium-ion sensing under pressure. Anal. Methods 2011, 4, 80–84. [Google Scholar] [CrossRef]
- Salerno, S.; Garten, K.; Smith, G.L.; Stølen, T.; Kelly, A. Two-Photon Excitation of FluoVolt Allows Improved Interrogation of Transmural Electrophysiological Function in the Intact Mouse Heart. Prog. Biophys. Mol. Biol. 2020, 154, 11–20. [Google Scholar] [CrossRef] [PubMed]
- Kulkarni, R.U.; Vandenberghe, M.; Thunemann, M.; James, F.; Andreassen, O.A.; Djurovic, S.; Devor, A.; Miller, E.W. In Vivo Two-Photon Voltage Imaging with Sulfonated Rhodamine Dyes. ACS Cent. Sci. 2018, 4, 1371–1378. [Google Scholar] [CrossRef] [PubMed]
- Benninger, R.K.P.; Piston, D.W. Two-Photon Excitation Microscopy for the Study of Living Cells and Tissues. Curr. Protoc. Cell Biol. 2013, 59, 4.11.1–4.11.24. [Google Scholar] [CrossRef]
- Homma, R.; Baker, B.J.; Jin, L.; Garaschuk, O.; Konnerth, A.; Cohen, L.B.; Zecevic, D. Wide-Field and Two-Photon Imaging of Brain Activity with Voltage- and Calcium-Sensitive Dyes. Philos. Trans. R. Soc. Lond. B Biol. Sci. 2009, 364, 2453–2467. [Google Scholar] [CrossRef]
- Chaigneau, E.; Wright, A.J.; Poland, S.P.; Girkin, J.M.; Silver, R.A. Impact of Wavefront Distortion and Scattering on 2-Photon Microscopy in Mammalian Brain Tissue. Opt. Express 2011, 19, 22755–22774. [Google Scholar] [CrossRef]
- Niesner, R.; Andresen, V.; Neumann, J.; Spiecker, H.; Gunzer, M. The Power of Single and Multibeam Two-Photon Microscopy for High-Resolution and High-Speed Deep Tissue and Intravital Imaging. Biophys. J. 2007, 93, 2519–2529. [Google Scholar] [CrossRef]
- Roome, C.J.; Kuhn, B. Dendritic Coincidence Detection in Purkinje Neurons of Awake Mice. Elife 2020, 9, e59619. [Google Scholar] [CrossRef] [PubMed]
- Malvaut, S.; Constantinescu, V.-S.; Dehez, H.; Doric, S.; Saghatelyan, A. Deciphering Brain Function by Miniaturized Fluorescence Microscopy in Freely Behaving Animals. Front. Neurosci. 2020, 14, 819. [Google Scholar] [CrossRef] [PubMed]
- Kwon, J.; Elgawish, M.S.; Shim, S.-H. Bleaching-Resistant Super-Resolution Fluorescence Microscopy. Adv. Sci. 2022, 9, e2101817. [Google Scholar] [CrossRef]
- Patterson, G.H.; Piston, D.W. Photobleaching in Two-Photon Excitation Microscopy. Biophys. J. 2000, 78, 2159–2162. [Google Scholar] [CrossRef]
- Dempsey, G.T.; Vaughan, J.C.; Chen, K.H.; Bates, M.; Zhuang, X. Evaluation of Fluorophores for Optimal Performance in Localization-Based Super-Resolution Imaging. Nat. Methods 2011, 8, 1027–1036. [Google Scholar] [CrossRef] [PubMed]
- Nolting, D.D.; Gore, J.C.; Pham, W. NEAR-INFRARED DYES: Probe Development and Applications in Optical Molecular Imaging. Curr. Org. Synth. 2011, 8, 521–534. [Google Scholar] [CrossRef] [PubMed]
- Davis, A.S.; Richter, A.; Becker, S.; Moyer, J.E.; Sandouk, A.; Skinner, J.; Taubenberger, J.K. Characterizing and Diminishing Autofluorescence in Formalin-Fixed Paraffin-Embedded Human Respiratory Tissue. J. Histochem. Cytochem. 2014, 62, 405–423. [Google Scholar] [CrossRef]
- Jin, L.; Han, Z.; Platisa, J.; Wooltorton, J.R.A.; Cohen, L.B.; Pieribone, V.A. Single Action Potentials and Subthreshold Electri-cal Events Imaged in Neurons with a Fluorescent Protein Voltage Probe. Neuron 2012, 75, 779–785. [Google Scholar] [CrossRef]
- Gong, Y.; Huang, C.; Li, J.Z.; Grewe, B.F.; Zhang, Y.; Eismann, S.; Schnitzer, M.J. High-Speed Recording of Neural Spikes in Awake Mice and Flies with a Fluorescent Voltage Sensor. Science 2015, 350, 1361–1366. [Google Scholar] [CrossRef]
- Abdelfattah, A.S.; Kawashima, T.; Singh, A.; Novak, O.; Liu, H.; Shuai, Y.; Huang, Y.-C.; Campagnola, L.; Seeman, S.C.; Yu, J.; et al. Bright and Photostable Chemigenetic Indicators for Extended in Vivo Voltage Imaging. Science 2019, 365, 699–704. [Google Scholar] [CrossRef] [PubMed]
- Kannan, M.; Vasan, G.; Haziza, S.; Huang, C.; Chrapkiewicz, R.; Luo, J.; Cardin, J.A.; Schnitzer, M.J.; Pieribone, V.A. Dual-Polarity Voltage Imaging of the Concurrent Dynamics of Multiple Neuron Types. Science 2022, 378, eabm8797. [Google Scholar] [CrossRef] [PubMed]
- Chen, G.; Cao, Y.; Tang, Y.; Yang, X.; Liu, Y.; Huang, D.; Zhang, Y.; Li, C.; Wang, Q. Advanced Near-Infrared Light for Moni-toring and Modulating the Spatiotemporal Dynamics of Cell Functions in Living Systems. Adv. Sci. 2020, 7, 1903783. [Google Scholar] [CrossRef] [PubMed]
- Ronzhina, M.; Stracina, T.; Lacinova, L.; Ondacova, K.; Pavlovicova, M.; Marsanova, L.; Smisek, R.; Janousek, O.; Fialova, K.; Kolarova, J.; et al. Di-4-ANEPPS Modulates Electrical Activity and Progress of Myocardial Ischemia in Rabbit Isolated Heart. Front. Physiol. 2021, 12, 667065. [Google Scholar] [CrossRef]
- Herron, T.J.; Lee, P.; Jalife, J. Optical Imaging of Voltage and Calcium in Cardiac Cells & Tissues. Circ. Res. 2012, 110, 609–623. [Google Scholar] [CrossRef]
- Grimm, J.B.; Tkachuk, A.N.; Patel, R.; Hennigan, S.T.; Gutu, A.; Dong, P.; Gandin, V.; Osowski, A.M.; Holland, K.L.; Liu, Z.J.; et al. Optimized Red-Absorbing Dyes for Imaging and Sensing. J. Am. Chem. Soc. 2023, 145, 23000–23013. [Google Scholar] [CrossRef] [PubMed]
- Hübener, G.; Lambacher, A.; Fromherz, P. Anellated Hemicyanine Dyes with Large Symmetrical Solvatochromism of Absorp-tion and Fluorescence. J. Phys. Chem. B 2003, 107, 7896–7902. [Google Scholar] [CrossRef]
- Hassner, A.; Birnbaum, D.; Loew, L.M. Charge-Shift Probes of Membrane Potential. Synthesis. J. Org. Chem. 1984, 49, 2546–2551. [Google Scholar] [CrossRef]
- Röcker, C.; Heilemann, A.; Fromherz, P. Time-Resolved Fluorescence of a Hemicyanine Dye: Dynamics of Rotamerism and Resolvation. J. Phys. Chem. 1996, 100, 12172–12177. [Google Scholar] [CrossRef]
- Kirmse, W.; Kund, K. Intramolecular Generation of Oxonium Ylides from Functionalized Arylcarbenes. J. Am. Chem. Soc. 1989, 111, 1465–1473. [Google Scholar] [CrossRef]
- Kumari, K.; Raghuvanshi, D.S.; Singh, K.N. An Efficient Synthesis of 2H-Chromen-3-Yl Derivatives via CuI/(NH4)2HPO4 Catalyzed Reaction of O-Propargyl Salicylaldehydes with Active Methylene Compounds. Tetrahedron 2013, 69, 82–88. [Google Scholar] [CrossRef]
- Fromherz, P.; Hübener, G.; Kuhn, B.; Hinner, M.J. ANNINE-6plus, a Voltage-Sensitive Dye with Good Solubility, Strong Membrane Binding and High Sensitivity. Eur. Biophys. J. 2008, 37, 509–514. [Google Scholar] [CrossRef] [PubMed]
- Raliski, B.K.; Kirk, M.J.; Miller, E.W. Imaging Spontaneous Neuronal Activity with Voltage-Sensitive Dyes. Curr. Protoc. 2021, 1, e48. [Google Scholar] [CrossRef]
- Bando, Y.; Grimm, C.; Cornejo, V.H.; Yuste, R. Genetic Voltage Indicators. BMC Biol. 2019, 17, 71. [Google Scholar] [CrossRef] [PubMed]
- Marchal, G.A.; Biasci, V.; Yan, P.; Palandri, C.; Campione, M.; Cerbai, E.; Loew, L.M.; Sacconi, L. Recent Advances and Cur-rent Limitations of Available Technology to Optically Manipulate and Observe Cardiac Electrophysiology. Pflugers Arch. Eur. J. Physiol. 2023, 475, 1357–1366. [Google Scholar] [CrossRef] [PubMed]
- Hoffmann, R.; Stellbrink, E.; Schröder, J.; Grawe, A.; Vogel, G.; Blindt, R.; Kelm, M.; Radke, P.W. Impact of the Metabolic Syndrome on Angiographic and Clinical Events after Coronary Intervention Using Bare-Metal or Sirolimus-Eluting Stents. Am. J. Cardiol. 2007, 100, 1347–1352. [Google Scholar] [CrossRef] [PubMed]
- Bernstein, C.N.; Wajda, A.; Blanchard, J.F. The Incidence of Arterial Thromboembolic Diseases in Inflammatory Bowel Dis-ease: A Population-Based Study. Clin. Gastroenterol. Hepatol. 2008, 6, 41–45. [Google Scholar] [CrossRef]
- Chien, M.-P.; Brinks, D.; Testa-Silva, G.; Tian, H.; Phil Brooks, F.; Adam, Y.; Bloxham, B.; Gmeiner, B.; Kheifets, S.; Cohen, A.E. Photoactivated Voltage Imaging in Tissue with an Archaerhodopsin-Derived Reporter. Sci. Adv. 2021, 7, eabe3216. [Google Scholar] [CrossRef] [PubMed]
- Lin, J.Y.; Knutsen, P.M.; Muller, A.; Kleinfeld, D.; Tsien, R.Y. ReaChR: A Red-Shifted Variant of Channelrhodopsin Enables Deep Transcranial Optogenetic Excitation. Nat. Neurosci. 2013, 16, 1499–1508. [Google Scholar] [CrossRef]
- Xu, Y.; Zou, P.; Cohen, A.E. Voltage Imaging with Genetically Encoded Indicators. Curr. Opin. Chem. Biol. 2017, 39, 1–10. [Google Scholar] [CrossRef] [PubMed]
- Chabala, L.I. Functional and structural transformation of chromosomes of various proliferating hematopoietic cells of the bone marrow in albino rats. Kosm. Biol. Aviakosm. Med. 1986, 20, 78–80. [Google Scholar]
- Attin, M.; Clusin, W.T. Basic Concepts of Optical Mapping Techniques in Cardiac Electrophysiology. Biol. Res. Nurs. 2009, 11, 195–207. [Google Scholar] [CrossRef] [PubMed]
- Baker, B.J.; Mutoh, H. Dynamic Imaging of Neural Activity Using Genetically Encoded Voltage Indicators. Front. Cell. Neurosci. 2015, 9, 311. [Google Scholar] [CrossRef]
- Loew, L.M.; Simpson, L.L. Charge-Shift Probes of Membrane Potential: The Molecular Basis of Voltage-Sensitive Fluorescence. Biophys. J. 1981, 34, 353–365. [Google Scholar] [CrossRef] [PubMed]
- Ghoroghchian, P.P.; Therien, M.J.; Hammer, D.A. In vivo fluorescence imaging: A personal perspective. Wiley Interdiscip. Rev. Nanomed. Nanobiotechnol. 2009, 1, 156–167. [Google Scholar] [CrossRef] [PubMed]
- Grenier, V.; Daws, B.R.; Liu, P.; Miller, E.W. Spying on Neuronal Membrane Potential with Genetically Targetable Voltage Indicators. J. Am. Chem. Soc. 2019, 141, 1349–1358. [Google Scholar] [CrossRef]
- Loew, L.M. Design and Use of Organic Voltage Sensitive Dyes. Adv. Exp. Med. Biol. 2015, 859, 27–53. [Google Scholar] [CrossRef] [PubMed]
- Liu, W.Y.; Li, H.Y.; Lv, H.S.; Zhao, B.X.; Miao, J.Y. A rhodamine chromene-based turn-on fluorescence probe for selectively imaging Cu2+ in living cell. Spectrochim. Acta A Mol. Biomol. Spectrosc. 2012, 95, 658–663. [Google Scholar] [CrossRef] [PubMed]
- Kuhn, B.; Roome, C.J. Primer to Voltage Imaging With ANNINE Dyes and Two-Photon Microscopy. Front. Cell. Neurosci. 2019, 13, 321. [Google Scholar] [CrossRef] [PubMed]


| Voltage Sensitive Dyes | Uses | Drawbacks | Advantages | References | |
|---|---|---|---|---|---|
| 1. | JC-1 | Accumulates in mitochondria, exhibits red fluorescence. Fluoresces green and monomeric in depolarized mitochondria. | Aggregation-dependent fluorescence can lead to quenching and sensitivity to experimental condition. | Due to the color change, it differentiates healthy and depolarized mitochondria. | Sivandzade et al., 2019 [52]. Perry S.W. et al., 2011 [53] |
| 2. | Rhodamine 123 | Used to observe mitochondrial membrane potential. Aggregates in mitochondria in a potential-dependent manner. | Over time due to photobleaching, rhodamine 123 lost its fluorescence. | It is specific for mitochondrial potential. | Baracca et al., 2003 [54]. Zorova et al., 2018 [41] |
| 3. | Di-8-ANEPPS | Primarily used for plasma membrane potential but can be adapted for mitochondrial studies due to its sensitivity to voltage change. | Its fluorescence is affected by changes in the membrane potential. | Highly sensitive to voltage changes. | Carlo Manno et al., 2013 [55] Youngworth et al., 2023 [56] |
| 4. | TMRM Tetramethylrhodamine methyl ester) | It provides precise measurements of mitochondrial membrane potential. | To avoid toxic effects at high concentration it requires careful optimization. | Potential dependent dye. | Ernst et al., 2023 [57], Creed et al., 2019 [58]. |
| 5. | MitoTracker Red CMXRos | Exhibits red fluorescence in active mitochondria; convenient for live-cell imaging of mitochondrial potential and dynamics. | It affects mitochondrial function. It binds to mitochondrial proteins and lipids; not dependent on mitochondrial potential. | Precise for live-cell imaging. | Kholmukhamedov et al., 2013 [59]. Buravkov S.V. et al., 2014 [60] Neikirk et al., 2023 [61] |
| 6. | MitoSOX Red | Analyses superoxide production in mitochondria, indicating mitochondrial oxidative stress by fluorescing upon oxidation. | It becomes super oxidized and affects mitochondrial functions. | It is specific for detection of mitochondrial oxidative stress. | Wang Q et al., 2018 [62], Roelofs et al., 2015 [63] Mali et al., 2023 [42]. |
| 7. | Safranin O | Accumulates in mitochondria in a potential-dependent manner; used for dual or multi-parameter assessments of mitochondrial function. | Under high-dye concentration, fluorescence can be quenched. | Useful in multi-parameter assessments of mitochondrial functions. | Krumschnabel et al., 2014 [64], Chowdhury et al., 2016 [65]. |
| 8. | JC-10 | Improved version of JC-1 with better solubility; used for similar applications to monitor mitochondrial membrane potential changes. | It has a higher cost compared to JC-1. | It has better solubility. | Nadin et al., 2022 [66], Sakamuru et al., 2017 [67]. |
| 9. | DASPMI (4-(4-Diethylaminostyryl)-N-methylpyridinium iodide) | Stains active mitochondria and measures mitochondrial membrane potential with high sensitivity. | It is less compatible with live-cell imaging. | Highly sensitive for active mitochondria. | Ramadaas et al., 2008 [68]. |
| Voltage Sensitive Dyes | Uses in Ca2+ | Drawbacks | Advantages | References | |
|---|---|---|---|---|---|
| 1. | Fura-2 | A ratiometric dye that binds to Ca2+ and exhibits a shift in its fluorescence excitation spectrum, allowing for quantitative measurements of intracellular Ca2+ concentrations. | Fura-2 requires UV excitation, and it has increasing risk of phototoxicity. | Accurate ratiometric measurements of Ca2+ levels. | Patricia Santofimia-castano et al., 2016, Tanka et al., 2021 [79,80]. Li ES. et al., 2021 [81] |
| 2. | Fluo-4 | Fluo-4 increases fluorescence intensity upon binding to Ca2+; it is a non-ratiometric dye. Used for imaging rapid Ca2+ transients. | It’s non-ratiometric nature can lead to signal distortions caused by dye concentration and photo bleaching. | High sensitivity to fast Ca2+ transients. | Schneidereit D et al., 2016, Gee et al., 2000 [82,83] Pydi, S.P. et al., 2014 [84] |
| 3. | GCaMPs | Genetically encoded calcium indicators that combine a fluorescent protein with a Ca2+ binding domain. | Compared to synthetic dyes, GCaMPs have a slower response time. | High specificity and sensitivity. | Shen et al., 2018 Berlin et al., 2015 [85,86] Cho, J. et al., 2017 [87] |
| 4. | Rhod-2 | This dye is particularly useful for studying mitochondrial Ca2+ dynamics and it has a red fluorescence. | Cytotoxicity risk is higher. | Due to its red fluorescence, effective imaging of mitochondrial Ca2+ levels. | Drummond et al., 2000 [88] Grynkiewicz et al., 1985 [89] |
| 5. | Cal-590 | A red-emitting dye that is useful for multiplex imaging with green and blue fluorophores, providing bright fluorescence. | Limited commercially available data on biological compatibility. | High signal-to-noise ratio. | Tischbirek et al., 2015 [90] |
| 6. | Cal-520 | It is suitable for high-throughput screening and imaging applications. | It is sensitive to loading variability and photobleaching like other non-ratiometric dyes. | A green, fluorescent dye with improved brightness and signal-to-noise ratio compared to Fluo-4. | Lock et al., 2015 [91] |
| 7. | Oregon Green 488 BAPTA-1 (OGB-1) | Used for detecting rapid Ca2+ changes in neuronal and other excitable cells. | Non-ratiometric nature may show some errors in heterogeneous tissue environment. | A highly sensitive dye with fast kinetics. | Russell et al., 2011, Tada et al., 2014 [13,92] |
| 8. | Indo-1 | A ratiometric dye that allows reducing artifacts caused by dye concentration or cell thickness variations. | Indo-1 requires UV excitation, increasing phototoxicity risk. | Dual-emission measurements, providing accurate quantification of Ca2+ levels. | Bannwarth et al., 2009 [93] Ryan, J. et al., 2011 [94] |
Disclaimer/Publisher’s Note: The statements, opinions and data contained in all publications are solely those of the individual author(s) and contributor(s) and not of MDPI and/or the editor(s). MDPI and/or the editor(s) disclaim responsibility for any injury to people or property resulting from any ideas, methods, instructions or products referred to in the content. |
© 2024 by the authors. Licensee MDPI, Basel, Switzerland. This article is an open access article distributed under the terms and conditions of the Creative Commons Attribution (CC BY) license (https://creativecommons.org/licenses/by/4.0/).
Share and Cite
Oak, P.M.; Mali, A.S. Advancements in Cellular Imaging: Expanding Horizons with Innovative Dyes and Techniques. Colorants 2024, 3, 360-377. https://doi.org/10.3390/colorants3040025
Oak PM, Mali AS. Advancements in Cellular Imaging: Expanding Horizons with Innovative Dyes and Techniques. Colorants. 2024; 3(4):360-377. https://doi.org/10.3390/colorants3040025
Chicago/Turabian StyleOak, Payal M., and Akash S. Mali. 2024. "Advancements in Cellular Imaging: Expanding Horizons with Innovative Dyes and Techniques" Colorants 3, no. 4: 360-377. https://doi.org/10.3390/colorants3040025
APA StyleOak, P. M., & Mali, A. S. (2024). Advancements in Cellular Imaging: Expanding Horizons with Innovative Dyes and Techniques. Colorants, 3(4), 360-377. https://doi.org/10.3390/colorants3040025