
Analysis of a Probe of the Historical Dye Aldehyde Green Deposited in the Historical Dyestuff Collection of the Technical University Dresden


Abstract
:
1. Introduction
2. Methods
2.1. Elemental Analysis
2.2. Thin-Layer Chromatography
2.3. 1H NMR Measurements
2.4. UV/Vis Spectroscopy
2.5. Liquid Chromatography-Mass Spectrometry (LC-MS)
3. Results and Discussion
4. Summary
Supplementary Materials
Author Contributions
Funding
Acknowledgments
Conflicts of Interest
References
- Noelting, E.; Lehne, A. Anilinschwarz und seine Anwendung in Färberei und Zeugdruck; Springer: Berlin/Heidelberg, Germany, 1892. [Google Scholar]
- Willstätter, R. Über Anilinschwarz. Ber. Dtsch. Chem. Ges. 1907, 40, 2665–2689, 1909, 42, 2147–2168; 1909, 42, 4118–4135. [Google Scholar] [CrossRef]
- Karr, A.E. Historical review via aniline black. Am. Dyestuff Rep. 1937, 26, 631–632, 642–643. [Google Scholar]
- Weissgerber, R. Chemische Technologie des Steinkohlenteers; O. Spanner: Leipzig, Germany, 1923. [Google Scholar]
- Caro, H. Die Entwicklung der Teerfarbenindustrie. Ber. Dtsch. Chem. Ges. 1892, 25, 9. [Google Scholar]
- Meth-Cohn, O.; Smith, M. What did W. Perkin actually make when he oxidised aniline to obtainMauveine. J. Chem. Soc. Perkin Trans. 1 1999, 1, 5–7. [Google Scholar]
- Sousa, M.M.; Melo, M.J.; Parola, A.J.; Morris, P.J.T.; Rzepa, H.S.; de Melo, J.S.S. A Study in Mauve: Unveiling Perkin's Dye in Historic Samples. Chem. Eur. J. 2008, 14, 8507–8513. [Google Scholar] [CrossRef]
- Cooksey, C.; Dronsfield, A. Fuchsine or Magenta: The second most famous aniline dye. A Short memoir on the 150th anniversary of the first commercial production of this well-known dye. Biotech. Histochem. 2009, 84, 179–183. [Google Scholar] [CrossRef] [PubMed]
- Zollinger, H. Diazo Chemistry, Aromatic and Heteroaromatic Compounds; VCH: Weinheim, Germany; New York, NY, USA; Basel, Switzerland; Cambridge, UK; Tokyo, Japan, 1994. [Google Scholar]
- Krätz, O. Peter Griess (1829–1889). CHIUZ 1976, 10, 42–47. [Google Scholar]
- Friedel, C.; Crafts, J.M. Bereitung des grünen Anilins. J. Prakt. Chem. 1864, 92, 337. [Google Scholar]
- Fuchs, R.; Oltrogge, D. Von Läusen und Wurzeln zum Teerfarbstoff, in A. Paetz gen Schieck, I. Fleischmann-Heck. In Zeitkolorit, Mode und Chemie im Farbenrausch 1850–1930; Nürnberg-Asmus Verlag Media GmbH: Oppenheim, Germany, 2019; ISBN 978-3-96176-100-5. [Google Scholar]
- Hofmann, A.W. Über die chemische Natur des Anilingrüns. Ber. Dtsch. Chem. Ges. 1869, 2, 442–452. [Google Scholar]
- Hofmann, A.E. Über die violetten Farbabkömmlinge der Methylaniline. Ber. Dtsch. Chem. Ges. 1873, 6, 365–368. [Google Scholar] [CrossRef]
- Bolley, P.A.; Koop, E.; Gnahm, E.; Meyer, R.E. Die Theerfarbstoffe; Vieweg und Sohn: Braunschweig, Germany, 1874. [Google Scholar]
- Fischer, O. Über Kondensationsprodukte tertiärer aromatischer Basen. Ber. Dtsch. Chem. Ges. 1877, 10, 1623–1626. [Google Scholar] [CrossRef]
- Gattermann, L.; Wiechmann, L. Über Aldehydgrün. Ber. Dtsch. Chem. Ges. 1889, 22, 227–236. [Google Scholar] [CrossRef]
- Miller, H.V.; Plöschl, J. Über Aldehydgrün. Ber. Dtsch. Chem. Ges. 1891, 24, 1700–1715. [Google Scholar] [CrossRef]
- Hartmann, H. The Historical Dyestuff Collection at the Technical University Dresden: A Cultural-Historical Treasure and a rich source of light-absorbing materials with Great prospects for current and future research. ChemPhotoChem 2021, 5, 619–625. [Google Scholar] [CrossRef]
- Schultz, G. Farbstofftabellen, 7th ed.; Akademische Verlagsgesellschaft: Leipzig, Germany, 1931. [Google Scholar]
- Couier, H. Über die neue Methode zur Darstellung des Fuchsins. Ber. Dtsch. Chem. Ges. 1973, 6, 423. [Google Scholar] [CrossRef]
- Scheinert, W. Triphenylmethanfarbstoffe bei den chemischen Fabriken vorm. Weiler-ter Meer. Mitteilungen GDCh 2009, 20, 43–67. [Google Scholar]
- Plater, M.J.; Raab, A. Liquid chromatography-mass spectrometry analysis of Mauveine and Phenosafranins in the black precipitate from the Bradford Colour experience museum. J. Chem. Res. 2019, 43, 367–379. [Google Scholar] [CrossRef]
- Plater, M.J.; Raab, A.; Hartmann, H. Liquid chromatography-mass spectrometry analysis of cationic aniline dyes from the Technical University of Dresden historical collection of dyes. J. Chem. Res. 2020, 44, 326–335. [Google Scholar] [CrossRef]
- Plater, M.J.; Raab, A.; Hartmann, H. Violet dyes of the 1860s: Violet de Paris, Wanklyn’s, and Crystal Violet. J. Chem. Res. 2023, 47, 7475198231196759. [Google Scholar] [CrossRef]
- Plater, M.J.; Raab, A.; Hartmann, H. Liquid Chromatography-Mass Spectrometry analysis of some early green dyes. J. Chem. Res. 2024, 48, 17475198241281202. [Google Scholar] [CrossRef]
- Reinke, O.; Machill, S.; Hartmann, H. Analysis of certain samples of phenazine dyes from the Historical Dyestuff Collection of the Technical University Dresden by liquid chromatography-mass spectrometry. J. Chem. Res. 2022, 46, 17475198221109187. [Google Scholar] [CrossRef]
- de Oca, M.N.M.; Aiassa, I.M.; Urrutia, M.N.; Arguello, G.A.; Ortiz, C.S. Separation, purification, and characterization of analogues components of a commercial sample of New Fuchsin. J. Chrom. Sci. 2010, 48, 618–623. [Google Scholar] [CrossRef] [PubMed]
- Liu, J.; Zhou, Y.; Zhao, F.; Peng, Z.; Wang, S. Identification of early synthetic dyes in historical Chinese textiles of the late nineteenth century by high-performance liquid chromatography coupled with diode array detection and mass spectrometry. Color. Techn. 2016, 132, 177–185. [Google Scholar] [CrossRef]
- Germinario, G.; Rigante, E.C.L.; van der Werf, I.D.; Sabbatini, L. Pyrolysis gas chromatography-mass spectrometry of triarylmethane dyes. J. Anal. Appl. Pyrolysis 2017, 127, 229–239. [Google Scholar] [CrossRef]
- Degano, I.; Sabatini, F.; Braccini, C.; Colombini, M.P. Triarylmethine dyes: Characterization of isomers using integrated mass spectrometry. Dyes Pigm. 2019, 160, 587–596. [Google Scholar] [CrossRef]
- Petroviciu, I.; Teodorescu, I.; Vasilca, S.; Albu, F.; Medvedovici, A. Liquid chromatography as analytical tool for the study of natural and early synthetic dyes in traditional Saxon textiles. Herit. Sci. 2023, 11, 164. [Google Scholar] [CrossRef]
- Novak, F.P.; Hercules, D.M. Thin layer chromatography-laser mass spectrometry (TLC-LMS) of triphenylmethane dyes: Initial results. Anal. Lett. 1985, 18, 501–503. [Google Scholar] [CrossRef]
- Sandstrom, E.; Vettorazzo, C.; Mackay, C.L.; Troalen, L.G.; Hulme, A.N. Development and Application of Desorption Electrospray Ionization Mass Spectrometry for Historical Dye Analysis. Anal. Chem. 2023, 95, 4846–4854. [Google Scholar] [CrossRef]
- Tamburini, D.; Sabatini, F.; Berbers, S.; van Rommels, M.R.; Degano, I. An introduction and recent advances in the analytical studies of early synthetic dyes and organic pigments in cultural heritage. Heritage 2024, 7, 1969–2010. [Google Scholar] [CrossRef]
- Tamborini, D. On the reliability of historic books as source of reference samples of early synthetic dyes—The case of “The Coal Tar Colours of the Farbwerke vorm. Meisster, Lucius & Brüning. Höchst on the Main, Germany—A General Part“ (1896). Dyes Pigm. 2024, 221, 111796. [Google Scholar]
- Tamborini, D.; Shimada, C.K.; McCarthy, B. The molecular characterisation of early synthetic dyes in the E. Knecht’s et al.’s textile simple book “A Manual of Dyeing” (1893) by high performance liquid chromatography –Diode array detector –Mass spectrometry (HPKC-DAD-MS). Dyes Pigm. 2021, 190, 109286. [Google Scholar] [CrossRef]
- EBergmann, D.; Ginsburg, D.; Rappo, R. The Michael addition. Org. React. 1959, 10, 179–563. [Google Scholar]
- Yamashkin, S.A.; Oreshkina, E.A. Traditional and modern approaches to the synthesis of quinolone system by the Skraub and Doebner-Miller methods. Chem. Heterocycl. Comp. 2006, 42, 701–718. [Google Scholar] [CrossRef]
- Heravi, M.M.; Asadi, S.; Azarakhshi, F. Recent applications of Doebner-von Miller and Knoevenagel-Doebner reactions inorganic synthesis. Curr. Org. Synth. 2014, 11, 701–731. [Google Scholar] [CrossRef]
- Lukes, V.; Hartmann, H. On the NH and CH acidity of toluidine isomers: Theoretical description and practical consequences for the synthesis of certain aniline dyes. Color. Techn. 2021, 137, 389–398. [Google Scholar] [CrossRef]
- Fabian, J.; Hartmann, H. Light Absorption of Organic Colorants; Springer: Berlin/Heidelberg, Germany; New York, NY, USA, 1980. [Google Scholar]
- Noack, A.; Schröder, A.; Hartmann, H. Synthesis and spectral characterisation of a series of new heterocyclic triphenylmethane dyes. Dyes Pigm. 2003, 57, 131–147. [Google Scholar] [CrossRef]
- Wieland, H.; Scheuing, G. Die fuchsinschwefelige Säure und ihre Farbreaktion mit Aldehyden. Ber. Dtsch. Chem. Ges. 1921, 54, 2527–2555. [Google Scholar] [CrossRef]
- Proctor, G.B.; Horobin, R.W. The aging of Gomori’s Aldehyde-Fuchsin: The Nature of the Chemical Change and the Chemical Structures of the Coloured Components. Histochemistry 1983, 77, 255–267. [Google Scholar] [CrossRef]
- Dapson, R. Schiff and pseudo-Schiff reagents: The reactions and reagents of Hugo Schiff, including a classification of various kinds of histochemical reagents used to detect aldehydes. Biotech. Histochem. 2016, 91, 522–531. [Google Scholar] [CrossRef]
- Meloan, S.N.; Puchter, H. On the structure and chemistry of leucofuchsine and Schiff’s reagent. J. Histotechn. 1986, 9, 119–122. [Google Scholar] [CrossRef]
- Robins, J.H.; Abrams, G.D.; Pincock, D.J.A. The structure of Schiff reagent aldehyde adducts and the mechanism of the Schiff reaction as determined by nuclear magnetic resonance spectroscopy. Canad. J. Chem. 1980, 58, 339–347. [Google Scholar] [CrossRef]
- Hantzsch, A. Zur Constitutionsbestimmung von Körpern mit labilen Atomgruppen. Ber. Dtsch. Chem. Ges. 1899, 32, 575–600. [Google Scholar] [CrossRef]


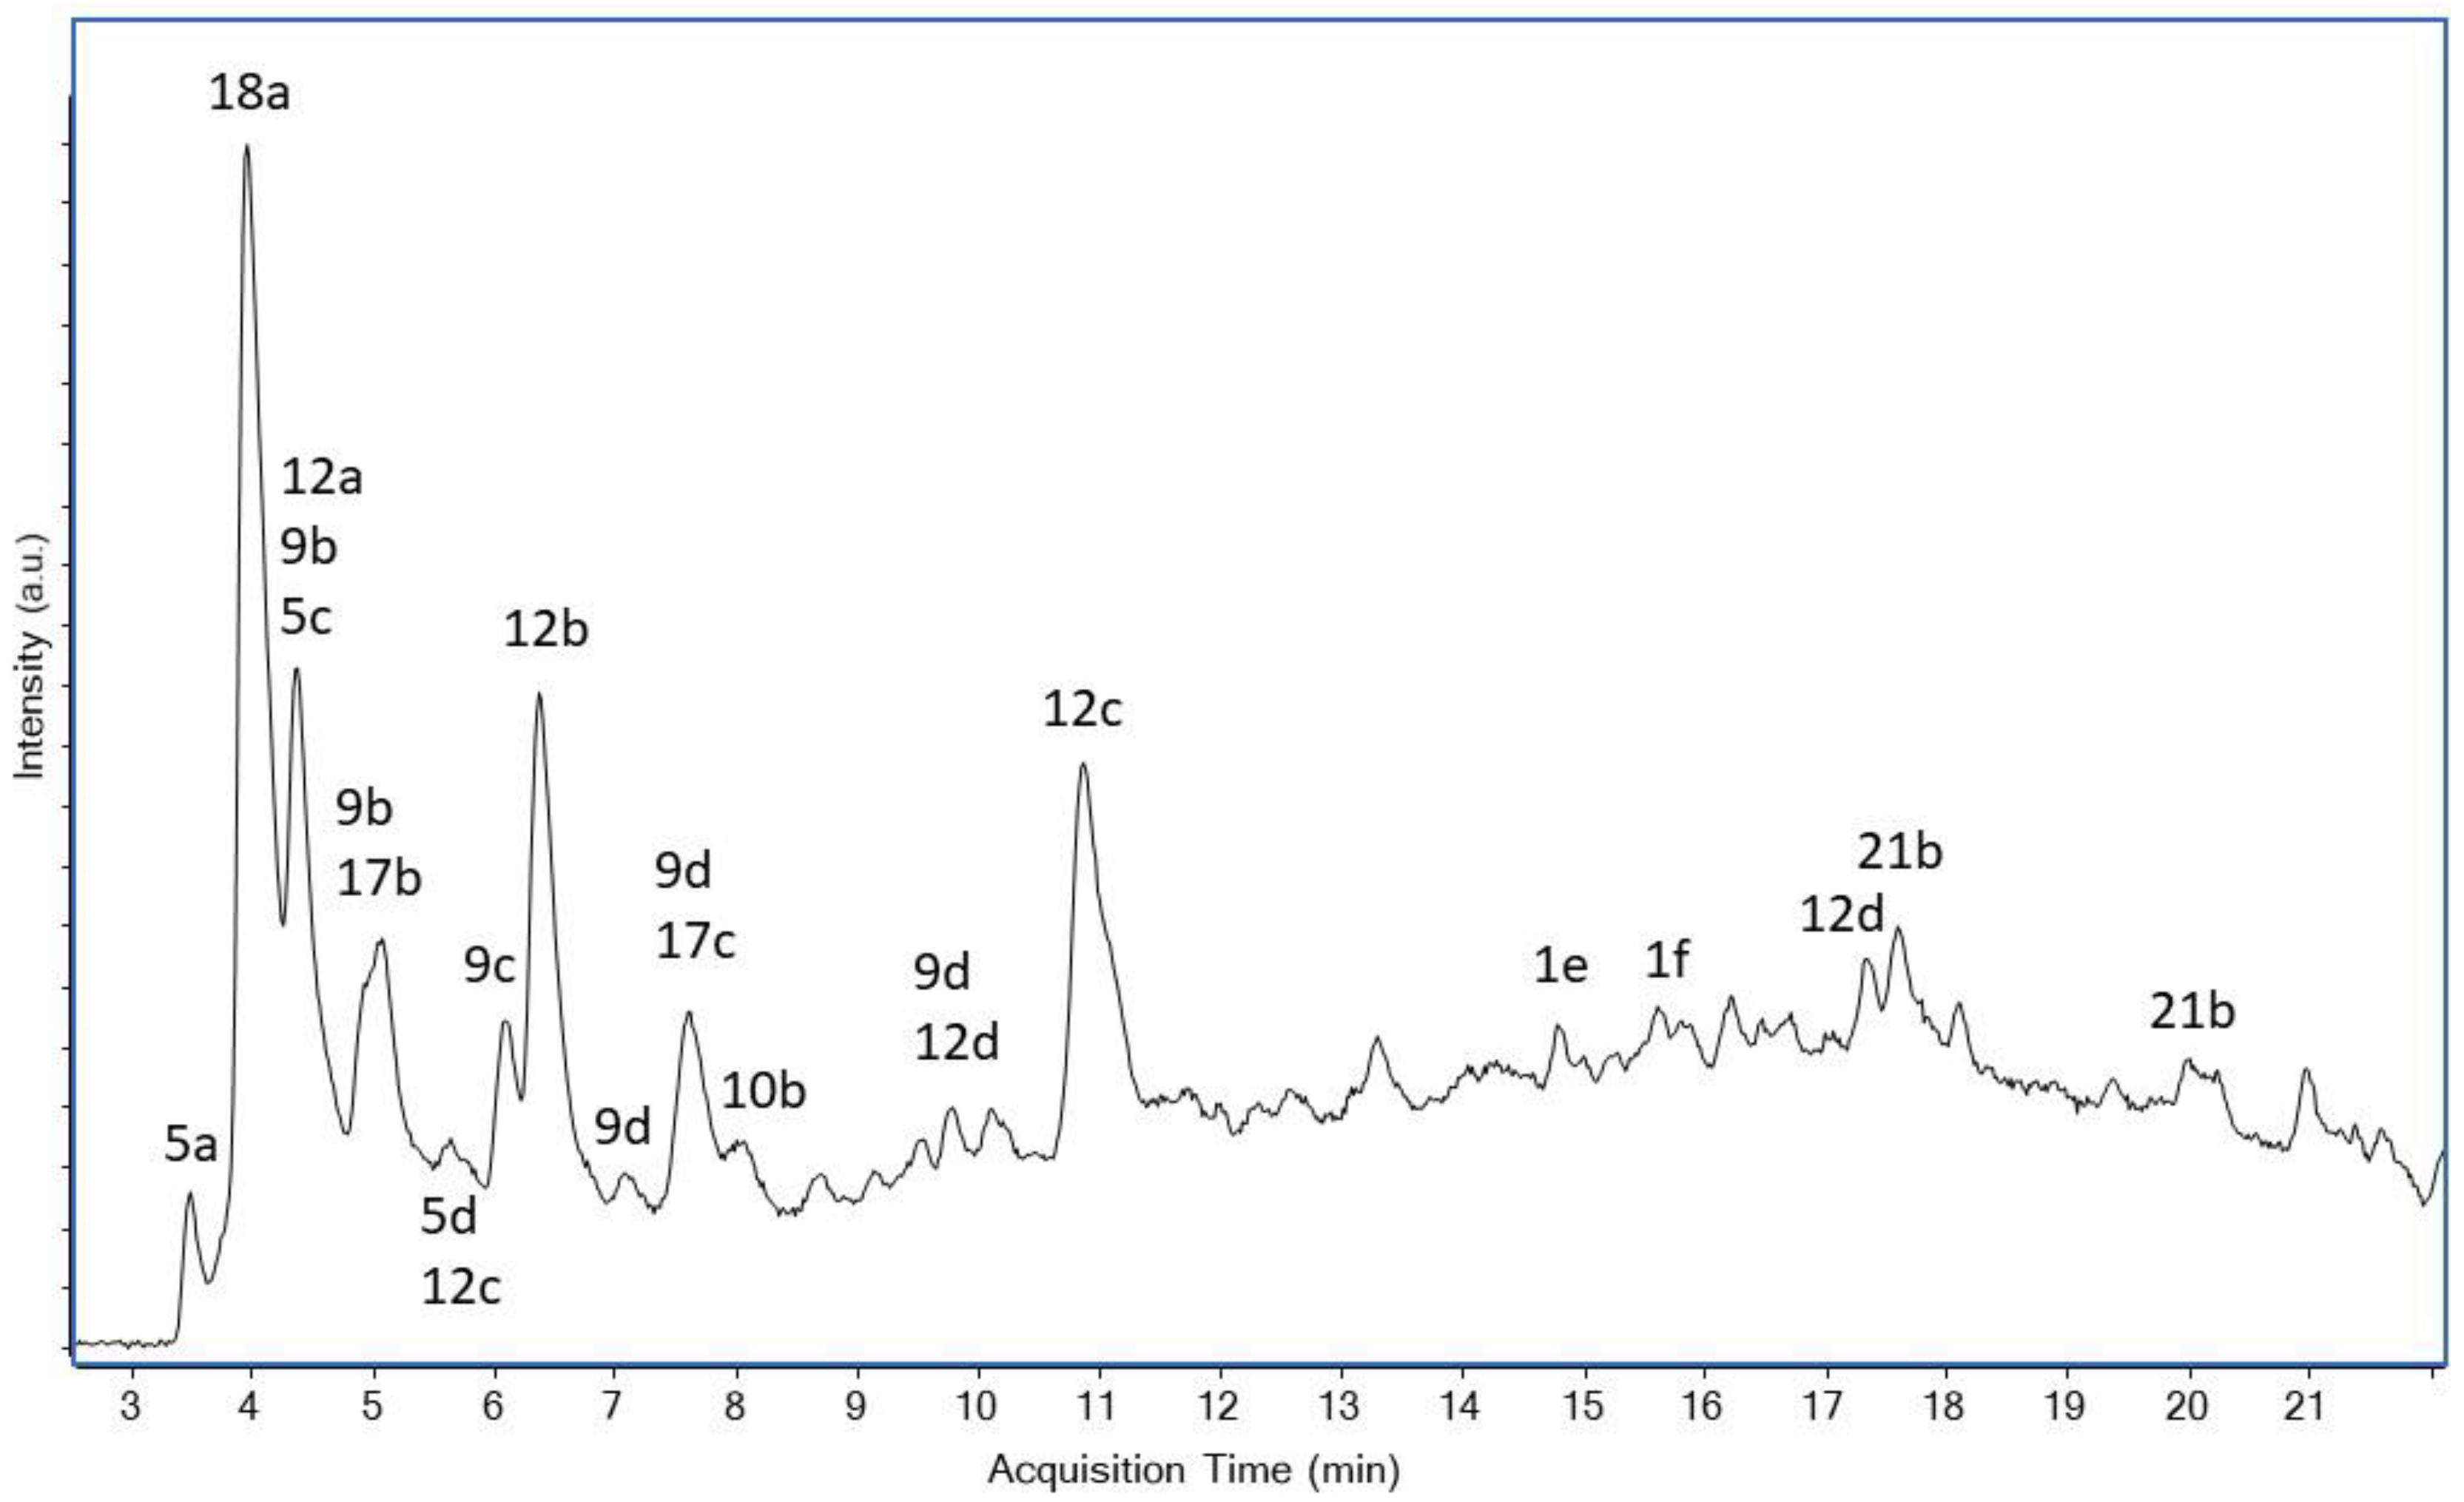
| Compound | Composition | Exact Mass | Measured Mass | Retention Time/min | Area | Amount | |
|---|---|---|---|---|---|---|---|
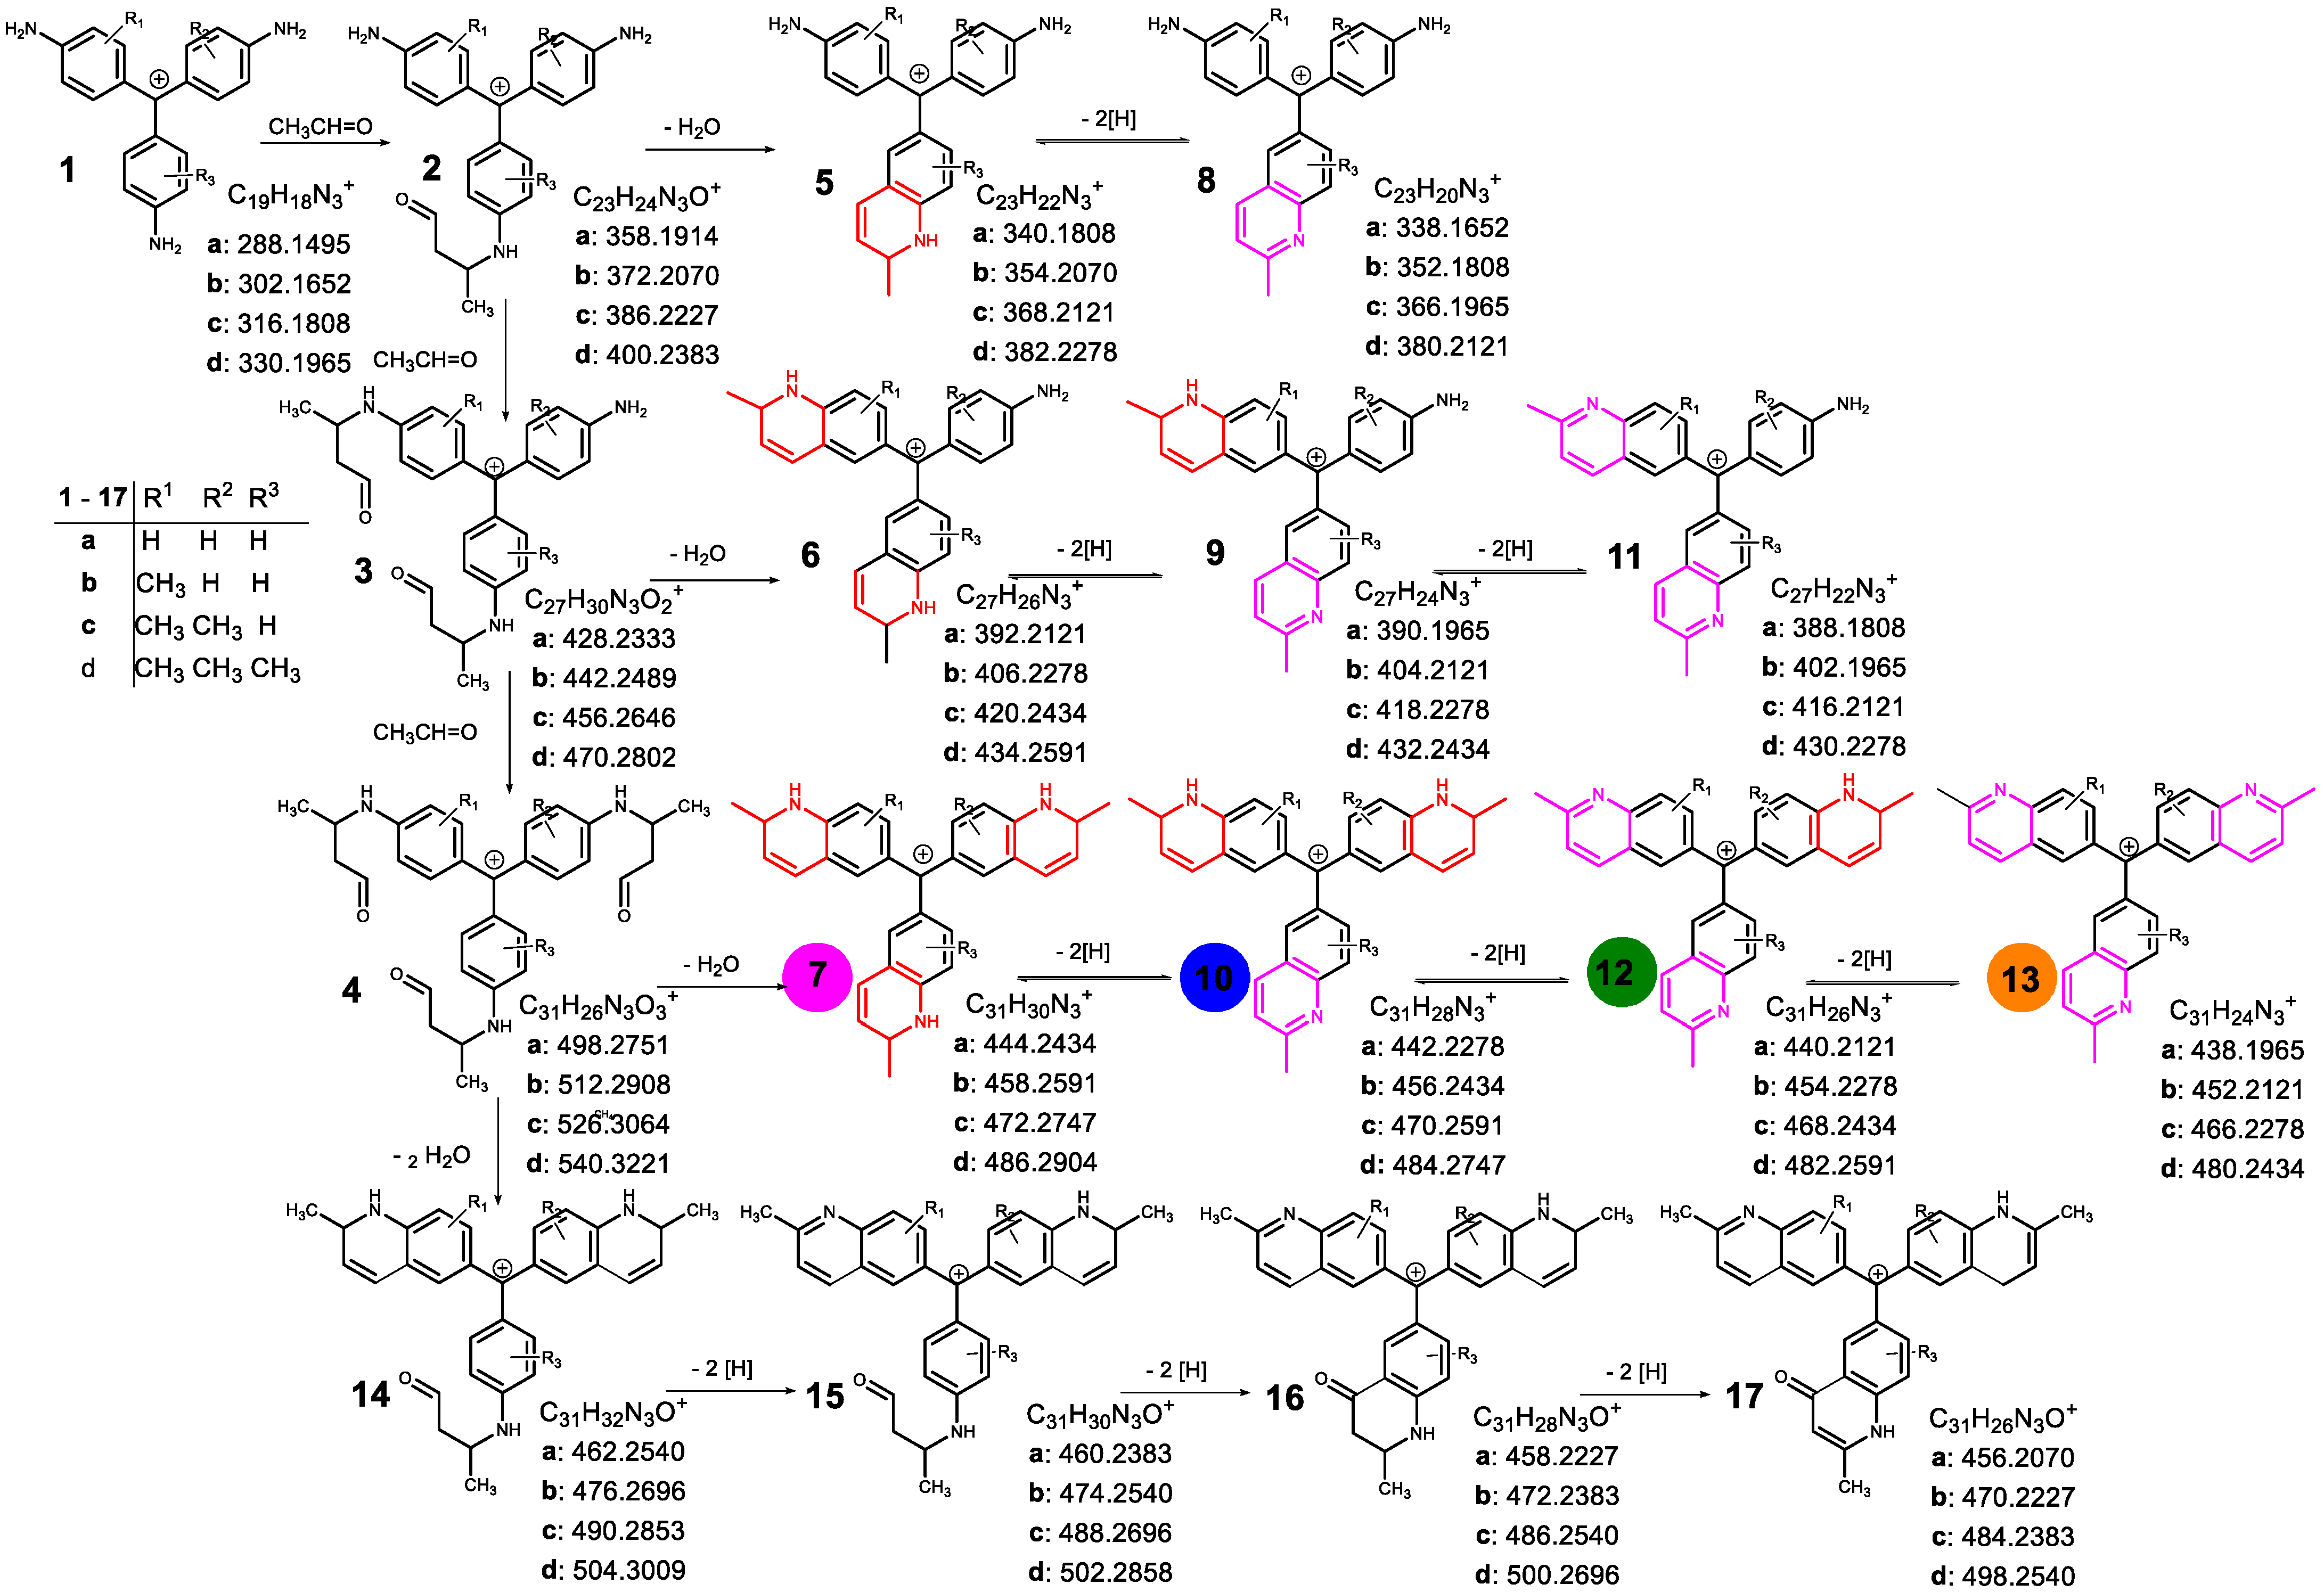
| 1 | a | C18H18N3+ | 288.1495 | 288.1488 | 9.33 | 1.3 × 10⁶ | + |
| b | C19H20N3+ | 302.1652 | 302.1640 | 10.77 | 6.1 × 10⁶ | + | |
| c | C20H22N3+ | 316.1808 | 316.1797 | 10.87; 11.99; 12.90 | 9.9 × 10⁶ | + | |
| d | C21H24N3+ | 330.1965 | 330.1950 | 11.99; 13.04; 13.50; 13.88 | 1.2 × 10⁷ | ++ | |
| e | C22H26N3+ | 344.2121 | 344.2111 | 14.42; 14.77; 15.42 | 1.6 × 10⁷ | ++ | |
| f | C23H28N3+ | 358.2278 | 358.2262 | 15.27; 15.90; 16.15 | 1.2 × 10⁷ | ++ | |
| 5 | a | C23H22N3+ | 340.1808 | 340.1793 | 3.67 | 8.2 × 10⁶ | + |
| b | C24H24N3+ | 354.1965 | 354.1952 | 3.87 | 2.3 × 10⁷ | ++ | |
| c | C25H26N3+ | 368.2121 | 368.2108 | 4.23; 4.62 | 1.9 × 10⁷ | ++ | |
| d | C26H28N3+ | 382.2278 | 382.2261 | 4.62; 5.10; 5.60 | 1.5 × 10⁷ | ++ | |
| 9 | a | C27H24N3+ | 390.1965 | 390.1953 | 3.89 | 2.8 × 10⁷ | ++ |
| b | C28H26N3+ | 404.2121 | 404.2104 | 4.35; 4.90 | 6.3 × 10⁷ | ++ | |
| c | C29H28N3+ | 418.2278 | 418.2265 | 4.97; 6.08; 7.48 | 9.5 × 10⁷ | ++ | |
| d | C30H30N3+ | 432.2434 | 432.2419 | 5.63; 7.06; 7.56; 9.04; 9.78 | 3.1 × 10⁷ | ++ | |
| 10 | a | C31H28N3+ | 442.2278 | 442.2260 | 5.82 | 6.3 × 10⁶ | + |
| b | C32H30N3+ | 456.2434 | 456.2420 | 8.08 | 1.1 × 10⁷ | ++ | |
| c | C33H32N3+ | 470.2591 | 470.2575 | 10.09; 10.89 | 1.0 × 10⁷ | ++ | |
| d | C34H34N3+ | 484.2747 | 484.2727 | 12.67 | 3.4 × 10⁶ | + | |
| 12 | a | C31H26N3+ | 440.2121 | 440.2107 | 4.37 | 6.5 × 10⁷ | ++ |
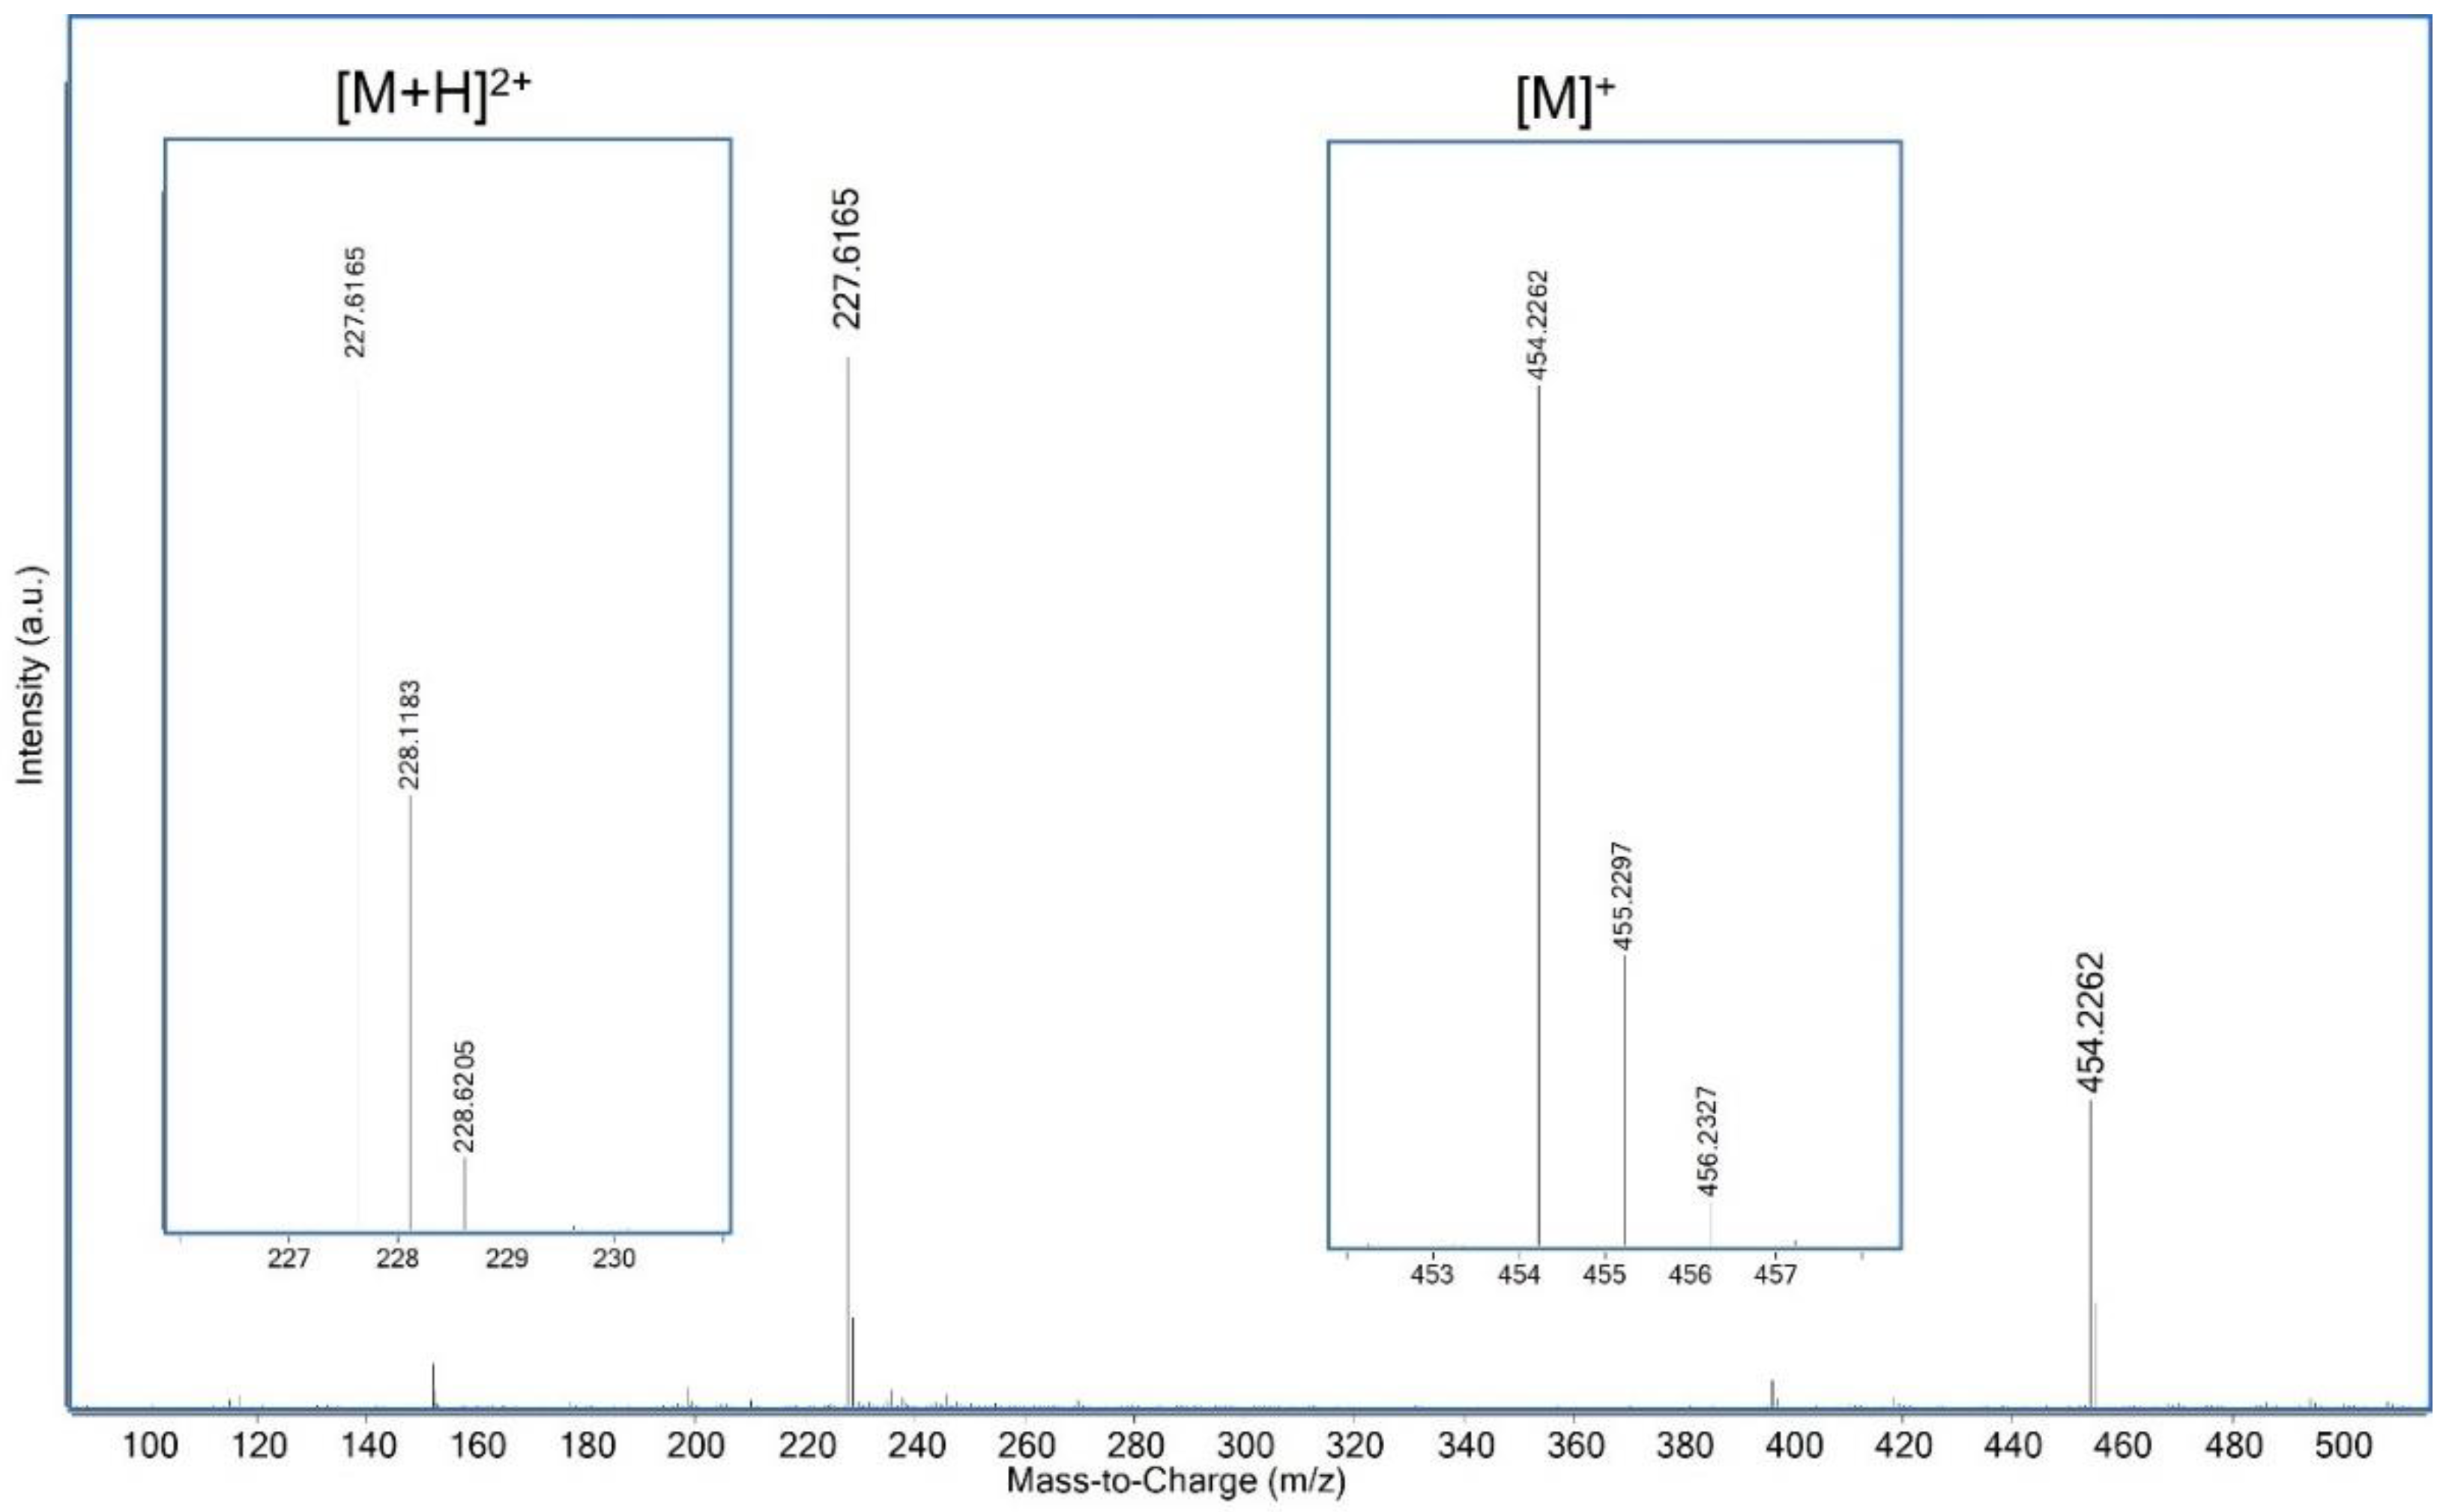
| b | C32H28N3+ | 454.2278 | 454.2262 | 6.38 | 2.2 × 10⁸ | +++ | |
| c | C33H30N3+ | 468.2434 | 468.2416 | 10.87 | 1.9 × 10⁸ | +++ | |
| d | C34H32N3+ | 482.2591 | 482.2572 | 9.79; 10.07; 17.36 | 4.8 × 10⁷ | ++ | |
| 17 | a | C31H26N3O+ | 456.2070 | 456.2054 | 3.97 | 1.6 × 10⁷ | ++ |
| b | C32H28N3O+ | 470.2227 | 470.2210 | 5.08 | 5.5 × 10⁷ | ++ | |
| c | C33H30N3O+ | 484.2383 | 484.2368 | 7.66 | 5.5 × 10⁷ | ++ | |
| d | C34H32N3O+ | 498.2540 | 498.2526 | 11.54 | 1.8 × 10⁷ | ++ | |
| 18 | a | C10H10NO+ | 160.0757 | 160.0748 | 4.12 | 1.2 × 10⁸ | +++ |
| b | C11H12NO+ | 174.0913 | 174.0907 | 4.42 | 4.2 × 10⁷ | ++ | |
| c | C12H14NO+ | 188.1070 | 188.1058 | 5.20 | 2.6 × 10⁶ | + | |
| 21 | a | C21H17N2O+ | 313.1335 | 313.1324 | 10.74 | 3.0 × 10⁷ | ++ |
| b | C22H19N2O+ | 327.1492 | 327.1487 | 17.58; 20.02 | 6.1 × 10⁷ | ++ | |
| c | C23H21N2O+ | 341.1648 | 341.1637 | 21.59 | 2.5 × 10⁷ | ++ | |
Disclaimer/Publisher’s Note: The statements, opinions and data contained in all publications are solely those of the individual author(s) and contributor(s) and not of MDPI and/or the editor(s). MDPI and/or the editor(s) disclaim responsibility for any injury to people or property resulting from any ideas, methods, instructions or products referred to in the content. |
© 2025 by the authors. Licensee MDPI, Basel, Switzerland. This article is an open access article distributed under the terms and conditions of the Creative Commons Attribution (CC BY) license (https://creativecommons.org/licenses/by/4.0/).
Share and Cite
Machill, S.; Voigtmann, M.; Nescholta, D.; Hartmann, H. Analysis of a Probe of the Historical Dye Aldehyde Green Deposited in the Historical Dyestuff Collection of the Technical University Dresden. Colorants 2025, 4, 15. https://doi.org/10.3390/colorants4020015
Machill S, Voigtmann M, Nescholta D, Hartmann H. Analysis of a Probe of the Historical Dye Aldehyde Green Deposited in the Historical Dyestuff Collection of the Technical University Dresden. Colorants. 2025; 4(2):15. https://doi.org/10.3390/colorants4020015
Chicago/Turabian StyleMachill, Susanne, Maximilian Voigtmann, David Nescholta, and Horst Hartmann. 2025. "Analysis of a Probe of the Historical Dye Aldehyde Green Deposited in the Historical Dyestuff Collection of the Technical University Dresden" Colorants 4, no. 2: 15. https://doi.org/10.3390/colorants4020015
APA StyleMachill, S., Voigtmann, M., Nescholta, D., & Hartmann, H. (2025). Analysis of a Probe of the Historical Dye Aldehyde Green Deposited in the Historical Dyestuff Collection of the Technical University Dresden. Colorants, 4(2), 15. https://doi.org/10.3390/colorants4020015