1. Introduction
Water supply systems, due to their belonging to critical infrastructure, must be characterized by an appropriate level of operational reliability and safety [
1,
2]. The reliability of the water supply system is understood as its ability to perform its functions, in accordance with the requirements in terms of its functioning and safety, i.e., providing consumers with water in the right amount, of appropriate quality, under the right pressure, at an acceptable price at any time [
3,
4,
5]. Currently, the topic of water supply is faced with many problems related to, among the others, the lack of access to water in developing regions, the appearance of new pollutants in tap water (microplastics, pharmaceuticals) and the functioning of the existing and aging water supply systems [
1,
3,
5,
6,
7,
8,
9,
10]. Problems related to the operation of existing water supply systems can be effectively solved by appropriate management, taking into account the minimization of water losses, improvement of the quality of the supplied water and increasing the reliability and safety of their operation [
1,
5,
6,
7]. In order to learn about the mechanisms responsible for the reliability and safety of the water supply system functioning, in recent years much research has been done. One of the directions of this research is the water supply network failure analysis [
1,
2,
3,
4,
5,
6,
7,
11,
12,
13,
14,
15]. Over the years, many factors that affect the failure rate of the water supply network have been identified [
3,
5,
6,
7,
11,
16,
17,
18,
19]. There can be distinguished internal (system) factors: pipe material, pipe diameters, age of the system, pressure in the water supply network, flow rate, quality of design, construction and operation of the system, and external (environmental) factors: climate (seasonality, climate change), weather conditions (temperature, rainfall, drought), soil and water conditions (type of soil, frost depth, groundwater level, corrosivity of the soil and groundwater). Research indicates that bigger failure frequency of water supply networks is observed in cold periods due to ground freezing, and in hot and dry periods due to increased water consumption, soil shrinkage, and ground settlements [
11,
17,
18,
20,
21,
22,
23]. The strongest relationships between the values of failure rate were observed for the factor associated with daily temperature [
11,
16,
17,
18,
24]. As the temperature drops, an increase in the failure rate values of the water supply network is observed. With regard to internal factors, it was observed that the value of failure rate is higher for smaller diameters and for older pipes [
5,
17,
18,
22]. AC and steel pipes failed more often in summer, while in winter, it was the cast iron pipes [
16,
17,
18,
21,
22,
23,
25]. Higher failure rates are observed in pipes with high pressure or pipes exposed to big pressure fluctuations [
18,
19]. There have also been several studies on the impact of climate change on the failure rate of the water supply network [
16,
18,
20,
21,
23,
24,
26,
27]. They indicate that the biggest threat to the functioning of water supply networks will be changes related to the increase in temperature, intensifying hot periods, and drought [
18,
21,
23]. The increase in failure rate may occur as a result of the increased demand for water in these periods and, above all, as a result of soil drying out and its shrinkage and settlement [
16,
17,
18,
20,
21,
23,
27]. On the other hand, depending on the direction of climate change, extreme weather phenomena, severe storms, long-term severe frosts may be observed, which have an equally negative impact on the reliability of the water supply network, causing increase of the failure rate values [
16,
18,
23,
24].
The aim of the work was to investigate the influence of negative daily temperatures on the failure rate of the water supply network, taking into account internal factors: material and diameter of the pipes and the causes of failure. The results presented in the paper can be used by water supply companies to better manage the water supply network, in particular when planning the development of the network or renovation of existing sections, minimizing the impact of negative temperatures on the factors influencing the failure rate of the water supply network at an early stage of designing and building new network sections.
3. Results
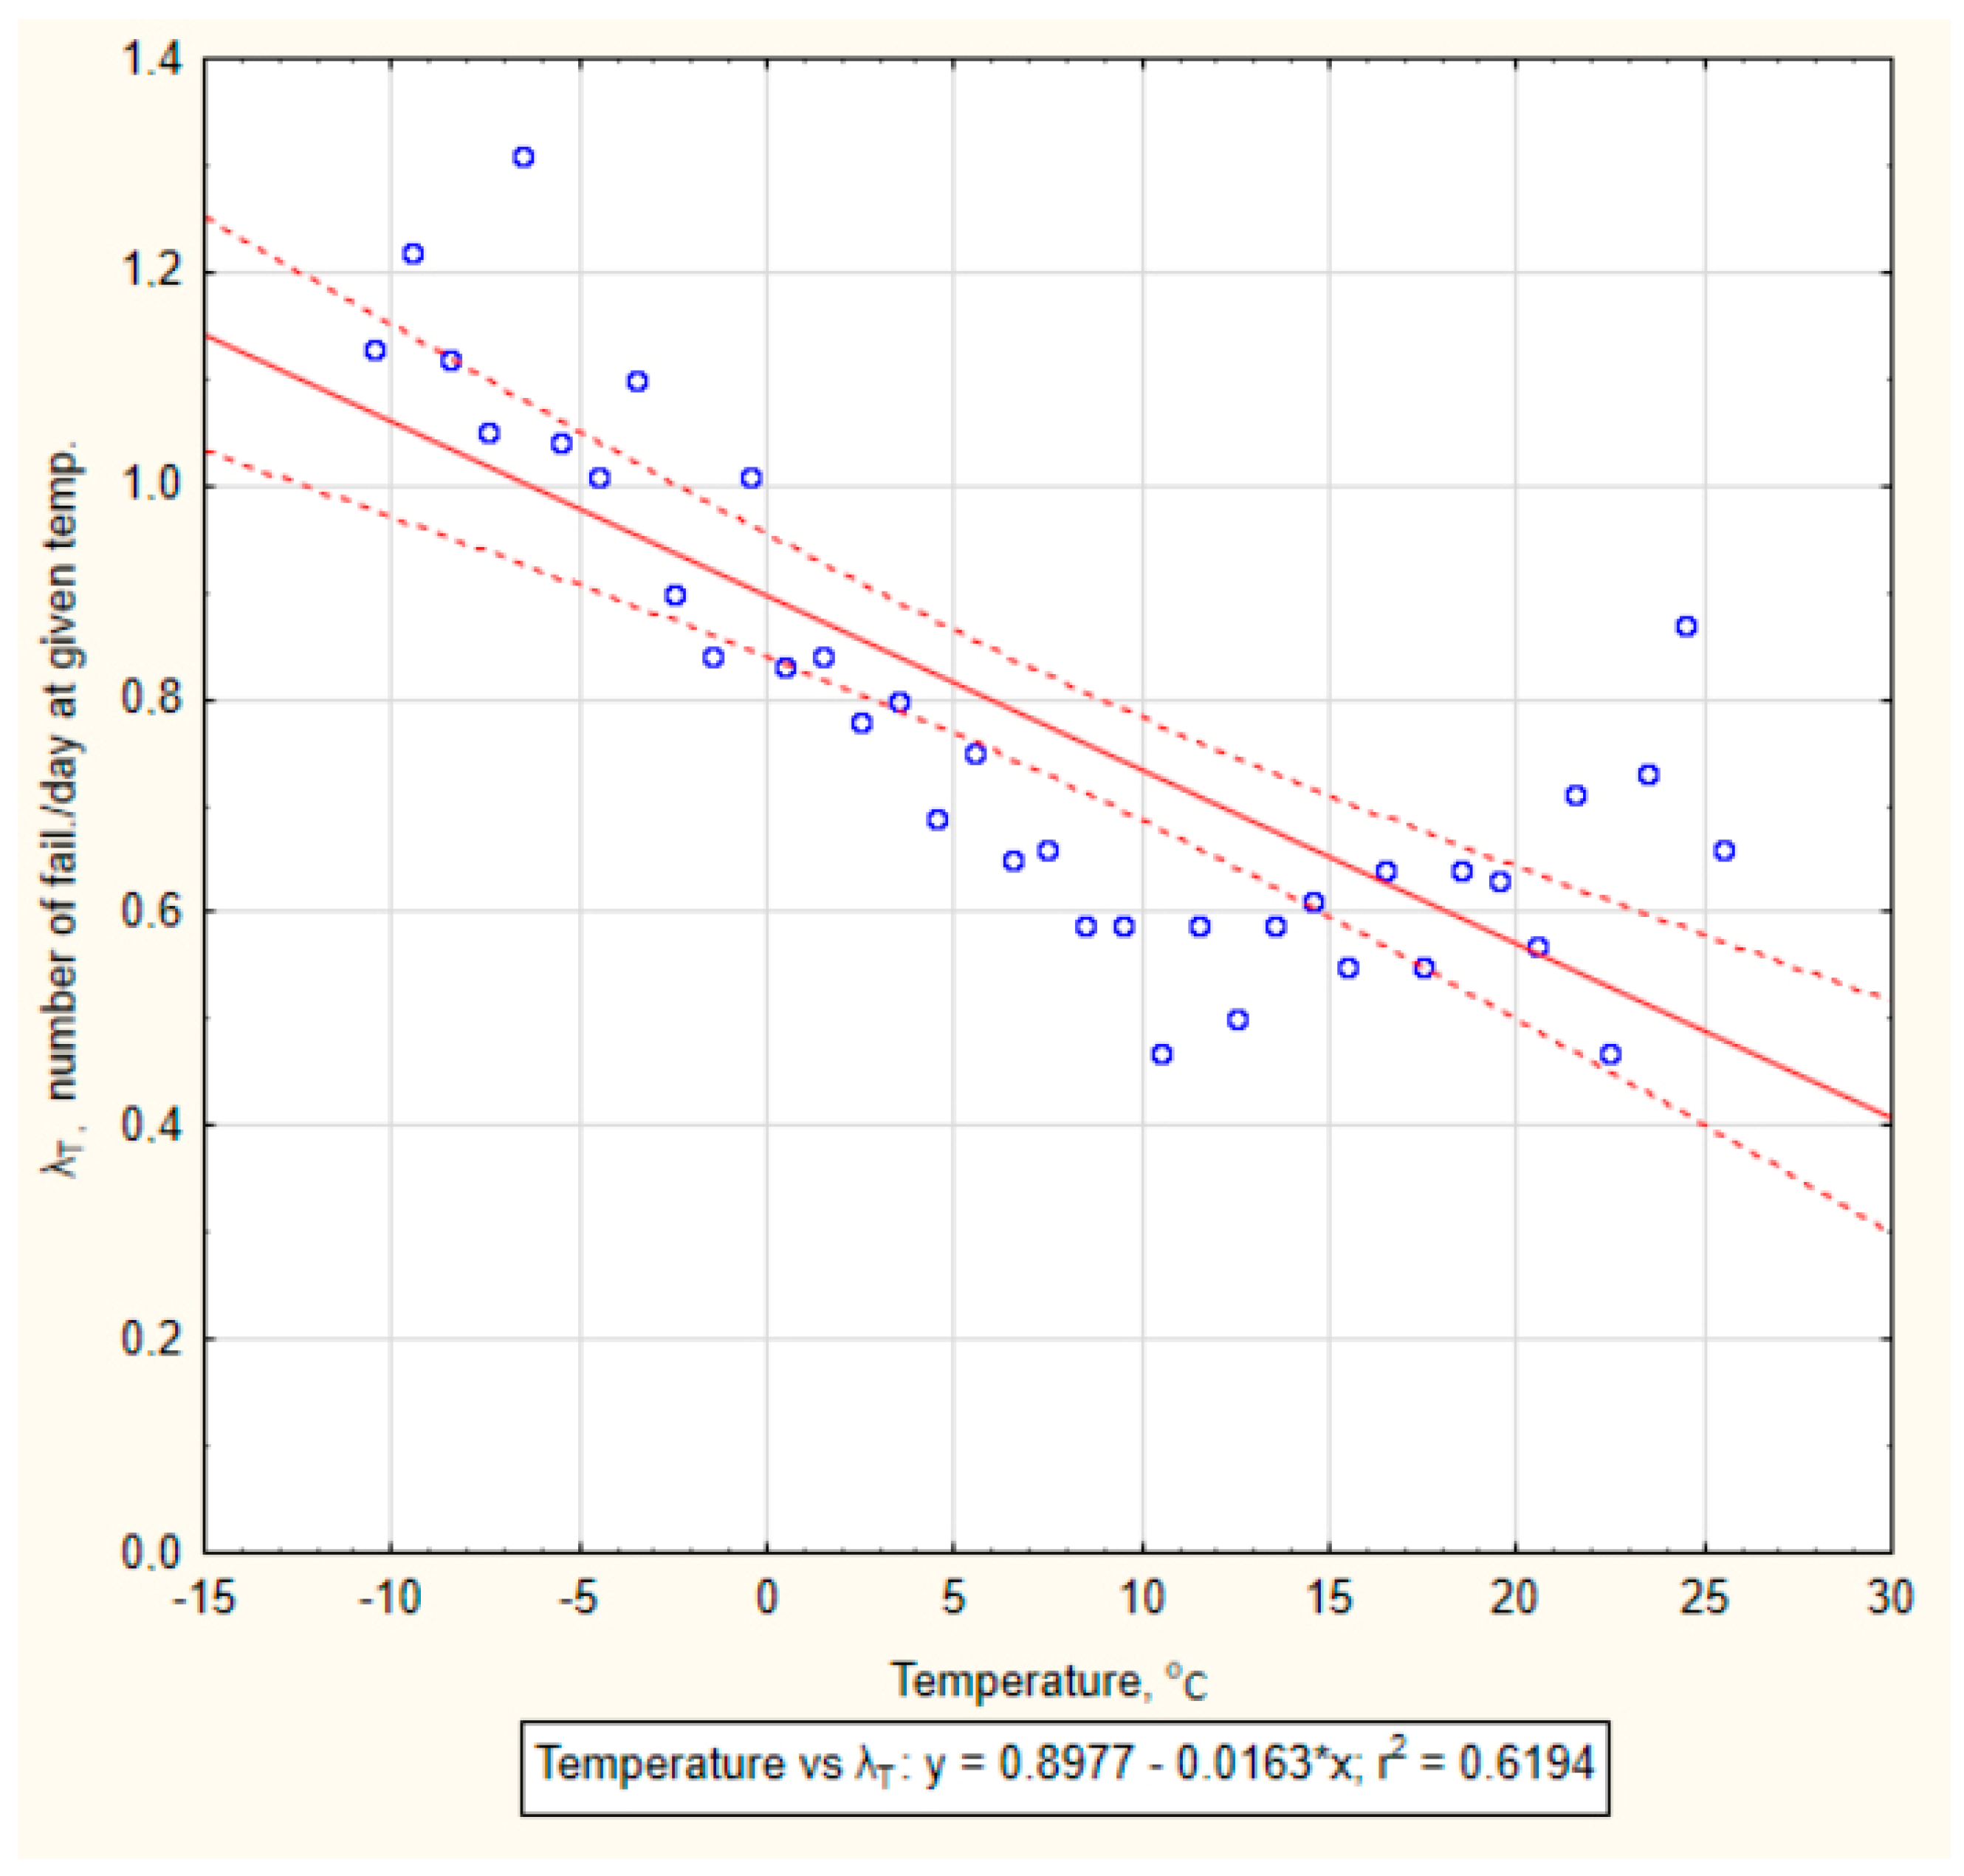
In the first step, the failure rate values in the tested temperature range from −11 °C to 26 °C, for which the minimum required number of measurements was obtained (16 days) was calculated. The results of these calculations are presented in
Supplementary Materials (Table S1). The lowest failure rate values were observed on days with the daily temperature from 10 to 15 °C. The highest values of the failure rate were obtained for negative daily temperatures. It was observed that the number of failures occurring on days with negative temperature is bigger than or equal to the number of days with negative temperature, therefore the failure rate have values above 1 failure per day with a given negative temperature in range (
ti;
ti+1>. This confirms the statement, that there are more failures on days with negative temperatures than on days with positive temperatures.
Figure 1 shows a diagram of the relationship between the failure rate
λT(ti;ti+1>, and the value of daily temperature. For the presented data, the linear regression equation was determined, the Pearson correlation coefficient-
R and the value of the determination coefficient-
R2 were calculated.
The linear regression equation took the form of y = −0.0163x + 0.8977. The negative slope indicates a negative correlation between the examined variables, i.e., the failure rate decreases with increasing temperature. The value of Pearson’s correlation coefficient is R = −0.7870, and the coefficient of determination R2 = 0.6194. This means that 61.94% of changes in the failure rate result directly from changes in the daily temperature value.
For the obtained correlation results, the correlation significance test was carried out. The null hypothesis was adopted as: there is no correlation between the examined variables, and the alternative hypothesis: there is a negative correlation between the examined variables. Using the relationship (3), the test parameter t = −7.547 was determined for the sample size n = 37. For the adopted significance level α = 0.05 and n − 2 degrees of freedom (35), the critical area (−∞; −1.689572> was determined. The calculated test parameter t belongs to the critical area, therefore the null hypothesis should be rejected and an alternative hypothesis adopted (there is a negative correlation between the examined variables). Result of the test confirms the statistical significance of the obtained correlation at the confidence level of 95.0%.
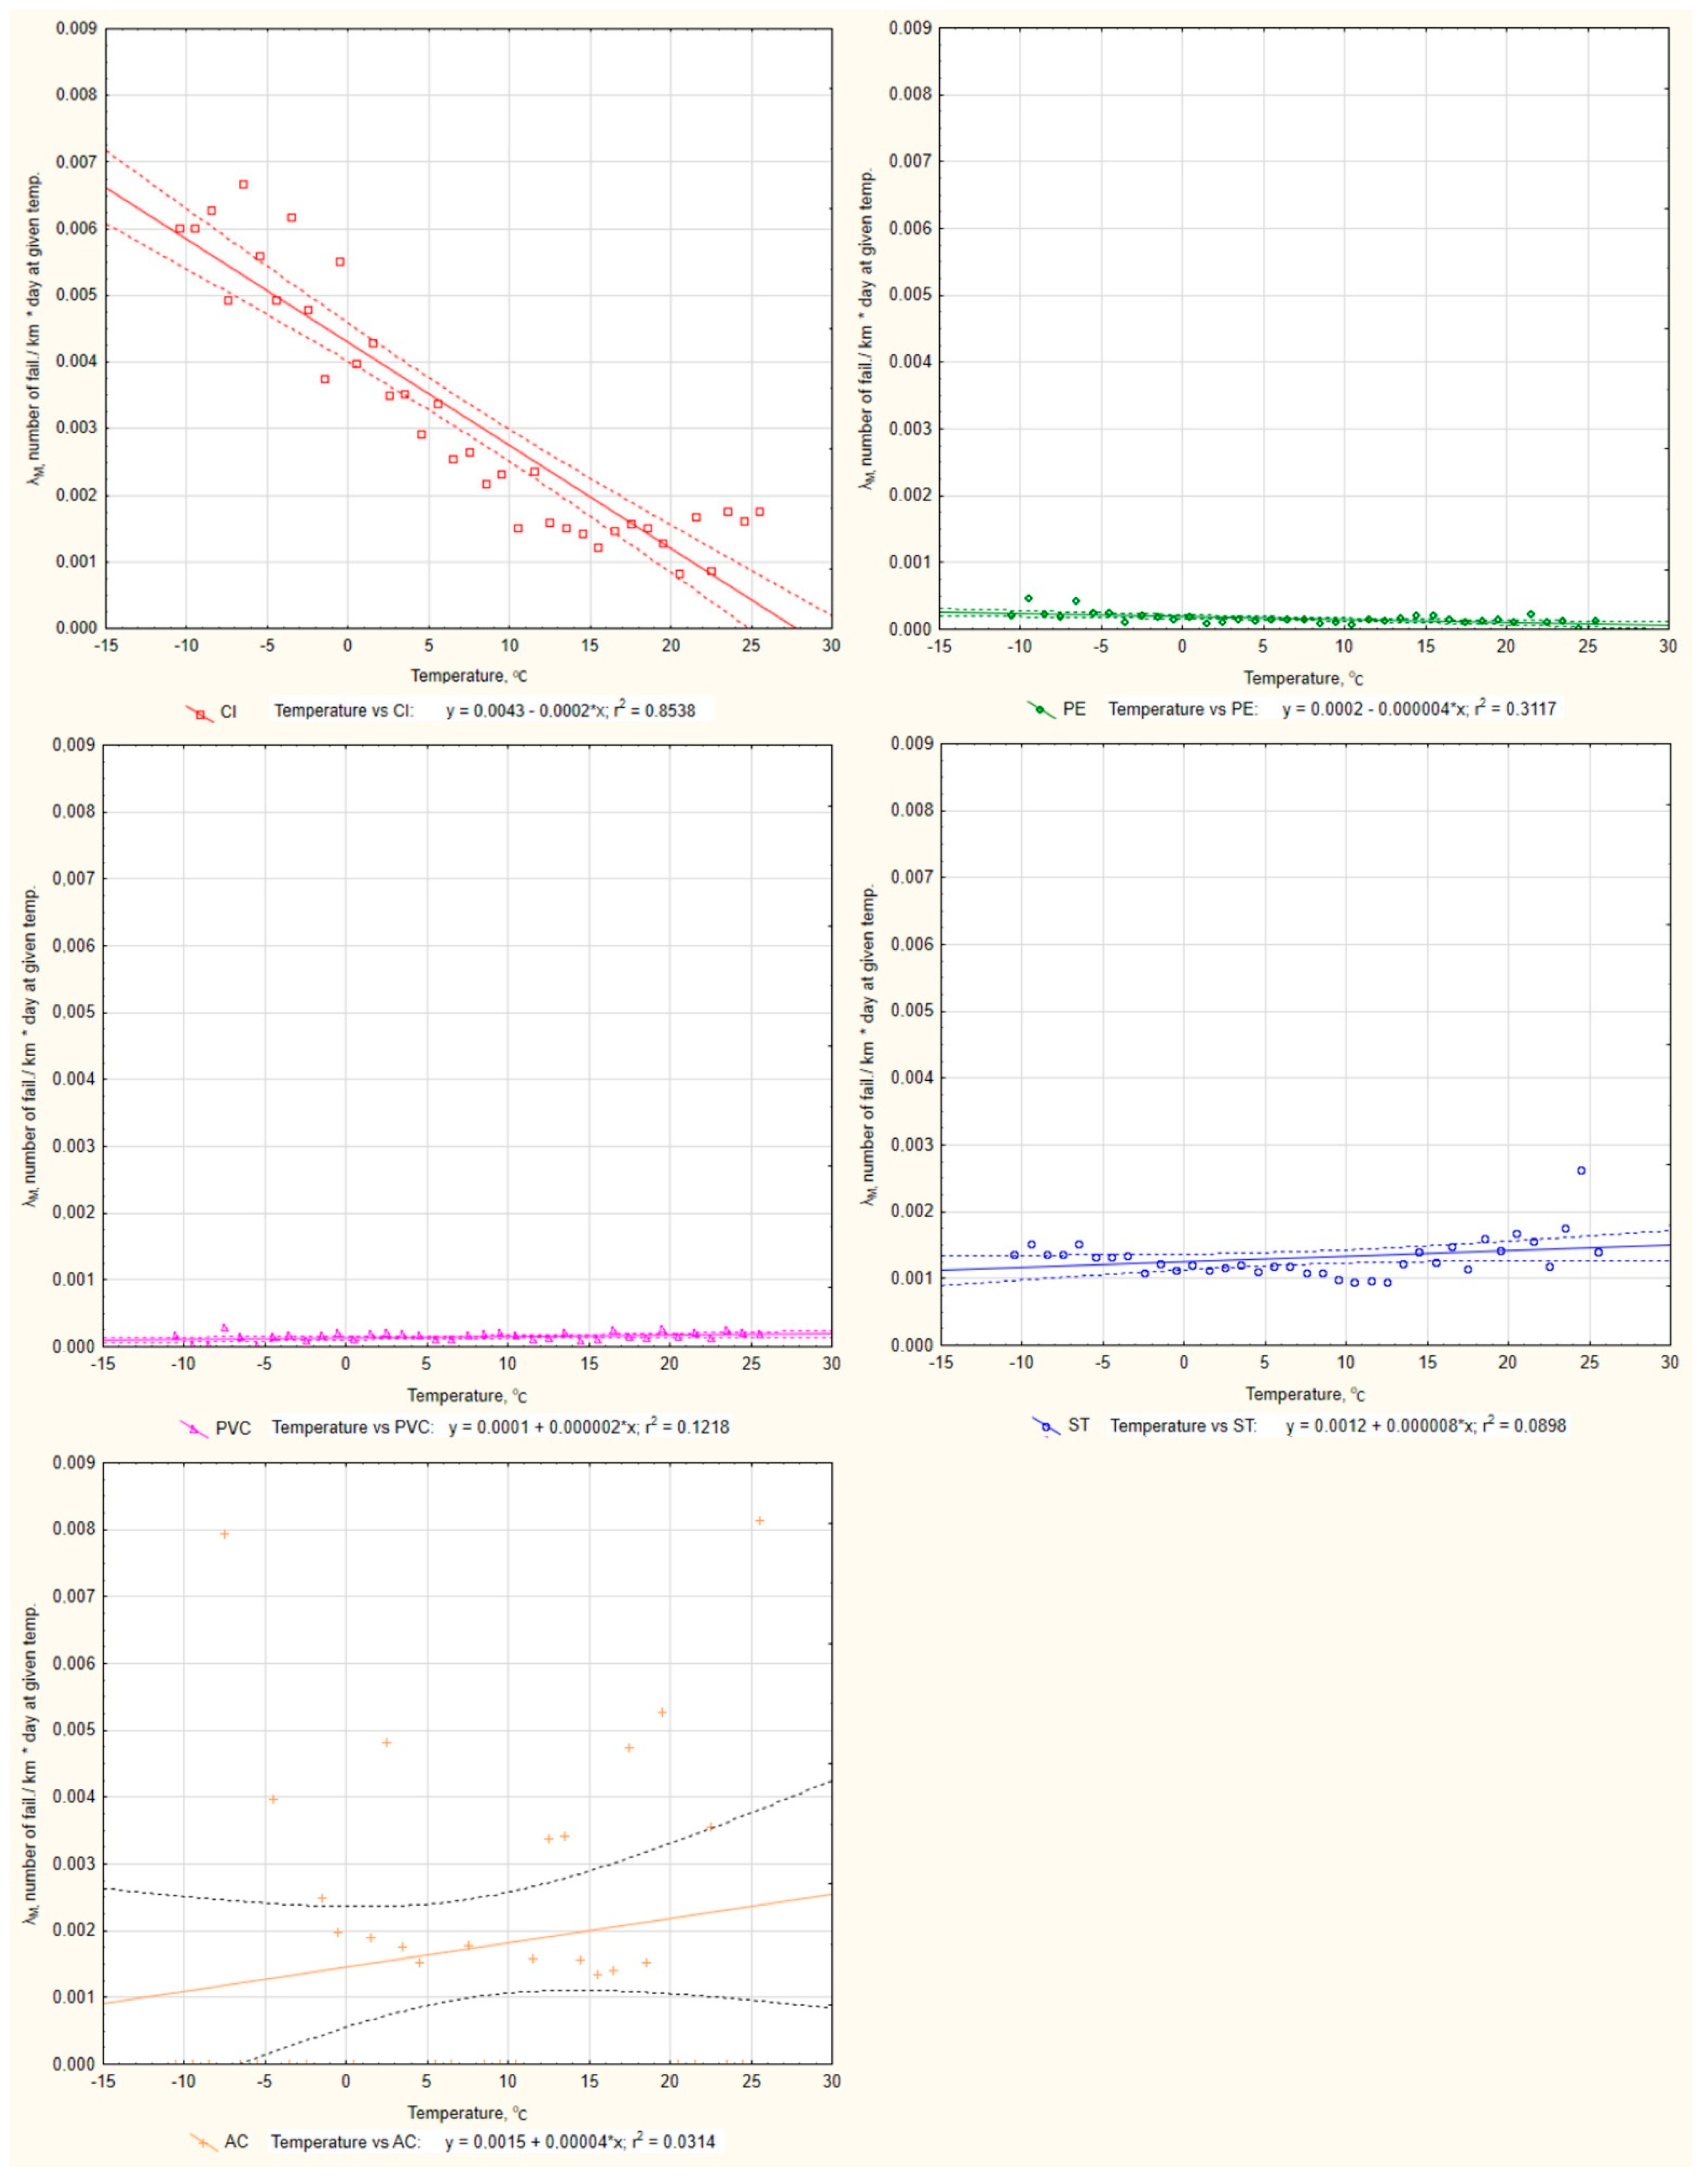
In the next stage, the relationship between the material of failed pipes and the daily temperature was investigated using the failure rate
λM according to the Equation (4). The results of the calculations are presented in
Supplementary Materials (Table S2). The biggest total length of pipes in the analyzed network is made of PE (401 km), then PVC (266 km), steel (244 km), cast iron (111 km), and asbestos-cement (3 km). The highest values of the failure rate were observed for cast iron pipes (average value
λM = 0.0031 failure/km·day), asbestos-cement (average value
λM = 0.0017 failure/km·day), and steel pipes (average value
λM = 0.0013 failure/km·day). Pipes made of plastics materials-PE and PVC are characterized by low values of the failure rate at the average level for PE-
λM = 0.0002 failure/km·day, and for PVC-
λM = 0.0001 failure/km·day. For cast iron pipes, a significantly higher value of the failure rate is observed at temperatures below 0 °C, which indicates that pipes made of this material are the least resistant to negative temperatures. For steel pipes, the values of the failure rate for temperatures below 0 °C are above average, but the difference is not as visible as in the case of cast iron pipes. A similar dependence can be observed for PE pipes, while the values of the failure rate are on average 6.5 times lower than for steel pipes. Pipes made of PVC at negative temperatures are characterized by a lower failure rate than at positive temperatures. For AC pipes, high values of the failure rate are observed both at very low and very high temperatures.
Figure 2 shows the graphs of the relationship between the failure rate
λM and the daily value of temperature for pipes made of individual materials. For the presented data, the linear regression equations were determined, the value of the Pearson correlation coefficients-
R and the values of the determination coefficients-
R2 were calculated. For the obtained results the correlation significance test was carried out.
The results of the linear regression analysis, correlation coefficients and significance tests are presented in
Table 2. For pipes made of cast iron and PE, a negative correlation between the examined variables was shown. This means that with increasing temperature, the value of the failure rate decreases. For pipes made of steel, PVC, and AC, a positive correlation was obtained between the examined variables, which means that the failure rate increases with the temperature increase. For all materials except AC, the t test parameter is within the appropriate critical area (the null hypothesis was assumed to be the lack of correlation between the examined variables, and the existence of a negative or positive correlation was assumed as the alternative hypothesis). Dependencies for steel, cast iron, PE, and PVC pipes should be considered statistically significant with a confidence level of 95.0%.
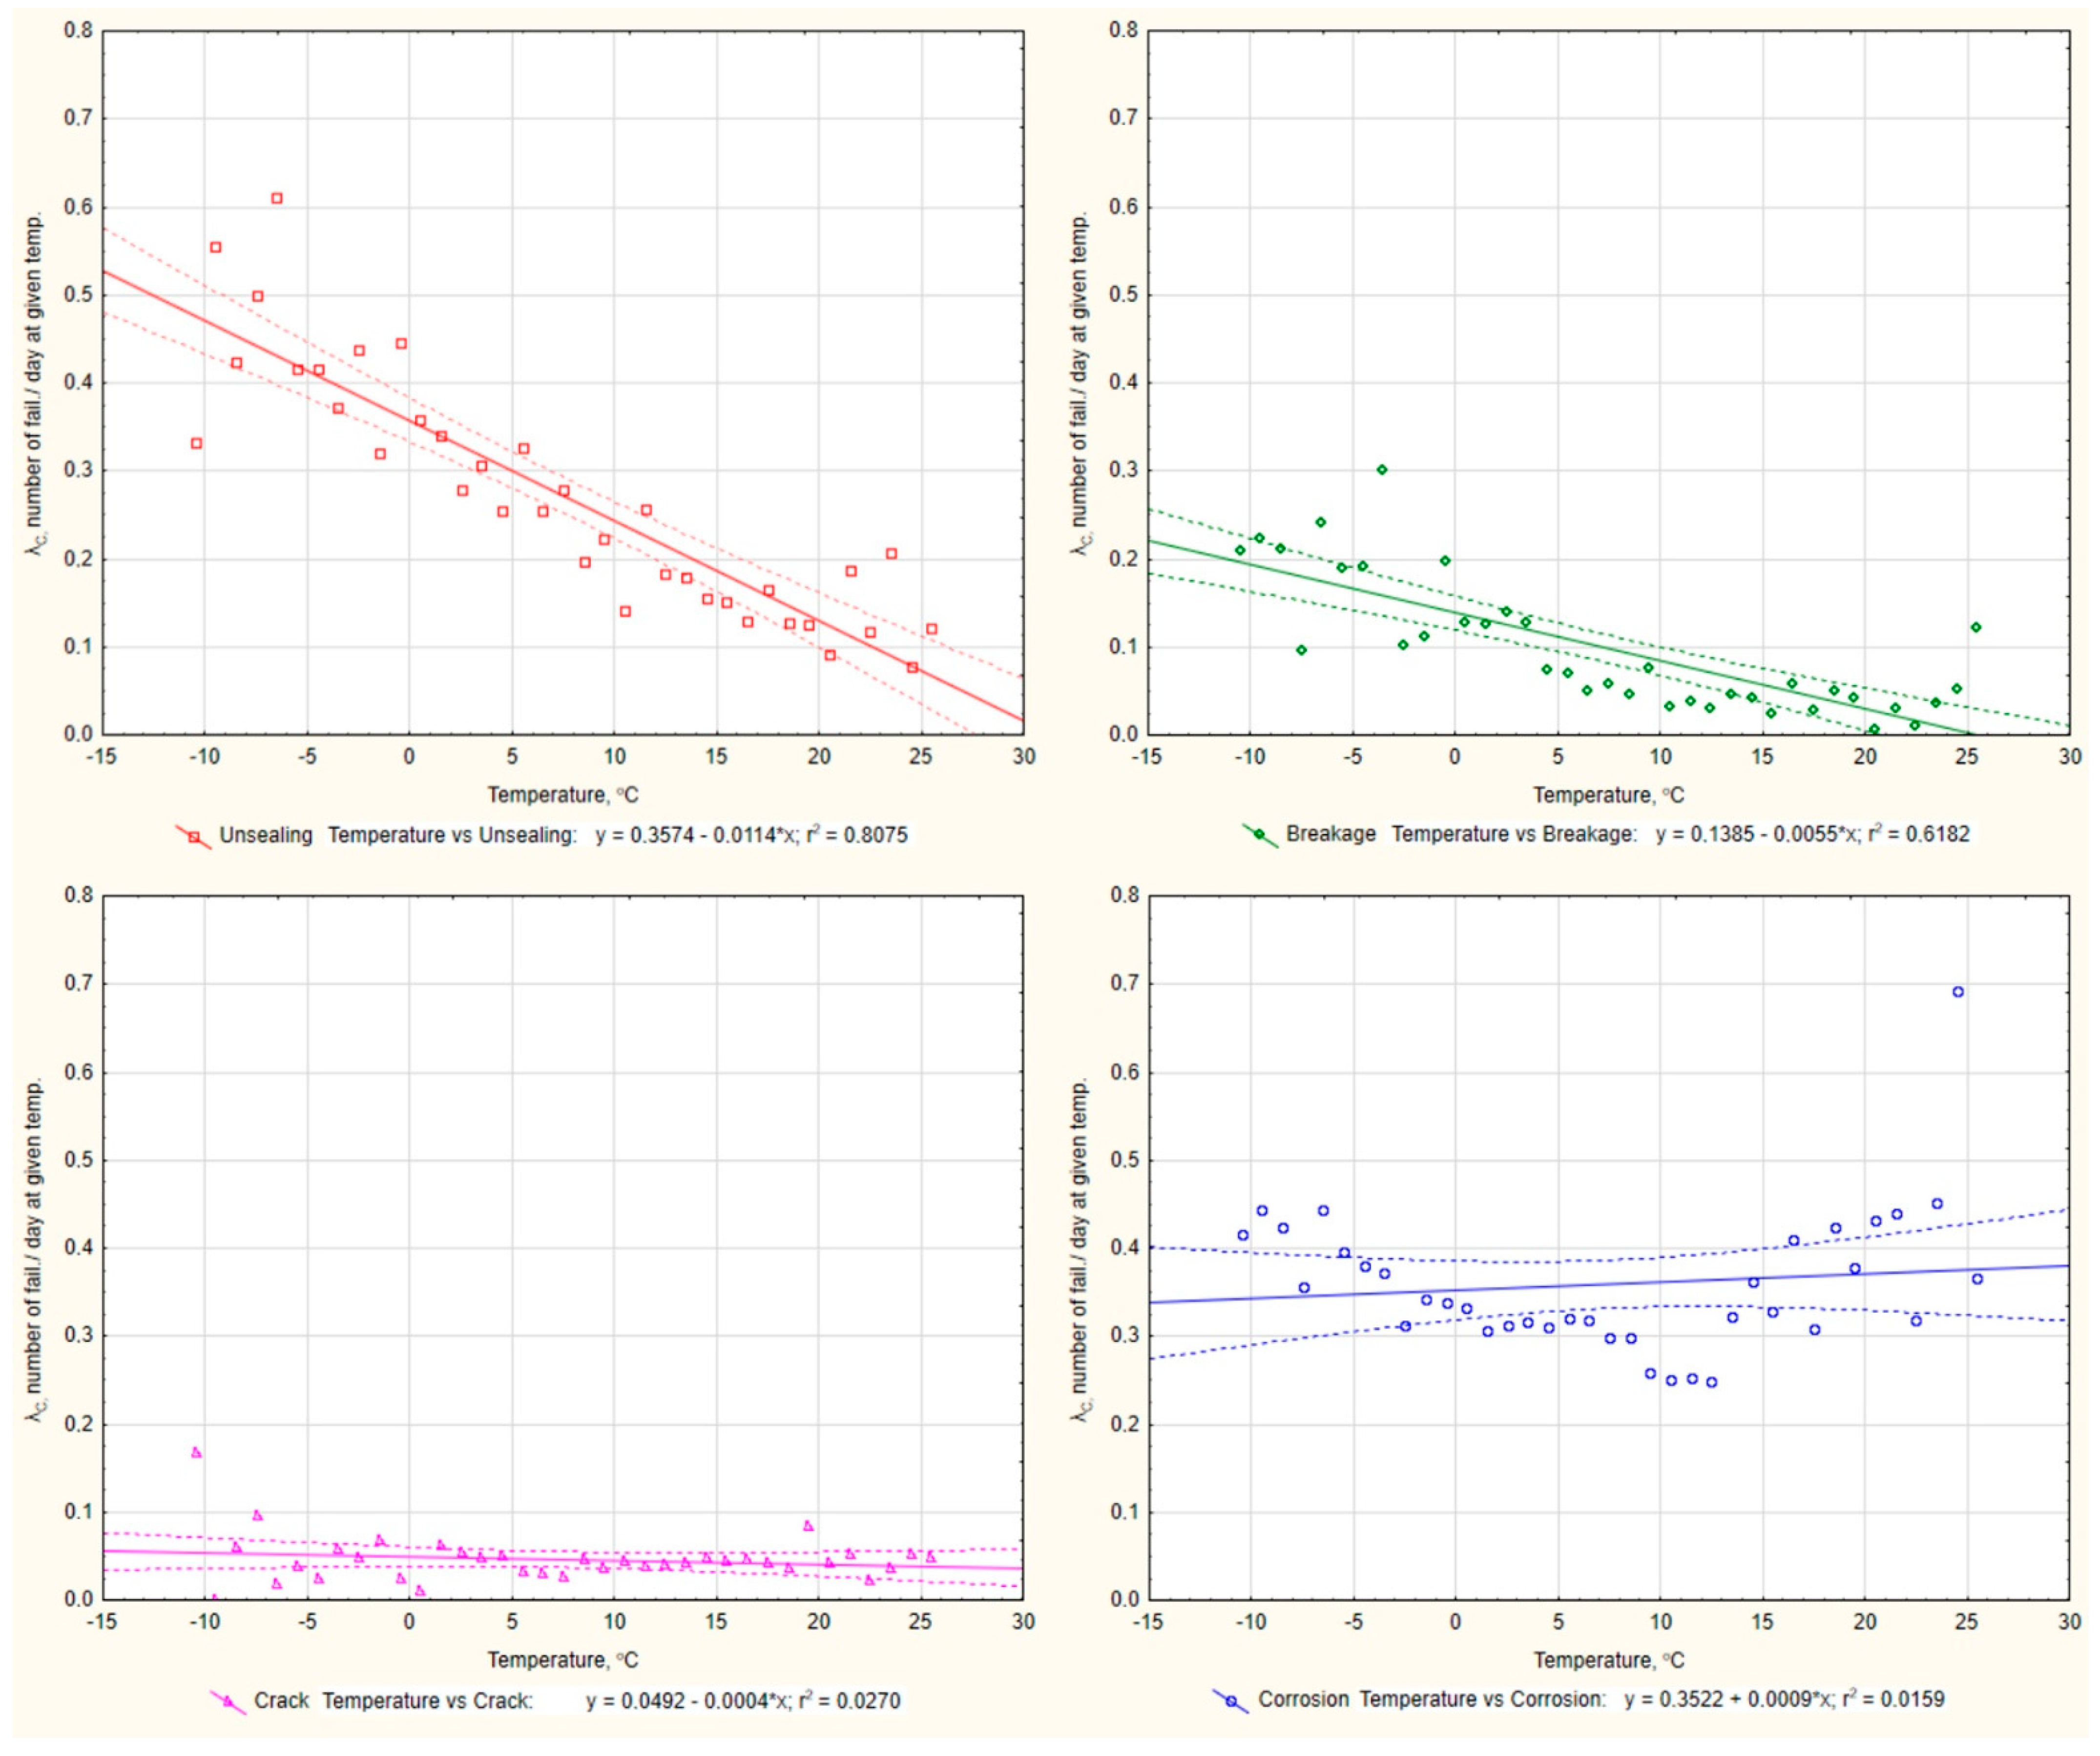
The relationship between the cause of the failure and the daily temperature was examined next with the use of the failure rate
λC according to the Equation (5). The results of the calculations are presented in
Supplementary Materials (Table S3). The pipes most often failed due to corrosion (average value
λC = 0.36 failure/day), then unsealing (average value
λC = 0.27 failure/day), breakage (average
λC = 0.10 failure/day), and cracks (mean value of
λC = 0.05 failure/day).
For unsealing and breakage, a higher value of the failure rate is observed at temperatures below 0 °C. For a crack, the values of the failure rate at negative temperatures are above average, but the difference is not as large as in the case of unsealing and breakage. For corrosion, high values of the failure rate are observed both at very low and very high temperatures.
Figure 3 shows the graphs of the relationship between the failure rate
λC and the daily value of temperature for pipes whose failure results from a given cause. For the presented data, the linear regression equations were determined, the value of the Pearson correlation coefficients-
R and the values of the determination coefficients-
R2 were calculated. For the obtained results the correlation significance test was carried out.
The results of linear regression analysis, correlation coefficients and significance tests are presented in
Table 3. For pipes whose failure resulted from unsealing, breakage, and cracks, a negative correlation was obtained between the examined variables. This means that with increasing temperature, the value of the failure rate decreases. For the pipes where the failure occurred as a result of corrosion, a positive correlation was obtained between the examined variables, which means that the failure rate increases with the temperature increase. For the cause of the failure: unsealing and breakage, the test parameter t is in the critical area (the null hypothesis was assumed to be the lack of correlation between the studied variables, and the existence of a negative correlation was assumed as the alternative hypothesis). These dependencies should be considered statistically significant with a confidence level of 95.0%. For the causes of corrosion and cracking, the null hypothesis cannot be rejected, the obtained relationships are not statistically significant at the given confidence level.
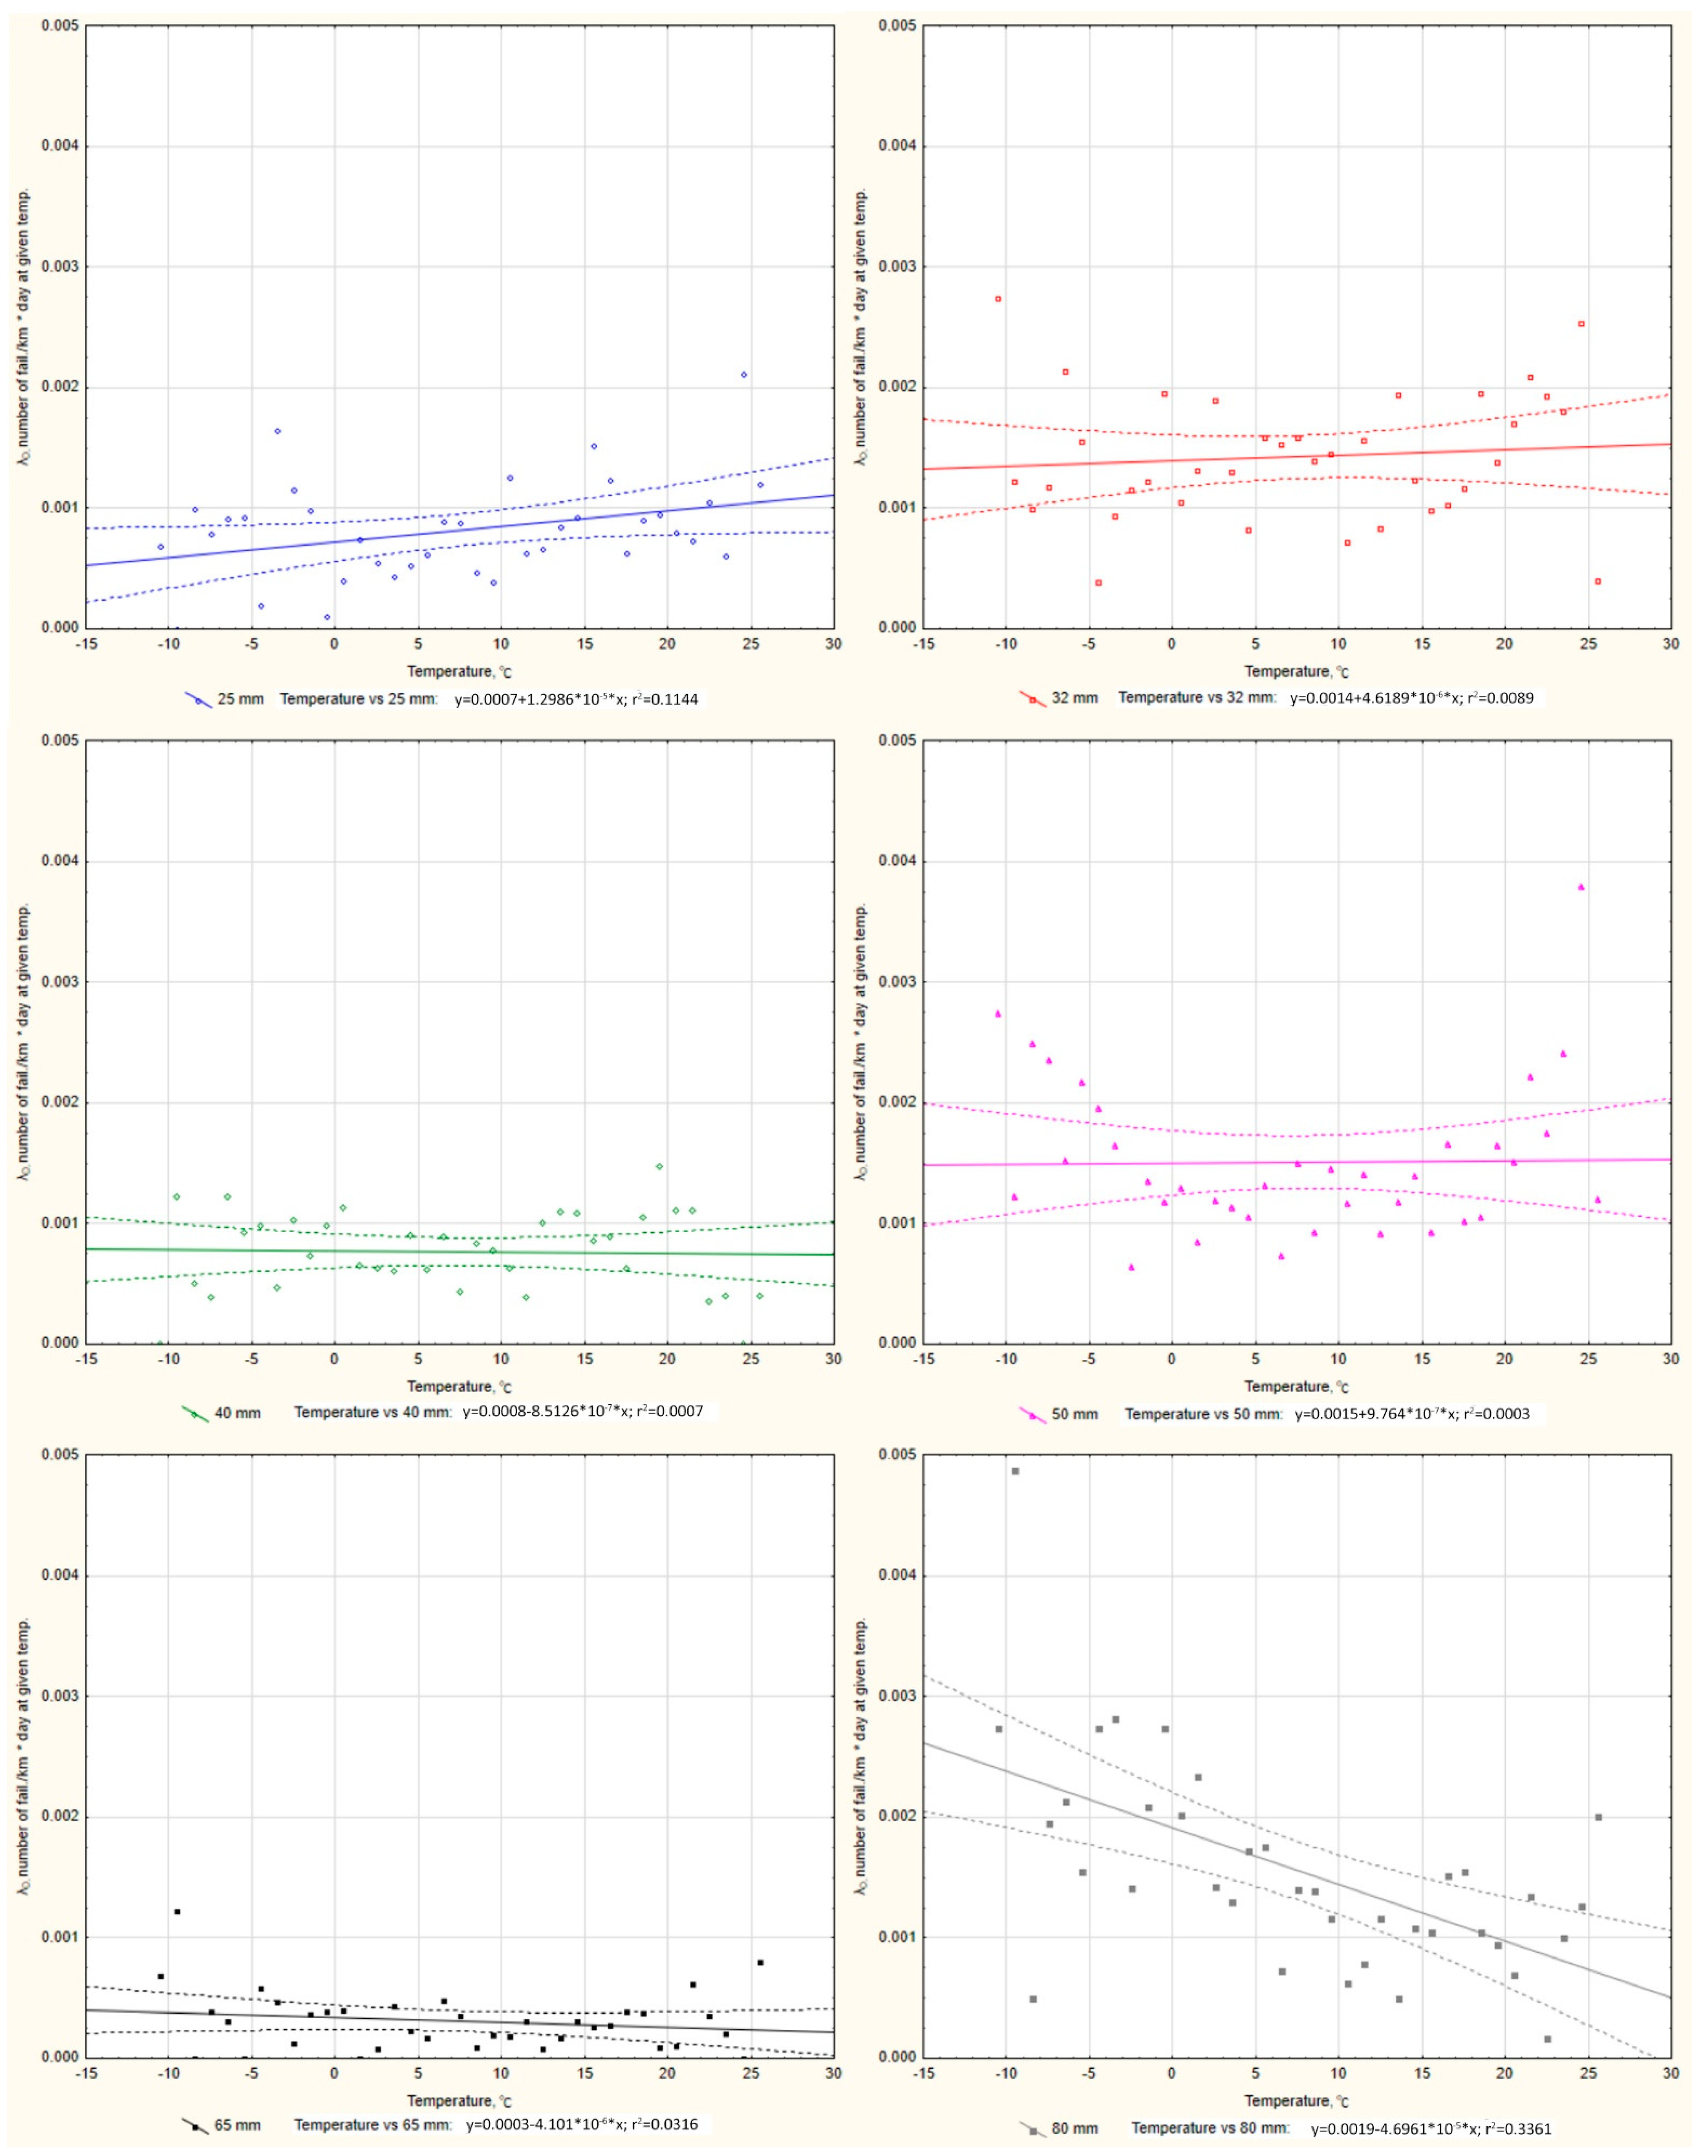
In the next step, the relationship between the diameter of the failed pipe and the daily temperature was examined using the failure rate
λD according to the dependence (6). Due to the lack of detailed data on the lengths of pipes of a particular diameter, the average length of pipes for a given type of network was used. For water supply connections, this length was
LN = 365/6 = 60.8 km, for the distribution network
LN = 605/4 = 151.3 km, and for the main network
LN = 55/8 = 6.9 km. The calculation results are presented in
Supplementary Materials (Tables S4–S7) sectioned into the type of network. Among the water supply connections, pipes with a diameter of 80, 50, and 32 mm were the most likely to fail (average value of
λD80 mm = 0.0016 failure/km day, average value of
λD50 mm = 0.0015 failure/km day, average value of
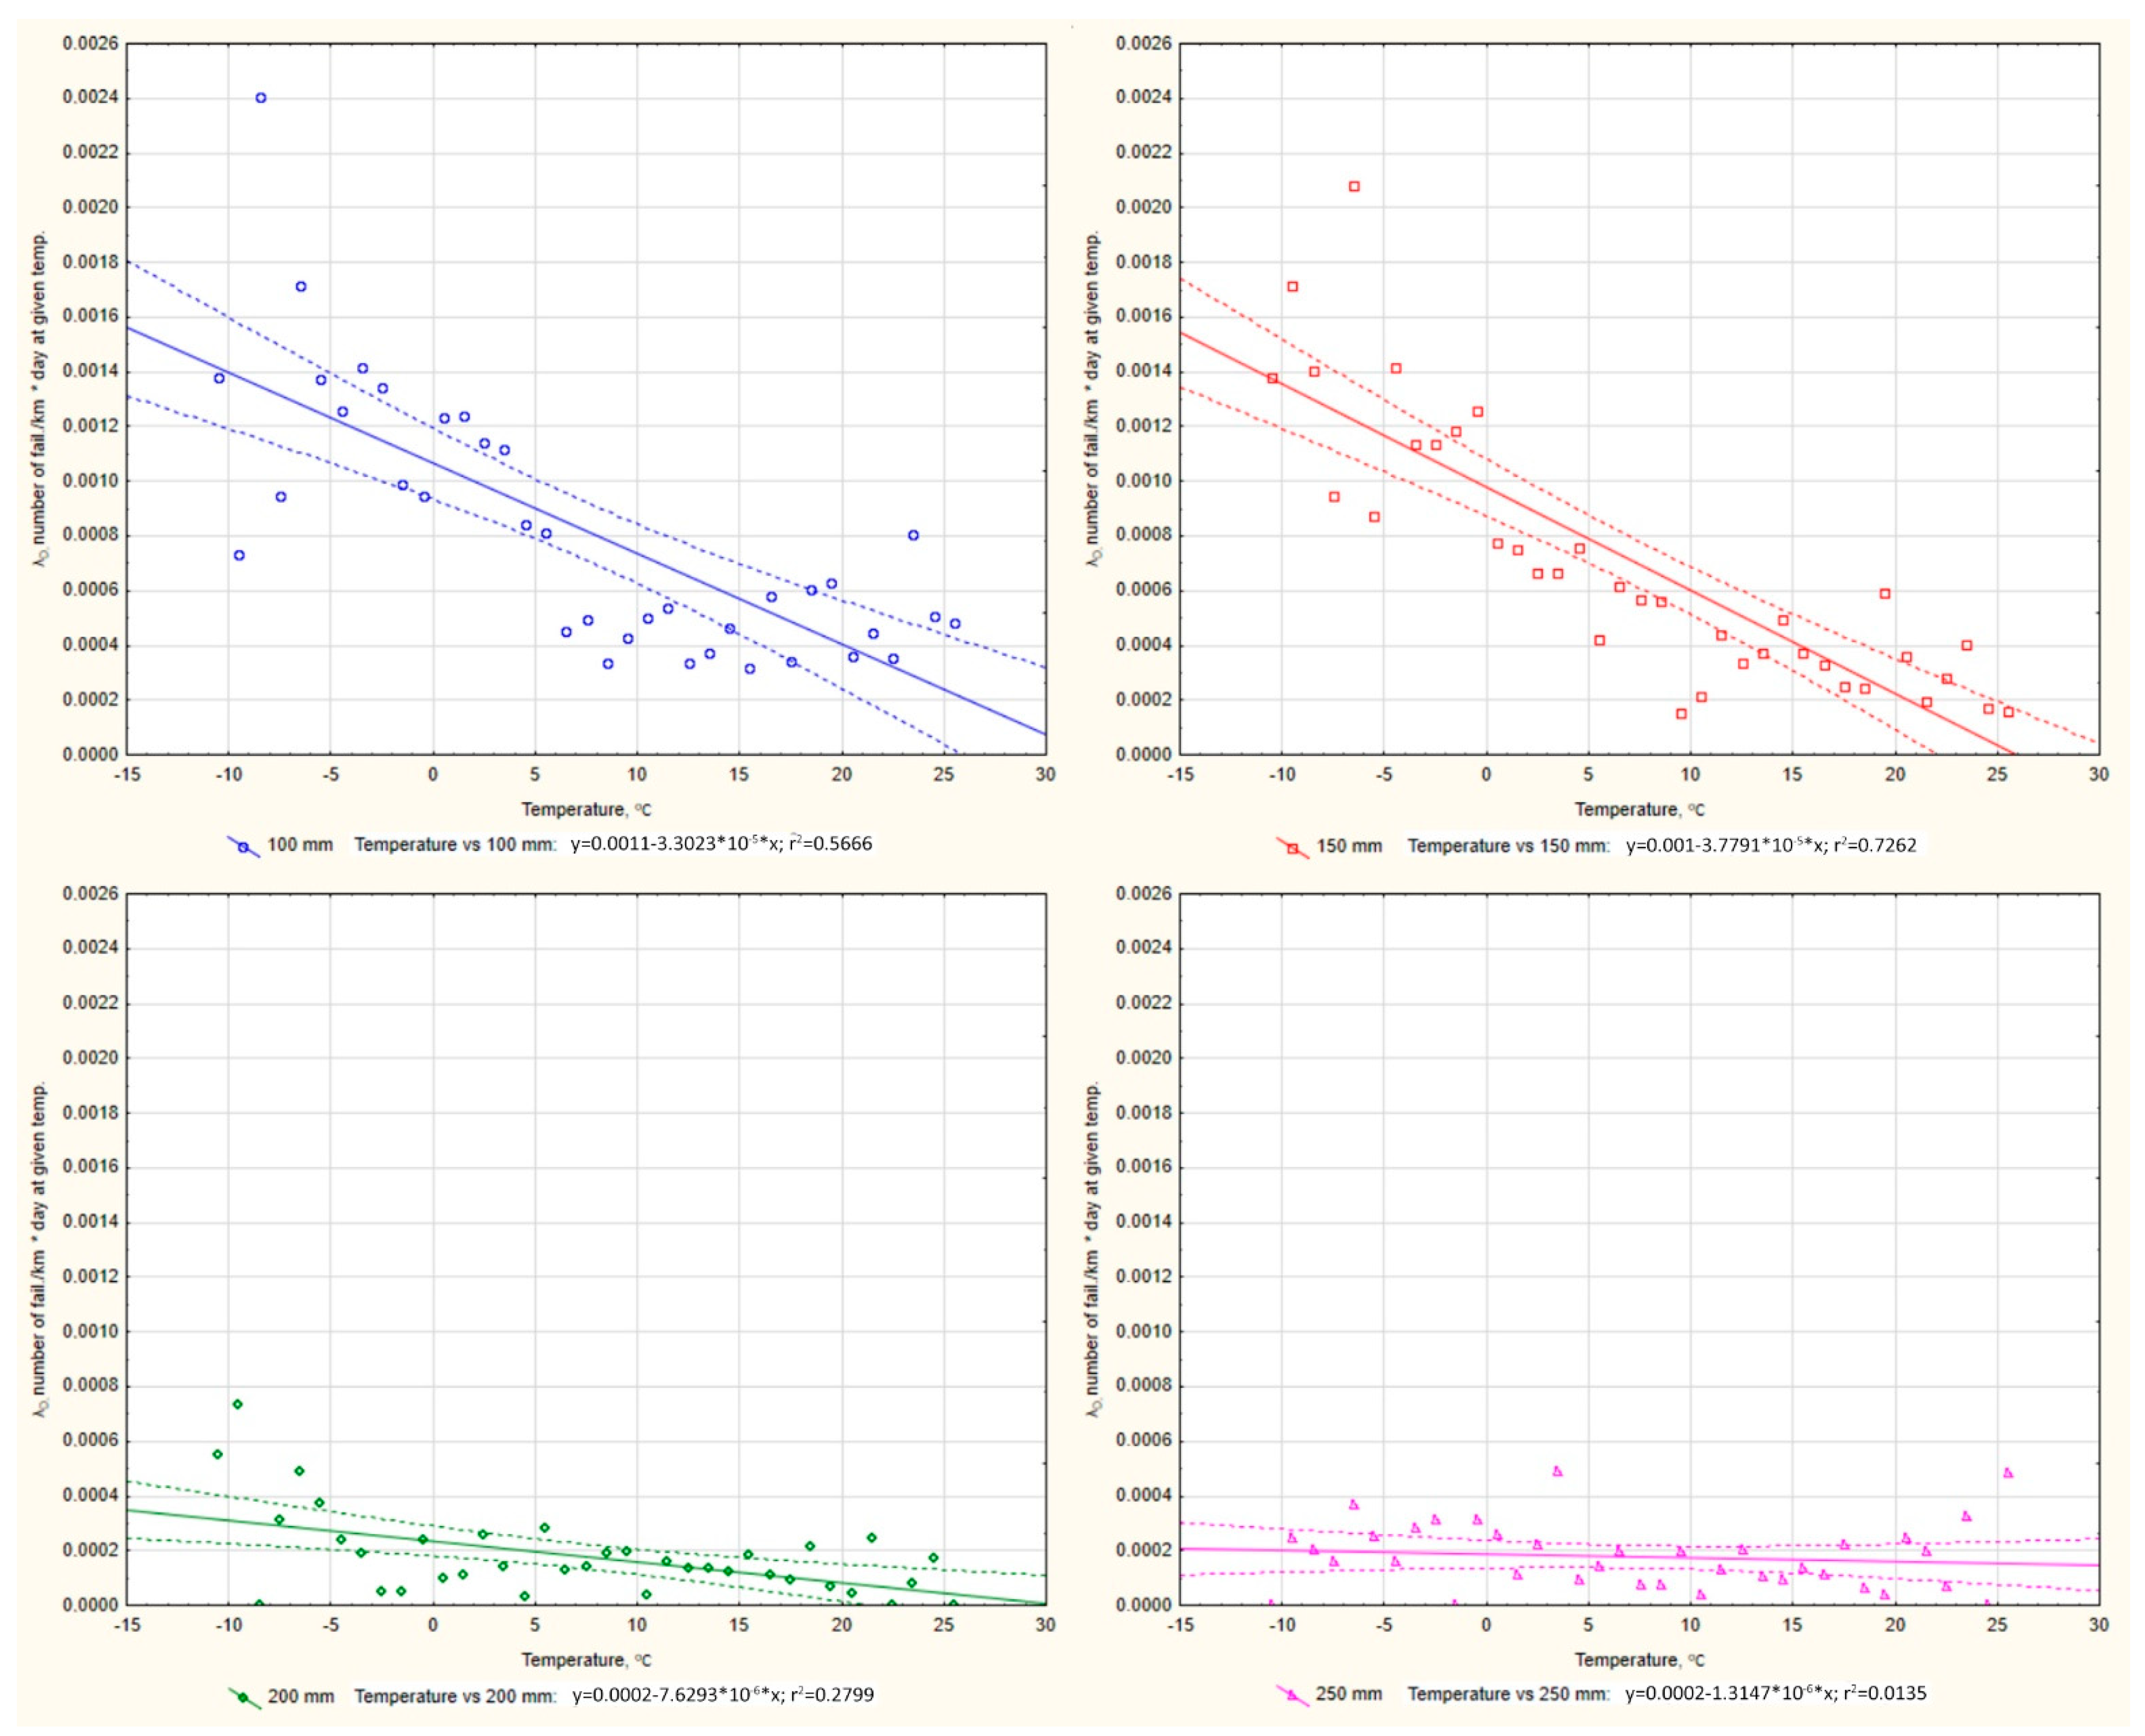
λD32 mm = 0.0015 failure/km day), in the distribution network these were pipes with a diameter of 100 and 150 mm (average value of
λD100 mm = 0.0008 failure/km day, average value of
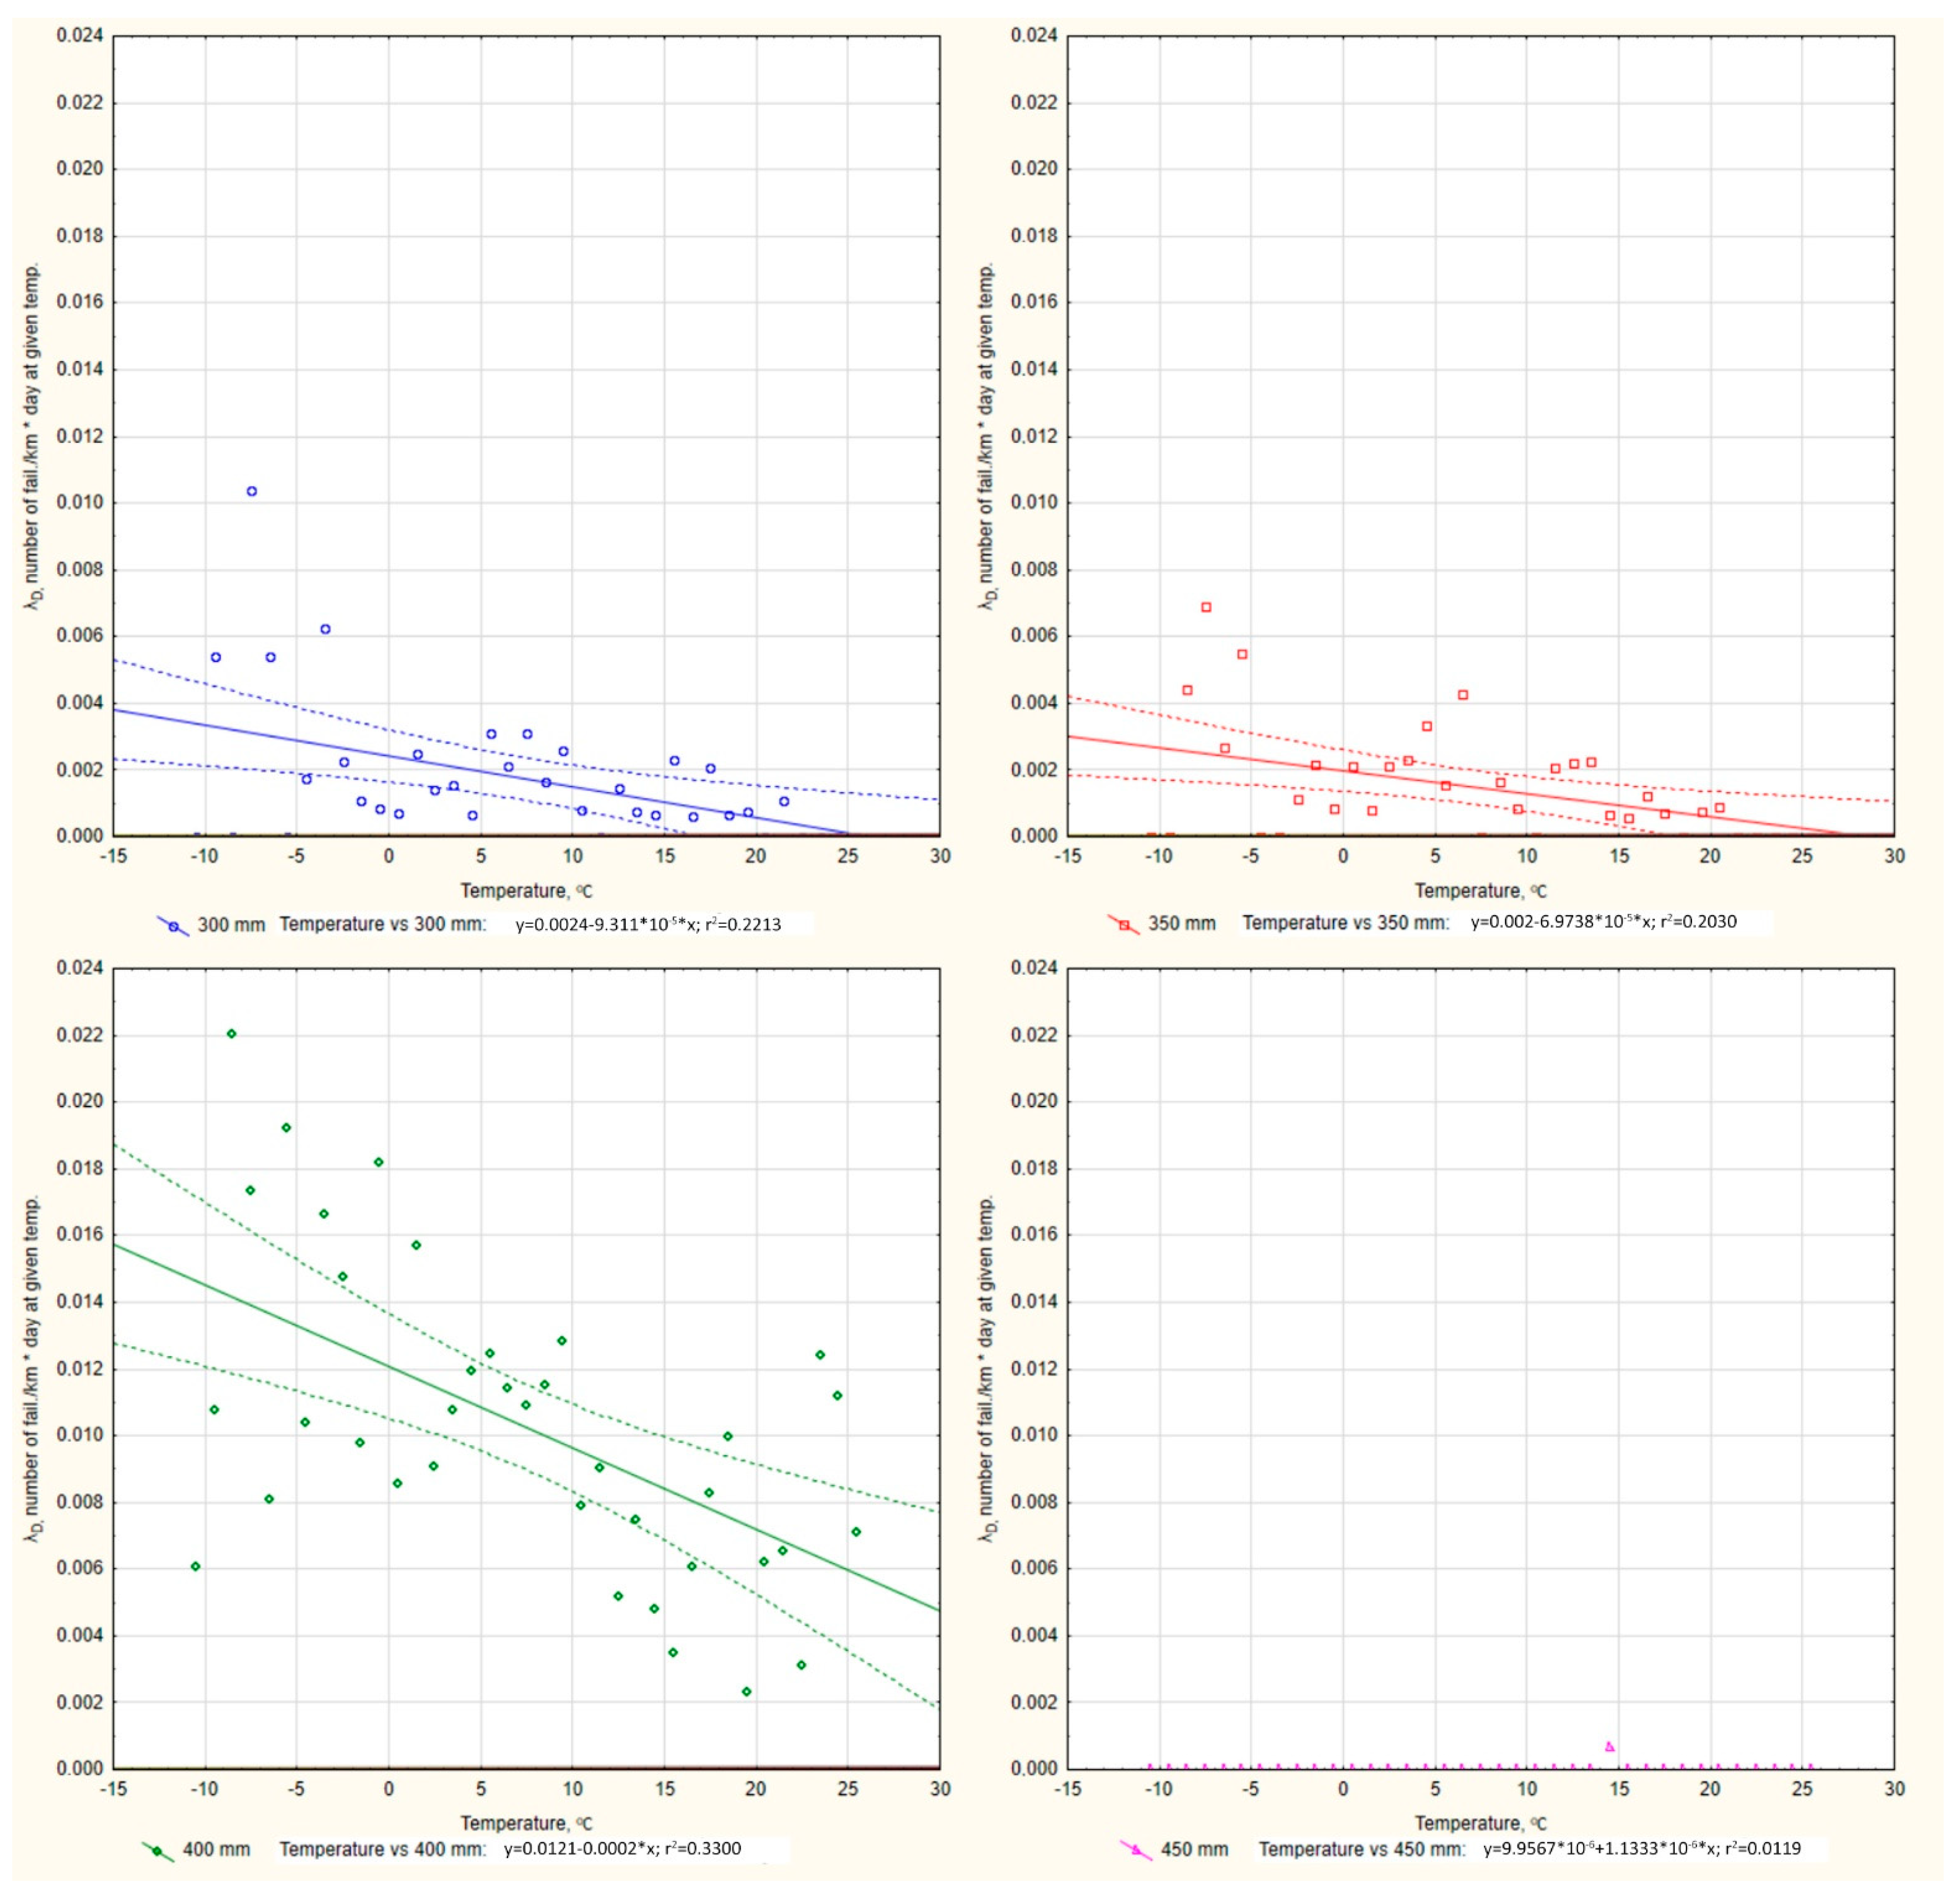
λD50 mm = 0.0007 failure/km day). In the main network, pipes with a diameter of 400, 300, and 500 mm were most likely to fail (average value of
λD400 mm = 0.01025 failure/km day, average value of
λD300 mm = 0.00173 failure/km·day, average value of
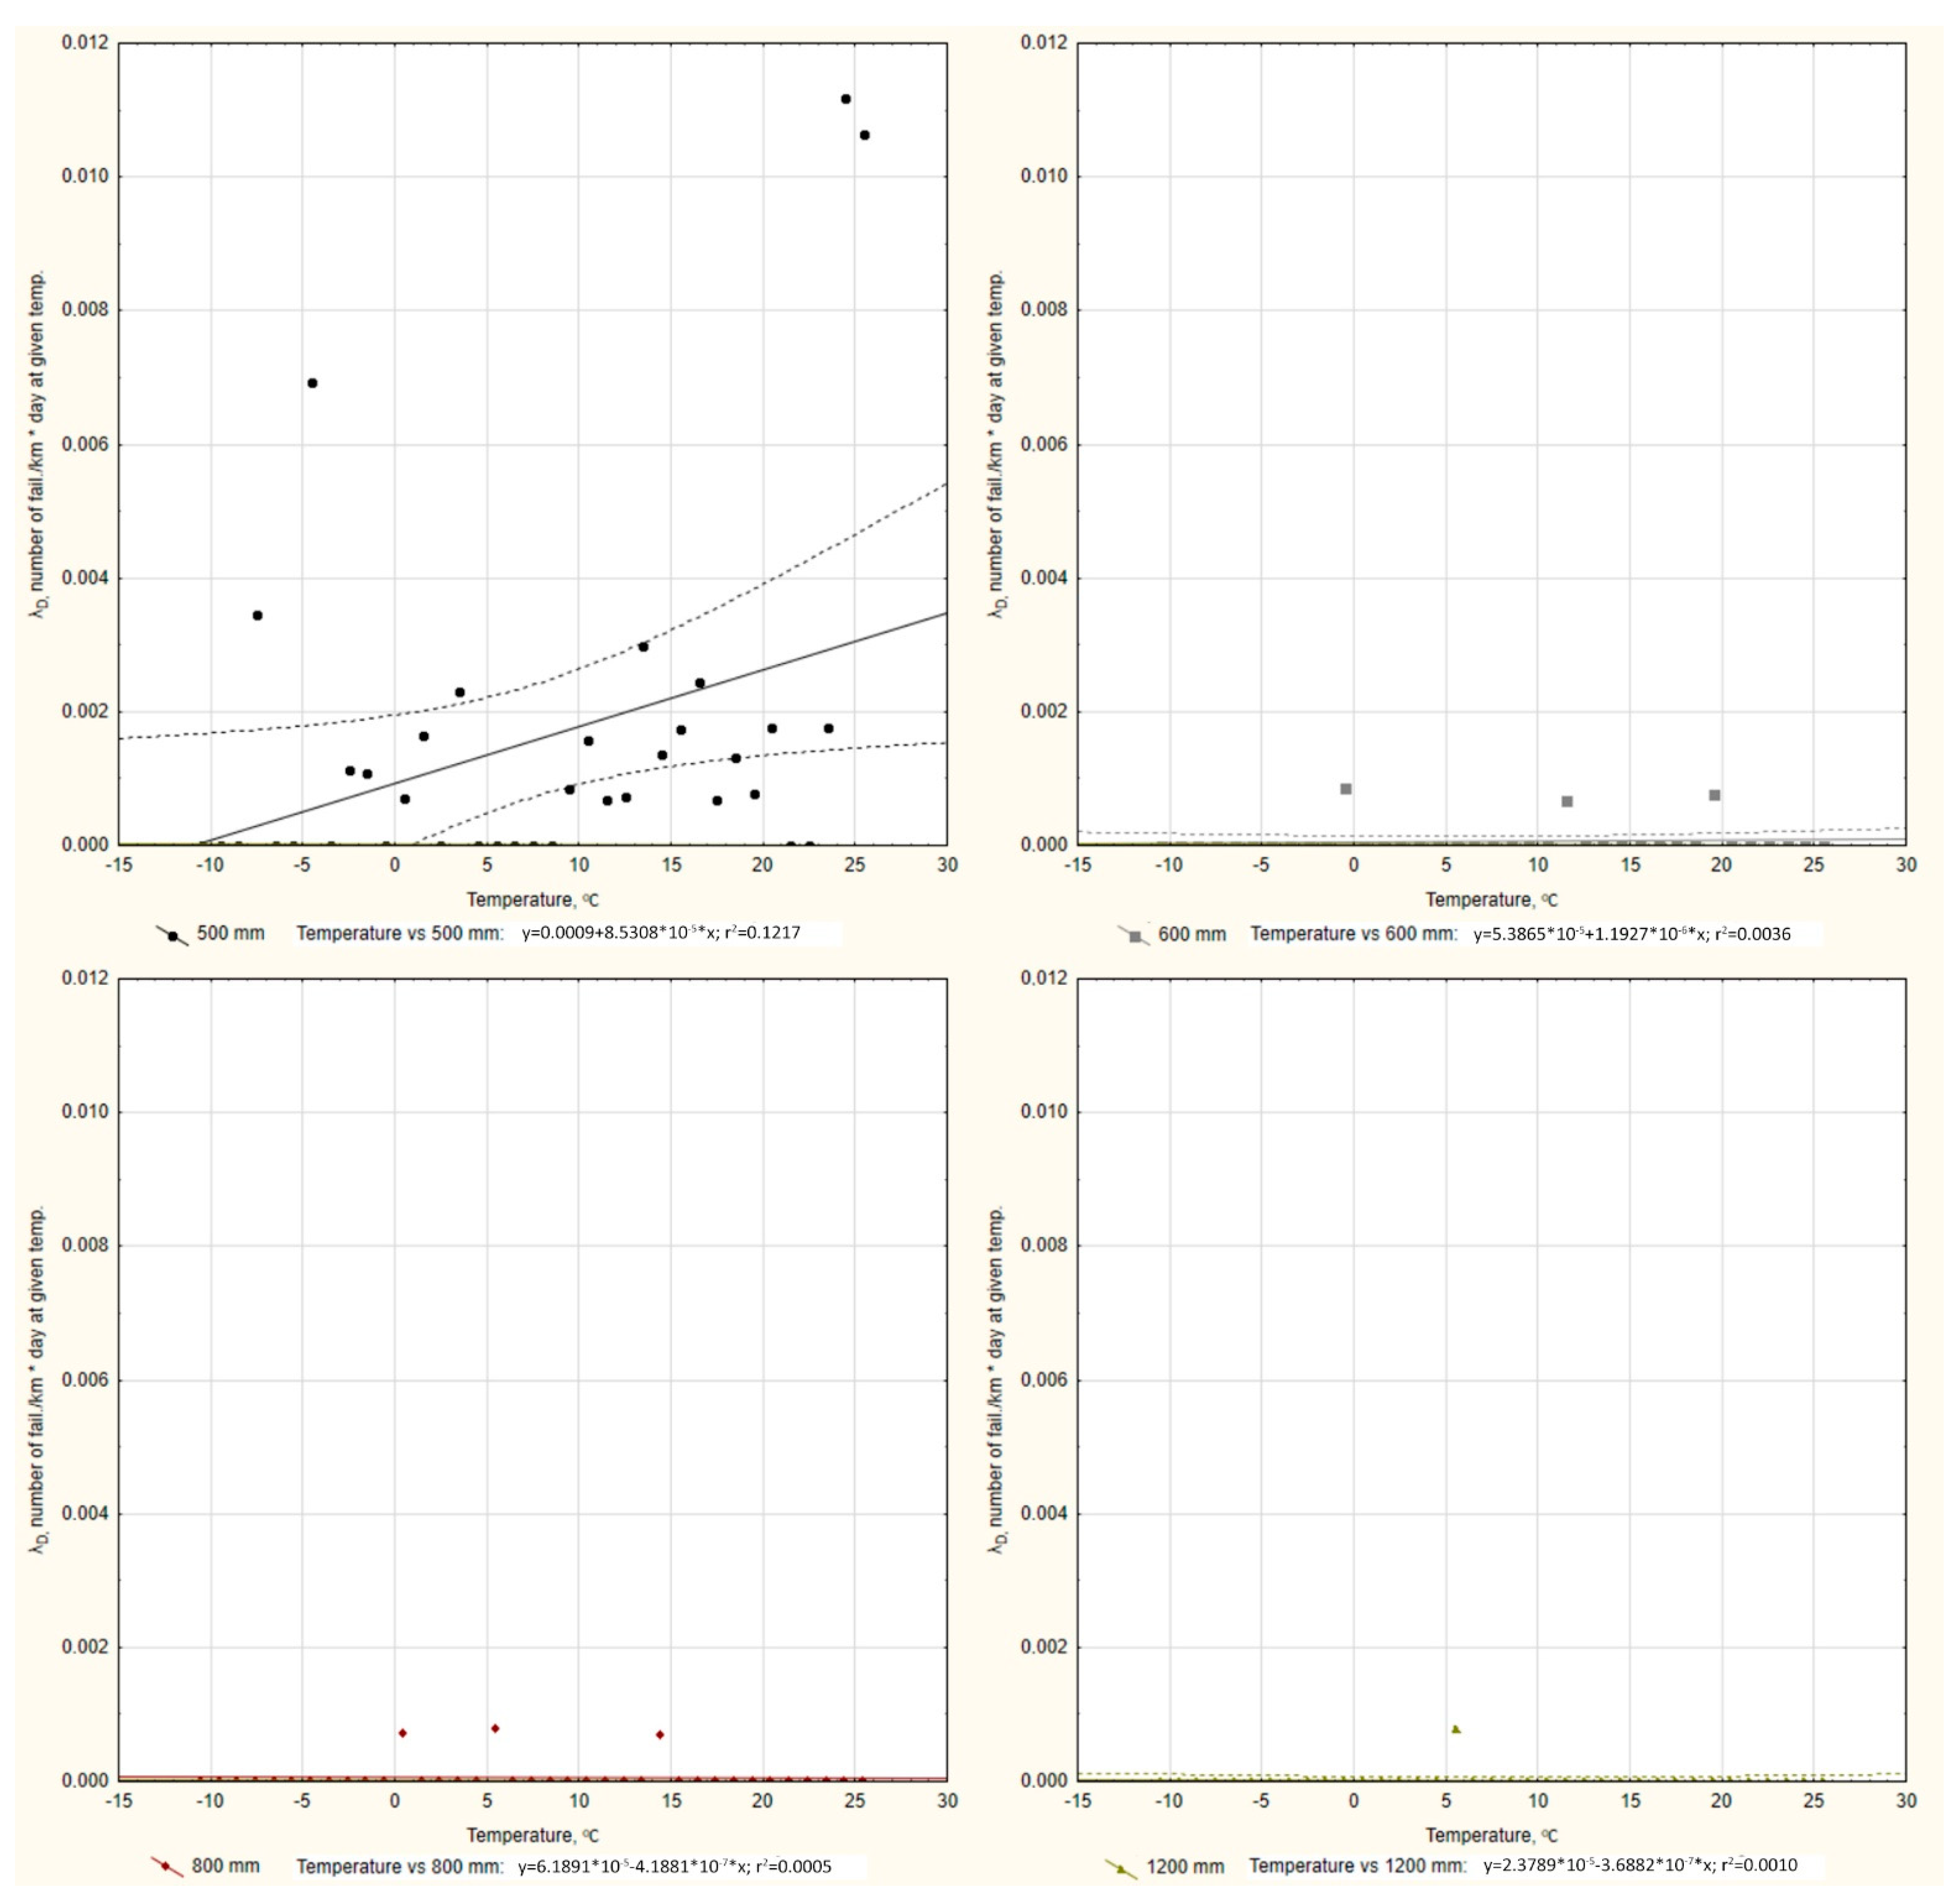
λD500 mm = 0.00156 failure/km day).
For water supply connections, higher values of the failure rate for diameters: 50, 65, and 80 mm are observed at negative daily temperatures. For distribution network pipes, at negative temperatures, higher values of the failure rate are observed for diameters 100, 150 mm. For the diameter of 200 mm, the values of the failure rate at negative temperatures are above the average, but the difference is not as large as in the case of the diameter of 100 and 150 mm. For main network pipes, higher values of the failure rate are observed at negative temperatures for diameters of 300, 350, and 400 mm, while for a diameter of 400 mm these values are about six times greater than for a diameter of 300 mm.
Figure 4,
Figure 5,
Figure 6 and
Figure 7 show the graphs of the relationship between the failure rate
λD and the daily value of temperature for the pipes of the examined network with a given diameter, divided by type of network. For the presented data, the linear regression equations were determined, the value of the Pearson correlation coefficients-
R and the values of the determination coefficients-
R2 were calculated. For the obtained results the correlation significance test was carried out.
The results of linear regression analysis, correlation coefficients, and significance tests are presented in
Table 4. For pipes with a diameter of 80, 100, 150, 200, 300, 350, 400 mm, a negative correlation was obtained between the examined variables. This means that with increasing temperature, the value of the failure rate decreases. For pipes with a diameter of 25 and 500, a positive correlation was obtained between the examined variables, which means that the failure rate increases with the temperature increase. For these mentioned diameters, the test parameter t is in the appropriate critical area (the null hypothesis was assumed to be the lack of correlation between the examined variables, and the existence of a negative or positive correlation was assumed as the alternative hypothesis). These dependencies should be considered statistically significant with a confidence level of 95.0%. For diameters of 32, 40, 50, 65, 250, 450, 600, 800, 1200 mm, the null hypothesis cannot be rejected, the obtained relationships are not statistically significant at the given confidence level.
4. Discussion
The conducted literature studies show that the failure rate of the water supply network is influenced by many factors. There are external (environmental) factors, which include: climate, air temperature, ground temperature, ground freezing depth, tap water temperature, soil and groundwater conditions, groundwater corrosivity, etc. The second group of factors influencing the failure rate of the water supply network are internal factors related to the process of designing, construction and system operation, these are: pipe material, pipe diameter, pressure in the water supply network, flow value, quality of the network design, and construction and the quality of carried out pipe repairs. The paper presents the effect of negative daily temperatures on the failure rate of the water supply network. This factor is one of the most frequently studied factors affecting the failure rate of water supply systems. The study includes a comprehensive analysis taking into account the material and diameter of the pipe as well as the cause of the failure depending on the effect of negative temperatures. The research was carried out on operational data covering the years 2004–2018 for the water supply system in a city located in south-eastern Poland. The results confirm the thesis that in the case of negative temperatures, a bigger failure rate of the water supply system is observed. The obtained correlation coefficient between the failure rate and the daily temperature at the level of −0.787 confirms a strong correlation between the examined variables with a confidence level of 95.0%. According to the presented linear regression model, the value of the failure rate increases by the value of 0.0163 damage/day with a temperature drop of 1 °C. In the examined system, the highest values of the failure rate were observed for cast iron pipes (λMavg = 0.0031 failure/km day). The determined relationship between the failure rate and the daily temperature in the case of cast iron pipes is very strong (Pearson correlation coefficient R = −0.924). For pipes made of AC, the second largest value of the failure rate was obtained (λMavg = 0.0017 failure/km day). However, due to the content of asbestos, these lines are successively replaced, and currently they stand for about 0.3% of all pipes in the system, and their high failure rates have little impact on the failure rate of the entire system. For steel pipes, a weak relationship (R = 0.299) was found between the daily temperature and the failure rate. The positive correlation coefficient value also proves that along with the temperature increase, the failure rate of steel pipes increases (mainly due to corrosion). Pipes made of plastics materials—PE and PVC—are characterized by low values of the damage intensity index on the average level for PE-λMavg = 0.0002 failure/km day, and for PVC-λMavg = 0.0001 failure/km day. For PE pipes, the existence of a moderate negative correlation (R = −0.558) was shown, where an increase in the failure rate is observed when the temperature drops. For PVC pipes, the existence of a weak positive relationship (R = 0.349) was found, where the increase in the failure rate is observed with the temperature increase. It has been shown that for pipes made of plastic, the failure rate values are approximately 20 times lower than for cast iron pipes and 8 times lower than for steel pipes. The pipes in the analyzed system failed most often due to corrosion (λCavg = 0.36 failure/day) and unsealing (λCavg = 0.27 failure/day). Failures due to breakage and crack were less frequent (λCavg = 0.10 failure/day for a breakage and λCavg = 0.05 failure/day for a crack). For unsealing, the existence of a strong relationship (R = −0.899) was demonstrated between the daily temperature and the value of the failure rate. Similarly, for the breakage, the existence of a strong relationship (R = −0.786) between the examined variables was shown. The negative value of the correlation shows that with the temperature decrease, the failure rate due to unsealing and breakage increases. For a crack, the values of the failure rate at negative temperatures are above the average, but the difference is not as large as in the case of unsealing and breakage. In the case of corrosion, the values of the failure rate at negative temperatures are similar to those at positive temperatures. For cracks and corrosion, no correlation was found between the daily temperature and the value of the failure rate at a given confidence level of 95.0%. It has been shown that the mechanical causes of failure (in particular, unsealing and breakage) occur more frequently at negative temperatures. This is mainly related to the stresses appearing in the ground during its freezing and thawing. The study also presents an analysis of the dependence of water supply network failures depending on the diameter and daily temperature divided into the type of network: water supply connections, distribution network, and main network. Among the water supply connections, pipes with a diameter of 32, 50, and 80 mm (λDavg80 mm = 0.0016 failure/km day, λDavg50 mm = 0.0015 failure/km day, λDavg32 mm = 0.0015 failure/km day), in the distribution network these were pipes with a diameter of 100 and 150 mm (λDavg100 mm = 0.0008 failure/km day, λDavg150 mm = 0.0007 failure/km day) and in the main network pipes with a diameter of 300, 400, and 500 mm (λDavg400 mm = 0.01025 failure/km day, λDavg300 mm = 0.00173 failure/km day, λDavg500 mm = 0.00156 failure/km day). The existence of a negative correlation between the daily temperature and the value of the failure rate for diameters of 80, 100, 150, 200, 300, 350, 400 mm and a positive correlation for diameters of 25 and 500 mm was demonstrated. For the other diameters, no dependence was shown with the adopted confidence level of 95.0%. Among the water supply connections, the highest correlation coefficient was obtained for the diameter of 80 mm (R = −0.580), which shows a moderate strength of the relationship between the daily temperature and the failure rate. For the distribution network, the highest correlation coefficient was obtained for a diameter of 150 mm (R = −0.852), which shows a strong relationship between the examined variables. In the case of the main network, the highest correlation coefficient (R = −0.574) was obtained for the diameter of 400 mm, which defines the relationship between the examined variables as moderate. The differences in the value of the failure rate for individual diameters depend on several factors, including type of network, material from which the pipe is made, construction methods, quality of construction works, and proper operation. The research shows that at negative temperatures, the highest values of failure rate are observed for diameters in the main network of 400, 350, 300 mm and for diameters of 150 and 100 mm in the distribution network. During repair works of these pipes, attention should be paid to the quality of the materials used and the repair work in order to eliminate internal factors affecting the failure rate of the water supply network.


