1. Introduction
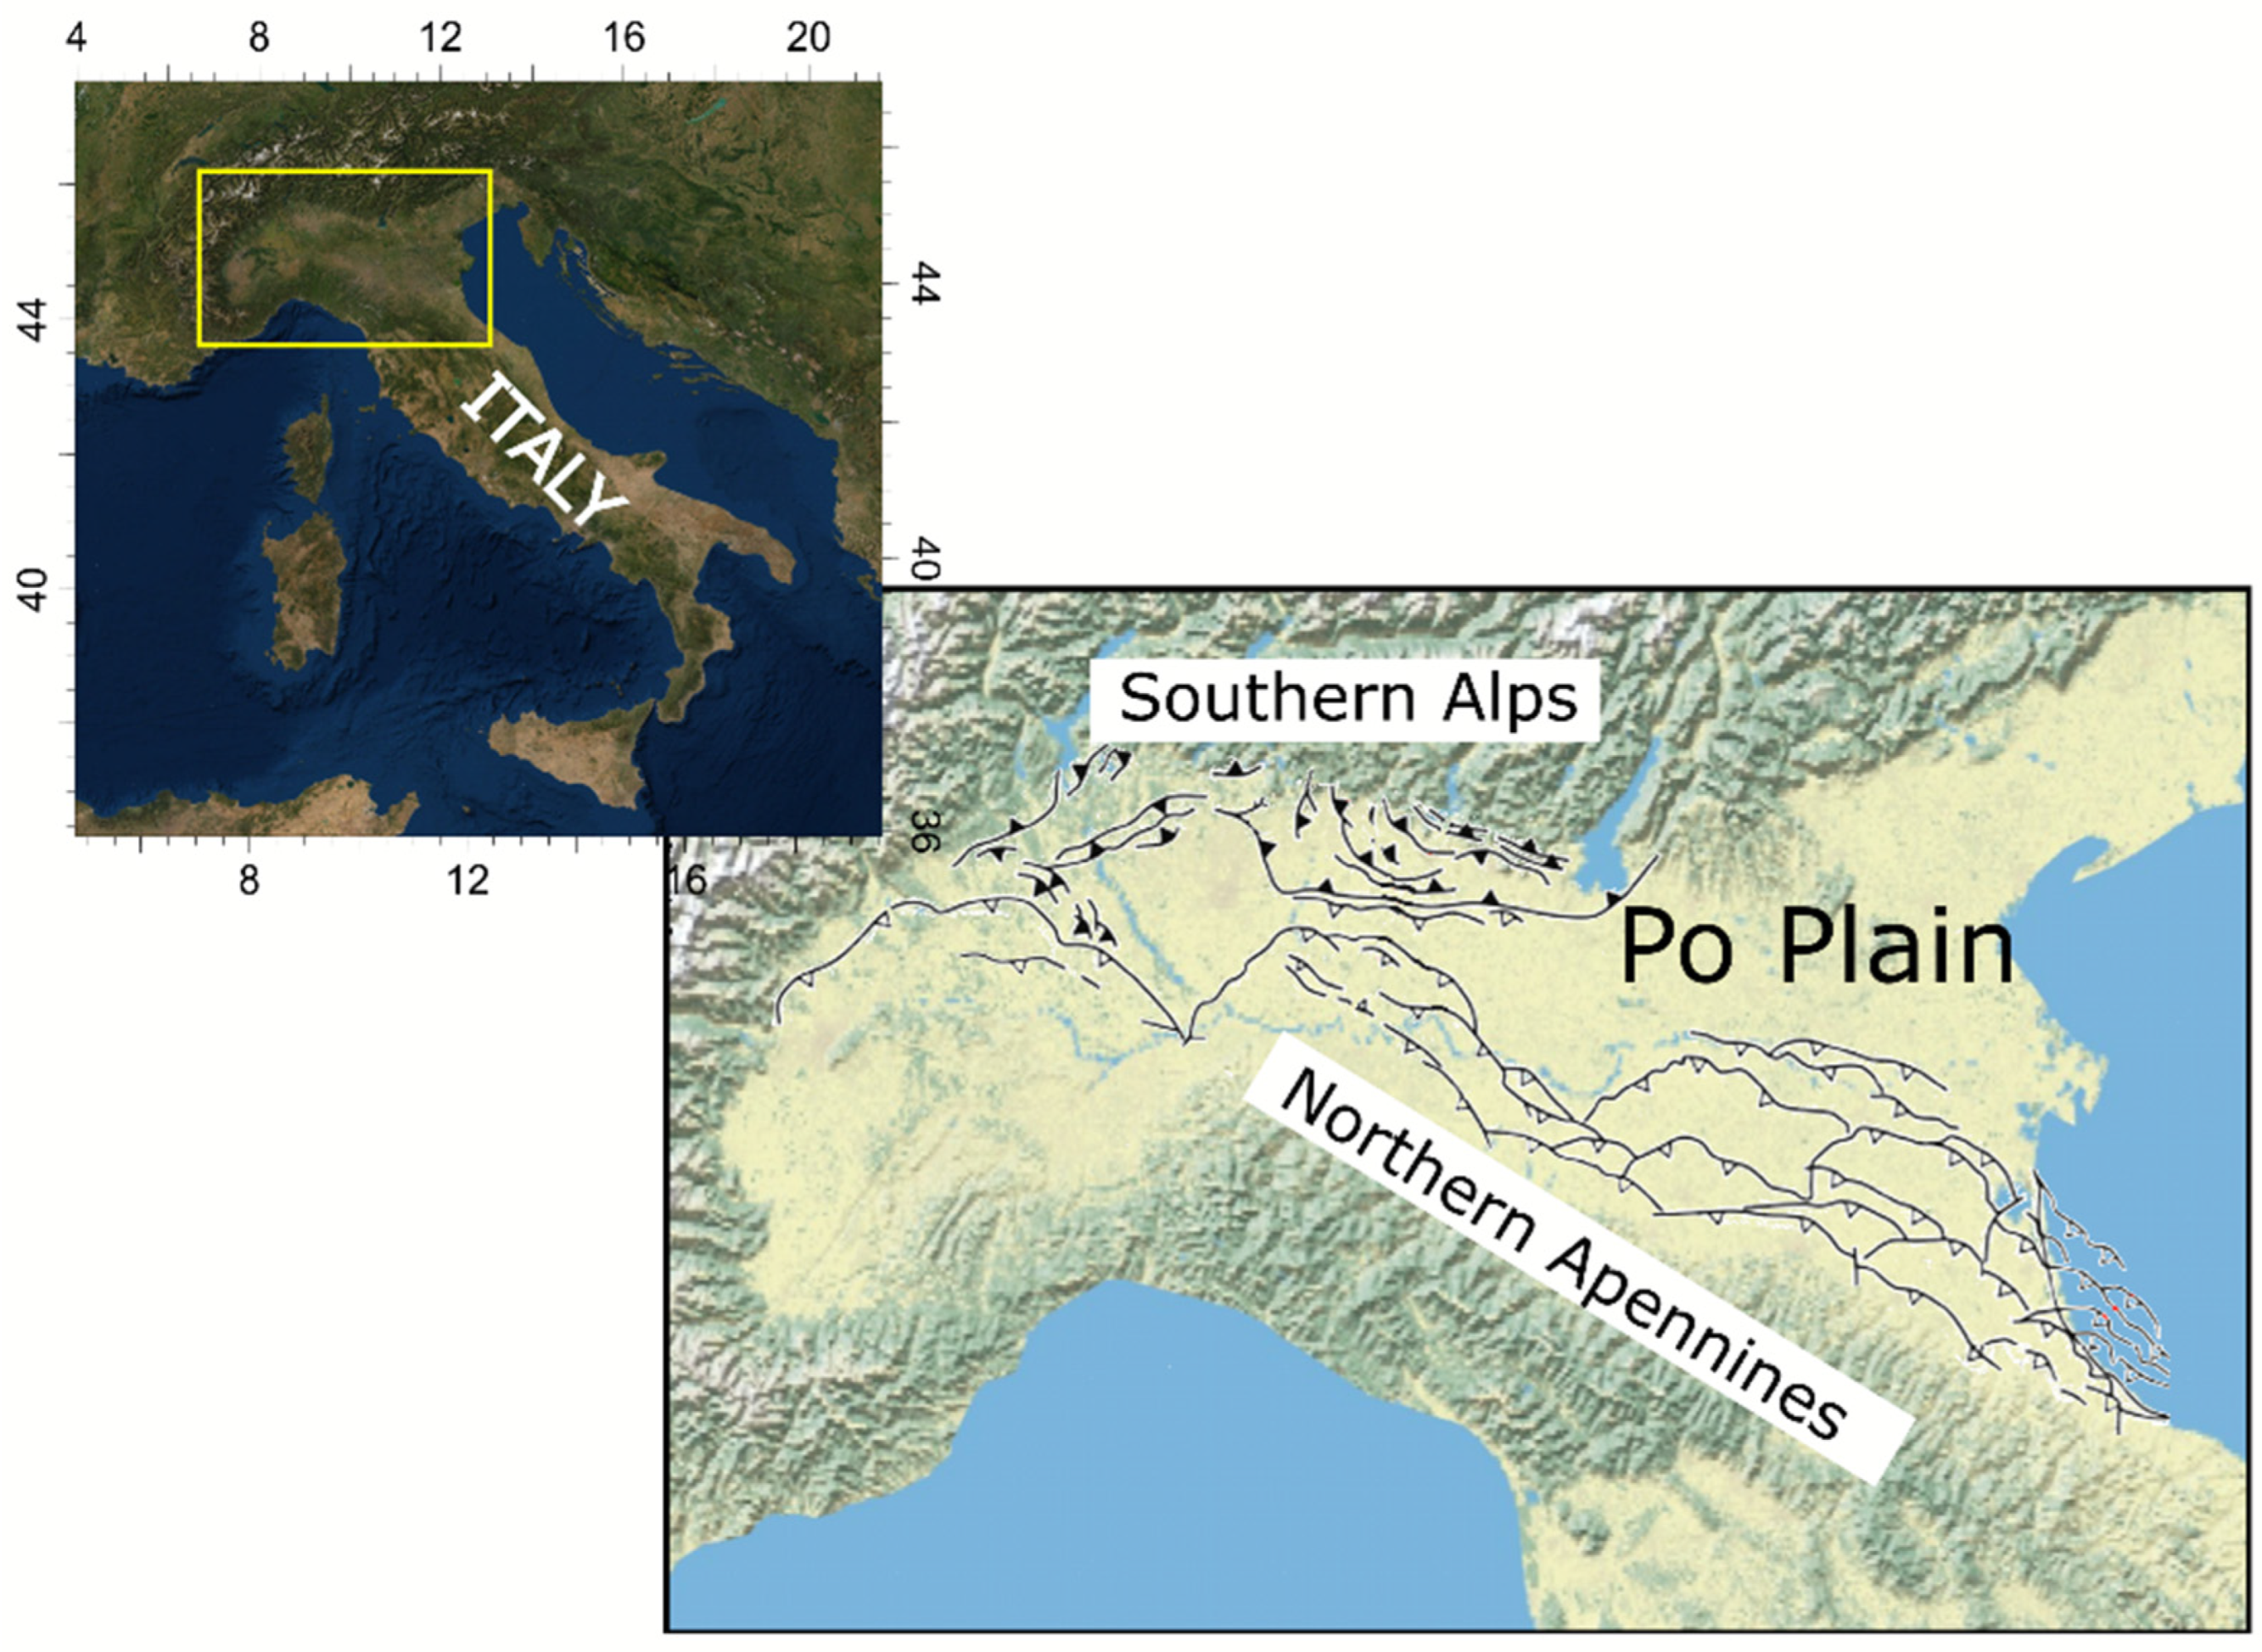
The Po Plain, located in northern Italy, is a highly industrialized and populated region. It covers an area of about 40,000 km
2, extending approximately 650 km in an E–W direction from the Western Alps to the Adriatic Sea. The Po Plain forms an extensive sedimentary basin representing the foreland basin system of two fold-and-thrust belts: the Northern Apennines and the Southern Alps. The N–NE verging Northern Apennines system is buried beneath the Quaternary cover, whereas the S verging Southern Alps system forms a platform dipping gently into the basin [
1].
The Po Plain is a rapidly subsiding area, with subsidence rates up to 70 mm/year, characterized by massive water production and the presence of gas reservoirs and Underground Gas Storage (UGS) systems. It has been the focus of numerous studies involving subsidence analyses, as will be discussed later on. In fact, the study and prediction of subsidence are essential to prevent negative impacts on social–economic activities, to ensure urban settlement protection, and ultimately, the safety of extraction and storage activities.
Land subsidence drivers can generally be classified into two categories: natural and anthropogenic. Natural subsidence takes place over millions to thousands of years resulting from long-term geological movements, whereas anthropogenic subsidence operates over hundreds to tens of years and refers to short-term movements. According to the literature, natural subsidence is responsible for 23.08% of the land subsidence around the world, whereas anthropogenic drivers are responsible for 76.92% [
2].
Natural land subsidence and uplift arise mainly due to geological conditions that act on highly compressible thick sediments. It may act on either a local (few to tens of kilometers) or a regional (tens to hundreds of kilometers) scale. These long-term movements are mainly the result of faulting, compaction of recent sediment deposits, tectonic movements, and sea-level rise, as well as compaction and post-glacial rebound [
3]. Significant research has been focused on the effects of the tectonic activity and deformation of the Apennine belt and Po Plain [
4,
5,
6,
7,
8,
9,
10,
11], and numerous papers offer a holistic overview of the previous works [
1,
12,
13,
14].
On the other hand, anthropogenic land subsidence results from human activities such as the extraction of fluids from the subsurface and eventually their re-injection (UGS, geothermal activities), the underground excavation for mining activities, the construction of surface and underground facilities and structures, carbonate rock solution, and erosion of subsurface, among others [
15]. In the Po Plain area, the gas fields underwent production from a number of deep onshore and offshore formations, whereas groundwater extraction was characterized by a shallow, well-developed multi-aquifer system [
16].
Anthropogenic subsidence in the Po Plain has been the topic of numerous studies due to its high degree of urbanization and the abundance of hydrocarbon fields and groundwater bodies. The research investigates the effect of water production [
16,
17,
18], among others, or the effects of hydrocarbon activities, in terms of reservoir exploitation and UGS operation [
19,
20,
21,
22], but an accurate and reliable analysis of the superposition of both is still a marginal, even if meaningful, approach. Based on the authors’ experiences, several issues cause the approach to be challenging and onerous: the accuracy in describing a wide volume of underground formations in terms of both geological, geotechnical/geomechanical, and fluid-flow characteristics together with the involved multi-physical phenomena (i.e., stress–strain and fluid flow). Furthermore, the definition of the fluid produced/injected volumes from/into underground natural formations and their spatial allocation are not a trivial task. This information is usually well-defined for natural gas reservoirs via monitoring surveys throughout the reservoir’s life; in contrast, the identification of water production is usually more challenging.
The production data plays a key role in understanding and in forecasting the ground movement induced by fluid production as a whole, and in discriminating the contribution of each different source. The scope of the present paper is the definition of a dataset of the historical fluid exploitation/withdrawal information related to gas reservoirs, aquifers, and UGS in the Po Plain in general, and more specifically in the Emilia-Romagna region. Different data sources, not always easy to find, such as information about water production, were gathered, analyzed, and organized in terms of the produced volumes as well as their spatial and temporal allocation. For the sake of clarity, the collected data were represented via dedicated georeferenced maps. The dataset could become a reference source of information for a rigorous distinction between the effects of water production and gas production in terms of induced ground movements. As a consequence, it will allow to more accurately optimize the efficiency of the future production activities with respect to regulations concerning the safety of the infrastructures and underground system.
2. Materials and Methods
The stratigraphy and the geological framework of the Po Plain are delineated, and two fluid production datasets for water and gas are presented via georeferenced maps, histograms, and tables with their dedicated sources.
2.1. Geology of Po Plain
A primary geological description of the geodynamic evolution and the stratigraphy of the study area is presented in this section, with a specialized focus on the superficial aquifers.
2.1.1. Regional Framework
The geodynamic evolution of the Po Plain reflects a complex series of events that began in the Early Mesozoic (about 250 Ma ago) and continued to the Pleistocene. The opening of the Tethyan Ocean connected to the early stages of the extension of the Adria microplate, a promontory of the Africa plate, led to a prolonged E–W extension and rifting phase throughout the Mesozoic that generated fault-bounded basins characterized by carbonate-dominated successions. This extensional regime was active until the Lower Paleogene and was followed by a Cenozoic compression phase connected to the collision of the Adria microplate with Eurasia. This led to the closure of the ocean basin and the development of thrust zones at the opposite-verging Northern Apennines and the Southern Alps fold-and-thrust belts in an average NW–SE direction since the Late Cretaceous (e.g., [
23]). The continuous development of the belts gave rise to the Po Plain–Adriatic foredeep/foreland basin, where thick syn-orogenic clastic sequences were accumulated during the Neogene and Quaternary [
1]. Then, a Plio-Pleistocene compressional event in the northern–central Apennine led to the rapid subsidence of the Po Plain and the Central Adriatic basin. The latter caused the more external fronts of the Apennines and Alpines thrust belts to be buried beneath the plain (
Figure 1). The Northern Apennines thrust belt is defined by three arcs of blind, north-verging thrusts and folds, which are, from west to east: the Monferrato Arc, the Emilia Arc, and the Ferrara-Romagna Arc. The outer fronts of the Southern Alps display a simpler pattern and deform the south-sloping Pedealpine homocline [
4].
The stratigraphy of the Po Plain has been studied mainly with hydrocarbon exploration data, including composite well logs, 2D seismic lines, and technical reports made available to the public through the “Visibility of petroleum exploration data in Italy” (VIDEPI) database of the Italian Ministry for Economic Development (MISE). From bottom to top (oldest to youngest), we can identify the metamorphic basement of the Hercynian age overlain by Mesozoic to Eocene sedimentary successions encompassing mainly limestones (mudstone and packstone–grainstone), dolomites with marls. The overlying Miocene formations include sandy marls conglomerates representing the deposition of the foreland ramp. The evolution of the foredeep Northern Apennine system from the late Miocene to late Pliocene consist of the main formations such as the Santerno Fm. made up of silty clays with sand, the Porto Garibaldi and Porto Corsini Fm. characterized by sand-rich successions with minor clay and the Sergnano Fm. made up of shallow-marine conglomerates and sands with clayey units. The latter geological formations host the majority of the gas reservoirs present in the Po Plain area. These formations are overlaid by a very thick sequence of clastic deposits from the Pliocene to the Late Pleistocene, consisting mainly of sands and clayey sands as seen in the Sabbie di Asti Group Fm. Recent clastic deposits (Quaternary sequence) consist of alternate sand and clay layers with a maximum thickness of about 2000 m. This sequence hosts a complex multi-aquifer freshwater system [
16,
25]. A schematic stratigraphic description of the Plio-Pleistocene part of the sedimentary sequence is shown in
Figure 2.
2.1.2. Superficial Aquifers
By definition, aquifers are geological bodies that, due to their petrophysical characteristics, act as reservoirs allowing the storage and the flow of the underground water. Alluvial sediments, that locally exceed 500 m of thickness [
26], make up the uppermost part of the stratigraphic succession in the Emilia-Romagna plain. These sediments consist of alternations of sand, clay, and silt, while gravels are present mostly in the southern part of the plain [
25]. The natural mechanisms responsible for the deposition of the uppermost (Late Quaternary) part of the stratigraphic record are the effect of both regional subsidence and tectonic uplift due to deglaciation (e.g., [
27,
28]). These geological movements controlled the sea-level changes that, together with the climate fluctuations, led to the cyclic depositional behavior of deltaic and alluvial systems in the broader area.
In the Emilia Romagna region, different aquifer types exist, containing freshwater, brackish, and saltwater. The majority of the produced water, for civil, agricultural, or industrial uses, is provided by thousands of drilled wells with depths that span the range from 5 to 600 m. The stratigraphy of the alluvial deposits occupying the first few hundreds of meters of the basin includes three basic aquifers groups nominated A, B, and C. Two representative cross-sections in E–W and NE–SW directions are presented in
Figure 3; they provide indications about the aquifer position and geometry throughout the Emilia-Romagna plain.
Aquifer group A is the most recent one, covering the time period of Middle Pleistocene–Holocene, while the aquifer groups B and C are older, covering the time period of Upper Pliocene–Middle Pleistocene. The first two aquifer groups (A and B) are formed mostly by alluvial deposits that consist of gravel (alluvial conoid origin), fine material (alluvial plain origin), and sand deposits of meandric origin. Aquifer group C instead is formed by coastal and marine–marginal sediments and consists of alternations of sand and finer sediments [
30]. The depositional environment of each aquifer group and its location inside the plain also control the continuity of sedimentation and thus the hydraulic connectivity between the aquifer groups. Discontinuity surfaces can exist due to the geometry of the deposition and the temporal pause in sedimentation [
30]. Significant discontinuities are observed, usually close to faults, while further away from these active structures, sedimentation is more continuous. The thickest part of the aquifer group is located in correspondence to the river conoids of the Emilia-Romagna region to the south, while significant thicknesses are also present to the north and northeast of the region.
2.2. Fluid Production Overview
The history of hydrocarbon exploration in the Po Valley began after World War Ⅱ in the mid-1950s [
31]. The Caviaga-1 well, drilled in 1944 to a total depth of 1404 m below sea level (ssl), resulted in the first significant discovery of natural gas in the Po Plain and in Italy. Over the years, thanks to the continuous advances in seismic data analyses and technologies such as seismic reflection methods, deeper successions in the Po Valley were targeted that led to the exploration of the Mesozoic carbonates [
32]. Significant oil and gas condensate fields were discovered during these successions, whereas gas fields represented shallow gas accumulations of thermogenic and biogenic origin of the Miocene, Pliocene, and Pleistocene ages. Most of the hydrocarbons that were discovered in the Po Valley are Pliocene and Pleistocene biogenic/diagenetic gas, with their reservoirs located in stratigraphic traps, thrusted anticlines, and drape structures [
33].
In Italy, numerous depleted gas reservoirs were converted into underground gas storage systems from the 1950s to the 1960s onwards, the first of which was the Cortemaggiore Field in 1964 in the Po Plain. UGS activities allow the storage of natural gas within subsurface geological layers, including depleted hydrocarbon reservoirs, aquifers, and salt caverns. This is done by seasonal and cyclical extraction and injection of gas in the winter and the summer, respectively [
33]. The main reasons for storing natural gas are (1) to meet baseload requirements, (2) to meet peak load requirements, and (3) to guarantee the national strategic reserves [
34]. Baseload requirements include satisfying long-term seasonal demand needs by providing a persistent and stable supply of natural gas, whereas peak load requirements involve the quick short-term deliverability of natural gas when the need arises [
35].
Groundwater production/extraction is one of the main inducers of land subsidence. In the Po Plain, a drastic increase in groundwater demand and production was observed in the second half of the 20th century after World War II. This was the direct result of population increase, industrial growth, and technological advancements in agriculture and zoology. This increase was consistent until the 1970s, when a national government law was passed, leading to the stabilization of groundwater extraction up until today. Studies focused on the Po Plain area show that the periods affected by an increase in water production coincided with periods of maximum subsidence rates [
13].
2.2.1. Water Production
Groundwater withdrawal data in the Emilia-Romagna region was provided for each province and for three different time periods by the “Agenzia Prevenzione Ambiente Energia Emilia-Romagna” (ARPAE). The data were gathered from different monitoring projects. Water production, expressed in 10
6 m
3/year, was provided by “Piano di Tutela delle Acque del 2005” for 2003 [
36], by “Piano di Gestione 2015” for the time period 2009–2011 [
37], and by “Progetto di Piano di Gestione 2021” for the time period 2015–2018 [
38]. The variation of these rates was represented by color-coded symbols on the position of extraction by municipality, which led to the production of three maps for the three time periods (
Figure 4). According to ARPAE, about half of the data were acquired through accurate measurements, whereas the other half were estimated. This is because their collection comes from combining different assessments conducted separately for different purposes (civil, industrial, and zootechnical). Thus, it is worth mentioning that the volumes provided and displayed in
Figure 4 are considered reliable at the scale of the provinces, but they could be up to 50% inaccurate at the scale of municipalities.
Histograms were then generated for each province displaying the frequency of the water production rates in 10
6 m
3/year for each of the investigated time periods: 2003, 2009–2011, and 2015–2018. In particular,
Figure 5 displays the frequency of water production rates for the provinces of Piacenza, Parma, Ferrara, and Forlì-Cesena, respectively, as examples of the main representatives of the water production trends. The remaining histograms can be found in
Appendix A.
2.2.2. Gas Production and UGS
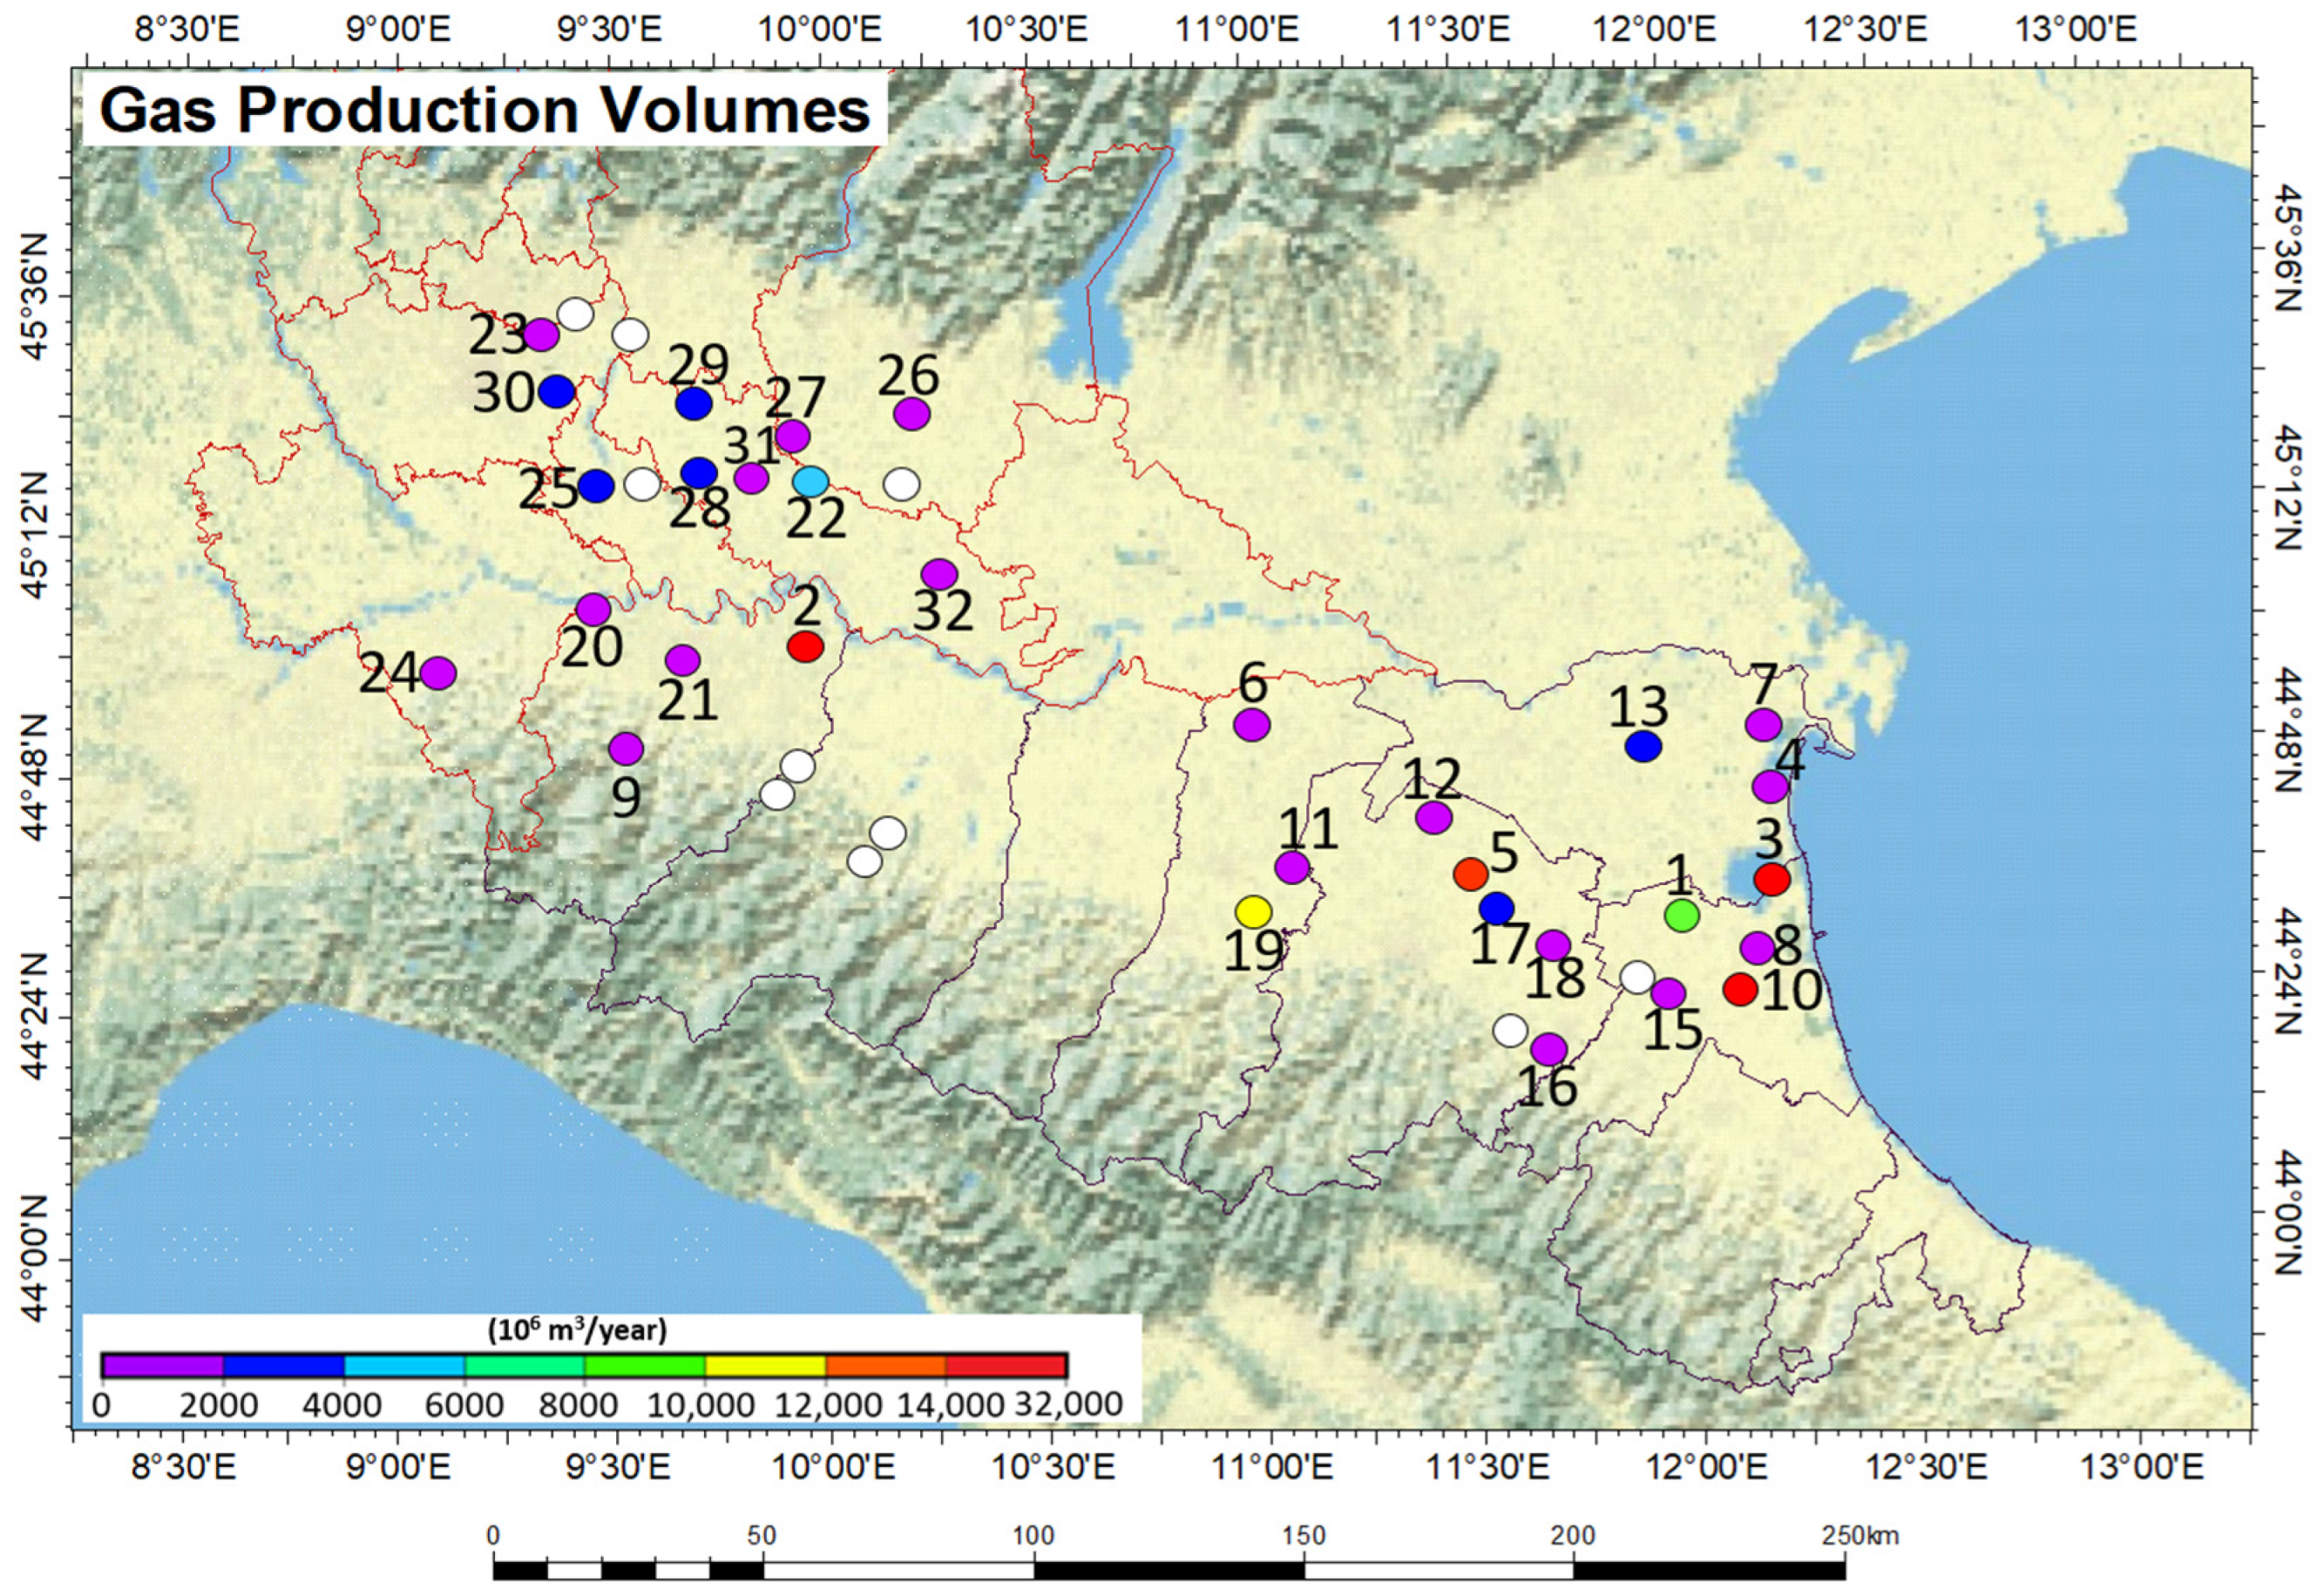
The gas fields and the UGS concessions in the Po Plain area (Emilia-Romagna and Lombardia regions) were geo-localized and are presented in
Figure 6 as a result of extensive research based on the technical literature and the available public sources. In addition, the cumulative gas production volumes are shown via color-coded symbols in
Figure 7.
Table 1 lists the time period of the primary production in association with the produced cumulative gas volumes (where available) and, eventually, the date of the reservoir conversion into UGS. Most of the data were collected from the National Mining Office of MISE (
https://unmig.mise.gov.it/index.php/it/dati/ricerca-e-coltivazione-di-idrocarburi (accessed on 29 April 2022)) and from the project VIDEPI, promoted by the Ministry for Economic Development (DGRME), the Italian Geological Society as well as the Italian Petroleum and Mining Industry Association (Assomineraria) (
http://www.videpi.com/videpi/videpi.asp (accessed on 29 April 2022). Additional information was acquired from [
39,
40,
41,
42], among others.
2.3. Experimental Design
The calculation and prediction of the ground movements on Earth’s surface can be assessed through a multi-disciplinary approach of 3D numerical modeling that includes the construction of a detailed stratigraphic and structural model of the subsurface and its population with the petrophysical and geomechanical parameters necessary for the performance of 3D fluid flow and geomechanical simulations. This approach has been applied in the past in various cases in Italy [
21,
22,
33,
43,
44,
45,
46,
47,
48], among others, and it begins with the construction of a dataset that usually includes a large variety of geophysical, geological, dynamic, and laboratory data as well as production data.
First, a regional scale 3D geological model is constructed through the analysis of the seismic and well log data that reproduces the main stratigraphic and structural features and includes a detailed lithological and petrophysical characterization from a certain depth, that usually coincides with a deep regional stratigraphic horizon, up to the Earth’s surface. A part of the 3D regional geological model, usually the reservoir area, is used to perform dynamic simulations in order to investigate the pressure variations and map the movements of the fluids inside the broader reservoir area due to production or injection of the fluids. At this stage, the essential data are the fluid properties (PVT data), production or injection fluid rates, fluid contacts, well completion data, etc. Afterward, the results of the dynamic modeling are input to the 3D regional model, and geomechanical simulations are performed. The geomechanical models allow the prediction of the perturbation of the state of stress not only inside and in the vicinity of the reservoir but also to all surrounding rocks, such as the caprock, and up to the surface (
Figure 8).
The uncertainties involved during each part of the process are mostly connected to the uncertainties of the dataset. Despite the intrinsic uncertainty related to each acquisition technology and the gathering of data from different sources, in reservoir geology and reservoir engineering, the initial data do not usually suffer from large uncertainties. Well log data offer high-resolution information and are frequently used to calibrate the seismic data that usually have large uncertainties due to the nature of their acquisition and their processing. Dynamic and geomechanical data are also accurate since they derive from direct measurements such as flow rates, petrophysical properties from laboratory analysis, etc. Uncertainties start to play a role in a more systematic way during the building of the 3D geological models and, in particular, during the distribution of the petrophysical or mechanical properties of the rock inside the grid cells. In many cases, the amount of data cannot adequately cover the entire area of investigation, and for that reason, geostatistical analysis is applied to help produce statistically representative realizations of the subsurface (e.g., [
49]).
The database of water production for the Po plain area, the main objective of the current work, is a valuable addition to the workflow presented above. It allows the performance of coupled fluid flow and stress/deformation simulations not only in the reservoir area but also in the uppermost (alluvium) layer of the geomechanical model that is characterized by stress-sensitive formations with high porosity and permeability, providing in this way a higher resolution of the calculated ground movements.
3. Results and Discussion
In this section, the fluid production datasets are discussed and critically analyzed in order to identify their trends in the Emilia-Romagna region and, consequently, to determine the strongest superposition between them. The main characteristics and differences relating to the production of water and gas are then addressed in terms of their effects on induced ground movements.
3.1. Analysis of the Dataset
Concerning the water production in the Emilia-Romagna region, the histograms (
Figure 5 and
Appendix A) along with the three geolocalized maps (
Figure 4) allow the identification of both its general and local trends, spatially and temporally. It is important to mention that the generated maps do not represent the actual areal extension of the aquifers hosted in the Alluvium formation; they display the total groundwater withdrawals on a municipal basis that may overlap, totally or at least partially, with the groundwater bodies (ARPAE). A widespread allocation of the water production within each province is highlighted: it was generally characterized by small production rates ranging from 0.004 × 10
6 to 10 × 10
6 m
3/year during the three time periods; however, at least one punctual water production rate greater than 10 × 10
6 m
3/year was observed in each province in each of the three time periods. This is observed in the province of Parma (
Figure 5b), with the largest punctual production value of 57.6 × 10
6 m
3/year that remained constant throughout time. Ferrara and Forlì-Cesena provinces show a different trend: in Ferrara (
Figure 5c), higher rates were only observed in the last investigated period, whereas in Forlì-Cesena (
Figure 5d), they were only observed in the first two investigated periods. Furthermore, all provinces display a gradual decrease in water production with time, as shown in the example of Piacenza (
Figure 5a).
Thus, the interpretation of the water production dataset has shown that:
The general trend of water production per year in the Emilia-Romagna region slightly decreased from 2003 (with a cumulative consumption of 663 × 106 m3/year) to 2009–2011 (659 × 106 m3/year) to 2015–2018 (623 × 106 m3/year).
Water production is characterized by small values of volume and by a widespread extension inside each province. In certain areas, a localized constant high-water production is observed in all investigated time frames.
In order to delineate a complete timeline of the history of groundwater production in the region, additional data were collected from [
13,
16]. The rates of water extraction in the Emilia-Romagna region drastically increased from the 1950s (200 × 10
6 m
3/year) to the late 1970s (740 × 10
6 m
3/year) and then displayed a slight decrease in the 1990s (710 × 10
6 m
3/year) and early 2000s (703 × 10
6 m
3/year). The data collected in the present paper are in line with a general decrease trend from the 1970s.
The maps related to the gas fields and the UGS concessions (
Figure 6 and
Figure 7) were then used to make a comparison with the water production dataset. Unlike the latter, the maps related to the gas fields and the UGS in Emilia-Romagna display the actual positions and areal extension of the concessions that are, in turn, extremely local. The primary gas production was generally characterized by cumulative volumes ranging from a minimum of tens of millions to a few billion cubic meters of gas.
Table 1 shows the highest concentrations of the primary gas production to be observed in the provinces of Bologna, Ferrara, and Ravenna in the fields of Minerbio, Dosso degli Angeli, and Ravenna Terra, respectively. In general, and in accordance with what was discussed in
Section 3, a high majority of the fields started producing primarily in the mid-1950s, while others followed later on in that century. The conversion of some of those fields into UGS started in the 1960s. It is worth noting that some of the gas fields experienced their late production stage during the investigated time periods (2003, 2009–2011, 2015–2018) for the water production dataset, whereas all the UGS systems were operated during those periods. Although a quantitative comparison between water and gas historically produced is not straightforward, it can be pointed out that the highest concentrations of gas production and the drastic increases in water production had temporally coincided within the period from the 1950s to the late 1970s.
Concerning the Emilia-Romagna region, the strongest superposition between hydrocarbon activities (both primary production and UGS concessions) and water production is located in the following provinces: Piacenza, Ferrara, Bologna, and Ravenna.
3.2. Discussion
This section is dedicated to the identification of the main features and the key differences between water and gas production, which primarily affect the induced ground movements.
Water production mainly interests the shallow (0–600 m ssl) part of geological formations. It usually involves widespread areal extension in relation to both the number of wells, widely dispersed, and the potential hydraulic connection between the aquifers. On the time scale, even if water production is partially affected by seasonal needs, it has been present over the years. From a lithological standpoint, the aquifers consist mainly of poorly consolidated gravel and sand deposits, characterized by high values of porosity (33–45%) [
26], hydraulic conductivity (10
−3–10
−5 m/s) [
26], and compressibility (10
−2–10
−3 1/(kg/cm
2)) [
16]. As a consequence, soil consolidation, induced by water production, strongly affects the petrophysical properties of the formations and, accordingly, the pore pressure spatial and temporal evolution. Furthermore, the groundwater exploitation from shallow unconsolidated alluvial sediments is one of the main inducers of the anthropogenic land subsidence in the Po Plain as it generates fast and evident ground surface deformation [
13].
The primary production of natural gas, instead, is a well-constrained phenomenon from both spatial and temporal standpoints. Reservoir formations are located at an average depth of 1000–1600 m ssl, and they consist of medium to consolidated sandstone and conglomerate, with a pseudo-elastic modulus in the order of a few Gigapascals (GPa) to some tens of GPa [
50]. Experimental evidence has shown a deformation and strength behavior between rock mechanics and soil mechanics [
51]. However, their degree of consolidation usually guarantees very small to negligible effects in terms of petrophysical variations induced by fluid extraction. Musso et al. [
52] demonstrated the lack of the linear poroelastic model in reproducing the increased subsidence observed even after the end of production. This delay in subsidence is attributed either to the delayed depletion of low permeability layers or to the time-dependent behavior of materials that leads to the creep phenomenon known as secondary compression. In fact, water encroachment helps sustain the pore pressure during production, spreading the pressure drop over a volume much larger than that of the reservoir. This may contribute to the enlargement of the expected subsidence cone even after field abandonment [
53]. Furthermore, the ground movements above gas fields are also highly dependent on the reservoir surrounding rock formations which is not the case for shallow aquifer systems, characterized by a subsidence spreading factor equal to 1 [
54].
The underground storage of natural gas shows its own peculiarities, mainly in the induced fluid pressure variation. The storage strategy responds to seasonal and cyclical demand, with increasing pressure in the summer injection period and decreasing pressure in the winter production period. The consequent reservoir shrinkage and expansion propagate up to the surface, inducing the so-called “earth breathing” phenomenon, i.e., seasonal and cyclical subsidence and rebound. Furthermore, if the involved formations are depleted reservoirs, experimental evidence [
21,
55] has shown an increased stiffness of the formations caused by primary productions and their pseudo-elastic shrinkage and expansion during UGS activities.
The effects of the differences in the properties of the two fluids are also worth mentioning. The kinematic viscosity of the water is generally an order of magnitude higher than that of the natural gas, implying a higher resistance to flow compared to the one of gas. In addition, the compressibility of the two fluids differs by two orders of magnitude [
56]. As is well known, both properties affect the evolution of fluid pressure distribution in the porous medium, with consequent effects on the subsidence phenomenon.
Finally, the following consideration can be inferred in terms of the ground movements in the Po Plain area induced by fluid extraction/injection:
4. Conclusions
The proposed research was focused on the Po Plain in northern Italy, an industrialized, highly populated area that is also experiencing rapid subsiding. Two main characteristics of the broader area that affect the subsidence rates are intense water production (in the range of 108–1010 m3/year) for urban, industrial, and agricultural activities and the presence of numerous gas fields (around 32), some still in production while others have been converted into underground gas storage (around 11). The superposition of both phenomena makes the study and the prediction of the subsidence of primary importance in order to guarantee the safety of the inhabitants and of the infrastructures on the Earth’s surface and safeguard all industrial activities. The holistic overview of the paper can be helpful for Regional/National authorities in locating the most neuralgic points and planning further measurement surveys accordingly.
The proposed research collects from different sources the water and hydrocarbon produced (and injected) volumes and their spatial and temporal allocation. The data are then analyzed and organized via dedicated georeferenced maps. The definition of aquifer areal continuity and an accurate allocation of the production at the wells are also discussed.
Based on the dataset, it can be pointed out that water production mainly interests the shallow part (0–600 m ssl) of unconsolidated sediments, and it is widespread, both in space and time. Instead, the primary gas production and the underground storage of natural gas involve deeper parts of the subsurface, usually a couple of thousands of meters deep (1000–1600 m ssl), medium to consolidated sandstone and conglomerate, and they are spatially and temporally well constrained. The drastic increases in water production and the highest concentrations of gas production temporally coincided between the 1950s and 1970s. The ‘hotspots’ of the strongest superposition are recognized in Piacenza, Ferrara, Bologna, and Ravenna provinces, and nowadays involve mainly water production and UGS activities. Furthermore, gas fields are experiencing late production at present, and the superposition of effects mainly concerns UGS activities and water production operations.
The crucial issues concern the definition of aquifer areal continuity and an accurate allocation of the production of wells. Additionally, the information about the water production from hydrocarbon reservoirs lacks quantity and accuracy. This information could be collected in more detail for each case study.
The paper presents the first step of a wider research project aimed at calculating, via numerical analysis, the effect of subsidence caused by fluid productions and, consequently, quantifying from InSAR data and from comparison with previous studies the natural subsidence effects.
Author Contributions
Conceptualization, Methodology, V.R., C.E., C.B.; Formal Analysis, C.E. Writing—Original Draft Preparation C.E.; Writing–Review & Editing, C.E., V.R., C.B. All authors have read and agreed to the published version of the manuscript.
Funding
This research received no external funding.
Institutional Review Board Statement
Not applicable.
Informed Consent Statement
Not applicable.
Data Availability Statement
Data is contained within the article or available from referenced sources.
Acknowledgments
The authors would like to deeply thank ARPAE (Agenzia regionale prevenzione, ambiente ed energia dell’Emilia-Romagna), specifically Andrea Chahoud, for providing the data on water production in the Emilia-Romagna region.
Conflicts of Interest
The authors declare no conflict of interest.
Appendix A
Figure A1.
Frequency of water production rates for the province of Reggio Emilia for the three investigated time periods.
Figure A1.
Frequency of water production rates for the province of Reggio Emilia for the three investigated time periods.
Figure A2.
Frequency of water production rates for the province of Modena for the three investigated time periods.
Figure A2.
Frequency of water production rates for the province of Modena for the three investigated time periods.
Figure A3.
Frequency of water production rates for the province of Bologna for the three investigated time periods.
Figure A3.
Frequency of water production rates for the province of Bologna for the three investigated time periods.
Figure A4.
Frequency of water production rates for the province of Ravenna for the three investigated time periods.
Figure A4.
Frequency of water production rates for the province of Ravenna for the three investigated time periods.
Figure A5.
Frequency of water production rates for the province of Rimini for the three investigated time periods.
Figure A5.
Frequency of water production rates for the province of Rimini for the three investigated time periods.
References
- Doglioni, C. Some remarks of the origin of foredeeps. Tectonophysics 1993, 228, 1–20. [Google Scholar] [CrossRef]
- Bagheri-Gavkosh, M.; Hosseini, S.M.; Ataie-Ashtiani, B.; Sohani, Y.; Ebrahimian, H.; Morovat, F.; Ashrafi, S. Land Subsidence: A Global Challenge. Sci. Total Environ. 2021, 778, 146193. [Google Scholar] [CrossRef] [PubMed]
- Allen, S.A. Types of land subsidence. In Guidebook to Studies of Land Subsidence Due to Groundwater Withdrawal; Poland, J.F., Ed.; UNESCO: Paris, France, 1984; pp. 133–142. [Google Scholar]
- Burrato, P.; Ciucci, F.; Valensise, G. An inventory of river anomalies in the Po Plain, Northern Italy: Evidence for active blind thrust faulting. Ann. Geophys. 2003, 46, 865–882. [Google Scholar] [CrossRef]
- Carminati, E.; Doglioni, C.; Scrocca, D. Apennines subduction-related subsidence of Venice (Italy). Geophys. Res. Lett. 2003, 30, 1717. [Google Scholar] [CrossRef]
- Livio, F.; Berlusconi, A.; Michetti, A.; Sileo, G.; Zerboni, A.; Trombino, L.; Cremaschi, M.; Mueller, K.; Vittori, E.; Carcano, C.; et al. Active fault-related folding in the epicentral area of the 25 December 1222 Brescia earthquake (Northern Italy): Seismotectonic implications. Tectonophysics 2009, 476, 320–335. [Google Scholar] [CrossRef]
- Maesano, F.E.; Toscani, G.; Burrato, P.; Mirabella, F.; D’Ambrogi, C.; Basili, R. Deriving thrust fault slip rates from geological modeling: Examples from the Marche coastal and offshore contraction belt, Northern Apennines, Italy. Mar. Pet. Geol. 2013, 42, 122–134. [Google Scholar] [CrossRef]
- Turrini, C.; Lacombe, O.; Roure, F. Present-day 3D structural model of the Po Valley basin, Northern Italy. Mar. Pet. Geol. 2014, 56, 266–289. [Google Scholar] [CrossRef]
- Bruno, L.; Amorosi, A.; Severi, P.; Costagli, B. Late Quaternary aggradation rates and stratigraphic architecture of the southern Po Plain, Italy. Basin Res. 2017, 29, 234–248. [Google Scholar] [CrossRef]
- Bruno, L.; Bohacs, K.M.; Campo, B.; Drexler, T.M.; Rossi, V.; Sammartino, L.; Scarponi, D.; Hong, W.; Amorosi, A. Early Holocene transgressive paleography in the Po coastal plain (northern Italy). Sedimentology 2017, 64, 1792–1816. [Google Scholar] [CrossRef]
- Bruno, L.; Campo, B.; Di Martino, A.; Hong, W.; Amorosi, A. Peat layer accumulation and post-burial deformation during the mid-late Holocene in the Po coastal plain (Northern Italy). Basin Res. 2019, 31, 621–639. [Google Scholar] [CrossRef]
- Carminati, E.; Di Donato, G. Separating natural and anthropogenic vertical movements in fast-subsiding areas: The Po Plain (N. Italy) case. Geophys. Res. Lett. 1999, 26, 2291–2294. [Google Scholar] [CrossRef]
- Carminati, E.; Martinelli, G. Subsidence rates in the Po Plain, northern Italy: The relative impact of natural and anthropogenic causation. Eng. Geol. 2002, 66, 241–255. [Google Scholar] [CrossRef]
- Massari, F.; Rio, D.; Serandrei Barbero, R.; Asioli, A.; Capraro, L.; Fornaciari, E.; Muellenders, W.; Raffi, L.; Vergerio, P.P. The environment of Venice in the past two million years. Paleogeogr. Paleoclimatol. Paleoecol. 2004, 202, 273–308. [Google Scholar] [CrossRef]
- Modoni, G.; Darini, G.; Spacagna, R.L.; Saroli, M.; Russo, G.; Croce, P. Spatial analysis of land subsidence induced by groundwater withdrawal. Eng. Geol. 2013, 167, 59–71. [Google Scholar] [CrossRef]
- Teatini, P.; Ferronato, M.; Gambolati, G.; Gonella, M. Groundwater pumping and land subsidence in the Emilia-Romagna coastland, Italy: Modeling the past occurrence and the future trend. Water Resour. Res. 2006, 42, W01406. [Google Scholar] [CrossRef]
- Darini, G.; Modoni, G.; Saroli, M.; Croce, P. Land subsidence induced by groundwater extraction: The case of Bologna. In Proceedings of the International Congress on Environmental Modelling and Software: Integrating Sciences and Information Technology for Environmental Assessment and Decision Making, Barcelona, Spain, 7–10 July 2008; Volume 3, pp. 1386–1392. [Google Scholar]
- Ferronato, M.; Gambolati, G.; Teatini, P.; Gonella, M.; Bariani, C.; Martelli, G. Modelling Possible Structural Instabilities of the Po River Embankment, Italy, due to Groundwater Pumping in the Ferrara Province. In Proceedings of the International Congress on Modelling and Simulation (MODSIM0710)—Land, Water and Environmental Management: Integrated Systems for Sustainability, Christchurch, New Zealand, 10–13 December 2007; pp. 1224–1230. [Google Scholar]
- Baù, D.; Gambolati, G.; Teatini, P. Residual Land Subsidence over Depleted Gas Fields in the Northern Adriatic Basin. Environ. Eng. Geosci. 1999, 4, 389–405. [Google Scholar] [CrossRef]
- Baú, D.; Ferronato, M.; Gambolati, G.; Teatini, P. Basin-scale compressibility of the northern Adriatic by the radioactive marker technique. Geotechnique 2002, 52, 605–616. [Google Scholar] [CrossRef]
- Benetatos, C.; Codegone, G.; Ferraro, C.; Mantegazzi, A.; Rocca, V.; Tango, G.; Trillo, F. Multidisciplinary analysis of ground movements: An Underground Gas Storage Case Study. Remote Sens. 2020, 12, 3487. [Google Scholar] [CrossRef]
- Teatini, P.; Castelletto, N.; Ferronato, M.; Gambolati, G.; Janna, C.; Cairo, E.; Marzorati, D.; Colombo, D.; Feretti, A.; Bagliani, A.; et al. Geomechanical response to seasonal gas storage in depleted reservoirs: A case study in the Po River basin, Italy. J. Geophys. Res. 2011, 116, F02002. [Google Scholar] [CrossRef]
- Benetatos, C.; Codegone, G.; Marzano, F.; Costanzo, P.; Verga, F. Calculation of Lithology-Specific P-Wave Velocity Relations from Sonic Well Logs for the Po-Plain Area and the Northern Adriatic Sea. In Proceedings of the Offshore Mediterranean Conference and Exhibition, Ravenna, Italy, 27–29 March 2019. [Google Scholar]
- Amadori, C.; Toscani, G.; Di Giulio, A.; Maesano, F.E.; D’Ambrogio, C.; Ghielmi, M.; Fantoni, R. From cylindrical to non-cylindrical foreland basin: Pliocene–Pleistocene evolution of the Po Plain–Northern Adriatic basin (Italy). Basin Res. 2019, 31, 991–1015. [Google Scholar] [CrossRef] [Green Version]
- Severi, P. Soil uplift in the Emilia-Romagna plain (Italy) by satellite radar interferometry. Boll. Geof. Teor. Appl. 2021, 62, 527–542. [Google Scholar] [CrossRef]
- Di Dio, G. (Ed.) Riserve Idriche Sotterranee Della Regione Emilia-Romagna, Scala 1:250.000; Regione Emilia-Romagna, Ambiente, Geologia, Sismica e Suoli and ENI-AGIP: Bologna, Italy, 1998; p. 119. [Google Scholar]
- Antoncecchi, I.; Ciccone, F.; Rossi, G.; Agate, G.; Colucci, F.; Moia, F.; Manzo, M.; Lanari, R.; Bonano, M.; De Luca, C.; et al. Soil deformation analysis through fluid-dynamic modelling and DInSAR measurements: A focus on groundwater withdrawal in the Ravenna area (Italy). Boll. Geof. Teor. Appl. 2021, 62, 301–316. [Google Scholar] [CrossRef]
- Amorosi, A.; Colalongo, M.L.; Pasini, G.; Preti, D. Sedimentary response to Late Quaternary sea level changes in the Romagna coastal plain (northern Italy). Sedimentology 1999, 46, 99–121. [Google Scholar] [CrossRef]
- Sezioni Geologiche e Prove Geognostiche Della Pianura Emiliano Romagnola (Regione Emilia-Romagna, 2021). Available online: https://geo.regione.emilia-romagna.it/cartografia_sgss/user/viewer.jsp?service=sezioni_geo (accessed on 26 April 2022).
- Farina, M.; Marcaccio, M.; Zavatti, A. (Eds.) Esperienze e Prospettive nel Monitoraggio Delle Acque Sotterranee. Il Contributo dell’Emilia-Romagna; Pitagora Editrice: Bologna, Italy, 2014; ISBN 88-371-1859-7. [Google Scholar] [CrossRef]
- Pieri, M. Storia Delle Ricerche nel Sottosuolo Padano Fino alle Ricostruzioni Attuali (History of the Hydrocarbon Exploration in the Po Valley Basin—A Century of Italian Geology). Cento anni di Geologia Italiana, Volume Giubilare, 1° Centenario della Società Geologica Italiana 1881–1981; Società Geologica: Italiana, Rome, 1984; pp. 155–177. [Google Scholar]
- Fantoni, R.; Galimberti, R.; Ronchni, P.; Scotti, P. Po Plain Petroleum Systems: Insights from Southern Alps outcrops (North Italy). In Proceedings of the AAPG International Conference & Exhibition, Milan, Italy, 23–26 October 2011. [Google Scholar]
- Castelletto, N.; Ferronato, M.; Gambolati, G.; Janna, C.; Teatini, P.; Marzorati, D.; Cairo, E.; Colombo, D.; Feretti, A.; Bagliani, A.; et al. 3D geomechanics in UGS projects. A comprehensive study in Northern Italy. In Proceedings of the 44th US Rock Mechanics Symposium and 5th U.S.—Canada Rock Mechanics Symposium, Salt Lake City, UT, USA, 27–30 June 2010; pp. 27–30.
- Verga, F. What’s conventional and what’s special in a reservoir study for underground gas storage. Energies 2018, 11, 1245. [Google Scholar] [CrossRef] [Green Version]
- Mannan, S. Lees’ Loss Prevention in the Process Industries, 4th ed.; Elsevier: Amsterdam, The Netherlands, 2012; pp. 1889–1985. [Google Scholar]
- Piano di Tutela delle Acque (Regione Emilia-Romagna, 2005). Available online: https://ambiente.regione.emilia-romagna.it/it/acque/temi/piano-di-tutela-delle-acque (accessed on 31 March 2022).
- Piano Gestione Rischio Alluvioni–Primo Ciclo (Regione Emilia-Romagna, 2015). Available online: https://ambiente.regione.emilia-romagna.it/it/suolo-bacino/sezioni/piano-di-gestione-del-rischio-alluvioni/pgra-rer (accessed on 31 March 2022).
- Piano di Gestione del Rischio di Alluvioni–Secondo Ciclo (Regione Emilia-Romagna, 2021). Available online: https://ambiente.regione.emilia-romagna.it/it/suolo-bacino/sezioni/piano-di-gestione-del-rischio-alluvioni/piano-gestione-rischio-alluvioni-2021 (accessed on 31 March 2022).
- Styles, P.; Gasparini, P.; Huenges, E.; Scandone, P.; Lasocki, S.; Terlizzese, F. Report on the Hydrocarbon Exploration and Seismicity in Emilia Romagna; International Commission on Hydrocarbon Exploration and Seismicity in the Emilia Romagna Region: Emilia Romagna, Italy, 2014. [Google Scholar]
- Casero, P. Structural setting of petroleum exploration plays in Italy. In Geology of Italy: Special Volume of the Italian Geological Society for the IGC 32 Florence-2004; Società Geologica Italiana: Rome, Italy, 2004. [Google Scholar]
- Bertello, F.; Fantoni, R.; Franciosi, R.; Gatti, V.; Ghielmi, M.; Pugliese, A. From thrust-and-fold belt to foreland: Hydrocarbon occurrences in Italy. In Petroleum Geology: From Mature Basins to New Frontiers. Proceedings of the 7th Petroleum Geology Conference; Geological Society of London: London, UK, 2010. [Google Scholar] [CrossRef]
- Soldo, E.; Alimonti, C.; Scrocca, D. Geothemal Repurposing of Depleted Oil and Gas Wells in Italy. Proceedings 2020, 58, 9. [Google Scholar] [CrossRef]
- Benetatos, C.; Rocca, V.; Sacchi, Q.; Verga, F. How to Approach Subsidence Evaluation for Marginal Fields: A Case History. Open Petrol. Eng. J. 2015, 8, 213–234. [Google Scholar] [CrossRef] [Green Version]
- Benetatos, C.; Codegone, G.; Deangeli, C.; Giani, G.P.; Gotta, A.; Marzano, F.; Rocca, V.; Verga, F. Guidelines for the study of subsidence triggered by hydrocarbon production. Geoing. Ambient. Min. 2017, 152, 85–96. [Google Scholar]
- Codegone, G.; Rocca, V.; Verga, F.; Coti, C. Subsidence modeling validation through back analysis for an Italian gas storage field. Geotech. Geol. Eng. 2016, 34, 1749–1763. [Google Scholar] [CrossRef]
- Gambolati, G.; Teatini, P. Geomechanics of subsurface water withdrawal and injection. Water Resour. Res. 2011, 51, 3922–3955. [Google Scholar] [CrossRef]
- Giani, G.P.; Gotta, A.; Marzano, F.; Rocca, V. How to Address Subsidence Evaluation for a Fractured Carbonate Gas Reservoir Through a Multi-disciplinary Approach. Geotech. Geol. Eng. 2017, 35, 2977–2989. [Google Scholar] [CrossRef]
- Giani, G.P.; Orsatti, S.; Peter, C.; Rocca, V. A Coupled Fluid Flow–Geomechanical Approach for Subsidence Numerical Simulation. Energies 2018, 11, 1804. [Google Scholar] [CrossRef] [Green Version]
- Benetatos, C.; Giglio, G. Coping with uncertainties through an automated workflow for 3D reservoir modelling of carbonate reservoirs. Geosci. Front. 2021, 12, 100913. [Google Scholar] [CrossRef]
- Rocca, V.; Cannata, A.; Gotta, A. A critical assessment of the reliability of predicting subsidence phenomena induced by hydrocarbon production. Geomech. Energy Environ. 2019, 20, 100129. [Google Scholar] [CrossRef]
- Marzano, F.; Pregliasco, M.; Rocca, V. Experimental characterization of the deformation behavior of a gas-bearing clastic formation: Soft or hard rocks? A case study. Geomech. Geophys. Geo-Energy Geo-Resour. 2019, 6, 1–15. [Google Scholar] [CrossRef]
- Musso, G.; Volonté, G.; Gemelli, F.; Corradi, A.; Nguyen, S.K.; Lancellotta, R.; Brignoli, M.; Mantica, S. Evaluating the subsidence above gas reservoirs with an elasto-viscoplastic constitutive law. Laboratory evidences and case histories. Geomech. Energy Environ. 2021, 28, 100246. [Google Scholar] [CrossRef]
- Ferronato, M.; Gambolati, G.; Teatini, P. On the role of reservoir geometry in waterdrive hydrodynamics. J. Pet. Sci. Eng. 2004, 44, 205–221. [Google Scholar] [CrossRef]
- Gambolati, G.; Teatini, P.; Ferronato, M. Anthropogenic Land Subsidence. In Encyclopedia of Hydrological Sciences; Anderson, M.G., McDonnell, J.J., Eds.; John Wiley & Sons: Hoboken, NJ, USA, 2006. [Google Scholar] [CrossRef]
- Coti, C.; Rocca, V.; Sacchi, Q. Pseudo-elastic response of gas bearing clastic formations: An Italian case study. Energies 2018, 11, 2488. [Google Scholar] [CrossRef] [Green Version]
- Burcik, E.J. Properties of Petroleum Reservoirs Fluids; John Wiley & Sons, Inc.: London, UK, 1957. [Google Scholar]
| Publisher’s Note: MDPI stays neutral with regard to jurisdictional claims in published maps and institutional affiliations. |
© 2022 by the authors. Licensee MDPI, Basel, Switzerland. This article is an open access article distributed under the terms and conditions of the Creative Commons Attribution (CC BY) license (https://creativecommons.org/licenses/by/4.0/).


