Article

Will a Geopolitical Conflict Accelerate Energy Transition in Oil-Importing Countries? A Case Study of the Philippines from a Real Options Perspective

by
Casper Boongaling Agaton
1,2
1
Utrecht School of Economics, Utrecht University, Kriekenpitplein 21-22, 3584 EC Utrecht, The Netherlands
2
Department of Community and Environmental Resource Planning, College of Human Ecology, University of the Philippines Los Baños, College, Laguna 4031, Philippines
Resources 2022, 11(6), 59; https://doi.org/10.3390/resources11060059
Submission received: 16 March 2022 / Revised: 16 June 2022 / Accepted: 17 June 2022 / Published: 20 June 2022

Abstract

:
Geopolitical conflicts, involving a major player in the world market, affect the prices of oil and commodities, particularly in oil-importing countries. Consequently, the unprecedented changes in oil prices impact investments in energy transition projects. This study aims to analyze the dynamics of investment decisions in energy transition under uncertainties in geopolitical risks. This research applies the Black-Scholes-based real options valuation to value the flexibility in postponing energy transition investments considering the repercussions of the Russia-Ukraine war. Applying the proposed model to the case of the Philippines, the valuation result with a net present value of USD 231 million for a 1 GW capacity shows that energy transition is a viable project when the cost savings from using fossil fuels to renewables are considered. On the other hand, real options valuation finds a higher flexibility value of USD 990 million, which implies a better decision to postpone the project. The uncertainty in geopolitical conflicts further increases this value causing a longer waiting period to implement the energy transition project. Sensitivity analysis shows that the results are robust to changes in the explanatory variables. Results provide policy implications on making an oil-importing country energy self-sufficient and robust from economic and geopolitical shocks.

1. Introduction

Decarbonizing the economy is one of the major challenges in most countries addressing climate change. Decarbonization can be achieved through an “energy transition”, which is the transition from the production and utilization of fossil fuels to cleaner and more sustainable sources of energy [1]. According to UNEP’s Emissions Gap Report 2021 [2], global GHG emissions dropped unprecedentedly by 5.4% in 2020 but are expected to bounce back in 2021 by 4.8% to pre-COVID levels at 59.1 Gt CO2e in 2019, primarily dominated by fossil CO2 emissions from energy and industry sectors. The report highlights the crucial role of decarbonizing the energy sector for a successful energy transition towards a low-carbon economy [2].
Despite the potentially significant reduction of GHG emissions, decarbonizing the energy sector is challenged with environmental sustainability, energy security, economic stability, and social aspects [3]. For instance, a global carbon tax might be a promising instrument to accelerate decarbonization. However, this instrument would be confronted by high capital requirements, the competition among energy sectors for decarbonization options, inconsistent environmental policies, as well as public acceptance of changes in energy usage [3]. For developing countries, the additional layer of obstacles to energy transition includes competitive prices of fossil fuels, lack of financial resources and policy support, and unreliability of renewable sources of energy [4].
Another set of challenges to energy transition is the occurrence of geopolitical and economic shocks. For instance, during the COVID-19 pandemic, various countries have reshaped their investment structure by increasing medical and health expenditures while withdrawing funds from renewable energy projects [5,6]. During the global financial crisis in 2008, stimulus plans for economic recovery resulted in large-scale funds flowing to fossil fuel industries, while reduction of public support for renewable energy in the form of subsidies and feed-in tariffs [5,7]. Meanwhile, Fischhendler et al. [8] argued that geopolitical conflicts have a dual impact: some aspects discourage energy transition to renewables, while others boost them. On one end, investments in renewables flourish under conditions of armed conflict and in volatile geopolitical contexts by taking the advantages of renewable energy while downplaying the disadvantages of conflict environments. On the other end, violent conflicts deter investors, discourage domestic and international trade, and suppress the development of renewable energy infrastructures [8]. Since countries use energy as a geopolitical weapon to protect their interests and ensure national security, geopolitical interests in the fossil fuels market change, making renewable energy sources appear more important in the international market [9].
The impacts of geopolitical conflicts on energy transition have been discussed in previous studies. For instance, the Russia-Ukraine conflict affects the world economy through higher prices for energy and weaker confidence and financial markets as a result of strong international sanctions against Russia [10]. While Ukraine is not a significant trading partner for any major economies, Russia has great exposure to the European Union, the United Kingdom, and other developing economies [10]. Studies show that unexpected changes in geopolitical risks increase the volatility of oil prices [11,12]. Consequently, this increase in oil price uncertainty has huge impacts on developing economies, particularly those countries that are too dependent on imported fossil products [4]. For instance, Cunado and Perez de Gracia [13] found that oil prices have a significant effect on both economic activity and price indices, although the impact is limited to the short run, and more significant when oil price shocks are defined in local currencies. In another study, Murshed and Tanha [14] found that movements in oil prices influence the renewable energy transition, which highlights the important policy implications in attaining energy security and environmental sustainability in the traditional imported crude oil-dependent countries. Yet, there has been no study that analyzes how extreme oil price uncertainties from geopolitical conflicts accelerate or slow down the energy transition towards a more sustainable economy.
This study addresses this gap by analyzing the decision dynamics in energy transition investments under uncertainties brought by geopolitical conflicts. Specifically, this research aims to calculate the value of an energy transition investment based on the cost savings from using fossil-based to renewable energy sources, estimate the value of flexibility to postpone the investment decision under uncertainty in geopolitical risks, analyze how various levers affect this flexibility value, and evaluate whether geopolitical conflicts accelerate or slow-down the energy transition. Using the case of the Philippines, an oil-importing country, this research applies both the traditional valuation method as well as the real options valuation to calculate the value and the flexibility to postpone the investment in the energy transition from fossil-based to renewable energy sources. This evaluates the optimal timing of investment under uncertainty in extreme oil prices as influenced by international conflicts such as the Russia-Ukraine war. Then, this study analyzes how changes in the explanatory variables affect investment decisions through sensitivity analysis. Finally, this study aims to provide recommendations on how an oil-importing country becomes energy self-sufficient and robust from economic and geopolitical shocks.

2. Materials and Methods

2.1. Real Options Background

Investment decisions for energy transition have characteristics that are not captured by traditional valuation methods such as net present value (NPV), internal rate of return, returns on investments, and so on. These characteristics include the irreversibility in making costly investments, highly risky and uncertain investment environments, and flexibility in decision-making (timing, operations, production, etc.) [4]. For instance, the NPV, which relies on all-or-nothing, now-or-never decisions, does not recognize the value of learning before making an investment decision.
The real options approach (ROA), on the other hand, captures these characteristics as it combines uncertainty and flexibility, which characterize irreversible investments in energy transition projects. A “real option” is the right approach, but not the obligation to undertake a project initiative such as postponing, expanding/contracting, or shutting down/restarting capital investment based on market, technological, and/or economic conditions [15,16]. The ROA is a more useful project valuation method when investment conditions are highly volatile and uncertain. Otherwise, the traditional valuation methods are more appropriate if investment and market environments are stable or less flexible [16].
Real options valuation models are mostly based on financial options. Among these models, the closed-form Black-Scholes model, developed by Black and Scholes [17] and Merton [18], is the most popular solution as it allows simple computation and is easy to conduct sensitivity analysis using a partial derivative. The value of the real option (RO), according to this model, can be calculated using Equation (1):
R O = V e δ ( T t ) N ( d 1 ) I e r ( T t ) N ( d 2 )
d 1 = l n ( V I ) + ( r δ + 1 2 σ 2 ) ( T t ) σ T t
d 2 = d 1 σ T t
where V is the value of free operating cash flows, δ is the opportunity cost, T − t is the time to expiration of the option, I is the investment cost, r is the risk-free interest rate, and N(d) is a cumulative normal probability density function. These six variables for real options are analogous to financial options as shown in Table 1.
Among these levers, the NPV only recognized two: the present value of expected cash flows and the present value of fixed costs as shown in Figure 1. On the other hand, this inadequacy can be explained in more precise terms of the real options valuation with the given six levers. Hence, real option valuation offers greater comprehensiveness as it captures the NPV and the value of flexibility—the expected value of the changes in NPV over the lifetime of the option [4]. Further, it recognizes the value of learning which is crucial in strategic decisions that are rarely one-time events, particularly in capital-intensive energy transition projects.
The dynamic nature of ROA resulted in applications in various investment projects. The ROA has already been applied in a variety of business and finance contexts such as Ewald and Taub [19], Huang et al. [20], Ioulianou et al. [21], and Yeo and Lee [22]. This model has also been applied to investment decisions in different sectors including energy [23,24,25], agriculture and forestry [26,27,28], transport [29,30], and other climate mitigation and adaptation technologies [16,31,32,33]. In this paper, the ROA is applied to the decision to postpone or invest immediately in energy transition technologies considering the uncertainty in oil prices brought by the international conflicts.

2.2. Real Options Valuation of Energy Transition

This study takes the perspective of a policymaker or project planner that is planning to invest in an energy transition project, particularly renewable energy, against the threat of oil price instability due to an international conflict. The project is subjected to budget constraints and therefore the planner has the option to invest now or postpone the project to a later period.
For the first option, the net present value NPV of the project depends on the overnight cost and the present value of the future cash flows, V E T , t , minus the investment cost, I , as shown in Equation (4).
N P V = V E T , t I
Assuming that, currently, electricity is generated from fossil fuels, then I is the cost of investment in renewable energy infrastructure. The present value of future cash flows is the summation of the savings from shifting energy generation from fossils to renewables as shown in Equation (5).
V t = 0 T ρ t [ P E Q E ( O M R E , t O M F , t ) ]
where ρ = 1 ( 1 + r ) is the discount factor, t is the project valuation period, T is the lifetime of the project, P E is the price of electricity, Q E amount of electricity generated, while O M R E and O M F operations and maintenance cost of generating electricity from renewable energy, R E , and fossil fuels, F . Since O M R E is fuel-free, then it has no variable cost, but only the fixed cost of generating RE. On the other hand, the O M F , t is based on fixed costs F C F , and the variable cost equal to the amount of fossil fuel Q F , needed to produce Q E and the price of fossil fuel P F , t as described in Equation (6).
O M F , t = P F , t Q F + F C F
Applying previous studies [4,34], this research assumes that the price of fuel is stochastic following a Geometric Brownian motion (GBM) as shown in Equation (7).
d P F , t = μ F P F , t d t + σ F P F , t d W t
where μ F and σ F are the percentage drift and volatility of fossil fuel prices and W t is a Wiener process equal to ε d t such that ε ~ N ( 0 , 1 ) . A GBM is a continuous-time stochastic process, in which the logarithm of the randomly varying quantity follows the Wiener process or Brownian motion with a drift [34]. Using Ito’s formula, this can be solved to estimate the future prices of fossil fuels as shown in Equation (8).
P F , t + 1 = P F , t e x p [ ( μ F 1 2 σ F 2 ) Δ t + σ F Δ t ε t ]
We now consider extreme events that affect fluctuations in fossil fuel prices. These fluctuations can be represented by a jump process, a type of stochastic process that has discrete movements, called jumps, with random arrival times, rather than continuous movement, typically modeled as a simple or compound Poisson process [35]. A Poisson Process is a model for a series of discrete events where the average time between events is known, but the exact timing of events is random and independent of the event [36].
Extending the Equation (7), fuel prices can be modeled as a Poisson Jump process [37] given by Equation (9).
d P F , t = { d P F , t = μ F P F , t d t + σ F P F , t d W t d P F , t = μ F P F , t d t + σ F P F , t d W t + ( y t 1 ) d N t w i t h o u t   P o i s s o n   e v e n t   w i t h   P o i s s o n   e v e n t
where the jump size y t is a nonnegative random variable that has a log-normal distribution and has an expected value of k , N t is a compound Poisson process with jump frequency λ equal to the mean number of jumps per unit of time. Here, it is assumed that the Wiener process W t , the Poisson process N t , and the jump size y t are independent. The future prices of fossil fuels with the Poisson jump [38,39] can be calculated using Equation (10).
P F , t + 1 = P F , t e x p [ ( μ F 1 2 σ F 2 λ k ) Δ t + σ F Δ t ε t + 1 N t l n y i ]
The stochastic prices of fuel with jumps are incorporated in the calculation of the NPV of the energy transition project. After calculation, the investment decision using the NPV rule can be represented in Figure 2. The direct pay-off from immediate investment is given by (V − I). When this pay-off is positive, the NPV rule tells us that the energy transition project is worthwhile to invest in. Otherwise, do not invest in the project.
Another option for the policymaker or project planner is to postpone the decision to a later period. This strategy has the advantage to gain more information concerning the uncertain environment and avoiding being stuck in a loss-making, irreversible energy transition project. Assuming the impacts of extreme events [40,41] on prices, we expect that the current Russia-Ukraine conflict makes the oil prices more volatile causing an increased uncertainty in the value of V. The value of this flexibility (RO) is calculated using Equation (1).
Using the ROA rule, the project planner may either postpone the energy transition project or implement the investment immediately as illustrated in Figure 2. Postponement of the project is decided when the value of waiting, as captured by the real option value RO, exceeds the value of investing immediately NPV (or V − I). Otherwise, it is better to invest immediately when there is no added value in waiting or has lesser value ( R O < V I ) as shown in Equation (11).
{ R O > V I p o s t p o n e   i n v e s t m e n t R O < V I i n v e s t   i m m e d i a t e l y
Rearranging this provides further insight into identifying the optimal timing of investment τ , in an energy transition project equal to the minimum period when V > I + R O . Equation (12) shows that the project should not only have a positive NPV but also with this value exceed the value of waiting.
τ = min { t | V > I + R O }
Using the same criterion, the value of the project must exceed the investment cost by at least the value of the option to decide to invest now. This threshold value is the minimum-acceptable value denoted as V* in Figure 2, to make a worthwhile decision to invest immediately.

2.3. Case Study

The Philippines is an archipelagic country in Southeast Asia composed of 7641 islands. It is a developing country with a gross domestic product (GDP) of USD 360 billion with a 5-year average GDP growth rate of 5.6% before the pandemic. Its economy is driven by the service sector with a 61% share followed by the industry sector with a 29% share of GDP [42]. The continuous economic development and industrialization have resulted in a consistently increasing demand for energy for various purposes including utilities, industry, and transportation [4].
The country, albeit with an ample amount of natural reserves of fossil fuels, is very dependent on imported coal (85%) and petroleum (49%) resulting in unstable energy security and sustainability [4,43]. For instance, the oil crises in the 1970s, followed by global economic recession and rising interest rates, affected the energy security of the country resulting in an abrupt rising in commodity prices and economic downturns [44]. Recently, the Russia-Ukraine war caused a global supply shock, leading to a rise in oil prices in the world market [45]. Studies show that oil price shocks affect the Philippines’ energy security as well as the depreciation of the currency, consumer price index, and inflation, and results in slower economic growth [46,47,48]. This crisis, along with the rapidly growing power demand, government support, available foreign funding, and a combination of private and government investment and technical expertise stimulated the development of geothermal resources, making the country the third-largest producer of geothermal energy after the United States and Mexico [43,49].
At present, the country’s energy generation is based on 50% coal; 11% oil, 17% natural gas, and 22% renewable energy dominated by geothermal (11%) and hydropower (8%), wind (1%), solar (1%), and biomass (1%). The country’s geographic location in the Pacific provides vast potential for renewable energy capacity from the ocean (170 GW), wind (77 GW), hydropower (10 GW), geothermal (4 GW), solar (1.5 GW), and biomass (0.5 GW) [4]. The Philippines’ National Renewable Energy Program aims to develop and optimize the use of these renewable energy resources as an essential part of the country’s low emissions development strategy to address the challenges of climate change, energy security, and access to energy [4,50].

2.4. Data and Parameter Estimation

This study applies the proposed RO model for energy transition projects using the case of the Philippines. Among the reasons for this are the following: (a) the Philippines is too dependent on imported fossil fuel products for energy generation, (b) the country’s economy is consumer-driven, hence, changes in world prices of fuels affect the prices of basic commodities in the Philippines, (c) the country has vast potential for renewable energy generation, and (d) the country’s climate targets aim to reduce its emissions by half by 2050 and be energy self-reliant by using localized renewable energy sources.
We gather the data from various sources including the Philippine Department of Energy and US National Renewable Energy Laboratory report for energy investment parameters (investment cost, operations and maintenance costs, dependable generating capacity, and average electricity generation); National Economic Development Authority for project valuation parameters (social discount rate, valuation period, risk-free interest rate), and World Bank Development Indicators (world prices of fuel) [51,52,53,54]. The summary of data used in this study is presented in Table 2.
To make a basic comparison, this research assumes that the energy transition project consists of investment in a 1 GW solar photovoltaic (PV) farm. The total investment cost for the project amounts to USD 1.2 billion. This includes solar PV system technologies, battery systems, land acquisition, construction, and installation. The construction of the farm is assumed to be finished in a year (year = 0) and the generation of electricity will start at year = 1 and will run until the effective lifetime of solar PV for 25 years. The solar farm is expected to generate an average of 1.44 TWh of electricity per year with an average operations and maintenance (OM) cost of USD 18 million per year. According to the Department of Energy, the average electricity tariff for the industry in the Philippines is 0.112 USD/kWh.
If the energy transition is not implemented, electricity generation from diesel will continue with a fixed OM cost of USD 20 million per year. The variable cost includes the stochastic fuel prices described in Equation (10), and the quantity of diesel equal to 3623 barrels per year, needed to produce 1.44 TWh of electricity per year.
For the calculation of the stochastic prices of fuel, this research uses a 10-year historical weekly time series data to estimate the future prices of diesel as shown in Figure 3. Using the Augmented Dickey-Fuller unit root test, this study confirms that diesel prices follow GBM with annualized average return μ = 1.33% and annualized volatility σ = 0.94%. These parameters are substituted in Equation (10). The impact of the Russia-Ukraine conflict on future oil prices is estimated using the Poisson Jump Process with the jump size k = 1.7%, and jump frequency λ = 1.37.
The policymaker or project planner has the option to invest immediately in the energy transition project or postpone the project for up to 10 years. The annual cash flows are discounted according to the social discount rate set by the government at 10% for public infrastructure projects. For the initial real options valuation, we first set the opportunity cost δ = 0. Then, the real options values are calculated with δ = 5%, 10%, 15%, and 20% representing the opportunity value lost by waiting to exercise the energy transition project. Finally, a sensitivity analysis is done to evaluate the changes in investment decisions with respect to the changes in all explanatory variables.

3. Results

3.1. Options Valuation Based on Oil Price Historical Data

The result of the initial project valuation for energy transition is presented in Table 3. Using the traditional valuation method, the calculated NPV for the 1 GW solar farm project is USD 231 million. Applying the NPV rule, the result implies a decision to invest in the project as the present value of expected future cash flows would cover the initial investment cost (V > I). The future cash flows consist of the annual USD 146 million electricity generation and the cost savings from energy transition with a lower fixed operational cost of USD 2 million per year and energy savings from using diesel with an average growth rate of 1.33% per year. At a 10% social discount rate, the electricity generation would recuperate the capital cost after 15 years, and the remaining years would sum up the profits of the project.
To further appreciate the opportunity the energy transition project presents under the unpredictability of future prices brought by international conflicts, it is useful to consider the investment not only based on the NPV, but also as a “real option”. The value of a real option is the value of the opportunity to delay or postpone the implementation of the project within a certain period (T − t = 10 years) to benefit from an uncertain investment environment, such as the Russia-Ukraine conflict that may result in rising oil prices.
Using the real options valuation method, this “opportunity” is valued at USD 990 million as shown in Table 3. This means that the flexibility to postpone the implementation of the project at a later stage can be valued at this amount. Since this value is an “option”, an investor or a project planner must be willing to give up this real option value (USD 990 million) in order to implement the project immediately and get an NPV of 231 million USD.
While the NPV rule implies that the project is already profitable, the ROV rule implies that delaying the energy transition would reap higher profits. Under oil prices, the early energy transition is not optimal, as a project planner will wait because fuel prices are uncertain and expected to increase over time. This highlights the advantage of using real options valuation over traditional methods, as it gives additional value to the flexibility in the implementation of a project.

3.2. Oil Price with Poisson Jump Scenario

This research considers the impacts of extreme prices (jumps) on the value of a project. In this scenario, the fuel price uncertainty is modeled as a mixture of GBM and a Poisson process also called the jump-diffusion process. The impacts of two parameters on NPV and ROV are measured. These include the jump frequency λ and the jump size k. The first one specifies how many times extreme prices or jumps happen in a given time period, and the second one determines how large the extreme price is if it occurs. The results for both NPV and ROV calculations are shown in Table 4 and Table 5.
It should be noted that at jump size (k) or jump frequency (λ) equal to zero, fuel price projections will be the same as the projections using the GBM model. Hence, the NPV and ROV at k = 0 and λ = 0, are the same values presented in Table 3. Table 4 shows the valuation result incorporating the historical λ at various k sizes in the jump-diffusion model. It can be observed that both NPV and ROV increase with jump sizes. This is because higher jumps in diesel prices incur higher savings from energy transition, hence, higher V, NPV, and ROV. Applying the NPV rule, higher jump sizes imply a better opportunity to invest in the energy transition project. However, this also results in higher flexibility value making the investment decision to wait longer than valuation without jumps.
Table 5 shows the valuation result incorporating the historical k at various λ in the jump-diffusion model. Compared to the effect of k, both NPV and ROV increase with jump frequency but with higher values. This means that with a more frequent occurrence of extreme prices, the energy transition project benefits more with higher cost savings and therefore, higher V, NPV, and ROV. A similar decision for the effect of k, as higher jump frequency implies a better opportunity to invest in the energy transition but a longer delay in the implementation of the project.

3.3. Valuation with Opportunity Cost Scenario

In the previous scenarios, we observe that a higher value of future cash flows V implies a longer postponement of the project. In this scenario, we show instances when the delay in investment would decrease the ROV and imply a better decision to invest now than wait. This value is described, using the opportunity cost of waiting to invest δ, as the percentage loss of delaying the energy transition. The results of the valuation are presented in Table 6.
First, the δ = 0 is the baseline scenario with similar results in Table 3 using the historical prices. This value is then increased to 5%, 10%, 15%, and 20% respectively. Second, it can be observed that the NPV for all values of δ is the same. This means that NPV is not affected by δ as the NPV, as a project valuation method, has no flexibility to postpone or delay the investment decision. While ROV values this flexibility, hence, it is affected by the changes in δ. Third, the value of the real option decreases with δ which means that the longer the delay in energy transition, the higher the opportunity lost in producing a cleaner source of energy.
Fourth, it can be noticed that in some values of δ, the ROV is less than the NPV, which indicates an optimal decision to invest immediately using the ROV rule. Higher NPV than ROV implies that the value of waiting is not commensurate to the value of the immediate implementation of the energy transition project. Lastly, we can identify the threshold value of δ such that ROV = NPV. At δ = 7.65%, the optimal decision is to invest immediately as delaying the energy transition incurs opportunity losses.

3.4. Sensitivity Analysis

A sensitivity analysis is done to analyze the influence of various explanatory variables on both NPV and ROV. As presented in Table 7, these variables include the prices of electricity and fuel, quantity of electricity generation, fixed and OM costs, price parameters, investment parameters, and other real option parameters.
In general, it can be observed in Table 7 that the NPV is more sensitive to several explanatory variables. For instance, a 1% increase in electricity prices increases the NPV by 6.08% while only 1.42% to ROV. A percent change in diesel prices increases the NPV by 6.11% while 1.43% to ROV. These results imply that ROV is a more robust valuation method compared to NPV.
In some cases, NPV is equal to zero. This means that the NPV is not affected by the changes in volatility in fuel prices, risk-free interest rate, option valuation period, and opportunity cost. These variables are the parameters in the real options valuation in the Black-Scholes model in Equation (1) which account for the flexibility in postponing the implementation of the energy transition. Since NPV is a rigid valuation method, any changes in these variables would not affect the value and investment decision using NPV.
Finally, we can see that the variables have different effects on NPV and ROV with respect to sign. Sensitivity with positive values implies the percentage increase with respect to a percent change in the explanatory variables. On the other hand, negative values imply the percentage decrease in NPV and ROV with respect to a percent change in the explanatory variables. For instance, lower investment cost for energy transition results in higher NPV and ROV. Another, when the fixed OM cost of solar increases, cost-saving from energy transition decreases, as well as future cash flows and consequently, NPV and ROV.

4. Discussion

The results in the analysis of the impacts of international conflicts on energy transition provide various points of discussion. The first part describes renewables as an energy transition strategy. The next point discusses the valuation result for NPV and ROV calculations. Then, the levers influencing NPV and ROV are presented. The last part highlights the impacts of an international conflict such as the Russia-Ukraine war on investment decisions in energy transition projects.
First, this study focused on investment in renewables as an energy transition strategy. The energy transition is the transition towards environmentally and economically sustainable energy technologies which help the world mitigate climate change [55]. These technologies include renewables, energy storage, electrified transportation, energy-efficient built environment, hydrogen, nuclear, sustainable materials, and carbon capture and storage [16]. From a developing country’s perspective, one of the major decarbonization strategies is the transition from fossil-based to a more sustainable energy generation using renewable sources. However, compared with industrialized countries, developing countries are challenged by competitive prices of fossil fuels, lack of financing mechanisms and policy framework, economic development, and skepticism on the reliability of renewables [4,56,57]. It is therefore important to analyze how various factors affect decisions and accelerate investments in energy transition projects.
Second, from the traditional valuation method, the NPV results in all scenarios analyzed are positive. This means that the energy transition project on renewables is feasible in the selected case country. This confirms the findings from previous studies [58,59,60,61] that investment in solar PV is a viable option for the energy transition. On the contrary, some cases [62,63] found negative NPV for utility-scale and lower generation capacity solar PV. For instance, Assereto and Byrne [62] found that without policy support, investing in utility-scale solar PV might only be profitable under the best-case scenario, when technology costs are low. Sheha et al. [63] found that two out of ten studied were promising cases, one with a solar photovoltaic plant size of 200 MW and the other with 300 MW, while lower solar penetration had negative NPVs. Meanwhile, this research considers a large-scale deployment of solar PV at a 1 GW generating capacity. The positive NPV result can be explained by the advantage of economies of scale, in which the huge investment and other costs are distributed with a large-scale deployment of solar panels installed, and at the same time increases the cost-saving value from energy transition [60].
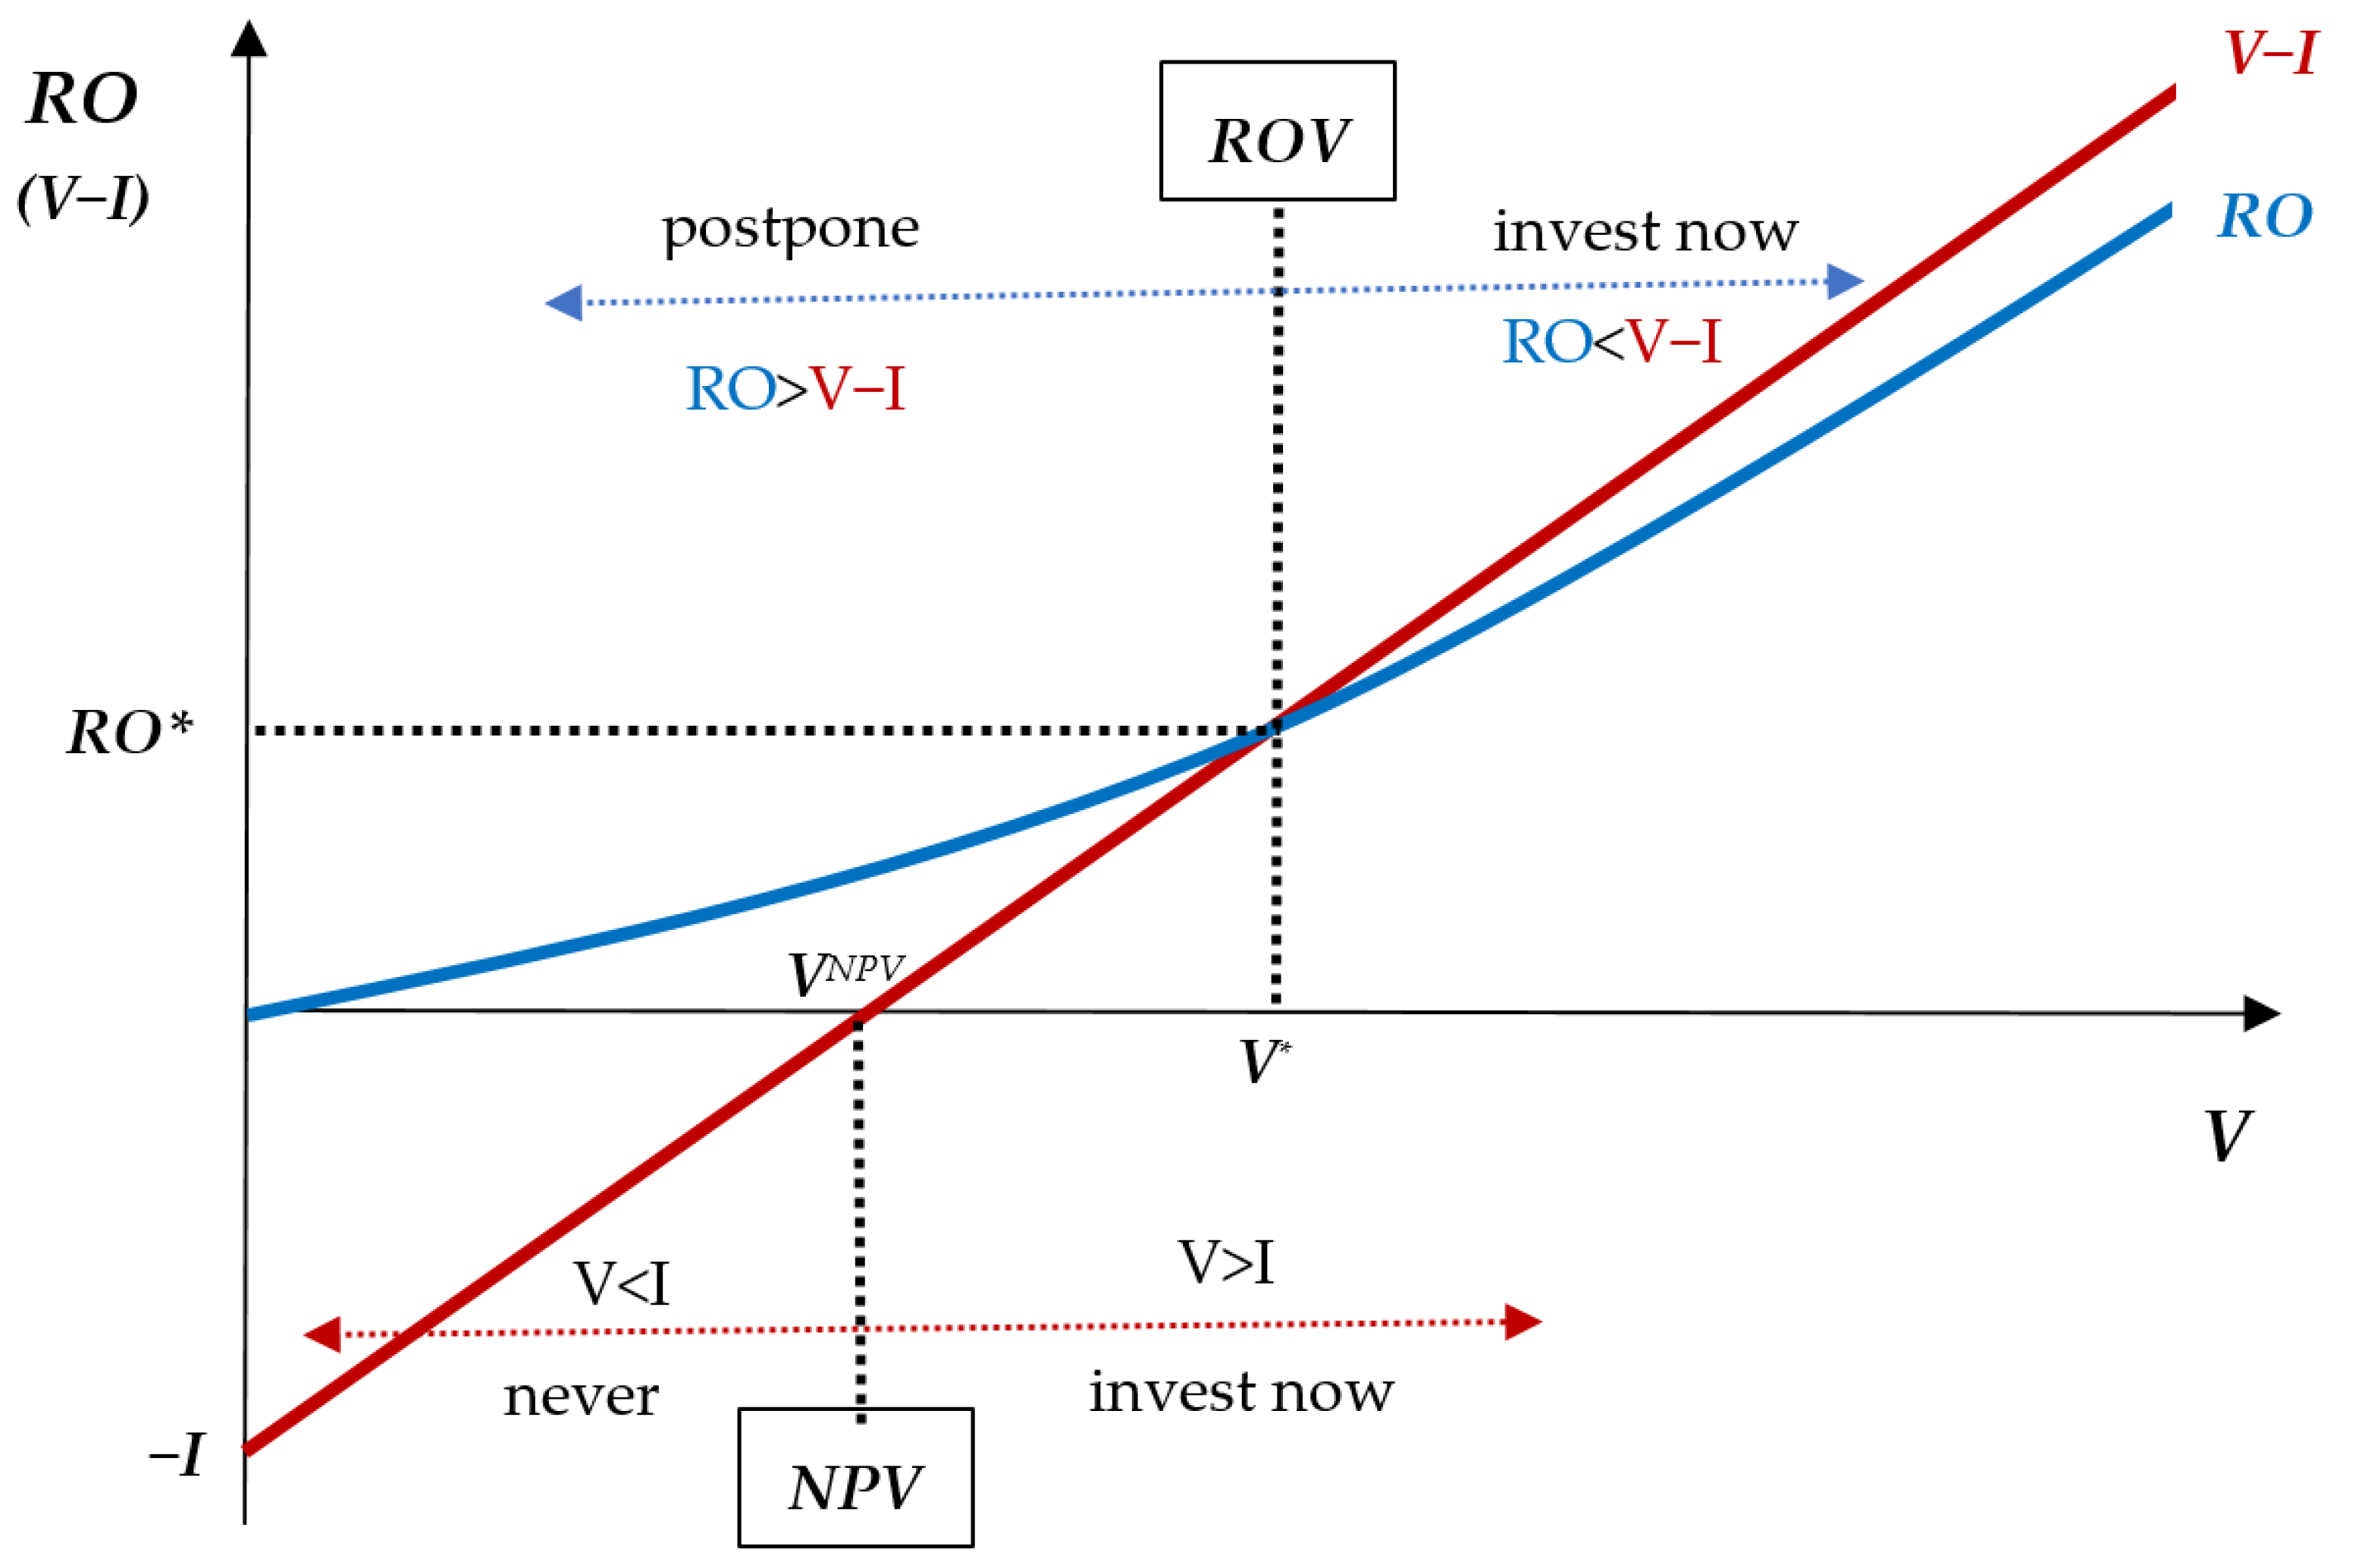
Applying the real options approach, this study finds higher real option values than NPV which imply a better decision to postpone the energy transition to more favorable investment conditions. This result supports previous findings [62,64,65], which found values in delaying investments in utility-scale and residential solar PV. Investment in the energy transition is largely impacted by the uncertainties in costs and revenues, hence, the timing is relevant to consider when making investment decisions in huge projects, which require high initial capital [64]. To maximize this flexibility value, an investor or project planner must respond to the six levers influencing the value of real options as shown in Figure 4.
The real options framework in this study identifies six drivers: the levers that influence NPV such as the investment cost (I) and the present value of expected cash flows (V); and the non-NPV levers such as the validity period of the option (T − t), risk-free interest rate (r), uncertainty in future cash flows (σ), and the opportunity cost of delaying investment (δ).
As shown in Figure 4 and Sensitivity Analysis in Table 7, the V and I affect both NPV and ROV in the opposite directions. For example, a reduction in the investment cost increases both the NPV as well as ROV, therefore, this lever does not lead to an earlier investment. Currently, the cost of solar PV is continuously declining due to technological innovations, competitive prices of solar PV and battery storage, and the learning effect [66,67]. With this trend, a firm has to wait longer to invest to the point when technology costs are low enough to make the investment more profitable [62].
Another NPV lever is the V which consists of costs and revenues from energy generation. According to the model in Equation (5), direct revenue is coming from the energy sales (electricity tariff and quantity of electricity generation) while the indirect revenue is the cost savings from the transition to renewable energy. Increasing the electricity generation from solar is less likely as this will incur higher investment costs. Moreover, increasing the tariff for solar PV, obviously, increases the value of both NPV and ROV. Since the NPV is more than four times more sensitive than ROV (see Table 7), there would be a threshold of electricity price when investing immediately is a better option than waiting (ROV < NPV). This is confirmed in previous studies where increasing electricity tariffs results in earlier investment in energy transition projects [60,62].
The four non-NPV levers have different effects on ROV. Note that these levers have no impact on NPV with its inflexible (now or never) decision rule. The period of holding the option, risk-free interest rate, and uncertainty have positive impacts on ROV. For instance, greater uncertainty in fuel prices raises the value of an option by increasing the value of flexibility. With the current Russia-Ukraine conflict, the uncertainty in oil prices may increase with Russia being one of the major players in the global oil market. As a consequence, a project planner tends to increase the uncertainty of expected returns in energy transition and then implement the project or back out, depending on changes in investment conditions. On the contrary, higher uncertainty increases the value of the real option, hence, prolonging the decision to implement the investment [68,69,70].
Similarly, extending the opportunity’s duration (T − t) raises the real option’s value because it increases the total uncertainty of the project. Moreover, any expected increase in the interest rate raises the value of the real option because it reduces the present value of the exercise price [4]. Among the four non-NPV levers, the opportunity cost δ seems to stand out with higher sensitivity. The δ can be described as the cost incurred to preserve the option or the opportunity lost from waiting to implement a project. When this value is increased, the present value of expected cash flows will decrease, and eventually the real option value. Hence, an investor in the energy transition will consider this opportunity cost and make a decision to invest earlier as postponement will incur losses [60].
Lastly, this study found the impacts of international conflicts on increasing both the NPV and ROV. The result for NPV is quite obvious as conflicts, such as the Russia-Ukraine war, may result in extreme oil prices. Along with the rise in crude oil consumption, the occurrence of geopolitical and economic events including war in oil-producing countries, terrorist attacks, etc., drives the risk of high crude oil prices [71,72], which are described as jumps in this study. Additionally, the Poisson jumps in energy transition may result from the possible discovery of new material, a significant improvement in the production process, a change in PV technology, or the installation of a nearby PV panel manufacturing facility [73]. With extreme oil prices or jumps, energy transition technologies become more competitive, hence, accelerating the investment in the transition. On the contrary, higher oil prices also increase the present value of future savings from the transition, resulting in higher real option values. Therefore, international conflicts further delay the investment in energy transition, using the real options rule, as the value of flexibility to postpone the project also increases. This confirms a previous study that geopolitical shocks have negative effects on energy transition, particularly in energy production from renewable energy sources [9]. Additionally, considering both regular random fluctuations and occurrences of major shocks in real options valuation suggests a postponement of the decision in the energy transition project but not abandonment [74]. Given the market uncertainty brought by international conflict, a decision-maker could gain a significant advantage from waiting to decide on energy transition later with better (though never complete) information.

5. Conclusions

This research examined how various factors accelerate the energy transition towards achieving the global climate targets. While this topic has been extensively discussed in previous studies, this paper contributes to the literature by (a) analyzing the impacts of an international conflict, such as the Russia-Ukraine war, on the timing of energy transition, (b) describing the occurrence of extreme prices by combining geometric Brownian motion model with Poisson jumps, and (c) exploring the effects of various real option levers on the timing and value of energy transition from the perspective of a developing country. Using the real options approach with the Black-Scholes-Merton model, this study analyzed the value of flexibility and the optimal timing to invest in the energy transition.
Applying the proposed model using the case of the Philippines, the results found that energy transition is a viable investment with positive NPV, considering the cost savings of the transition from fossil-based to renewable energy sources. The value of the flexibility (ROV) to postpone the investment is higher than the value of investing immediately (NPV), hence, the implementation of energy transition could be delayed. In terms of the NPV and ROV levers, lower investment cost and greater values of future cash flows, risk-free interest rate, period of holding the option, and the volatility of cash flows increase the value of the project, however, prolonging the timing of investment. Considering the opportunity cost of waiting, lowers the option value, hence accelerating the implementation of the energy transition. Meanwhile, the Russia-Ukraine war, which may result in extreme oil prices, increases both the NPV and ROV, hence further delaying the energy transition.
To accelerate the energy transition, particularly in developing countries, the findings in this study provide several policy implications based on the presented real option levers. First is the policy aimed at reducing the impacts of various market, geopolitical, and economic shocks. Second, the value of free operating cash flows from energy transition may be increased by increasing electricity tariffs and subsidizing the deployment of renewable energy technologies while decreasing the tariffs and de-subsidizing energy generation from fossil fuels. Finally, the government must also provide a better investment environment and financing schemes for energy transition projects. The government must encourage the development of more sustainable sources of energy and allow free-market competition to further decrease the investment cost in the energy transition by technology learning.
The main limitations of this study include the simplification of the project valuation using the Black-Scholes model, the availability of actual data on the effect of the Russia-Ukraine war on oil prices as described using geometric Brownian motion with Poisson jumps, and limiting the scope to an oil-importing developing country. Future studies may consider more complicated real options models such as Monte Carlo simulations, lattices, and dynamic programming to capture the complications of the extreme oil prices with other uncertainties. It would also be interesting to apply the model to oil-rich countries that are in the energy transition towards more environment-friendly and sustainable economies.

Funding

This research received no external funding.

Institutional Review Board Statement

Not applicable.

Informed Consent Statement

Not applicable.

Data Availability Statement

Not applicable.

Conflicts of Interest

The author declares no conflict of interest.

References

  1. Thomas, M.; DeCillia, B.; Santos, J.B.; Thorlakson, L. Great expectations: Public opinion about energy transition. Energy Policy 2022, 162, 112777. [Google Scholar] [CrossRef]
  2. UNEP. Emissions Gap Report: The Heat Is On—A World of Climate Promises Not Yet Delivered; United Nations Environment Programme: Nairobi, Kenya, 2021. [Google Scholar]
  3. Papadis, E.; Tsatsaronis, G. Challenges in the decarbonization of the energy sector. Energy 2020, 205, 118025. [Google Scholar] [CrossRef]
  4. Agaton, C.B. A Real Options Approach to Renewable and Nuclear Energy Investments in the Philippines; Logos Verlag Berlin GmbH: Berlin, Germany, 2019; Volume 71. [Google Scholar]
  5. Tian, J.; Yu, L.; Xue, R.; Zhuang, S.; Shan, Y. Global low-carbon energy transition in the post-COVID-19 era. Appl. Energy 2022, 307, 118205. [Google Scholar] [CrossRef] [PubMed]
  6. Jiang, P.; Fan, Y.V.; Klemeš, J.J. Impacts of COVID-19 on energy demand and consumption: Challenges, lessons and emerging opportunities. Appl. Energy 2021, 285, 116441. [Google Scholar] [CrossRef]
  7. van den Bergh, J.C. Economic-financial crisis and sustainability transition: Introduction to the special issue. Environ. Innov. Soc. Transit. 2013, 6, 1–8. [Google Scholar] [CrossRef]
  8. Fischhendler, I.; Herman, L.; David, L. Light at the End of the Panel: The Gaza Strip and the Interplay Between Geopolitical Conflict and Renewable Energy Transition. New Political Econ. 2021, 27, 1–18. [Google Scholar] [CrossRef]
  9. Flouros, F.; Pistikou, V.; Plakandaras, V. Geopolitical Risk as a Determinant of Renewable Energy Investments. Energies 2022, 15, 1498. [Google Scholar] [CrossRef]
  10. Liadze, I.; Macchiarelli, C.; Mortimer-Lee, P.; Juanino, P.S. The Economic Costs of the Russia-Ukraine Conflict. Natl. Inst. Econ. Soc. Res. NIESR Policy Pap. 2022, 6, 35–45. [Google Scholar]
  11. Alqahtani, A.; Klein, T. Oil price changes, uncertainty, and geopolitical risks: On the resilience of GCC countries to global tensions. Energy 2021, 236, 121541. [Google Scholar] [CrossRef]
  12. Selmi, R.; Bouoiyour, J.; Miftah, A. Oil price jumps and the uncertainty of oil supplies in a geopolitical perspective: The role of OPEC’s spare capacity. Int. Econ. 2020, 164, 18–35. [Google Scholar] [CrossRef]
  13. Cunado, J.; Perez de Gracia, F. Oil prices, economic activity and inflation: Evidence for some Asian countries. Q. Rev. Econ. Financ. 2005, 45, 65–83. [Google Scholar] [CrossRef] [Green Version]
  14. Murshed, M.; Tanha, M.M. Oil price shocks and renewable energy transition: Empirical evidence from net oil-importing South Asian economies. Energy Ecol. Environ. 2020, 6, 183–203. [Google Scholar] [CrossRef] [PubMed]
  15. Myers, S.C. Determinants of corporate borrowing. J. Financ. Econ. 1977, 5, 147–175. [Google Scholar] [CrossRef] [Green Version]
  16. Agaton, C.B. Application of real options in carbon capture and storage literature: Valuation techniques and research hotspots. Sci. Total Environ. 2021, 795, 148683. [Google Scholar] [CrossRef]
  17. Black, F.; Scholes, M. The Pricing of Options and Corporate Liabilities. J. Political Econ. 1973, 81, 637–654. [Google Scholar] [CrossRef] [Green Version]
  18. Merton, R.C. Theory of rational option pricing. In Theory of Valuation; RAND Corporation: Santa Monica, CA, USA, 2005; pp. 229–288. [Google Scholar]
  19. Ewald, C.O.; Taub, B. Real options, risk aversion and markets: A corporate finance perspective. J. Corp. Financ. 2022, 72, 102164. [Google Scholar] [CrossRef]
  20. Huang, Y.S.; Wu, J.; Guo, F. Venture capital staging under economic policy uncertainty. Int. Rev. Econ. Financ. 2022, 78, 572–596. [Google Scholar] [CrossRef]
  21. Ioulianou, S.P.; Leiblein, M.J.; Trigeorgis, L. Multinationality, portfolio diversification, and asymmetric MNE performance: The moderating role of real options awareness. J. Int. Bus. Stud. 2020, 52, 388–408. [Google Scholar] [CrossRef]
  22. Yeo, Y.D.; Lee, S.-H. Real options flexibility or risk diversification: Risk management of US MNEs when facing risk of war. Multinatl. Bus. Rev. 2020, 29, 476–500. [Google Scholar] [CrossRef]
  23. Li, L.; Cao, X. Comprehensive effectiveness assessment of energy storage incentive mechanisms for PV-ESS projects based on compound real options. Energy 2022, 239, 121902. [Google Scholar] [CrossRef]
  24. Das Gupta, S. Using real options to value capacity additions and investment expenditures in renewable energies in India. Energy Policy 2021, 148, 111916. [Google Scholar] [CrossRef]
  25. Azari Marhabi, A.; Arasteh, A.; Paydar, M.M. Sustainable energy development under uncertainty based on the real options theory approach. Int. J. Environ. Sci. Technol. 2021, 19, 1–14. [Google Scholar] [CrossRef]
  26. Martins, J.C.; da Silva, R.B.G.; Munis, R.A.; Simões, D. Investments in Pinus elliottii Engelm. Plantations: Real Options Analysis in Discrete Time. Forests 2022, 13, 111. [Google Scholar] [CrossRef]
  27. Agaton, C.B.; Collera, A.A. Now or later? Optimal timing of mangrove rehabilitation under climate change uncertainty. For. Ecol. Manag. 2022, 503, 119739. [Google Scholar] [CrossRef]
  28. Zambujal-Oliveira, J.; Mouta-Lopes, M.; Bangueses, R. Real options appraisal of forestry investments under information scarcity in biomass markets. Resour. Policy 2021, 74, 101735. [Google Scholar] [CrossRef]
  29. Elvarsson, A.B.; Martani, C.; Adey, B.T. Considering automated vehicle deployment uncertainty in the design of optimal parking garages using real options. J. Build. Eng. 2021, 34, 101703. [Google Scholar] [CrossRef]
  30. Abdulla, B.; Sousa, R.; Galadari, A. Location and Development of Light Rail Stations under Demand Uncertainty: A Real Options Based Framework. In International Conference on Transportation and Development 2020; American Society of Civil Engineers: Reston, VA, USA, 2020; pp. 151–160. [Google Scholar]
  31. Zhang, W.; Dai, C.; Luo, X.; Ou, X. Policy incentives in carbon capture utilization and storage (CCUS) investment based on real options analysis. Clean Technol. Environ. Policy 2021, 23, 1311–1326. [Google Scholar] [CrossRef]
  32. Coppens, T.; Van Acker, M.; Machiels, T.; Compernolle, T. A real options framework for adaptive urban design. J. Urban Des. 2021, 26, 681–698. [Google Scholar] [CrossRef]
  33. Deeney, P.; Cummins, M.; Heintz, K.; Pryce, M.T. A real options based decision support tool for R&D investment: Application to CO2 recycling technology. Eur. J. Oper. Res. 2021, 289, 696–711. [Google Scholar]
  34. Dos Santos, R.M.; Szklo, A.; Lucena, A.; Poggio, M. Evaluating strategies for monetizing natural gas liquids from processing plants—Liquid fuels versus petrochemicals. J. Nat. Gas Sci. Eng. 2022, 99, 104413. [Google Scholar] [CrossRef]
  35. Wu, X.; Hu, Z. Investment timing and capacity choice in duopolistic competition under a jump-diffusion model. Math. Financ. Econ. 2021, 16, 125–152. [Google Scholar] [CrossRef]
  36. Volk-Makarewicz, W.; Borovkova, S.; Heidergott, B. Assessing the impact of jumps in an option pricing model: A gradient estimation approach. Eur. J. Oper. Res. 2022, 298, 740–751. [Google Scholar] [CrossRef]
  37. Merton, R.C. Option pricing when underlying stock returns are discontinuous. J. Financ. Econ. 1976, 3, 125–144. [Google Scholar] [CrossRef] [Green Version]
  38. Ibe, O.C. Levy Processes. In Markov Processes for Stochastic Modeling; Newnes: London, UK, 2013; pp. 329–347. [Google Scholar]
  39. Batac, K.I.T.; Collera, A.A.; Villanueva, R.O.; Agaton, C.B. Decision support for investments in sustainable energy sources under uncertainties. Int. J. Renew. Energy Dev. 2022, 11, 801–814. [Google Scholar] [CrossRef]
  40. Zhang, X.; Yu, L.; Wang, S.; Lai, K.K. Estimating the impact of extreme events on crude oil price: An EMD-based event analysis method. Energy Econ. 2009, 31, 768–778. [Google Scholar] [CrossRef]
  41. Wen, J.; Zhao, X.-X.; Chang, C.-P. The impact of extreme events on energy price risk. Energy Econ. 2021, 99, 105308. [Google Scholar] [CrossRef]
  42. Cueto, L.J.; Frisnedi, A.F.D.; Collera, R.B.; Batac, K.I.T.; Agaton, C.B. Digital Innovations in MSMEs during Economic Disruptions: Experiences and Challenges of Young Entrepreneurs. Adm. Sci. 2022, 12, 8. [Google Scholar] [CrossRef]
  43. Agaton, C.B.; Batac, K.I.T.; Reyes Jr, E.M. Prospects and challenges for green hydrogen production and utilization in the Philippines. Int. J. Hydrog. Energy 2022, 47, 17859–17870. [Google Scholar] [CrossRef]
  44. Manning, R.A. The Philippines in Crisis. Foreign Aff. 1984, 63, 392–410. [Google Scholar] [CrossRef]
  45. Adekoya, O.B.; Oliyide, J.A.; Yaya, O.S.; Al-Faryan, M.A.S. Does oil connect differently with prominent assets during war? Analysis of intra-day data during the Russia-Ukraine saga. Resour. Policy 2022, 77, 102728. [Google Scholar] [CrossRef]
  46. Wang, Y.; Geng, X.; Guo, K. The influence of international oil price fluctuation on the exchange rate of countries along the “Belt and Road”. N. Am. J. Econ. Financ. 2022, 59, 101588. [Google Scholar] [CrossRef]
  47. Razmi, F.; Azali, M.; Chin, L.; Shah Habibullah, M. The role of monetary transmission channels in transmitting oil price shocks to prices in ASEAN-4 countries during pre- and post-global financial crisis. Energy 2016, 101, 581–591. [Google Scholar] [CrossRef]
  48. Thorbecke, W. How oil prices affect East and Southeast Asian economies: Evidence from financial markets and implications for energy security. Energy Policy 2019, 128, 628–638. [Google Scholar] [CrossRef]
  49. Sussman, D.; Javellana, S.P.; Benavidez, P.J. Geothermal energy development in the Philippines: An overview. Geothermics 1993, 22, 353–367. [Google Scholar] [CrossRef]
  50. Agaton, C.B. Real Options Analysis of Renewable Energy Investment Scenarios in the Philippines. Renew. Energy Sustain. Dev. 2017, 3, 284–292. [Google Scholar] [CrossRef] [Green Version]
  51. DOE. Philippine Power Statistics. 2020. Available online: https://www.doe.gov.ph/sites/default/files/pdf/electric_power/2020_power_statistic_01_summary.pdf (accessed on 25 February 2022).
  52. WB-WDI. World Development Indicators. Available online: https://databank.worldbank.org/source/world-development-indicators (accessed on 24 February 2022).
  53. NEDA. Revisions on Investment Coordination Committee (ICC) Guidelines and Procedures. Available online: https://neda.gov.ph/wp-content/uploads/2017/01/Revisions-on-ICC-Guidelines-and-Procedures-Updated-Social-Discount-Rate-for-the-Philippines.pdf (accessed on 25 February 2022).
  54. Lee, N.; Dyreson, A.; Hurlbut, D.; McCan, M.I.; Neri, E.V.; Reyes, N.C.R.; Capongcol, M.C.; Cubangbang, H.M.; Agustin, B.P.Q.; Bagsik, J.; et al. Ready for Renewables: Grid Planning and Competitive Renewable Energy Zones (CREZ) in the Philippines. Available online: https://www.nrel.gov/docs/fy20osti/76235.pdf (accessed on 17 April 2022).
  55. Gürsan, C.; de Gooyert, V. The systemic impact of a transition fuel: Does natural gas help or hinder the energy transition? Renew. Sustain. Energy Rev. 2021, 138, 110552. [Google Scholar] [CrossRef]
  56. Sahoo, M.; Sethi, N. The intermittent effects of renewable energy on ecological footprint: Evidence from developing countries. Environ. Sci. Pollut. Res. 2021, 28, 56401–56417. [Google Scholar] [CrossRef]
  57. Shahbaz, M.; Topcu, B.A.; Sarıgül, S.S.; Vo, X.V. The effect of financial development on renewable energy demand: The case of developing countries. Renew. Energy 2021, 178, 1370–1380. [Google Scholar] [CrossRef]
  58. Awan, A.B.; Zubair, M.; Memon, Z.A.; Ghalleb, N.; Tlili, I. Comparative analysis of dish Stirling engine and photovoltaic technologies: Energy and economic perspective. Sustain. Energy Technol. Assess. 2021, 44, 101028. [Google Scholar] [CrossRef]
  59. Bai, B.; Wang, Y.; Fang, C.; Xiong, S.; Ma, X. Efficient deployment of solar photovoltaic stations in China: An economic and environmental perspective. Energy 2021, 221, 119834. [Google Scholar] [CrossRef]
  60. Guno, C.S.; Agaton, C.B.; Villanueva, R.O.; Villanueva, R.O. Optimal Investment Strategy for Solar PV Integration in Residential Buildings: A Case Study in The Philippines. Int. J. Renew. Energy Dev. 2021, 10, 79–89. [Google Scholar] [CrossRef]
  61. Guno, C.S.; Agaton, C.B. Socio-Economic and Environmental Analyses of Solar Irrigation Systems for Sustainable Agricultural Production. Sustainability 2022, 14, 6834. [Google Scholar] [CrossRef]
  62. Assereto, M.; Byrne, J. No real option for solar in Ireland: A real option valuation of utility scale solar investment in Ireland. Renew. Sustain. Energy Rev. 2021, 143, 110892. [Google Scholar] [CrossRef]
  63. Sheha, M.; Mohammadi, K.; Powell, K. Techno-economic analysis of the impact of dynamic electricity prices on solar penetration in a smart grid environment with distributed energy storage. Appl. Energy 2021, 282, 116168. [Google Scholar] [CrossRef]
  64. Ofori, C.G.; Bokpin, G.A.; Aboagye, A.Q.Q.; Afful-Dadzie, A. A real options approach to investment timing decisions in utility-scale renewable energy in Ghana. Energy 2021, 235, 121366. [Google Scholar] [CrossRef]
  65. Vargas, C.; Chesney, M. What are you waiting to invest in grid-connected residential photovoltaics in California? A real options analysis. J. Sustain. Financ. Invest. 2021, 1–18. [Google Scholar] [CrossRef]
  66. Castrejon-Campos, O.; Aye, L.; Hui, F.K.P. Effects of learning curve models on onshore wind and solar PV cost developments in the USA. Renew. Sustain. Energy Rev. 2022, 160, 112278. [Google Scholar] [CrossRef]
  67. Ershad, A.M.; Ueckerdt, F.; Pietzcker, R.C.; Giannousakis, A.; Luderer, G. A further decline in battery storage costs can pave the way for a solar PV-dominated Indian power system. Renew. Sustain. Energy Transit. 2021, 1, 100006. [Google Scholar] [CrossRef]
  68. Qu, J.; Jeon, W. Price and subsidy under uncertainty: Real-option approach to optimal investment decisions on energy storage with solar PV. Energy Environ. 2021, 33, 263–282. [Google Scholar] [CrossRef]
  69. Zhang, M.M.; Wang, Q.; Zhou, D.; Ding, H. Evaluating uncertain investment decisions in low-carbon transition toward renewable energy. Appl. Energy 2019, 240, 1049–1060. [Google Scholar] [CrossRef]
  70. Bangjun, W.; Feng, Z.; Feng, J.; Yu, P.; Cui, L. Decision making on investments in photovoltaic power generation projects based on renewable portfolio standard: Perspective of real option. Renew. Energy 2022, 189, 1033–1045. [Google Scholar] [CrossRef]
  71. Dey, A.K.; Edwards, A.; Das, K.P. Determinants of High Crude Oil Price: A Nonstationary Extreme Value Approach. J. Stat. Theory Pract. 2019, 14, 4. [Google Scholar] [CrossRef]
  72. Li, F.; Huang, Z.; Zhong, J.; Albitar, K. Do Tense Geopolitical Factors Drive Crude Oil Prices? Energies 2020, 13, 4277. [Google Scholar] [CrossRef]
  73. Pringles, R.; Olsina, F.; Penizzotto, F. Valuation of defer and relocation options in photovoltaic generation investments by a stochastic simulation-based method. Renew. Energy 2020, 151, 846–864. [Google Scholar] [CrossRef]
  74. Penizzotto, F.; Pringles, R.; Olsina, F. Real options valuation of photovoltaic power investments in existing buildings. Renew. Sustain. Energy Rev. 2019, 114, 109308. [Google Scholar] [CrossRef]
Figure 1. Comparison of Levers in Net Present Value and Real Options Value.
Resources 11 00059 g001
Figure 2. Comparison of Investment Decisions between Real Options Value and Net Present Value. (Note: RO—real option, V—present value of cash flows, I—present value of fixed costs, NPV—net present value, ROV—real options value).
Resources 11 00059 g002
Figure 3. Historical Diesel Prices (2012–2022) and Projected Prices (2022–2032) based on Geometric Brownian Motion. (Note: curves from 2022 onwards are sample calculations).
Resources 11 00059 g003
Figure 4. Levers of Influencing the Value of Real Option.
Resources 11 00059 g004
Table 1. The Analogy between Financial and Real Options.
Financial OptionSymbolReal Option
Exercise (strike) priceIInvestment cost or money received upon launching (exercising) the action (option)
Value of underlying asset (stock) priceVPresent value of expected future cash flows
Risk-free interest raterRisk-free interest rate
Time until the option expiresT − tTime until the decision must be made
Volatility of the value of an underlying assetσUncertainty of the future cash flows
Amount of dividends paymentδValue lost by waiting to exercise
Table 2. List of Variables and Estimated Parameters for Real Options Valuation.
ParameterSymbolValueUnit
Price of ElectricityPE0.112 millionUSD/GWh
Quantity of Electricity GeneratedQE1.44TWh/year
Investment Cost (Solar Farm)I1.2 billionUSD
Operations and Maintenance (OM) Cost (Solar)OMRE18 millionUSD/year
Lifetime of Solar FarmT25Years
Fixed OM Cost (Diesel)FCF20 millionUSD/year
Quantity of Diesel to generate QEQF0.576 millionL/year
Current Price of Diesel *PF,t1.117USD/L
Annualized Return of Diesel Pricesµ1.33%
Annualized Volatility of Diesel Pricesσ20.94%
Diesel Price Jump Sizek1.37%
Diesel Price Jump Frequencyλ3.9
Social Discount Rater10%
Option Valuation Period T − t10years
Opportunity Cost δ0, 5, 10, 15, 20%
Note: * Price of Diesel is stochastic and the future prices are calculated using Equation (10).
Table 3. Net Present Value (NPV) and Real Options Value (ROV) Using Historical Prices.
ValueUnit
Net Present Value231million USD
Real Option Value990million USD
NPV Investment Decisioninvest
ROV Investment Decision Postpone investment
Note: The NPV rule is to invest (NPV > 0) or not in a project, while the ROV rule is to invest now (ROV < NPV) or postpone the investment (ROV > NPV).
Table 4. Net Present Values and Real Options Values at Different Price Jump Sizes.
Price Jump Size, k NPV (million USD)ROV (million USD)Investment Decision
0231990Postpone
1.7%2471006Postpone
5%2691028Postpone
10%3731132Postpone
Note: Net present values (NPV) and real option values (ROV) are calculated at the historical price jump frequency λ = 1.37.
Table 5. Net Present Values and Real Options Values at Different Price Jump Intensities.
Price Jump Frequency, λNPV (million USD)ROV (million USD)Investment Decision
0231990Postpone
1.372471006Postpone
52831042Postpone
10 5091268Postpone
Note: Net present values (NPV) and real option values (ROV) are calculated at the historical price jump size k = 1.7%.
Table 6. Net Present Value and Real Options Values at Various Opportunity Costs.
Opportunity Cost of Waiting to Invest, δ NPV (million USD)ROV (million USD)Investment Decision
0231990Postpone
5%231428Postpone
7.65% *231231Invest now
10%231111Invest now
15%2318.51Invest now
20%2310.097Invest now
Note: * threshold value of δ, when net present value (NPV) = real option value (ROV).
Table 7. Sensitivity of Net Present Value and Real Options Value with Respect to the Changes in Explanatory Variables.
ParameterSymbolNPVROV
Price of ElectricityPE6.08%1.42%
Quantity of Electricity GeneratedQE6.08%1.42%
Current Price of DieselPF,t6.11%1.43%
Investment Cost (Solar Farm)I−5.19%−0.45%
Operations and Maintenance (OM) Cost (Solar)OMRE−6.84%−1.60%
Fixed OM Cost (Diesel)FCF6.84%1.60%
Lifetime of Solar FarmT1.44%0.34%
Annualized Return of Diesel Pricesµ0.32%0.07%
Annualized Volatility of Diesel Pricesσ200.03%
Diesel Price Jump Sizek7.11%1.66%
Diesel Price Jump Frequencyλ7.11%1.66%
Risk-free Interest Rater00.42%
Option Valuation Period Tt00.42%
Opportunity Cos−δ0−8.88%
Publisher’s Note: MDPI stays neutral with regard to jurisdictional claims in published maps and institutional affiliations.

