
A Database for the Stocks and Flows of Sand and Gravel


Abstract
:1. Introduction
2. Background and Wider Context
2.1. Global Patterns
2.1.1. Increasing Demand for Sand
2.1.2. Global Sand Trade
2.2. Impacts
2.2.1. Social
2.2.2. Environmental
2.2.3. Political
2.3. Potential Solutions
2.3.1. Technical Solutions
2.3.2. Transition to a Circular Economy
2.3.3. Governance and Monitoring
3. Structure and Format of the Database
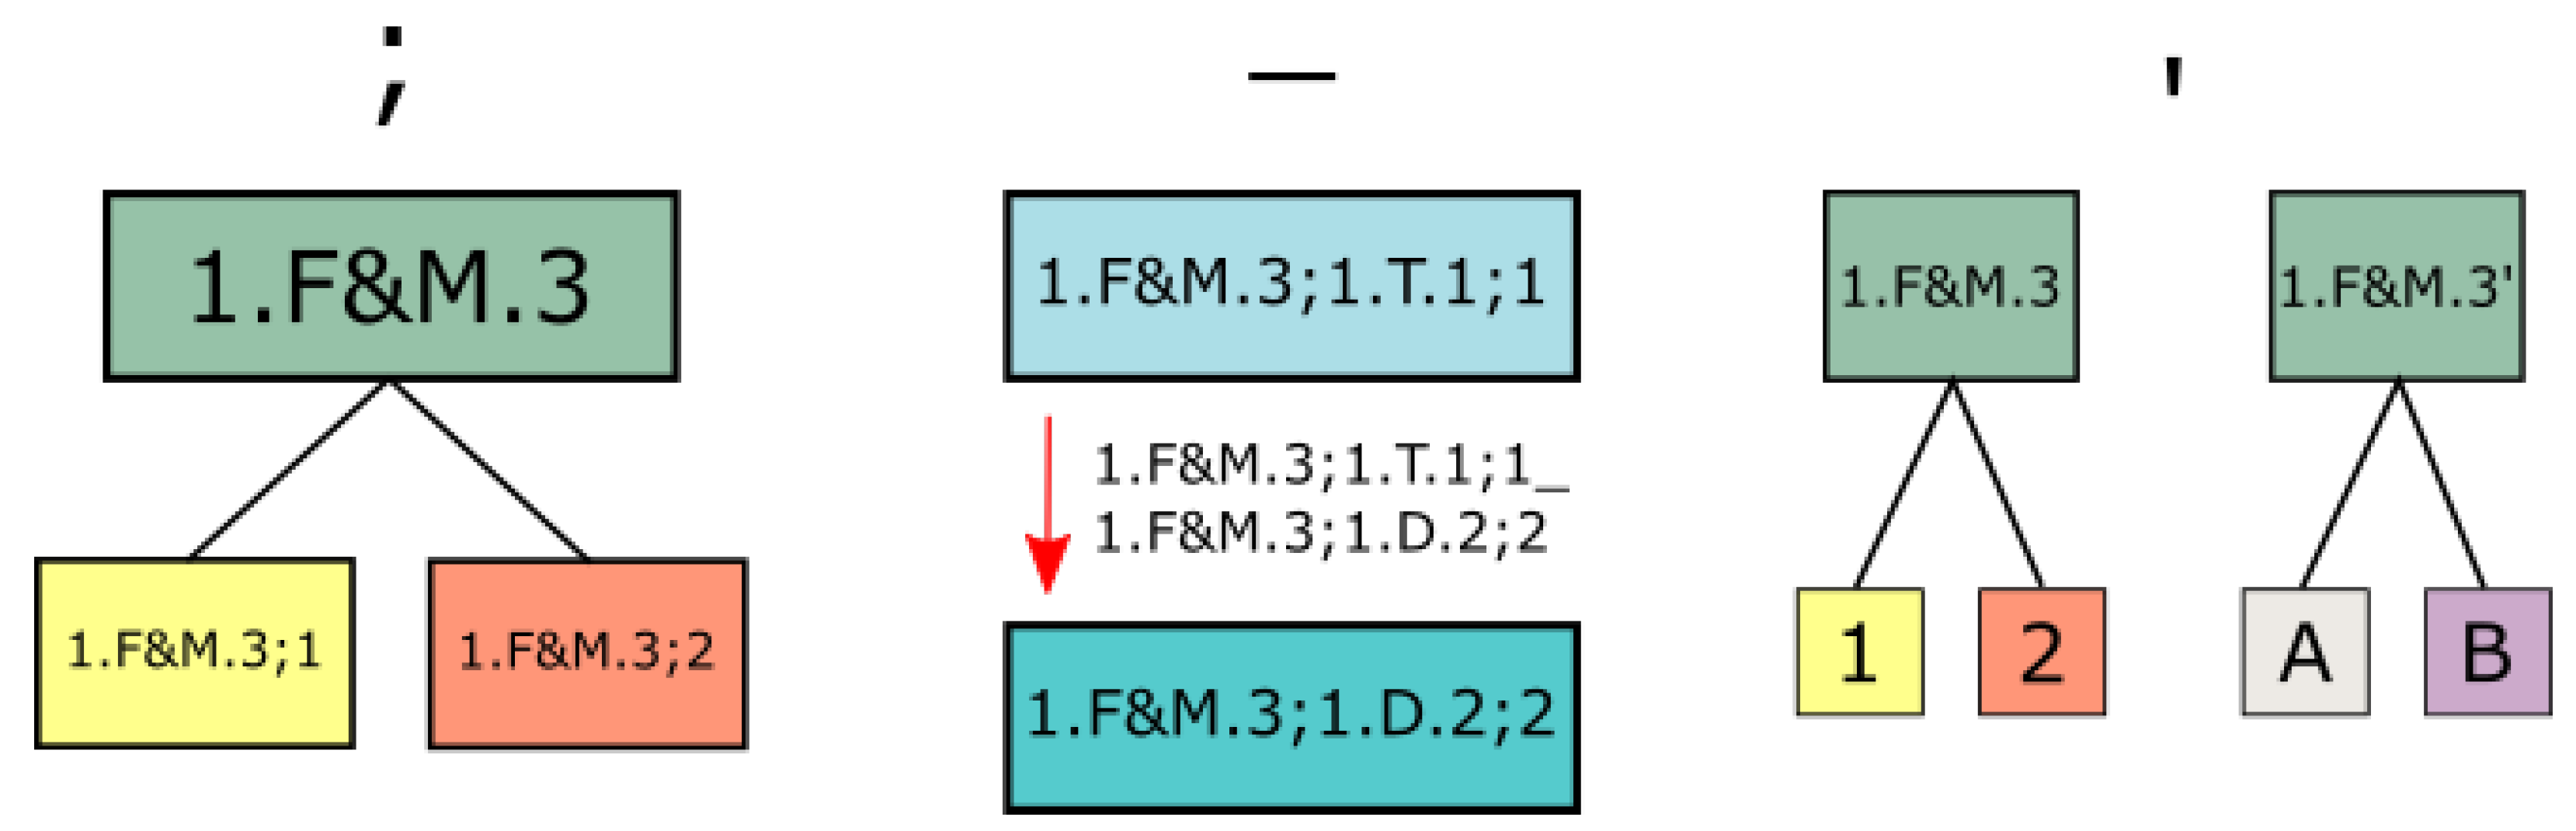
3.1. Hierarchical System
3.2. Database Format: YSTAFDB
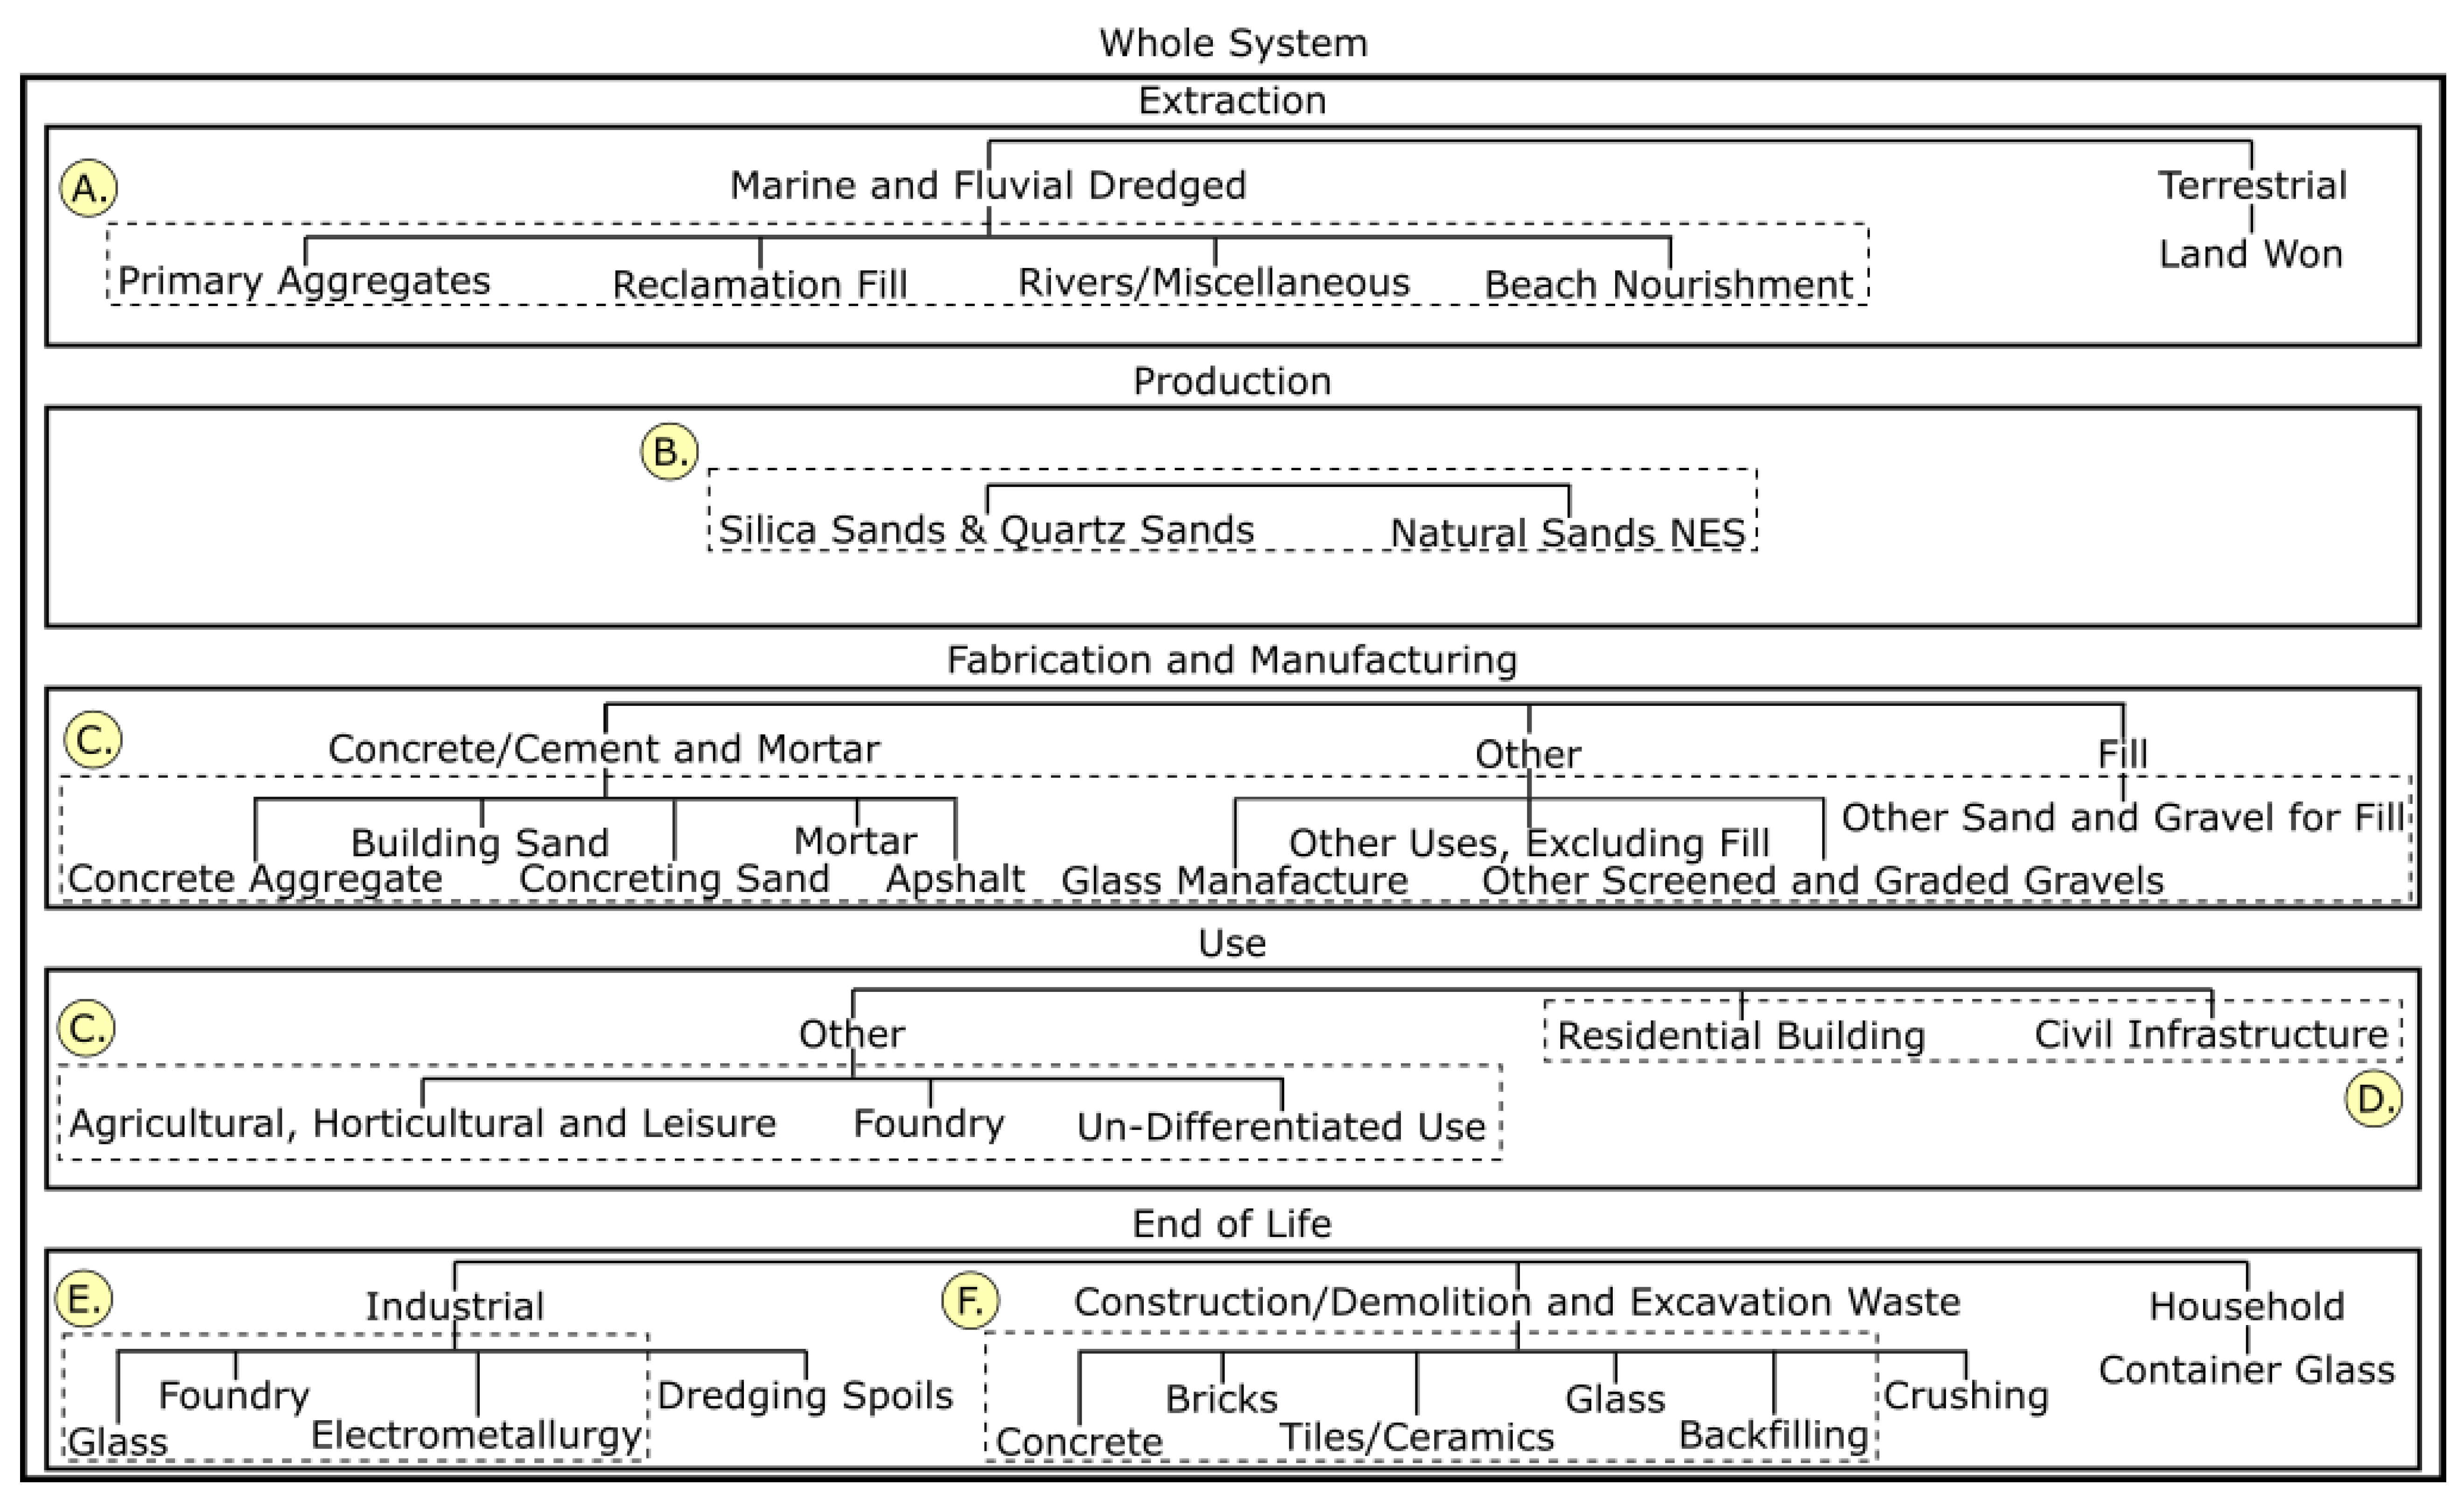
3.3. Classification System
3.3.1. Extraction
3.3.2. Production
3.3.3. Fabrication and Manufacturing
3.3.4. Use
3.3.5. End of Life
4. Populating and Using the Database: An Example for the UK
4.1. UK System
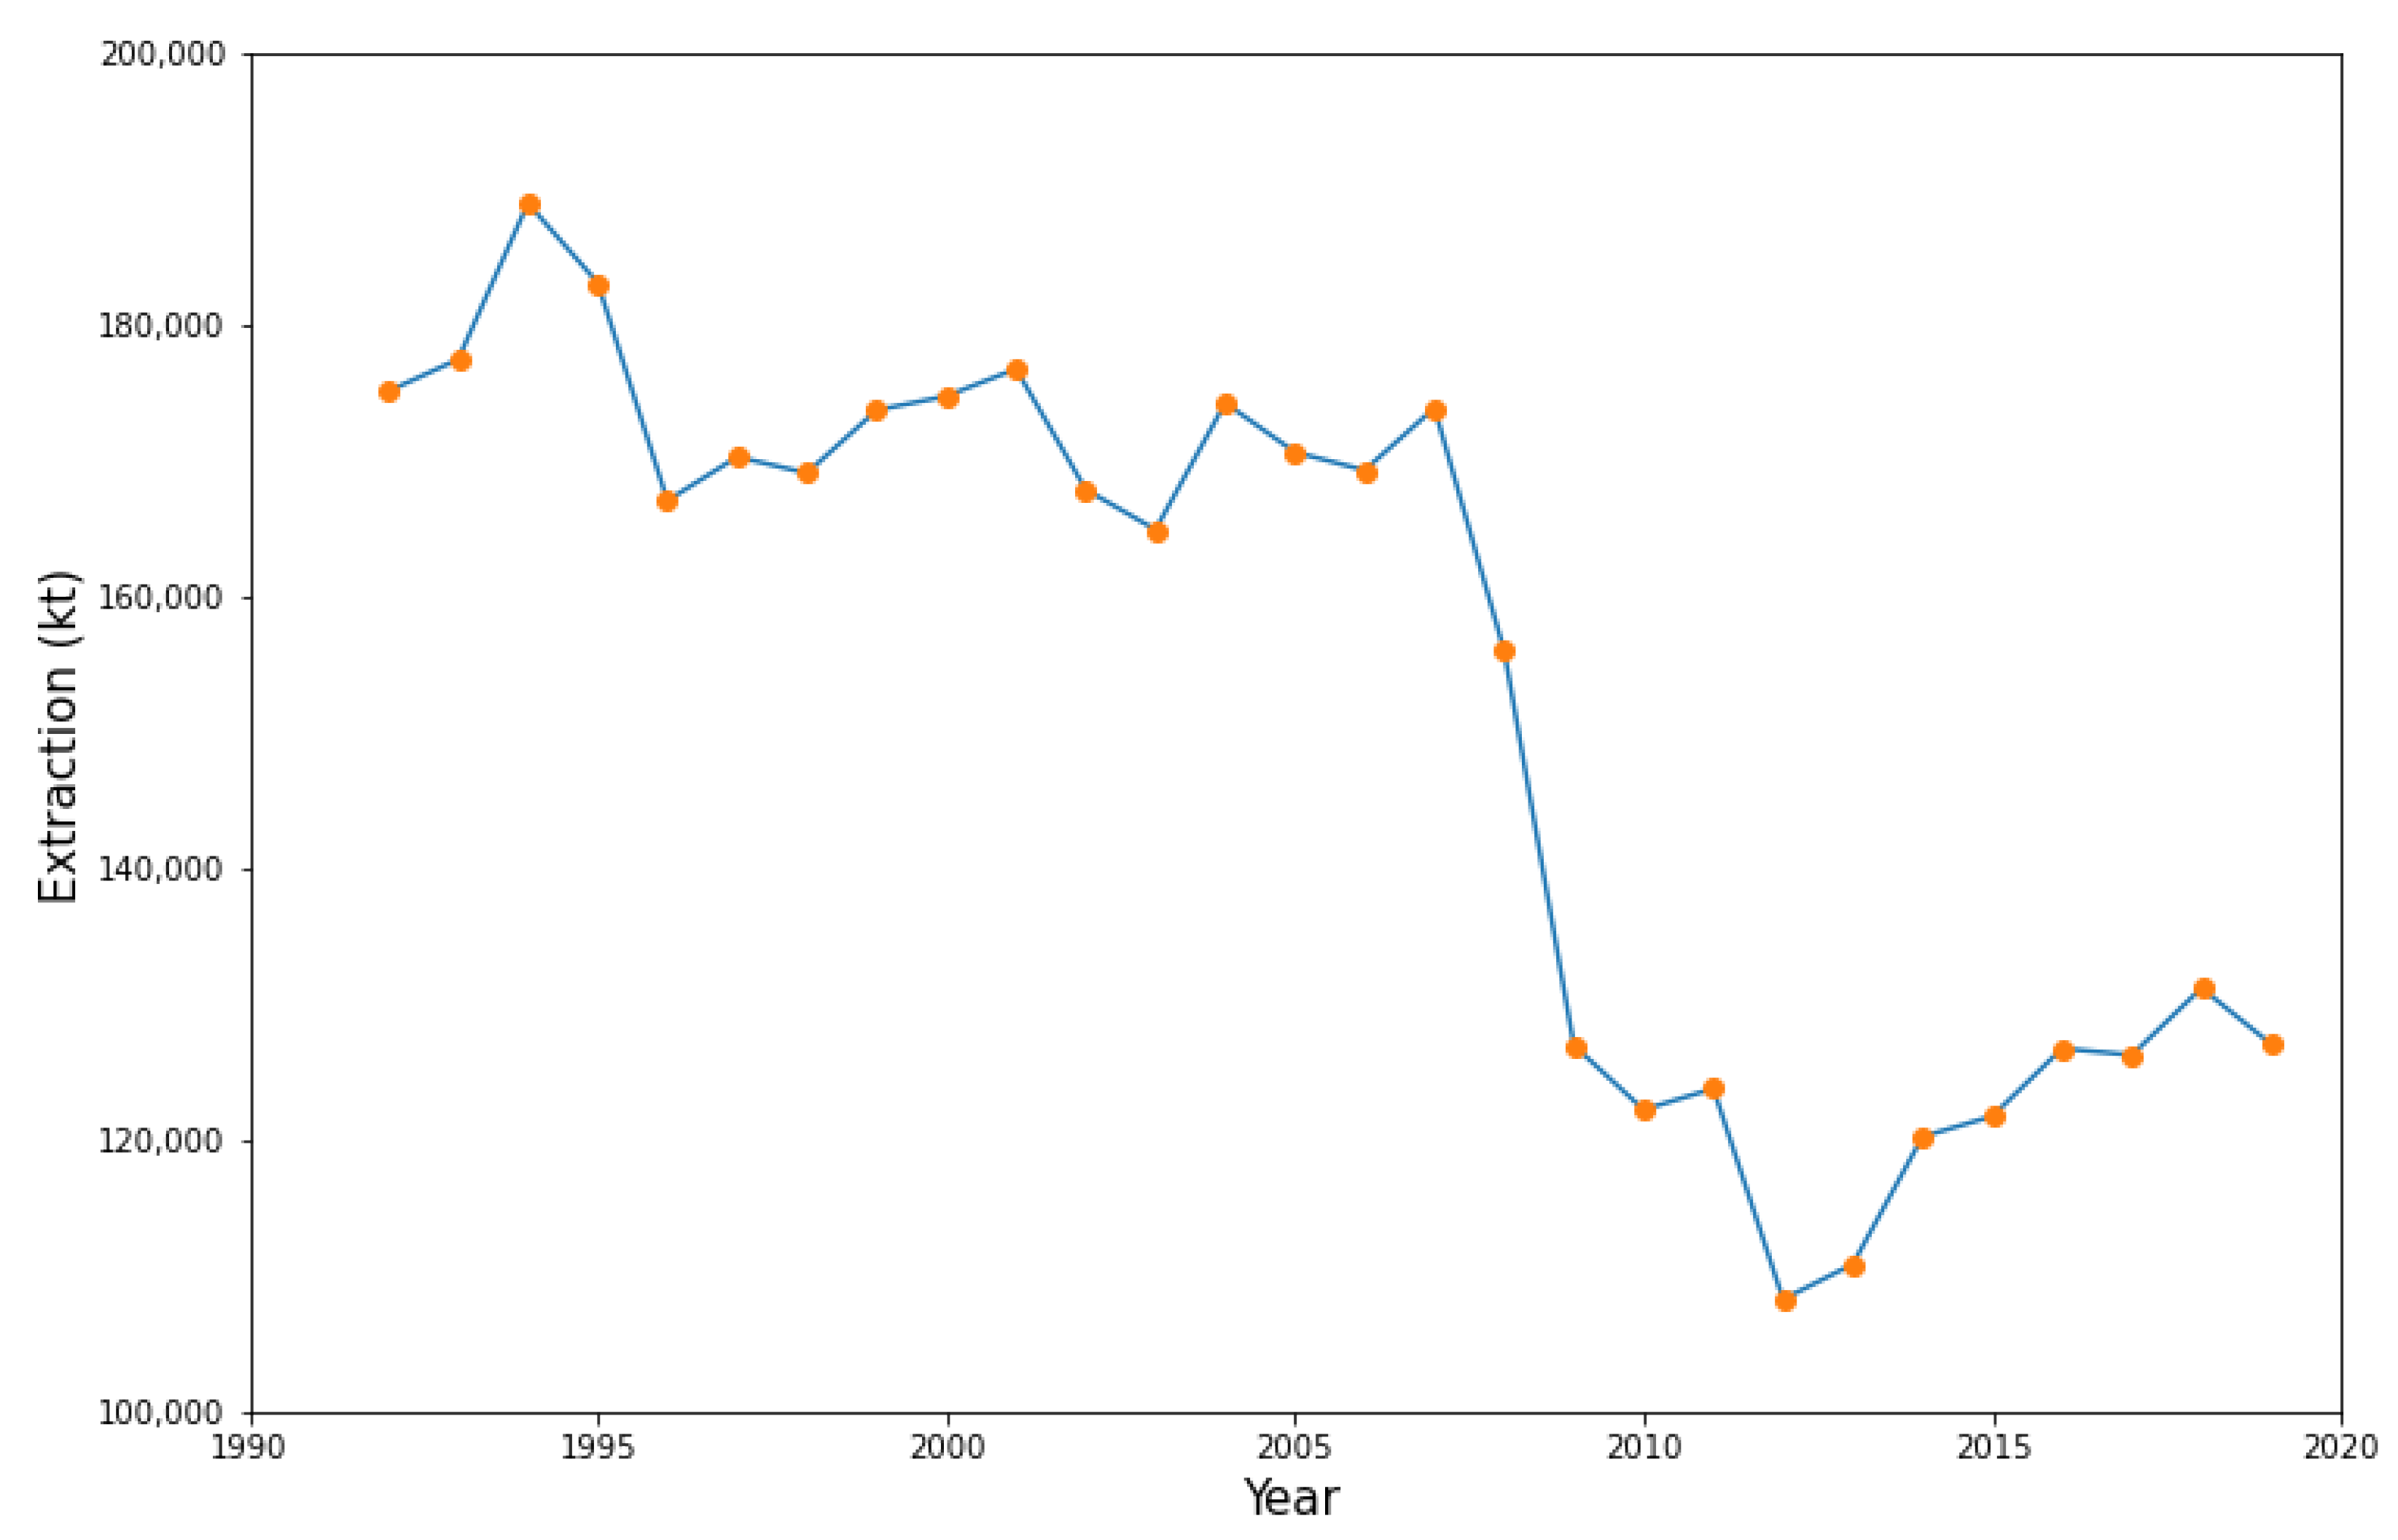
4.2. UK Extraction
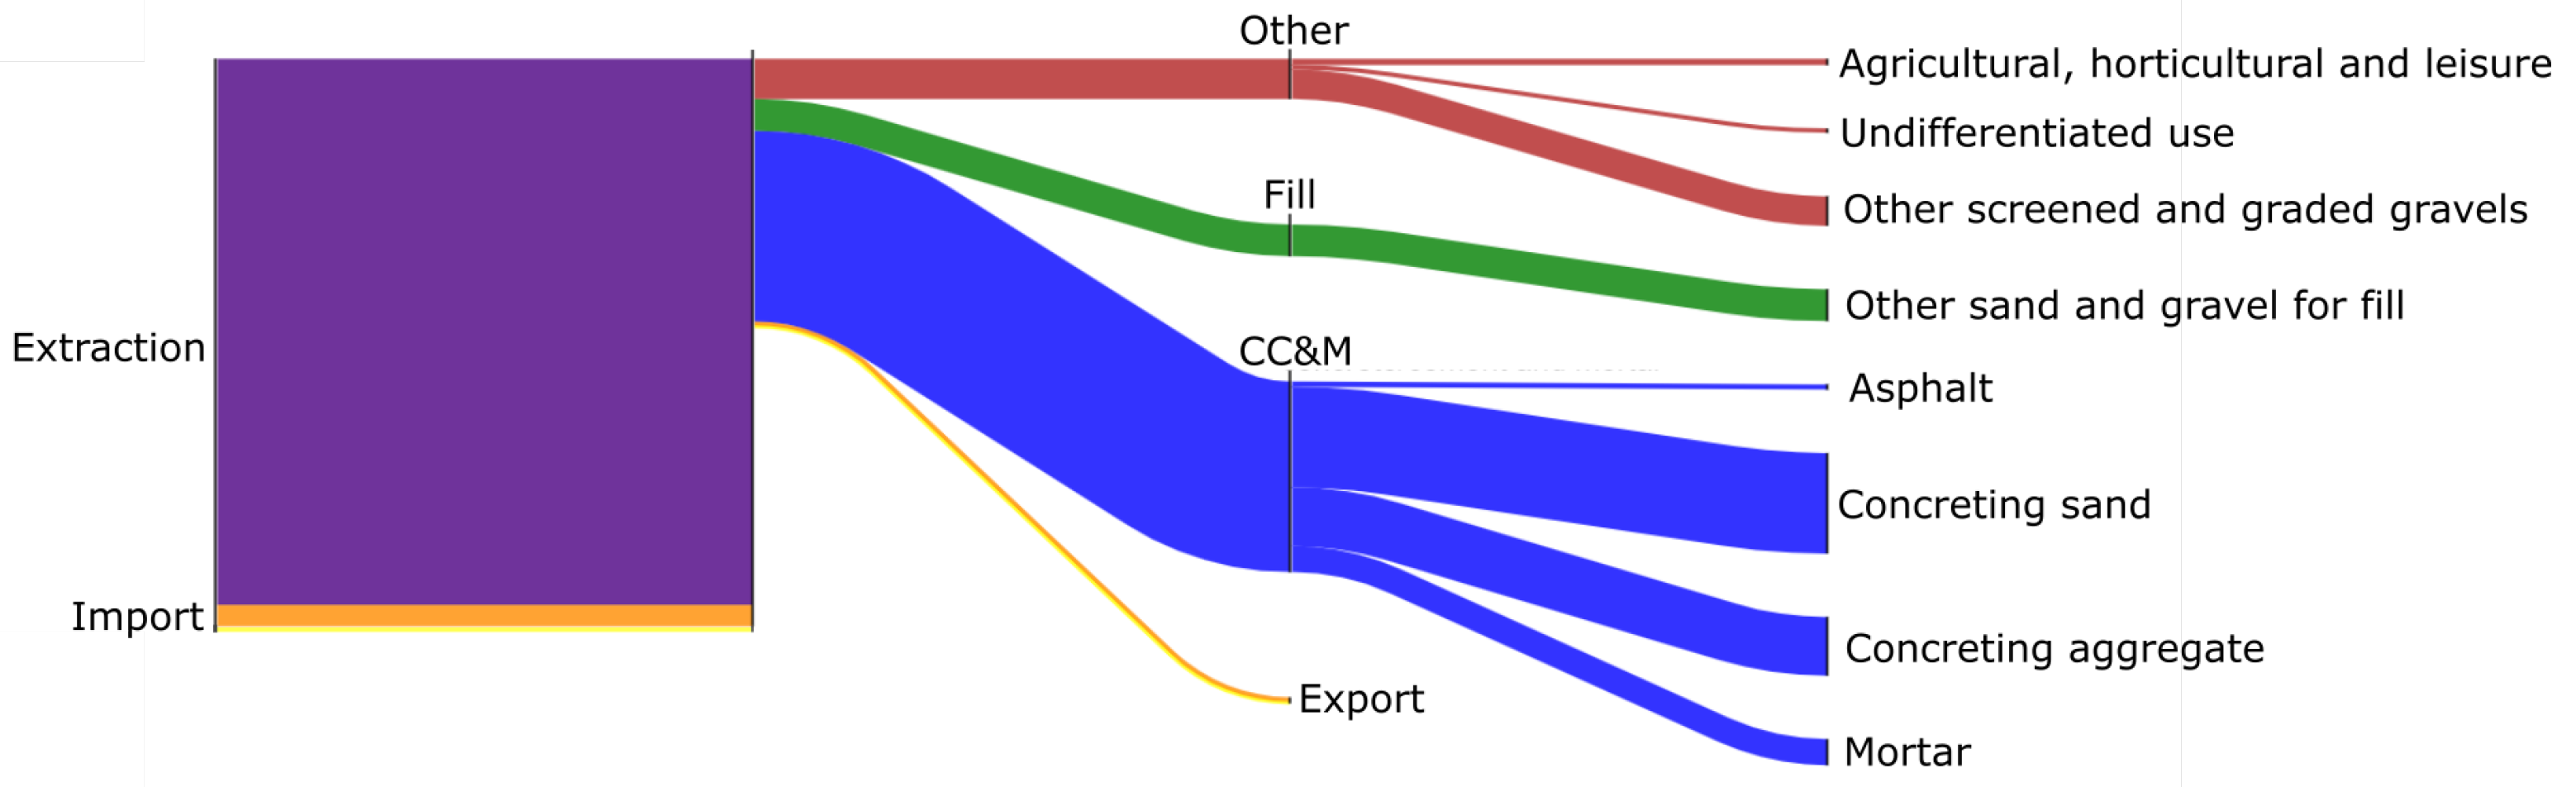
4.3. Input-Output Analysis for 2014 UK Data
4.4. UK Trade
5. Discussion
5.1. Consequences for the UK
5.2. Data Availability and Collection
5.3. Future Opportunities
6. Conclusions
Supplementary Materials
Author Contributions
Funding
Institutional Review Board Statement
Informed Consent Statement
Data Availability Statement
Acknowledgments
Conflicts of Interest
References
- United Nations Environment Programme. Sand and Sustainability: Finding New Solutions for Environmental Governance of Global Sand Resources; Technical Report; United Nations Environment Programme: Nairobi, Kenya, 2019. [Google Scholar]
- Miatto, A.; Schandl, H.; Fishman, T.; Tanikawa, H. Global Patterns and Trends for Non-Metallic Minerals used for Construction. J. Ind. Ecol. 2017, 21, 924–937. [Google Scholar] [CrossRef]
- Ioannidou, D.; Sonnemann, G.; Suh, S. Do we have enough natural sand for low-carbon infrastructure? J. Ind. Ecol. 2020, 24, 1004–1015. [Google Scholar] [CrossRef]
- International Organization for Standardization. Geotechnical Investigation and Testing-Identification and Classification of Soil-Part 1: Identification and Description; Technical Report; International Organization for Standardization: Geneva, Switzerland, 2017. [Google Scholar]
- Gavriletea, M. Environmental impacts of sand exploitation. Analysis of sand market. Sustainability 2017, 9, 1118. [Google Scholar] [CrossRef] [Green Version]
- Torres, A.; Simoni, M.U.; Keiding, J.K.; Müller, D.B.; zu Ermgassen, S.O.; Liu, J.; Jaeger, J.A.; Winter, M.; Lambin, E.F. Sustainability of the global sand system in the Anthropocene. One Earth 2021, 4, 639–650. [Google Scholar] [CrossRef]
- John, R. Sand geographies: Disentangling the material foundations of the built environment. Geogr. Compass 2021, 15, e12560. [Google Scholar] [CrossRef]
- Giljum, S.; Dittrich, M.; Lieber, M.; Lutter, S. Global patterns of material flows and their socio-economic and environmental implications: A MFA study on all Countries world-wide from 1980 to 2009. Resources 2014, 3, 319–339. [Google Scholar] [CrossRef]
- Hámor, T.; Kovács, G. Riverbed aggregates dredging. Eur. Geol. 2018, 45, 15–16. [Google Scholar]
- de Leeuw, J.; Shankman, D.; Wu, G.; de Boer, W.F.; Burnham, J.; He, Q.; Yesou, H.; Xiao, J. Strategic assessment of the magnitude and impacts of sand mining in Poyang Lake, China. Reg. Environ. Chang. 2010, 10, 95–102. [Google Scholar] [CrossRef]
- Schandl, H.; Fischer-Kowalski, M.; West, J.; Giljum, S.; Dittrich, M.; Eisenmenger, N.; Geschke, A.; Lieber, M.; Wieland, H.; Schaffartzik, A.; et al. Global material flows and resource productivity forty years of evidence. J. Ind. Ecol. 2018, 22, 827–838. [Google Scholar] [CrossRef]
- Filho, W.L.; Hunt, J.; Lingos, A.; Platje, J.; Vieira, L.W.; Will, M.; Gavriletea, M.D. The unsustainable use of sand: Reporting on a global problem. Sustainability 2021, 13, 3356. [Google Scholar] [CrossRef]
- Ren, Z.; Jiang, M.; Chen, D.; Yu, Y.; Li, F.; Xu, M.; Bringezu, S.; Zhu, B. Stocks and flows of sand, gravel, and crushed stone in China (1978–2018): Evidence of the peaking and structural transformation of supply and demand. Resour. Conserv. Recycl. 2022, 180, 106173. [Google Scholar] [CrossRef]
- Bisht, A. Conceptualizing sand extractivism: Deconstructing an emerging resource frontier. Extr. Ind. Soc. 2021, 8, 100904. [Google Scholar] [CrossRef]
- Boubault, A.; Maïzi, N. Devising mineral resource supply pathways to a low-carbon electricity generation by 2100. Resources 2019, 8, 33. [Google Scholar] [CrossRef] [Green Version]
- Zhang, G.; Song, J.; Yang, J.; Liu, X. Performance of mortar and concrete made with a fine aggregate of desert sand. Build. Environ. 2006, 41, 1478–1481. [Google Scholar] [CrossRef]
- Zaitri, R.; Bederina, M.; Bouziani, T.; Makhloufi, Z.; Hadjoudja, M. Development of high performances concrete based on the addition of grinded dune sand and limestone rock using the mixture design modelling approach. Constr. Build. Mater. 2014, 60, 8–16. [Google Scholar] [CrossRef]
- Neumann, F.; Curbach, M. Thermal treatment of desert sand to produce construction material. MATEC Web Conf. 2018, 149, 01030. [Google Scholar] [CrossRef]
- Hackney, C.R.; Vasilopoulos, G.; Heng, S.; Darbari, V.; Walker, S.; Parsons, D.R. Sand mining far outpaces natural supply in a large alluvial river. Earth Surf. Dyn. Discuss. 2021, 9, 1323–1334. [Google Scholar] [CrossRef]
- Kumar Verma, A.; Tonnizam, E.; Ramesh, M.; Bhatawdekar, M.; Krishen, A.; Manoj Khandelwal, R.; Armaghani, D.; Kripamoy, S. Proceedings of Geotechnical Challenges in Mining, Tunneling and Underground Infrastructures: ICGMTU, 20 December 2021. In Lecture Notes in Civil Engineering, 228th ed.; Springer: Berlin, Germany, 2022; Volume 228, pp. 537–550. [Google Scholar]
- Balogun, A.O.; Smith, T.D. Musculoskeletal symptoms among stone, sand and gravel mine workers and associations with sociodemographic and job-related factors. Int. J. Environ. Res. Public Health 2020, 17, 3512. [Google Scholar] [CrossRef] [PubMed]
- Adeyemi, H.O.; David, A.O.; Akinyemi, O.O.; Opafola, O.T.; Babalola, A.A. Sand shovelling and related injuries among sand mine workers in Nigeria. Sci. Afr. 2020, 8, e00313. [Google Scholar] [CrossRef]
- Rochayati, N.; Mahsup; Ibrahim; Herianto, A.; Johari, H.I. Community understanding and attitude levels on the implementation of illegal sand mining on the Induk Beach, West Lombok. IOP Conf. Ser. Earth Environ. Sci. 2020, 413, 012035. [Google Scholar] [CrossRef]
- Mahadevan, P. Sand Mafias in India: Disorganized Crime in a Growing Economy; Technical Report; Global Initiative against Transnational Organized Crime: Geneva, Switzerland, 2019. [Google Scholar]
- Rege, A. Not biting the dust: Using a tripartite model of organized crime to examine India’s Sand Mafia. Int. J. Comp. Appl. Crim. Justice 2016, 40, 101–121. [Google Scholar] [CrossRef]
- Koehnken, L.; Rintoul, M.S.; Goichot, M.; Tickner, D.; Loftus, A.C.; Acreman, M.C. Impacts of riverine sand mining on freshwater ecosystems: A review of the scientific evidence and guidance for future research. River Res. Appl. 2020, 36, 362–370. [Google Scholar] [CrossRef]
- Zou, W.; Tolonen, K.T.; Zhu, G.; Qin, B.; Zhang, Y.; Cao, Z.; Kai, P.; Cai, Y.; Gong, Z. Catastrophic effects of sand mining on macroinvertebrates in a large shallow lake with implications for management. Sci. Total. Environ. 2019, 695, 133706. [Google Scholar] [CrossRef] [PubMed]
- Qin, Y.; Chen, Z.; Ding, B.; Li, Z. Impact of sand mining on the carbon sequestration and nitrogen removal ability of soil in the riparian area of Lijiang River, China. Environ. Pollut. 2020, 261, 114220. [Google Scholar] [CrossRef] [PubMed]
- United Nations Environment Programme. Sand, rarer than one thinks. Environ. Dev. 2014, 11, 208–218. [Google Scholar] [CrossRef]
- Mineral Product Association. The Contribution of Recycled and Secondary Materials to Total Aggregates Supply in Great Britain in 2018; Technical Report; Mineral Products Association: London, UK, 2020. [Google Scholar]
- Binici, H.; Shah, T.; Aksogan, O.; Kaplan, H. Durability of concrete made with granite and marble as recycle aggregates. J. Mater. Process. Technol. 2008, 208, 299–308. [Google Scholar] [CrossRef]
- Nassar, R.U.D. Characteristics of Recycled Aggregate Concrete Produced with Crushed Stone Sand as Fine Aggregate. Civ. Eng. Archit. 2020, 8, 632–640. [Google Scholar] [CrossRef]
- Mineral Products Association. From Waste to Resource a UK Mineral Products Industry Success Story; Technical Report; Mineral Products Association: London, UK, 2019. [Google Scholar]
- Sverdrup, H.U.; Koca, D.; Schlyter, P. A Simple System Dynamics Model for the Global Production Rate of Sand, Gravel, Crushed Rock and Stone, Market Prices and Long-Term Supply Embedded into the WORLD6 Model. Biophys. Econ. Resour. Qual. 2017, 2, 8. [Google Scholar] [CrossRef] [Green Version]
- Stahel, W.R. Circular economy. Nature 2016, 531, 435–438. [Google Scholar] [CrossRef] [Green Version]
- Haupt, M.; Hellweg, S. Measuring the environmental sustainability of a circular economy. Environ. Sustain. Indic. 2019, 1–2, 100005. [Google Scholar] [CrossRef]
- Wang, H.; Schandl, H.; Wang, X.; Ma, F.; Yue, Q.; Wang, G.; Wang, Y.; Wei, Y.; Zhang, Z.; Zheng, R. Measuring progress of China’s circular economy. Resour. Conserv. Recycl. 2020, 163, 105070. [Google Scholar] [CrossRef]
- World Economic Forum. Shaping the Future of Construction A Breakthrough in Mindset and Technology; Technical Report; World Economic Forum: Cologny, Switzerland, 2016. [Google Scholar]
- United Nations Industrial Development Organisation (UNIDO). Circular Economy; Technical Report; United Nations Industrial Development Organisation: Vienna, Austria, 2021. [Google Scholar]
- European Commission. A new Circular Economy Action Plan For a Cleaner and More Competitive Europe; Technical Report; European Commission: Brussels, Belgium, 2020.
- Høibye, L.; Sand, H. Circular Economy in the Nordic Construction Sector; Technical Report; Nordic Council of Ministers: Copenhagen, Denmark, 2018. [Google Scholar] [CrossRef]
- Chaussard, E.; Kerosky, S. Characterization of black sand mining activities and their environmental impacts in the philippines using remote sensing. Remote Sens. 2016, 8, 100. [Google Scholar] [CrossRef] [Green Version]
- Schwartz, F.W.; Lee, S.; Darrah, T.H. A Review of the Scope of Artisanal and Small-Scale Mining Worldwide, Poverty, and the Associated Health Impacts. GeoHealth 2021, 5, e2020GH000325. [Google Scholar] [CrossRef] [PubMed]
- Schiappacasse, P.; Müller, B.; Linh, L.T. Towards responsible aggregate mining in Vietnam. Resources 2019, 8, 138. [Google Scholar] [CrossRef] [Green Version]
- UK Government. Environmental Taxes, Reliefs and Schemes for Businesses. 2018. Available online: https://www.gov.uk/green-taxes-and-reliefs/aggregates-levy (accessed on 27 July 2021).
- Myers, R.J.; Fishman, T.; Reck, B.K.; Graedel, T.E. Unified Materials Information System (UMIS): An Integrated Material Stocks and Flows Data Structure. J. Ind. Ecol. 2019, 23, 222–240. [Google Scholar] [CrossRef] [Green Version]
- Myers, R.J.; Reck, B.K.; Graedel, T.E. YSTAFDB, a unified database of material stocks and flows for sustainability science. Sci. Data 2019, 6, 84. [Google Scholar] [CrossRef] [Green Version]
- National Minerals Information Center. Construction Sand and Gravel Data Sheet; Technical Report; National Minerals Information Center: Reston, VA, USA, 2020.
- The Crown Estate. Marine Aggregates The Crown Estate Liscences Summary of Statistics. 2019. Available online: https://www.thecrownestate.co.uk/en-gb/what-we-do/on-the-seabed/minerals-dredging/ (accessed on 6 June 2020).
- Chatham House. Resourcetrade.Earth. 2018. Available online: http://resourcetrade.earth/ (accessed on 6 June 2020).
- European Commission. Eurostat International Trade Data Set. 2020. Available online: https://ec.europa.eu/eurostat/web/euro-indicators/international-trade (accessed on 6 June 2020).
- Office for National Statistics. Mineral Surveys. 2015. Available online: https://www.gov.uk/government/collections/minerals (accessed on 6 June 2020).
- Mangold, J.; Cristobal, K.; Mars, C.; Dornfeld, D. Assessment framework and material flow analysis of material recovery facilities within the U.S. To track consumer electronics by product category. In Proceedings of the Procedia CIRP, Ischia, Italy, 24–26 June 2015; Elsevier: Amsterdam, The Netherlands, 2015; Volume 29, pp. 556–561. [Google Scholar] [CrossRef]
- Müller, E.; Hilty, L.M.; Widmer, R.; Schluep, M.; Faulstich, M. Modeling metal stocks and flows: A review of dynamic material flow analysis methods. Environ. Sci. Technol. 2014, 48, 2102–2113. [Google Scholar] [CrossRef]
- Government Statistical Service. UK Statistics on Waste; Technical Report; Department for Envrionment, Food & Rural Affairs: London, UK, 2020.
- Industrial Minerals Association. Recycling Industrial Minerals; Technical Report; Industrial Minerals Association: Washington, DC, USA, 2018. [Google Scholar]
- European Aggregate Association. Estimates of Production Data. 2017. Available online: https://uepg.eu/pages/figures (accessed on 27 July 2021).
- Knapman, D. Construction, Demolition and Excavation Waste Arisings, Use and Disposal for England 2008; Technical Report; Waste abd Resources Action Programme: Banbury, UK, 2010. [Google Scholar]
- Temple-ERM. High Speed Rail: Consultation on the Route from the West Midlands to Manchester, Leeds and beyond Sustainability Statement Appendix E11-Material Use A Report by Temple-ERM for HS2 Ltd; Technical Report; Temple-ERM: Philadelphia, PA, USA, 2013. [Google Scholar]
- Bide, T.; Balson, P.; Joseph Mankelow, B.A.; Selby, I. A New Sand and Gravel Map for the UK Continental Shelf to Support Sustainable Planning. Resour. Policy 2016, 48, 1–12. [Google Scholar] [CrossRef]
- British Marine Aggregate Producers Association. Key Facts. 2010. Available online: https://bmapa.org/about/key_facts.php (accessed on 6 December 2020).
- Magnusson, S.; Lundberg, K.; Svedberg, B.; Knutsson, S. Sustainable management of excavated soil and rock in urban areas—A literature review. J. Clean. Prod. 2015, 93, 18–25. [Google Scholar] [CrossRef] [Green Version]
- Bendixen, M.; Iversen, L.L.; Best, J.; Franks, D.M.; Hackney, C.R.; Latrubesse, E.M.; Tusting, L.S. Sand, gravel, and UN Sustainable Development Goals: Conflicts, synergies, and pathways forward. One Earth 2021, 4, 1095–1111. [Google Scholar] [CrossRef]
- Mineral Products Association. Sand Supply—A UK Perspective on a Global Issue; Technical Report; Mineral Products Association: London, UK, 2019. [Google Scholar]
- Lupton, R.C.; Allwood, J.M. Hybrid Sankey diagrams: Visual analysis of multidimensional data for understanding resource use. Resour. Conserv. Recycl. 2017, 124, 141–151. [Google Scholar] [CrossRef]
- Mineral Products Association. Profile of the UK Mineral Products Industry; Technical Report; Mineral Products Association: London, UK, 2021. [Google Scholar]
- Symes-Thompson, A. Building Materials and Components Statistics: February 2022; Technical Report; Department for Business, Energy & Industrial Strategy: London, UK, 2022.
- Lupton, R.C.; Allwood, J.M. Incremental Material Flow Analysis with Bayesian Inference. J. Ind. Ecol. 2018, 22, 1352–1364. [Google Scholar] [CrossRef] [Green Version]
- Global Witness. Shifting Sands: How Singapore’s Demand for Cambodian Sand Threatens Ecosystems and Undermines Good Governance; Technical Report; Global Witness: London, UK, 2010. [Google Scholar]


Publisher’s Note: MDPI stays neutral with regard to jurisdictional claims in published maps and institutional affiliations. |
© 2022 by the authors. Licensee MDPI, Basel, Switzerland. This article is an open access article distributed under the terms and conditions of the Creative Commons Attribution (CC BY) license (https://creativecommons.org/licenses/by/4.0/).
Share and Cite
Morley, J.D.; Myers, R.J.; Plancherel, Y.; Brito-Parada, P.R. A Database for the Stocks and Flows of Sand and Gravel. Resources 2022, 11, 72. https://doi.org/10.3390/resources11080072
Morley JD, Myers RJ, Plancherel Y, Brito-Parada PR. A Database for the Stocks and Flows of Sand and Gravel. Resources. 2022; 11(8):72. https://doi.org/10.3390/resources11080072
Chicago/Turabian StyleMorley, John D., Rupert J. Myers, Yves Plancherel, and Pablo R. Brito-Parada. 2022. "A Database for the Stocks and Flows of Sand and Gravel" Resources 11, no. 8: 72. https://doi.org/10.3390/resources11080072
APA StyleMorley, J. D., Myers, R. J., Plancherel, Y., & Brito-Parada, P. R. (2022). A Database for the Stocks and Flows of Sand and Gravel. Resources, 11(8), 72. https://doi.org/10.3390/resources11080072